An Analysis of Pell Grant Data
Earlier this year, the National Center for Education Statistics’ Integrated Postsecondary Education Data System (IPEDS) updated its Data Center to include financial aid data for the 2013-14 academic year. Interested in how the percentage of undergraduate students who received Pell grants changed (or did not), I compared the 2013-14 data with that of previous years (2007-08 through 2012-13).
The institutions included in the analysis are located in the United States and fall into one of nine sectors based on 2014 institutional characteristics: public, four-year or above; private not-for-profit, four-year or above; private for-profit, four-year or above; public, two-year; private, not-for-profit, two-year; private for-profit, two-year; public, less-than two-year; private not-for-profit, less-than two-year; and private for-profit, less-than two-year. The number of institutions represented is 7,434, although not all institutions have data for each year.
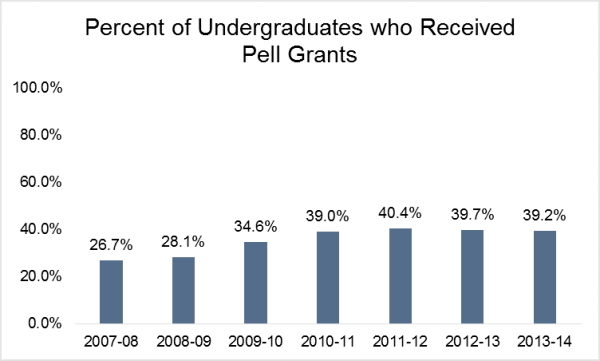
The Great Recession had a dramatic effect on the percentage of undergraduates who received Pell grants. In 2007-08, on the verge of the recession, 26.7 percent of undergraduates received Pell grants. By 2010-11, the share of undergraduates receiving Pell grants ballooned to 39 percent and the share reached a peak in 2011-12, at 40.4 percent. The share of students receiving Pell grants has declined incrementally since 2011-12, reaching 39.2 percent in the new data for 2013-14.
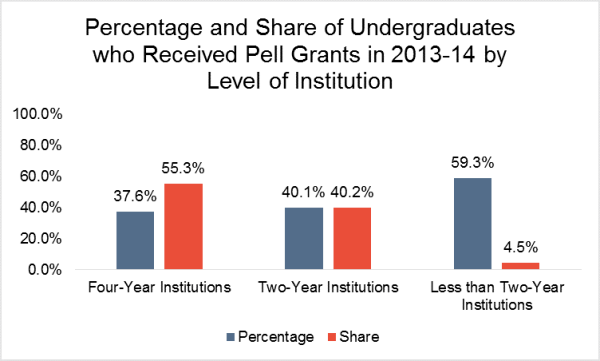
Looking at differences across the level of institution, the percent of undergraduates receiving Pell grants is lowest at four-year institutions (at 37.6 percent) and highest at less than two-year institutions (at 59.3 percent), with two-year institutions in the middle (at 40.1 percent). Despite the fact that a higher percentage of their students receive Pell grants, two-year and less than two-year institutions serve a lower share of all Pell students than four-year institutions do. Four-year institutions serve 55.3 percent of all Pell students while two-year institutions serve 40.2 percent and less than two-year institutions serve 4.5 percent.
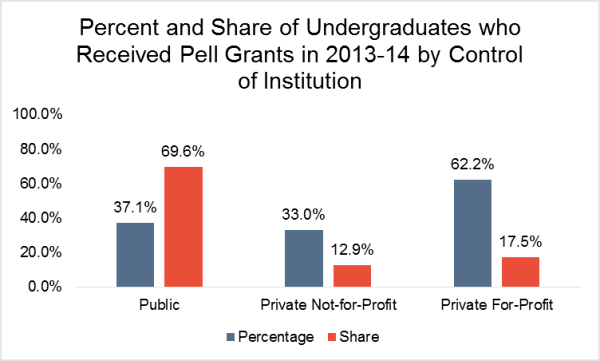
While only 17.5 percent of all undergraduate students who received Pell grants in 2013-14 were enrolled at for-profit institutions, the percent of students at for-profit institutions who receive Pell grants (62.2 percent) continues to exceed the share at public institutions (37.1 percent) or private not-for-profit institutions (33.0 percent).
For years, researchers and advocates have raised alarms about students at for-profit institutions relying on Pell grants, and not getting adequate value for their investments. The federal Department of Education has taken increasingly aggressive steps to crack down on such low-value uses of Pell grants. One key initiative was the promulgation of June 2011 regulations requiring career-focused programs to demonstrate that they prepare students for “gainful employment” or lose eligibility for federal student aid. (The gainful employment regulations are not specific to for-profit colleges, but, according to the Department, for-profit programs “are most likely to leave their students with unaffordable debts and poor employment prospects.”) State and local governments have made similar efforts to more tightly regulate or provide more transparency about for-profit institutions.
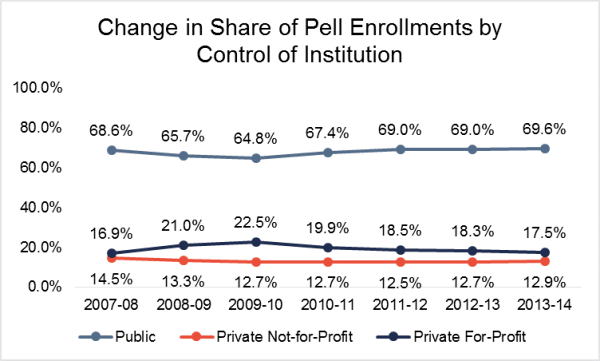
Although it is far from conclusive evidence of their effect, the fact that the share of Pell enrollments at for-profit institutions has declined by 22 percent since the 2009-10 peak—while the share of Pell recipients enrolled at private not-for-profit and public institutions have increased—is certainly consistent with those efforts having an impact.
Identifying these trends is critically important. There are, however, some limitations to IPEDS’ financial aid data that make such analysis more difficult. These Pell numbers are self-reported by institutions, which may use slightly different methodologies from one another. For instance, some schools include students studying abroad in their undergraduate numbers while others do not. The National Center for Education Statistics is slowly moving to standardize the self-reporting requirements, which is good. But the sooner researchers and policy-makers can benefit from consistent and reliable data, the better.
Pingbacks
Editor’s Choice TEST: An Analysis of Pell Grant Data
Comments
A Hechinger Report analysis of Pell grant graduation rate data from a cross section of colleges and universities — which is not otherwise publicly reported anywhere — suggests that billions of dollars in taxpayer-funded Pell grants nationwide go to students who never earn degrees.