Using Lessons Learned from University Partnerships to Enhance the US Faculty Survey 2015
Since 2000, Ithaka S+R has run the US Faculty Survey, which tracks the evolution of faculty members’ research and teaching practices against the backdrop of increasing digital resources and other systemic changes in higher education on a triennial basis. Last week we published results from the 2015 cycle on topics including discovery and access, research and publishing practices, instruction, and the role of the library.
Starting in 2012, Ithaka S+R has offered colleges and universities the opportunity to field the faculty survey, and a newly added student survey, at their individual institutions to gain better insight into the perceptions of their faculty members and students. Ithaka S+R and the national faculty survey have benefited tremendously from having fielded nearly 100 localized versions of the surveys thus far.
First and foremost, our expertise in higher education survey administration has been substantially enhanced by our experiences with local survey participants. We have developed detailed guidelines on best practices for designing survey questionnaires, crafting effective invitation and reminder messages, determining when to send these messages and what incentives, if any, to offer, and ensuring that survey invitations and reminder messaging are received and opened. Applying more of these practices to the administration of the 2015 US Faculty Survey than ever before, we were able to nearly double the rate of response as compared to the previous cycle.
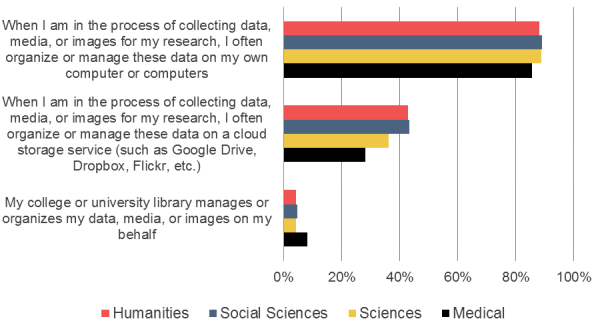
Based on feedback from our local survey participants, we also added a series of questions on attitudes and practices regarding data management and preservation to the 2015 cycle. This was an area of strategic importance for many of our participants and we now have a strong set of findings on these topics at a national level. Results from the 2015 cycle revealed that faculty members prefer to be self-reliant in their data management and preservation processes; they tend to favor tools that allow them to manage or preserve their data on their own as opposed to support from other entities within and outside of their college or university.
Please use the 10 to 1 scales below to indicate how well each statement below describes your point of view. Percent of respondents who strongly agreed with each statement.
We also invited medical faculty members to participate in the national survey for the first time. Some of our local participants have been surveying medical faculty at their institutions and wanted to be able to compare their findings to the national sample. In our first year of results, we have found that while these respondents sometimes have attitudes and practices that parallel their colleagues in the social sciences and physical sciences, they often are unique in the way that they discover and access information, conduct and disseminate research, teach, and use the library.
Finally, we were able to run the 2015 cycle of the national survey in parallel with nine localized versions of the survey, allowing for a hybrid model that was not possible with previous cycles. These nine institutions have been able to see how their responses directly compare to the national findings gathered during the same time period, and we have been able to enrich our national dataset by incorporating responses from these institutions.
The local surveys have opened us up to deeper collaboration with libraries, and the lessons learned over the past three years have helped us change and improve the national survey in meaningful ways.