College and University Endowments
In the Public Interest?
The fact that a handful of colleges and universities control billions of dollars in endowment funds has captured the attention of Congress and the public. Is it in the public interest for these institutions to continue to receive the full exemption from income taxation for the donations to and income from endowments?[1] The passage of the recent federal tax bill, the Tax Cuts and Jobs Act, which imposes an excise tax of 1.4 percent on the net investment income of about 30 colleges and universities with the largest endowments per student reflects concern about these endowments and their favorable tax treatment.[2] Understanding the implications of this and other potential policy changes for higher education requires understanding the role of endowments, how they are distributed across colleges and universities, and how they are used.
To that end, this report provides an overview of college and university endowments in an effort to inform the public policy debate. We look at how endowments are structured, how they are restricted, how institutions use them, and to what extent the favorable tax policy for higher education institutions is consistent with larger societal goals. We discuss the possible economic and public policy justifications for the new excise tax and whether the new tax accomplishes any of these objectives.
We conclude:
- Both private non-profit and public institutions of higher education have accumulated endowment assets, supported by federal tax policies.
- The distribution of these endowments is highly skewed across institutions. Median endowment per student for all postsecondary institutions is $12,600. For the wealthiest doctoral institutions enrolling 10 percent of the students in that sector, the median is $1.3 million per student.
- Many of these endowment assets are restricted to particular purposes. The available data do not make it possible to determine to what extent these restrictions in fact constrain the spending decisions of colleges and universities.
- The tax policies that benefit endowments and subsidize higher education, including the charitable deduction for contributions to higher education and the exemption of endowment earnings from income taxation, are blunt policy tools for affecting institutional behavior.
- Institutions with high endowments per student do use these resources to lower net prices for students, but not necessarily to enroll greater shares of students with financial need compared to other institutions.
- The recent changes in the tax law will take resources away from a small set of well-endowed private non-profit institutions. Rather than reallocating these resources to other segments of higher education or encouraging these institutions to change behavior to avoid the new tax, the revenue will be used to marginally reduce the overall federal government deficit.
Overview of endowments
What are endowments?
Colleges and universities, like many other private nonprofit and public entities, build and maintain endowments to supplement other revenues in supporting current expenditures and to ensure their long-run fiscal health. The vast majority of colleges and universities have minimal financial assets, but a few have accumulated large endowments that generate income that funds a significant share of annual expenses.
An endowment is a fund invested in a variety of types of financial assets. College and university endowment funds come primarily from donations to the school, but also from previous savings from surpluses, including income from unspent earnings on the endowment.[3] Endowment managers seek out profitable investments subject to risk considerations. Institutions adopt spending rules that determine how much of the endowment they can spend each year.
Endowments increase financial security, ensuring that institutions can successfully maintain their operations over the long run, protected from temporary declines in enrollment and revenues, from disruptions in financial markets, and from unanticipated major expenses. Endowments also allow institutions to spend more annually than would otherwise be the case, given tuition and other revenue sources. This allows colleges and universities to compete for talented faculty and staff as well as students—including talented students who have limited ability to pay.
There are two primary types of endowment funds: “true” or “permanent” endowments and “quasi-endowments.” True endowment funds are established to exist in perpetuity, and by law, the initial principal of these funds must be preserved. Quasi-endowment funds, established most often by the institution itself but sometimes by donors, act like a true endowment, but may be spent down within the guidelines provided by the donor or institution.[4] Aggregate endowments are composed of smaller endowment funds of these different types. In most cases, the assets of all these funds are pooled and invested together, with each individual fund “owning” a share of the larger endowment and a share of the return that the aggregate endowment earns.
Donors may specify how endowment funds are spent, restricting the ways that earnings can be used. For example, a donation may be earmarked for a specific faculty position or scholarship, or operating expenses of a building on campus. When the earnings on restricted endowments are made available for operations in any budget year, they can only be spent on the restricted purpose.[5]
In contrast, institutions can spend the income from unrestricted endowment funds as they see fit. Quasi-endowments can be restricted by trustee action, but future trustee action can lift the restrictions.
Institutions generally set policies regarding acceptance of gifts for both current spending and endowments and encourage and pursue gifts, restricted or otherwise, that align with campus priorities. Many gift agreements with restrictions have clauses that allow for other uses of the funds if circumstances prevent meeting the original restrictions. Ultimately, an institution may choose to decline a restricted gift if it does not align with its mission. Recently, the University of Southern California rejected a $5 million gift from Harvey Weinstein in the wake of sexual misconduct allegations. The funds would have created an endowment for women filmmakers.[6]
An institution can also go to court to seek approval to change the use of restricted endowments under the cy-pres doctrine when it believes it can no longer use the funds as required by the restrictions. At the same time, donors can challenge institutions they believe are not living up to their commitments to use endowments as agreed. In 2008, descendants of donors who had given an endowed gift specifically to educate graduate students for careers in government sued Princeton University. The plaintiffs argued that the funds, which currently support the majority of financing for graduate programs at Princeton’s Woodrow Wilson School of Public and International Affairs, were no longer being used for their intended purpose. The case was settled, with Princeton setting up a foundation specifically to support education for government service with a portion of the funds, freeing the remainder to be used for the Woodrow Wilson School more broadly. In 1995, Yale faced a similar situation, ultimately returning $20 million to a donor who contended that the university had never instituted the Western civilization courses stipulated in the gift.[7]
Are private, non-profit institutions fulfilling the public interest?
About three quarters of college and university endowment funds belong to private nonprofit institutions, while public colleges and universities hold about one quarter of total endowment assets.[8] Most public and private nonprofit higher education institutions are 501(c)(3) organizations that are exempt from taxes on income generated from their educational missions. Income from endowment assets, donated to both public and private non-profit colleges and universities to further their educational missions, has thus not been taxable. But the recently passed tax law modifies this practice for private institutions with endowments of $500,000 or more per student and at least 500 students.
Private non-profit colleges and universities serve essentially the same function as public institutions. Most subsidize the cost of education for their students, relying on endowment funds and other private donations to cover some of their costs. There are no owners of private nonprofit colleges and universities who benefit from any profits from either the donations or the tuition payments the institutions receive.[9] As Hansmann (1988) argues, this corporate form insures that public subsidies will not accrue in profits to owners, as might be the case with private for-profit firms.
Donations to private nonprofit and public colleges and universities are tax deductible, providing an incentive for donors. Changes in the new tax law, however, are expected to reduce these incentives, as fewer filers will itemize their deductions and the lower marginal tax rate will reduce the size of the benefit.
Although there is broad consensus that the benefits of an educated population extend beyond the individuals who participate, there is less agreement about how institutions—particularly selective institutions with ample resources—make their enrollment and financing decisions.
The justification for the tax exemptions depends on these institutions generating benefits for society. The excise tax on the net earnings of some institutions is purportedly based on skepticism about whether the funds are really furthering the social mission of these institutions. Although there is broad consensus that the benefits of an educated population extend beyond the individuals who participate, there is less agreement about how institutions—particularly selective institutions with ample resources—make their enrollment and financing decisions and whether their contributions to the public good justify the size of the public subsidy.
One criticism of the institutions with large endowments is that they serve primarily higher income students. The wealthiest institutions tend to be the most selective because their wealth, along with the resulting spending, allows them to compete for the most talented students, as well as those who can afford to pay for campus amenities. Differences in wealth across institutions tend to grow over time, as the wealthy institutions that enroll disproportionately affluent student bodies receive larger gifts from their alumni, increasing the rate at which their endowments grow Some observers argue that the tax status of these institutions should obligate them to serve a larger share of low- and moderate-income students.[10]
Disadvantaged students are under-represented at the institutions with the largest endowments at least partially because of the correlation between socioeconomic background and academic achievement. But there is evidence that lower-income students are underrepresented not just relative to their share in the population of college-aged students, but relative to those with the qualifications to be admitted to these selective schools. Many colleges also give preference in the admissions process to the children of alumni whose donations can exacerbate the inequality in wealth across institutions. Tax relief provides the largest subsidies to high-endowment institutions that enroll disproportionately low numbers of low-and moderate-income students.
The visibility of billion dollar plus endowments also raises questions about tuition. Why do institutions with such ample resources charge such high prices? If private doctoral universities have an average of $219,300 in endowment assets per student, potentially generating about $10,000 per student per year, shouldn’t they be able to set tuition at levels more similar to public institutions?[11] Why do schools with large endowments use them to increase spending or to save for the future rather than to hold down tuition?
Endowment Size
1,375 public and private nonprofit four-year institutions reported a total of $475 billion in endowment assets at the end of 2015-16—an average of $346 million per institution and about $52,000 per full-time equivalent student.[12] But most of these assets are held by a fraction of the higher education sector. Just twenty-three of these institutions held approximately 50 percent of the assets, while the other 1,352 institutions shared the other half. Nineteen of the 23 institutions are private research universities.[13] The endowments of these institutions ranged from $35.7 billion at Harvard and $25.4 billion at Yale to $2.4 billion at New York University.
The 23 wealthiest institutions account for only 6 percent of full-time equivalent postsecondary enrollments.[14] These 6 percent of students benefit from endowment assets averaging $458,000 per student. The remaining 94 percent of students benefit from endowment assets averaging $28,000 per student.
Endowment per student
The institutions with the largest total endowments are not necessarily the same as those with the highest levels of endowment per student. For example, at the end of 2015-16, Harvard’s endowment was about 1.6 times as large as Princeton’s, but Princeton had $2.7 million per FTE student, compared with Harvard’s $1.5 million, because Harvard had three times as many students.
Ranking institutions by endowment per student, 58 institutions hold approximately 50 percent of the endowment wealth. All are private nonprofit institutions and they include 38 baccalaureate colleges, enrolling almost exclusively undergraduate students.[15]
Endowment across sectors
Private doctoral universities, which enroll about 11 percent of students who attend public four-year or private not-for-profit four-year institutions, hold more than half of total endowment assets (table 1). Doctoral universities use their endowments to support research activities and graduate students in addition to undergraduate students.
Table 1: Endowment Assets of Public and Private Non-profit Colleges and Universities, End of FY2016, by Sector
| Share of dollars | Share of FTE enrollments | Average endowment assets per FTE student | Median endowment assets per FTE student | |
|---|---|---|---|---|
| Private Doctoral | 52% | 11% | $220,000 | $48,100 |
| Private Master’s | 5% | 12% | $21,000 | $15,500 |
| Private Baccalaureate | 13% | 6% | $105,300 | $42,400 |
| Other private nonprofit | 5% | 9% | $27,000 | $5,900 |
| Public four-year | 25% | 62% | $19,500 | $5,400 |
| Overall | 100% | 100% | $48,100 | $12,600 |
| Source: IPEDS, National Center for Education Statistics. Includes all public four-year and private not-for-profit four-year institutions. The “other private nonprofit” category includes special focus four-year institutions, which are excluded from the sector-based analyses later in this paper. | ||||
While endowments per student are lower at public four-year institutions, public institutions also receive public appropriations from their state governments, a source of revenue not available to most private, non-profit institutions.[16]
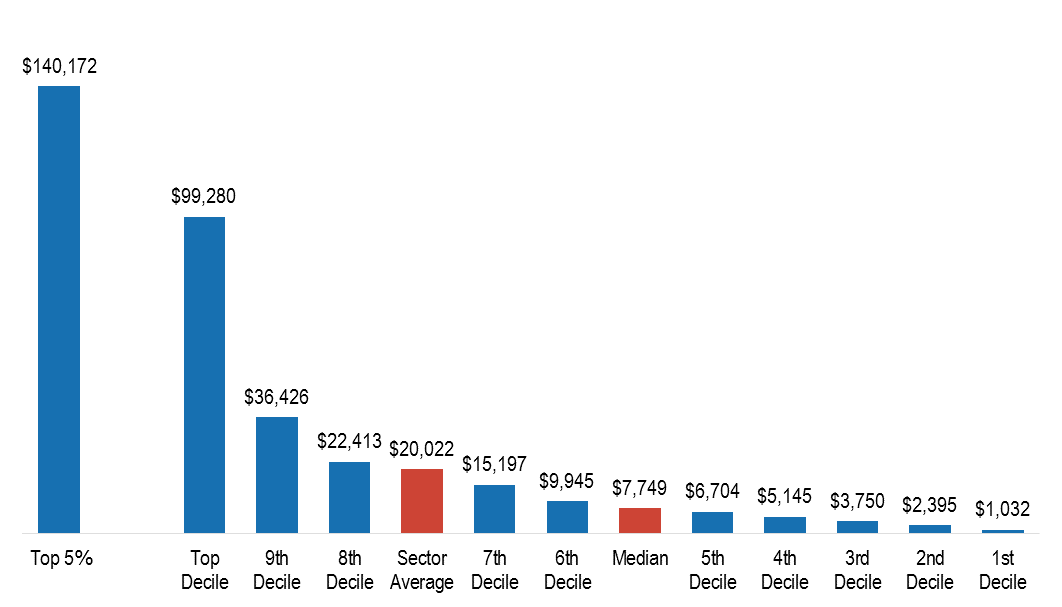
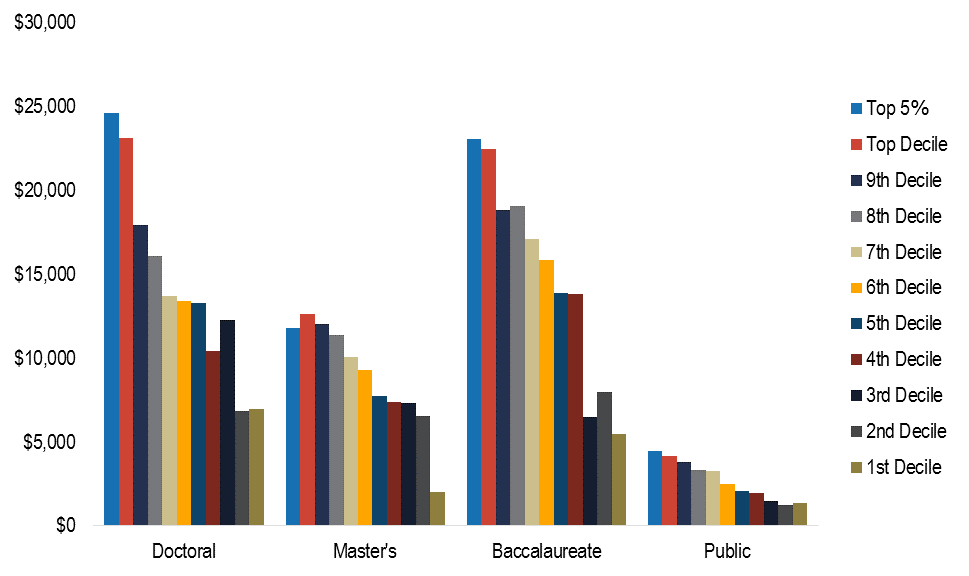
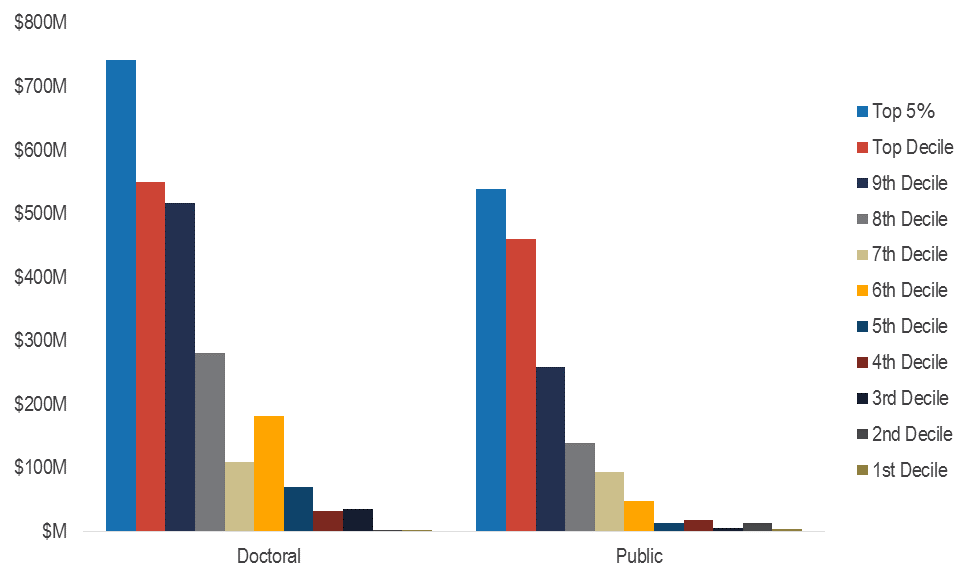
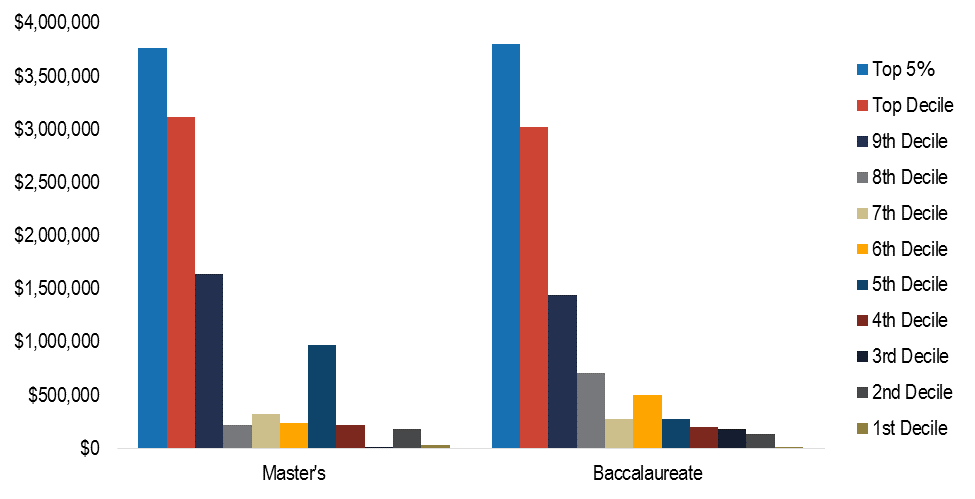
Within each sector and type of institution, endowment assets are highly concentrated among a small share of institutions. Figures 1a – 1d report the average endowment per FTE student, with students sorted into deciles based on the endowment per student at the institution they attend.[17] [18]
Figure 1a: Private Nonprofit Doctoral Institutions: Average Endowment per FTE Student by Deciles of Students, End of FY 2016
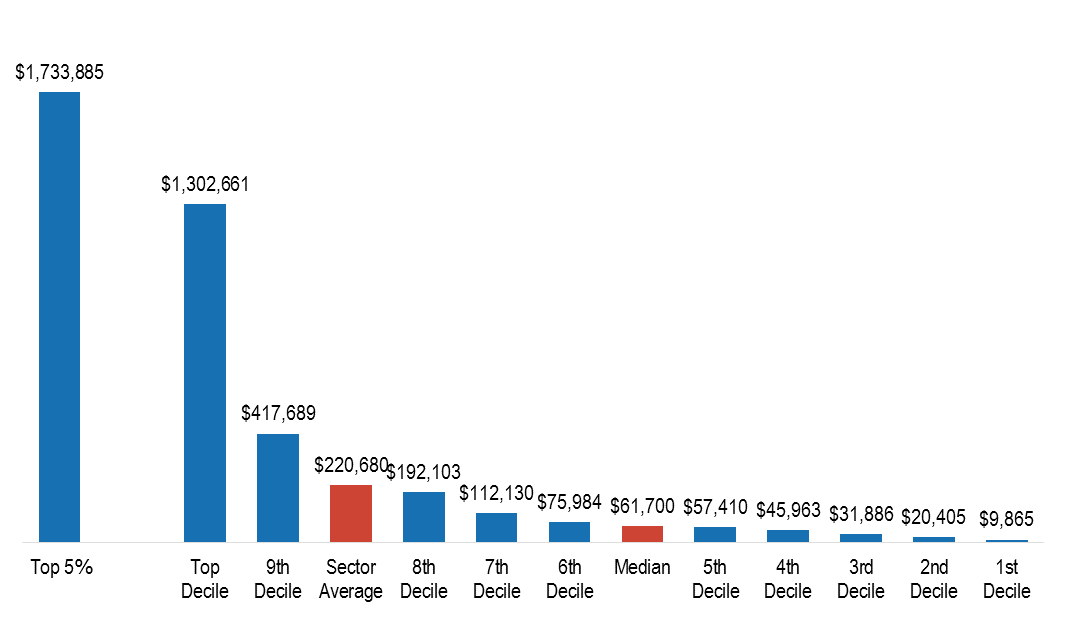
Figure 1b: Private Nonprofit Master’s Institutions: Average Endowment per FTE Student by Deciles of Students, End of FY 2016
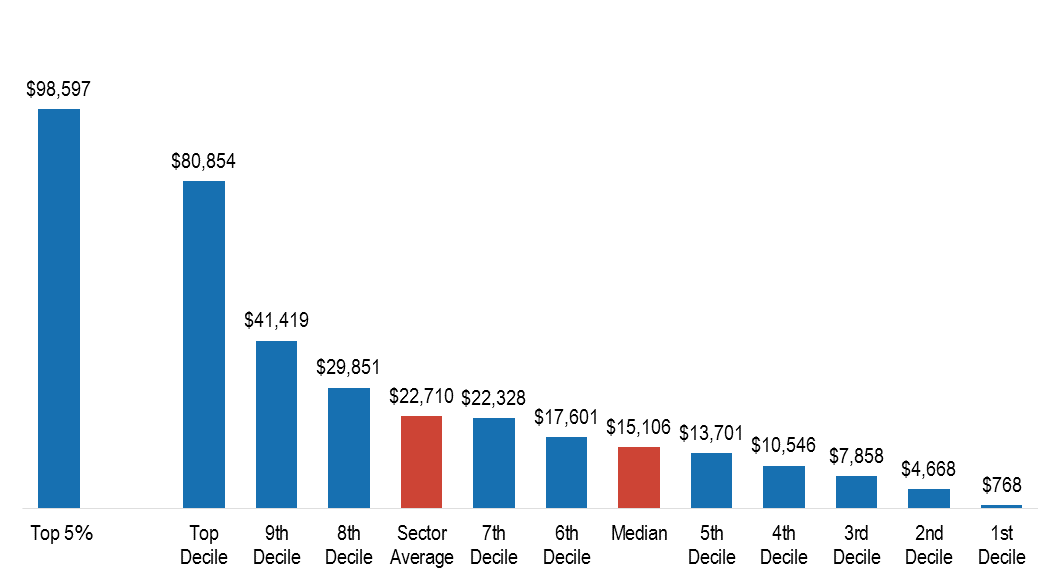
Figure 1c: Private Nonprofit Baccalaureate Institutions: Average Endowment per FTE Student by Deciles of Students, End of FY 2016
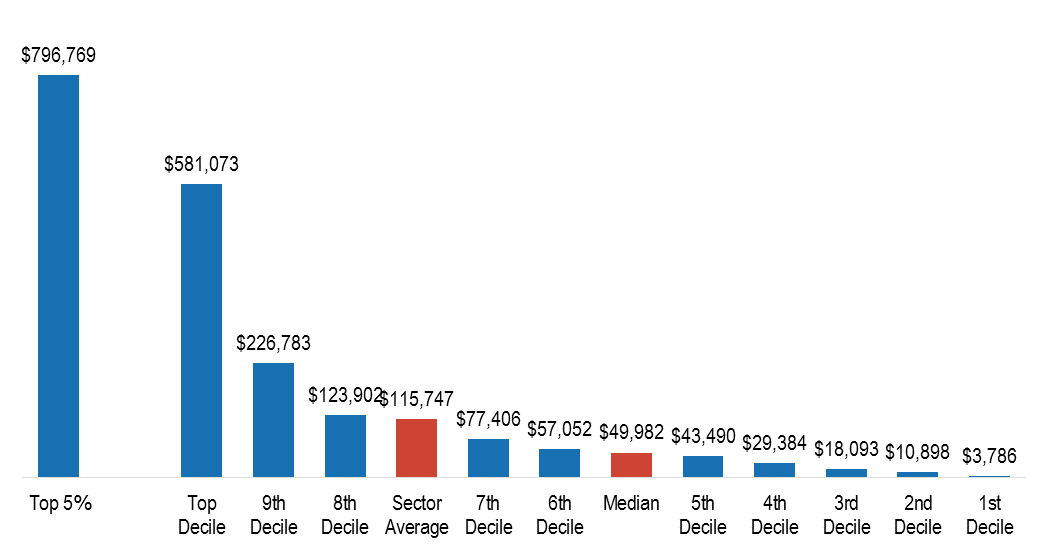
Figure 1d: Public Four-Year Institutions: Average Endowment per FTE Student by Deciles of Students, End of FY 2016
Source: IPEDS. Calculations by the authors.
In each sector, with the exception of private master’s institutions, average endowment per student is about three times as high among the top 10 percent of students as among those in the ninth decile. In all cases, the 5 percent of students attending the highest-endowment per student institutions benefit from endowments per student that are at least 20 percent higher than the average for the top 10 percent. The bottom 90 percent of students benefit from an average endowment that ranges from about 8 percent to 21 percent of the average endowment of students in the top decile, depending on the sector. The largest difference is in the private, non-profit doctoral universities and the smallest difference is in the private, non-profit master’s universities.
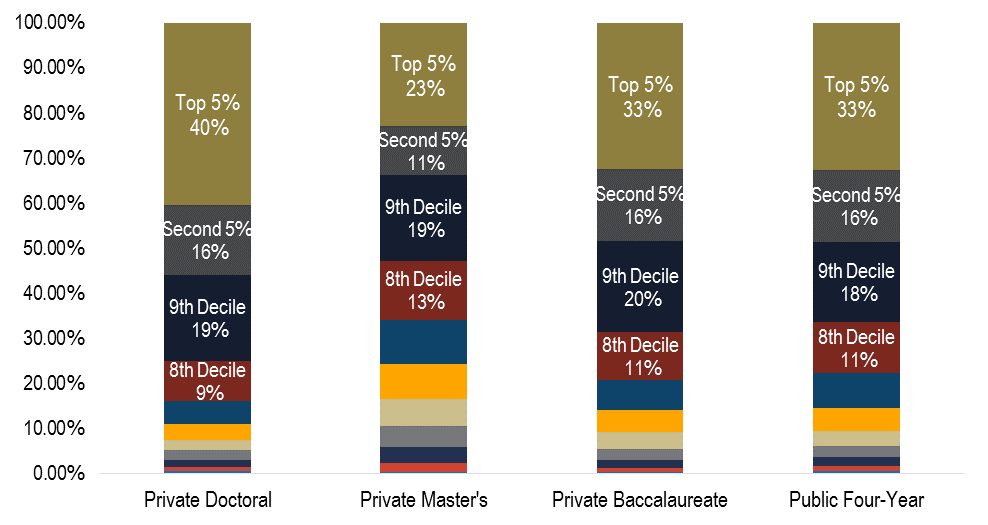
Figure 2: Distribution of Endowment Funds Across Institutions Ranked by Size of Endowment, by Sector, 2016
Source: IPEDS. Calculations by the authors.
Focusing on the distribution of endowment assets without regard to enrollments indicates the highest level of concentration is again among the wealthiest institutions in the private nonprofit doctoral sector, where 5 percent of institutions hold 40 percent of total assets and 10 percent hold 56 percent of the total. Among private master’s universities, the top 5 percent of institutions hold 23 percent of total assets and the top 10 percent hold 34 percent. The private baccalaureate and public four-year sectors fall between these two distributions, in terms of the share held by the top 5 percent (figure 2).
Endowment Spending and Returns
Conversations about the potential for public policies related to endowments frequently identify undergraduate students as the beneficiaries of higher spending rates. But university endowments fund multiple missions, including graduate students, research, and public service. At some universities, endowments are attached to individual schools or colleges and cannot fund activities elsewhere, regardless of preferences and priorities. Moreover, as we discuss above, a significant share of endowment funds carry restrictions, limiting their use to the purposes prescribed by the donor.[19] In other words, looking at the overall size of a university’s endowment is not enough to determine the potential for lowering prices, either through lower tuition or increased need-based financial aid, or the potential for improving the educational experiences of undergraduate students.
Looking at the overall size of a university’s endowment is not enough to determine the potential for lowering prices, either through lower tuition or increased need-based financial aid.
Determining the actual extent to which restrictions on endowments constrain spending is complicated, because money is ultimately fungible. Restrictions impose real constraints only if the amount of income generated by an endowment that is restricted to one purpose is greater than the amount the institution would choose to spend on that activity absent the restriction. The designation of endowment funds for specific purposes may influence institutional decision making even in the absence of real constraints, but competing institutional priorities for limited funds are much more likely than restricted endowments to actually limit spending in any one area.
A simple example demonstrates this point. Assume a school is going to spend $100, and wants to allocate $20 to financial aid, $30 to research, and $50 to faculty. Also assume that half the $100 is supported by tuition and half by earnings on an endowment. If the endowment earnings are unrestricted, there is no problem. Moreover, as long as the endowment earnings of $50 are restricted in amounts less than or equal to $20 for financial aid, $30 for research, and $50 for faculty, the endowment restrictions do not lead the institution to modify its allocation of resources. In this example, if $40 were restricted to research, the restrictions on the endowment would be constraining resource decisions, with expenditures on research greater than desired, forcing expenditures on faculty and financial aid to be less than desired by $10.
The data do not let us easily evaluate the extent to which endowments are restricting resource allocation decisions in this way. We can report on the total allocated to the operating budget from restricted accounts, and we can compare this total with the totals spent on major components of the budget. While this doesn’t make it clear whether restrictions are binding or not, the larger overall spending relative to the resources coming from restricted endowments, the less likely that restrictions are constraining spending.
Institutions report on the allocation of endowment spending to the operating budget in their annual financial statements in the Statement of Activities. This annual allocation is divided into temporarily restricted and unrestricted categories, with the former representing allocations from endowment accounts with restrictions on use. As an example, Amherst distributed $102 million from the endowment to the operating budget in the fiscal year ending June 30, 2017, with $64 million temporarily restricted and $38 million unrestricted, on a budget with total operating expenses of $195 million. This gives some indication of the share of total spending in any year covered by earnings, restricted and unrestricted, on the endowment. There are limitations in these data, however. In particular, the purposes for which the funds are restricted are not indicated. On a more technical note, endowment earnings allocated in any year only cover expenditures if the restrictions are in fact met. In any year, previously allocated endowment funds may be expended if restrictions were only met in that fiscal year, and any new allocation may be carried over to future years if necessary. Over time, no more can be spent than has been allocated, but balances can accumulate, and more can be spent in any one year than distributed that year, by drawing down past distributions.
Colleges can also exert some limited control over what shares of their endowments are restricted over time through their spending rules. The larger the fraction of a fixed amount of total spending the institution can cover from earnings on restricted endowments, the greater the amount of earnings on unrestricted endowments and other income it can save. This can be accomplished through a higher spending rate on endowment income, as long as total institutional spending remains unchanged. This reduces the share of earnings coming from restricted endowments in the future, increasing the share coming from quasi-endowments. The need to maintain the real value of endowments for particular purposes over time limits this practice. But underspending from restricted endowments over time leads to greater accumulation of endowment assets for the restricted purpose and less accumulation of unrestricted funds, limiting institutions’ flexibility.
As a simple example of this, assume an institution has a $100,000 endowment to support financial aid for students from South Dakota. The institution is committed to spending $10,000 per year in financial aid for students from that state. If the institution’s rule on endowment spending was to spend 4 percent, then $4,000 would come from the restricted endowment and $6,000 would come from unrestricted funds. If the institution instead decided it could spend 4.5 percent, then $4,500 would come from the restricted endowment and only $5,500 from unrestricted funds, saving $500 of unrestricted funds for the future. Across all restricted funds over time, the impact on restricted versus unrestricted funds could be significant. The decision on what percent to avail from the endowment is guided by preserving the future purchasing power of the endowment fund, but being too cautious about how much to spend has the down side of increasing restricted funds at the expense of unrestricted funds, reducing the institution’s future flexibility, assuming the institution leaves total spending unchanged when it changes the spending rate from the endowment. [20]
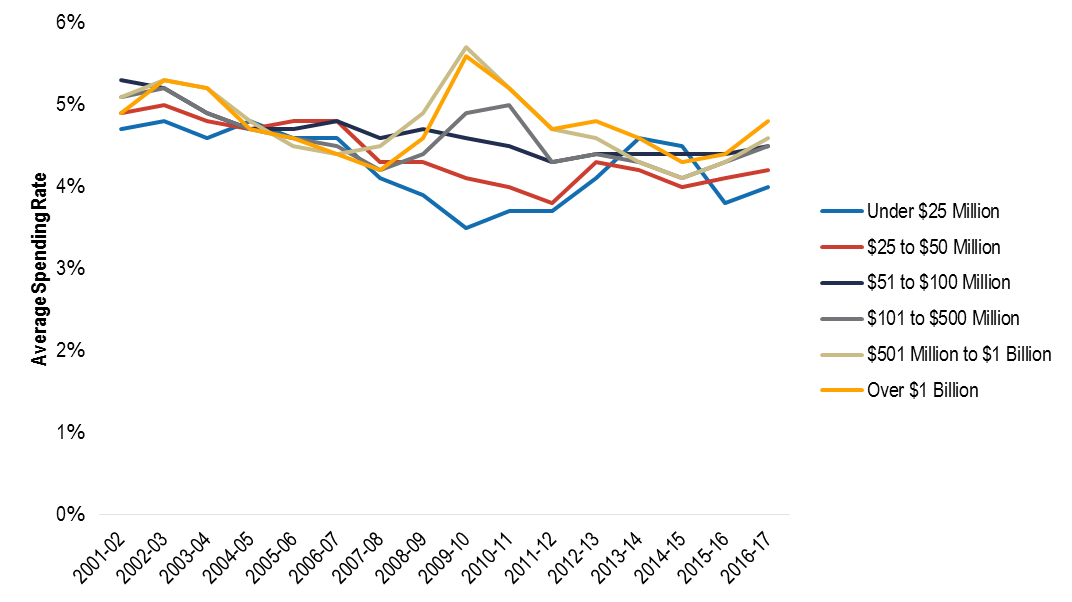
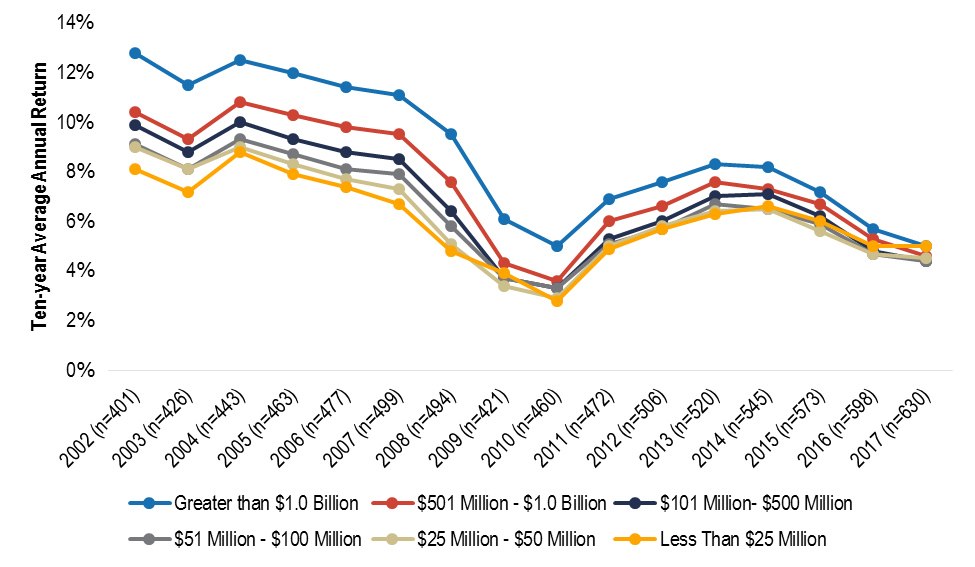
Spending rates tend to vary based on the size of the endowment. In 2016-17, colleges and universities used an average of 4.4 percent of the value of their endowments to support operating expenditures. Average spending rates ranged from 4.0 percent for institutions with endowments under $25 million to 4.8 percent for those with endowments over $1 billion. In 2009, the spending rate for institutions with the largest endowments rose to 5.6 percent and spending rates for those with the smallest endowments declined. But as the economy has recovered, spending rates have converged (figure 3).
The size of the endowment combined with the spending rate determines the support from the endowment for the operating budget. In 2015-16, institutions with assets over $1 billion funded an average of 15.9 percent of their operating budgets from endowment earnings. For institutions with endowment assets under $25 million, this percentage was only 4.6 percent. On average, institutions funded 9.7 percent of their operating budgets through their endowments.[21] (See the Appendix for examples of how individual institutions use their endowments).
Figure 3: Average Reported Spending Rates for College and University Endowments by Endowment Size, 2001-02 to 2016-17
Source: National Association of College and University Business Officers (NACUBO), 2017 NACUBO-Commonfund Study of Endowments.
In general, spending rates or rules are set to accomplish two objectives. One is to ensure that the endowment overall, and each individual fund, can maintain its value in real terms over time. If all the returns were spent, and none reinvested, the real value of the principal would decline over time as a result of inflation and earnings on the fund would not be able to support the ongoing operations for which it was intended.
As an example, if a fund were created to support an endowed professorship, and intended to cover the professor’s salary not just today but also in the future, then the fund would need to be large enough to generate a return that could be used both to pay the salary and to reinvest some of the earnings to cover any future growth in the professor’s salary. The endowment would need to grow annually by the expected increase in the professor’s salary. If this was on average between 3 and 5 percent, which is a reasonable range for the growth of professor salaries, 3 to 5 percent of the value of the endowment would need to be reinvested from earnings each year to make this possible. If all of the earnings were used to support the salary in year one, the ability of the endowment to support the professor would decline as the salary increased over time.
Second, most spending rules smooth the income that is allocated from the endowment to support spending, rather than taking a fixed percentage of beginning-of-year assets each year. This protects expenditures from the level of variability experienced in the financial markets. The goal of spending rules is to take advantage of income from the endowment, maintaining the inflation-adjusted value of the principal over time, while smoothing the support from the endowment so that annual expenditures are less volatile than investment returns.
Before the 1970s, colleges and institutions only spent the interest and dividends on their portfolios. Since that time, most institutions have moved toward investing for total return, and spending from realized gains, not just interest and dividends.[22]
Endowment Returns
Returns on the endowment, distribution to the budget (both operating and capital), new gifts to the endowment, and any surpluses that the board allocates to the endowment all contribute to changes in the value of the endowment. Financial statements are not often clear on each of these items, lumping some together. That being said, we can draw some rough estimates at the institutional level. For example, Harvard had an endowment of $35.7 billion at the end of FY 2016, which rose to $37.1 billion at the end of FY 2017, an increase of $1.4 billion. A reported return rate of 8.1percent accounts for growth of $2.9 billion, while a reported spending rate of 5.4 percent accounts for a decline of about $2.1 billion. Harvard indicates in its financial reporting that gifts to the endowment totaled $550 million in FY 2017, which accounts for the majority of the growth not explained by the return.[23]
The tax law passed in 2017 imposes a 1.4 percent tax on the net earnings of endowment assets at colleges and universities enrolling more than 500 full-time equivalent students with assets exceeding $500,000 per student. This tax will effectively reduce the rate of return on the endowments of these institutions, diminishing the funds available to supplement tuition and other revenues to fund operations.[24] These institutions will be able to maintain their expected future spending levels only if they increase the spending rate on endowment income or increase revenues from other sources—such as tuition and fees or gifts, assuming the expected real before tax return on endowments in the longer run remains unchanged. As institutions review their options, some may decide that their best option, at least in part, is to increase the net prices undergraduate students pay, either through higher sticker prices or lower financial aid—not an outcome likely to please Congress.
All of the institutions in question, however, have flexibility in their budgets, given their relative wealth, and should be able to find alternative strategies that will not reduce the opportunities they provide to students with limited financial means.
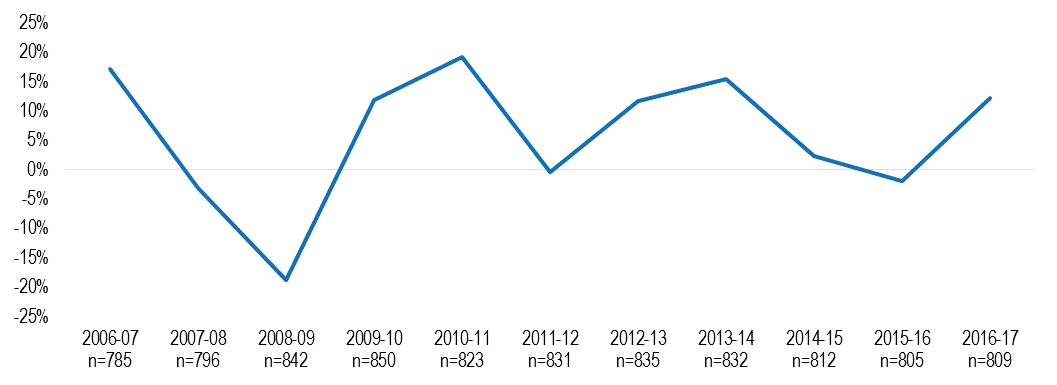
Like all financial assets, endowment funds generate returns that vary with the market. In FY 2016, endowment returns were much lower than usual, with aggregate statistics showing negative average and median returns. Figure 4 shows the average returns from FY 2007 through FY 2017. Over these 11 years, annual average rates of return ranged from -18.7 percent in FY 2009 and -3 percent in FY 2008 to 17.2 percent in FY 2007 and 19.2 percent in FY 2011.
Individual institutions have also released endowment reports for FY 2017, indicating higher returns than in FY 2016. For example, Yale’s return rose from 3.4 percent in FY 2016 to 11.3 percent in FY 2017. Harvard’s return rose from -2.0 percent to 8.1 percent. The University of Virginia, which has one of the largest endowments among public institutions, reported a FY 2017 return of 12.4 percent, up from -1.5 percent in FY 2016. Grinnell College, a small, highly selective liberal arts college in Iowa, recently announced an 18.8 percent return for FY 2017, one of the highest of those that have announced thus far.
Figure 4: Average Annual Endowment Returns: 2006-07 through 2016-17
Source: NACUBO-Commonfund Study of Endowments
Because of year-to-year fluctuations, multi-year compound annual returns give a better picture of the returns to endowment assets, with returns averaging about 5 percent per year for the decade ending in 2016-17. But even the longer-term averages vary considerably depending on the starting and ending years. For example, for both public and private institutions, the average rate of return was about 7 percent for the 10 years ending in 2012-13.
Figure 5: Endowment Returns: One-, Three-, Five-, and Ten-Year Averages for the Period Ending 2012-13 and 2016-17
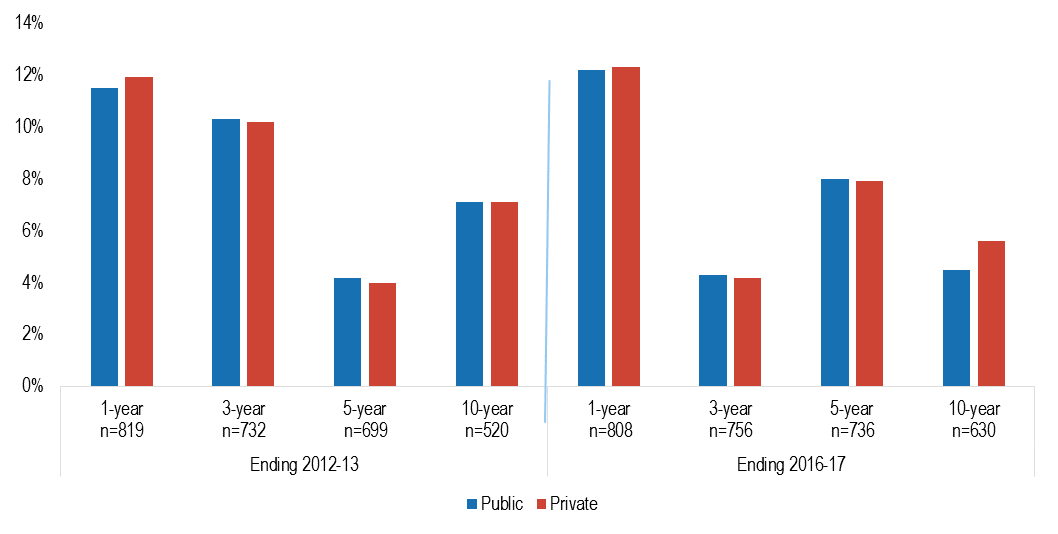
*Public institutions include public colleges, universities, and systems, as well as institution-related foundations.
Source: NACUBO-Commonfund Study of Endowments.
Figure 6: Ten-year Average Annual Net Endowment Returns by Size of Endowment
Source: NACUBO-Commonfund Study of Endowments. Note: Data points reflect average returns for the 10 years ending with the designated year.
Note that if schools are spending 4 percent and earning about 5 percent over time, they are reinvesting only 1 percent. Even in a low-inflation period, reinvesting only 1 percent is unlikely to be adequate to maintain the real value of the endowment. Expected earnings in the future play an important role in planning sustainable future expenditures. If average returns were expected to stay at 5 percent in the long run—which is unlikely given long-term historical patterns—there would be significant pressure to reduce spending from endowments. Longer run returns of 7 to 8 percent would allow spending rates of 4 to 5 percent, with 3 percent available for reinvestment to support maintaining the real value of endowments. Uncertainty about future long term real returns on endowments creates uncertainty about the future finances of institutions relying on endowments, complicating their financial planning. However, abstracting from the potential for new gifts to enhance the endowment is likely to lead to under-spending, diminishing the educational experiences or increasing the prices paid for current students.
The Impact of Endowments on the Student Experience and the Public Benefit
Some members of Congress may be most concerned about the prices relatively affluent students pay at elite institutions, but criticism of large endowments is, at least to some extent, rooted in frustration about the under-representation of low- and middle-income students in wealthy, highly-selective institutions. For example, Representative Tom Reed has drafted legislation in the past that would require institutions to devote 25 percent of the earnings on their endowments exceeding $1 billion to grants for students from families with incomes between 100 and 600 percent of the poverty line.[25] Requests to high-endowment institutions for information, such as that in 2016 from Senator Orrin Hatch and Representatives Kevin Brady and Peter Roskam, have included questions about the percentage of the endowment devoted to financial aid.[26]
Criticism of large endowments is, at least to some extent, rooted in frustration about the under-representation of low- and middle-income students in wealthy, highly-selective institutions.
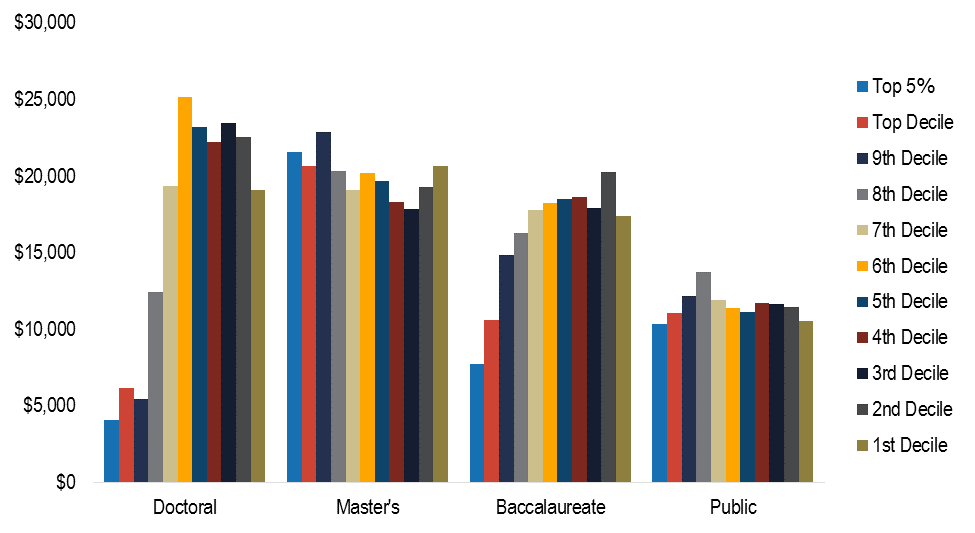
It is, therefore, useful to ask about the relationship between endowments and expenditures on financial aid—particularly need-based financial aid. To explore this relationship, we have mapped the deciles of students ranked by endowment per student against several measures of institutions’ commitment to need-based financial aid and students in need of financial aid. These measures include the institutional aid per student, the net price for students with incomes between $30,000 and $48,000, and the share of students who receive Pell grants.
Institutional Aid per Student
As the graph below shows, students receive, on average, more institutional aid at institutions with the highest endowments per student. However, variation between deciles is, in many cases, moderate. The difference between the top decile of students and the ninth decile is most pronounced at private nonprofit doctoral institutions, where students in the top decile receive approximately 23 percent more in institutional aid than those in the ninth decile.[27]
Figure 7: Average Institutional Aid per Student by Deciles of Students, End of FY 2016
Source: IPEDS. Calculations by the authors.
The impact of institutional aid depends on sticker prices. The lower institutional aid in the deciles with lower endowment per student is correlated with lower tuition and fee prices, so net prices for low-and moderate-income students are more informative than average aid levels.
Net Price and Pell Share
A clear understanding of how institutions with large endowments are supporting students from disadvantaged background requires knowing not only how much financial aid the colleges and universities are offering, but how many low- and moderate-income students they are enrolling and what net prices these students must pay.
Figure 8: Average Net Price (incomes $30,001-$48,000) by Deciles of Students, End of FY 2016
Source: IPEDS. Calculations by the authors.
Note: Average net price is from IPEDS. It measures the average amount students pay after subtracting grant aid from all sources from the total cost of attendance (sum of published tuition and required fees, books and supplies, and the weighted average for room and board and other expenses). Only students receiving federal financial aid are included.
Low- and moderate-income students at top endowment-per-student schools tend to pay a lower net price than their peers at schools with smaller endowments per student. In some sectors this trend is stark; for example, at the private nonprofit doctoral institutions students in the top decile pay a third of the net price their peers in the fifth decile pay. There is little difference in net price across deciles for students with incomes between $30,000 and $48,000 at private nonprofits master’s and public institutions. The share of Pell Grant recipients also varies less across endowment sizes in these sectors—where the range of endowment sizes is smaller than it is among private nonprofit doctoral universities and bachelor’s colleges.
However, the share of Pell Grant recipients at private doctoral institutions is lowest at the high-endowment institutions with low net prices. Among the 5 percent of students at the wealthiest private nonprofit doctoral universities, based on endowment per student, those from families with incomes between $30,000 and $48,000 pay an average net price of approximately $4,000, compared with $19,000 to $23,000 among the 50 percent of students enrolled in the least well-endowed doctoral universities. Of the 5 percent of students at the highest-endowment doctoral universities, 14 percent are Pell Grant recipients. In contrast, the share of Pell Grant recipients among the half of students at the less well-endowed doctoral institutions ranges from 19 percent to 40 percent.
Figure 9: Average Undergraduate Pell Share by Deciles of Students, End of FY 2016

Source: IPEDS. Calculations by the authors.
At private nonprofit baccalaureate colleges, the pattern is similar to that at doctoral universities. The average net price for students from families with incomes between $30,000 and $48,000 was approximately $11,000 at institutions with students in the top decile based on endowment per student and $15,000 at institutions with students in the ninth decile. At the baccalaureate colleges with the bottom 50 percent of students based on endowment per student, students in this income group paid net prices ranging from approximately $17,000 to $20,000. The share of Pell grant recipients was lowest at the institutions with the highest endowments per student—19 percent—and ranged from 30 percent to 52 percent for the colleges with the 50 percent of students attending the institutions with the lowest endowments per student.
These data indicate that the private non-profit doctoral and baccalaureate institutions with large endowments do appear to be using resources to lower net prices for students from families in the lower half of the income distribution. Low-and moderate-income students who manage to enroll in these selective institutions receive more institutional grant aid and pay lower net prices than students attending less well-endowed institutions. However, relatively few Pell Grant recipients attend these colleges and universities.
Educational spending per student
Institutional aid is not the only component of college and university budgets that is enhanced by high endowments. As figure 10 reveals, educational spending per student is highly correlated with endowment per student, particularly at the private, non-profit doctoral and baccalaureate institutions. For example, doctoral institutions with the top ten percent of students based on endowment per student spend on average about $92,500 per student per year on education and related expenses. The institutions with the bottom ten percent of students spend $18,100. The comparable numbers at the baccalaureate institutions are $53,000 and $15,000. Correlations in the private nonprofit master’s and public sectors, where the largest endowments are not nearly as large, are weaker.[28]
Figure 10: Education and Related Expenditures per Student by Deciles of Students, FY 2015
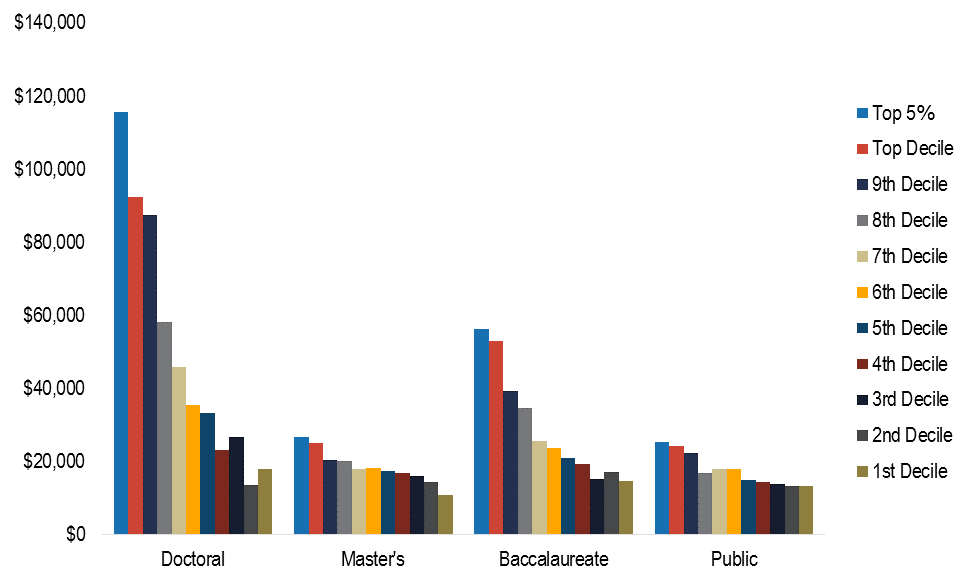
Source: IPEDS and the Delta Cost Project
Spending on Research
As shown in figures 11a-b, expenditures on research are also correlated with endowment per student. The private nonprofit doctoral universities enrolling the 30 percent of students benefiting from the largest endowments per student spend approximately four times as much on research as lower endowment per student schools. For master’s, baccalaureate, and public institutions, the drop off is as steep and occurs after the first decile of students.[29]
Figure 11a: Research Spending by Deciles of Students (Doctoral and Public Institutions), End of FY 2016
Source: IPEDS. Calculations by the authors.
Figure 11b: Research Spending by Deciles of Students (Master’s and Baccalaureate Institutions), End of FY 2016
Source: IPEDS. Calculations by the authors.
Conclusion
The favorable tax treatment of private non-profit and public higher education is a mechanism to transfer resources to higher education, in recognition of its contribution to public policy objectives. The benefits of an educated population, along with the contributions of research to economic growth, provide justification for public support. Because of market imperfections, the private sector would not, on its own, undertake the optimal level of investments in education and research. There are positive externalities—the benefits of new knowledge and an educated citizenry can’t be fully captured by individual investors or consumers—and thus the private market will not adequately invest in these activities. Moreover, in the absence of a strong federal student loan market, individuals may not be able to afford to invest in higher education even when it would be valuable to them to do so, because of a lack of income or assets to pledge as collateral for borrowing. Even with access to federal loans, many students may be averse to borrowing to pay for a college education.
There are several ways that federal policy transfers resources to higher education. These include the charitable deduction for contributions, the tax-free earnings on endowments and on income associated with the educational mission, and a variety of grants and tax credits that support both students and research. In addition, a variety of other programs such as federal loan programs and the (relatively small) work-study program help students pay for higher education. Absent these policies, the resources available to colleges and universities to support their educational mission would be significantly reduced.
The benefits of the tax-free return on endowments accrue largely to institutions with sizeable endowments, which direct them toward programs they and their donors identify. This may or may not align with what public policy makers believe is important.
With the exception of need-based student aid, these policies that provide public subsidies to higher education are a fairly blunt tool, not particularly well targeted to specific public objectives, and this is particularly apparent with endowments. The benefits of the tax-free return on endowments accrue largely to institutions with sizeable endowments, which direct them toward programs they and their donors identify. This may or may not align with what public policy makers believe is important. Institutions—not public policy makers—determine the allocation of endowment earnings across purposes such as research, educating more students, improving the quality of education, or making it less expensive for those attending. This may be contributing to some of the tensions between policy makers and higher education institutions.
The non-profit structure ensures that any accumulated profits, as well as any public subsidy, will be used to support education. But, colleges and universities are able to determine how to allocate these resources in furtherance of this goal. Again, policy makers may be frustrated with the inability to more specifically target public subsidies. In addition, when colleges and universities accumulate income exceeding expenditures, the institutions are effectively transferring the subsidy to the future, which may not be at all what the policy makers had in mind. The non-profit structure does mean that there are no incentives to accumulate profits at the expense of students for transfer to owners. (There are ways to spend on management and faculty that may not benefit students, but there are regulatory mechanisms designed to control this). But, policy makers cannot effectively target the spending of the subsidy either on specific programs today, or even today rather than in the future.[30]
Unlike many countries, the US has never operated its own universities, except the service academies. Rather, the US has chosen to subsidize states and philanthropic institutions. This may reflect two kinds of judgment by our political system: (1) that the federal government is not well equipped to operate a complex national system of higher education, and (2) that there is a positive public purpose served by having a system of quite diverse institutions with substantial independence and with varied financial support. These two judgments limit the ability of federal policy makers to get exactly what they want out of their spending, but that may be a tradeoff worth making. This reality, combined with diminished trust in colleges and universities as serving the public interest, helps to explain proposals to limit federal tax-based subsidies.
As the data in this report confirm, the benefits of tax preferences for donations to and earnings on endowments are highly concentrated among a small number of colleges and universities that educate a small share of all college students and an even smaller share of low-income students. These institutions do provide generous grants and relatively low prices to their high-need students. But the vast majority of disadvantaged students do not share in that benefit.
Any public policy reforms related to college and university endowments should be rooted in these realities, but the tax bill recently enacted by Congress is not. The bill makes no attempt to influence institutional spending patterns, and provides no incentives for schools to increase the number of low-income students they enroll.[31] Instead, it imposes a tax on the net endowment income of the private colleges and universities with the largest endowments per student and uses the revenue to reduce the budget deficit generated by other tax cuts.
The new tax on endowments will affect a relatively small number of institutions, but its impact will be somewhat arbitrary, since some institutions with very high levels of endowment per student do not enroll enough students to be affected by the tax. Moreover, the all or nothing tax means that some colleges and universities with a few more students or with a few more dollars in endowment than similar institutions will have large tax bills while their peer institutions pay no tax at all.
The new tax policy appears to be more of a political statement than a thoughtfully designed policy that will actually accomplish its purported social goals. It would be reasonable for the federal government to seek strategies for directing its subsidies to the students who need them most and the institutions that educate them. Rooting policy design in the realities of endowment wealth would be a constructive starting point.
Appendix
Deciles of FTE Students
The proportion of FTE students included in each decile for each sector of students is as follows:
| Doctoral | Master’s | Baccalaureate | Public | |
|---|---|---|---|---|
| Top 10% | 9.49% | 9.50% | 9.65% | 9.82% |
| 9th Decile | 10.07% | 10.42% | 10.30% | 9.74% |
| 8th Decile | 10.15% | 9.91% | 9.90% | 10.09% |
| 7th Decile | 10.27% | 10.01% | 10.07% | 10.26% |
| 6th Decile | 9.76% | 9.96% | 9.79% | 10.08% |
| 5th Decile | 9.08% | 10.09% | 10.14% | 9.96% |
| 4th Decile | 10.83% | 9.88% | 10.11% | 10.01% |
| 3rd Decile | 10.11% | 10.21% | 9.97% | 10.03% |
| 2nd Decile | 10.23% | 9.87% | 9.99% | 9.94% |
| 1st Decile | 10.00% | 10.14% | 10.07% | 10.07% |
Institutional Examples
Harvard University
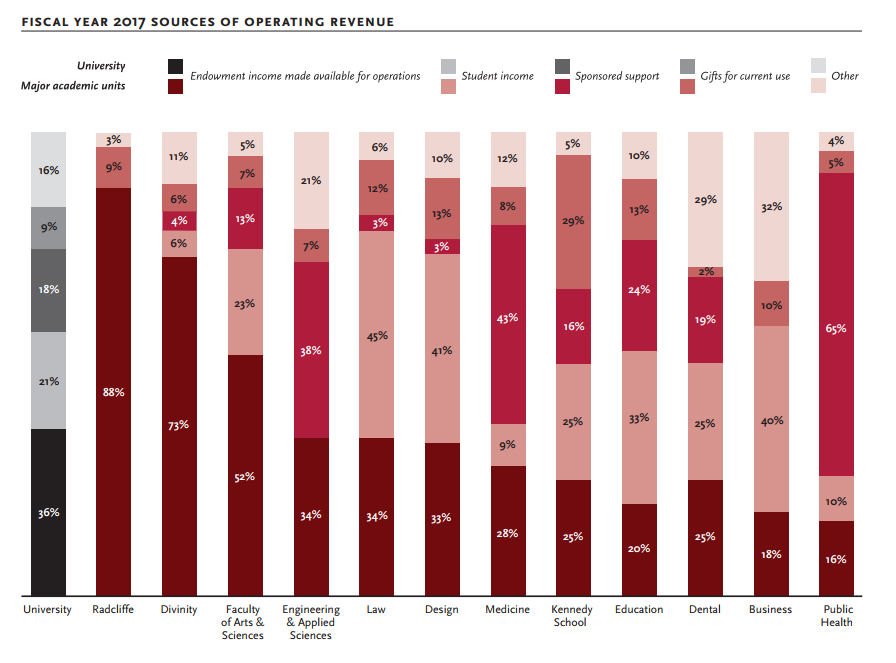
Harvard University has the largest endowment in the nation—$37.1 billion at the end of 2016-17. Figure A1 shows a breakdown of how Harvard uses its endowment in each of its colleges. Overall endowment income covers 36 percent of expenditures, but the share ranges from 16 percent in the School of Public Health and 18 percent in the Business School to 73 percent in the Divinity School and 88 percent at the Radcliffe Institute. Endowment income covers 52 percent of expenditures in the Faculty of Arts and Sciences, which includes both the undergraduate college and the Graduate School of Arts and Sciences. While the breakdown between undergraduates and graduate students is not available, undergraduate students pay tuition and a significant share of the graduate students in arts and sciences have fellowships that cover their tuition, so the endowment share is lower and the tuition share higher for the undergraduate college.
Figure A1: Harvard University: Sources of Operating Revenue by College, FY 2017
 Source: Harvard University 2017 Financial Report
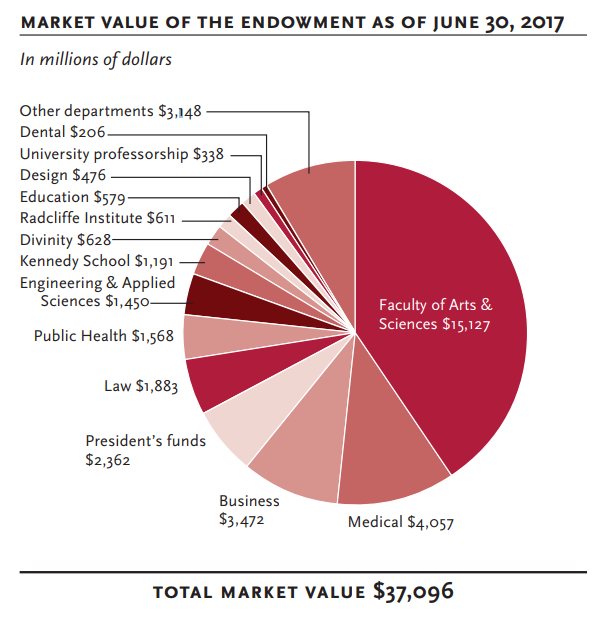
Figure A2: Market Value of the Harvard University Endowment by School, June 2017
 Source: Harvard University 2017 Financial Report
In Harvard’s 2016 response to an inquiry from Congress regarding endowments greater than $1 billion, the authors explain, “endowment funds are generally not transferable for use across schools; in other words, an endowment given for the unrestricted support of the Harvard Kennedy School cannot be used to support financial aid at Harvard College.” This is key, because it challenges an assumption that Harvard’s large endowment can be easily or directly applied to undergraduate students. Even funds that are unrestricted remain “restricted by school.”[32]
The Faculty of Arts and Science, which includes Harvard College, the Graduate School of Arts and Sciences, and the Harvard Paulson School of Engineering and Applied Sciences, accounts for 45 percent of the university’s endowment funds. It is impossible to separate out what share of those funds reaches undergraduates, since some of the faculty members and physical spaces are shared by undergraduates and graduate students. However, even if the funds only supported undergraduates, the amount available to subsidize them would be less than half of Harvard University’s total endowment. However, Harvard has other sources of revenues, which are not subject to the same legal restrictions.
Yale University
According to the 2016 endowment report, 75 percent of Yale’s $25.4 billion endowment funds were restricted for specific purposes. As figure A3 shows, 27 percent of funds were restricted for Yale College (undergraduates) and the Graduate School of Arts and Sciences, combined under the Faculty of Arts and Sciences. The remaining restricted funds are allocated for the professional schools (Law, Medicine, and 10 other professional schools), the library, and assorted other entities. Following the same logic applied to Harvard’s endowment above, this means that in a best-case scenario, if the majority of unrestricted funds were allocated to supporting Arts and Sciences, that would still only be about half of Yale University’s endowment. Undergraduates would benefit from some share of that amount.
Figure A3: Yale University Endowment
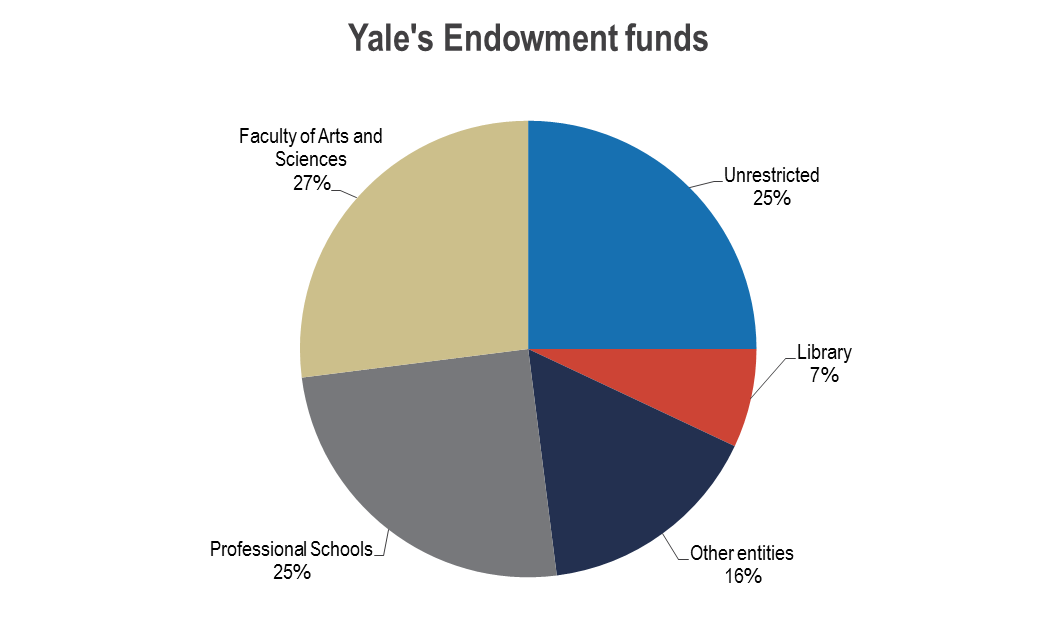
Source: Yale 2016 Endowment Report, calculations by the authors
As figure A4 shows, endowment income supports about 35 percent of all of Yale’s costs each year. Depending on the school, endowment income supports anywhere from approximately 7 percent (Medical school) to almost 90 percent (School of Music) of costs.
Figure A4: Yale University: Sources of Revenue by School
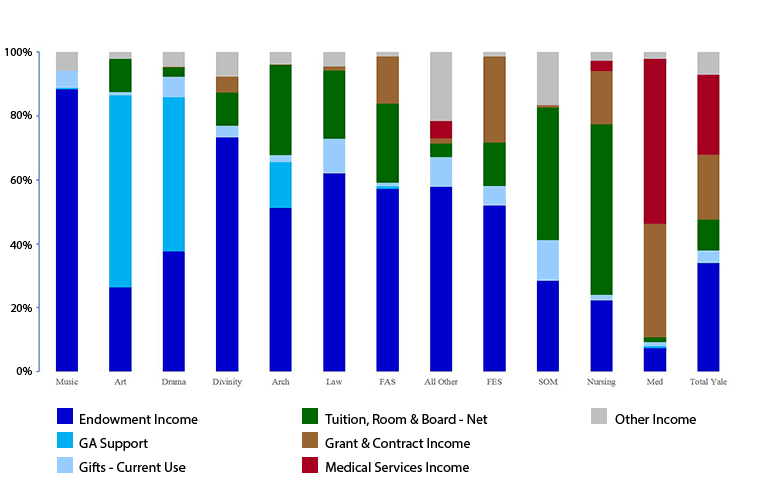
Source: FY2016 report and Yale Website
Amherst College
According to Amherst’s letter to Congress in 2016, approximately 70 percent of their $2.2 billion endowment funds were restricted. As figure A5 shows, Amherst funds more than half of its operating expenses through its endowment. This is up from about a third of expenses in 2001.
Figure A5: Proportion of Amherst College Operating Revenues, 2016
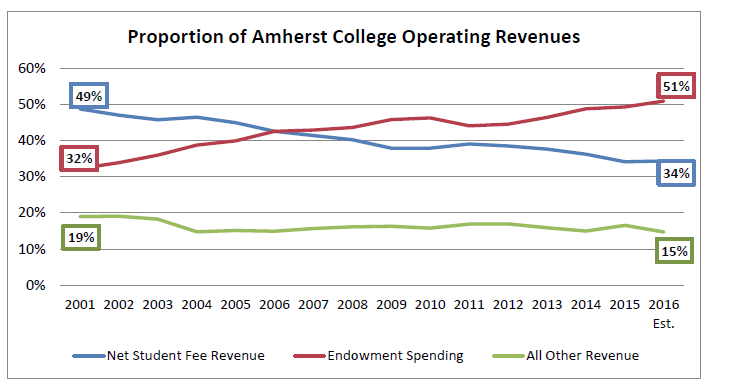 Source: Amherst Congressional Response
University of Virginia
The combined University of Virginia system endowment (including endowments of the university and nine related foundations) was just under $6.2 billion in June 2017. According to UVA’s 2017 financial report, about two-thirds of the endowment funds are restricted by donors. The remaining one-third of funds, while unrestricted by donors, is then designated by the University for certain purposes, namely scholarships, fellowships, professorships, and research activities. As figure A6 shows, the endowment funds about 6 percent of operational expenses at UVA. The presence of a medical school often complicates the data picture, as evidenced below in the case of UVA.
Figure A6: Total University Revenues and Other Sources of Operational Funding, 2017
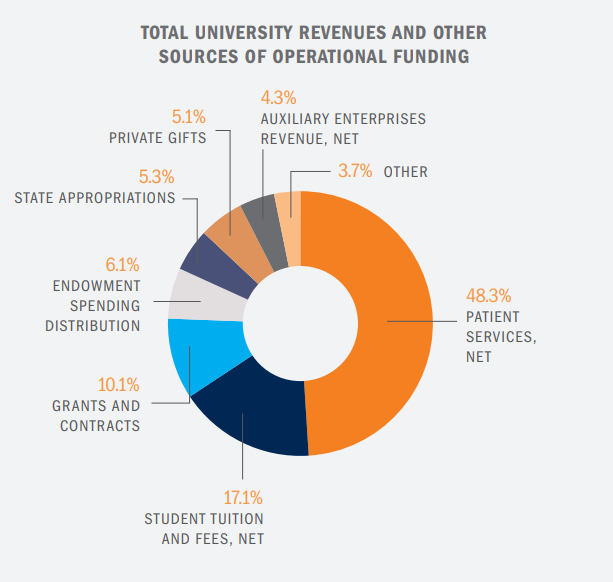
Source: UVA Financial Report 2017
Berea College
Berea College has an endowment of approximately $1 billion and annual enrollment of about 1,600 students, making its endowment per student one of the highest in the country. Berea College covers tuition for all of its students, drawing heavily on the endowment to do so. The endowment funds approximately 75 percent of the education and general operating budget of the institution, which is more than double the proportion of the operating budget that Harvard and Yale rely on their endowments for.[33] However, Berea is an outlier among the well-endowed institutions, using its endowment to lower tuition for all students rather than increasing educational spending per student. It is important to note that Berea admits only low-income students. Their tuition policy is really a need-based aid policy.
These institutional examples demonstrate some of the range of experiences of colleges and universities with regard to their endowments.
Bibliography
Amherst College, “Amherst Responds to Congressional Endowment Inquiry,” (April 2016), https://www.amherst.edu/news/news_releases/2016/04-2016/amherst-responds-to-congressional-endowment-inquiry.
Bacow, Lawrence S. and Bowen, William G. “The Real Work of ‘Saving 2 Colleges Has Yet to Be Done,” The Chronicle of Higher Education (September 8, 2015), https://www.chronicle.com/article/The-Real-Work-of-Saving-/232901.
Berea College, “Quick Facts,” (2018), https://www.berea.edu/.
Boboltz, Sara. “USC Film School ‘Will Not Proceed’ with $5 Million Harvey Weinstein Donation,” Huffington Post (October 10, 2017), https://www.huffingtonpost.com/entry/usc-will-not-proceed-with-5-million-harvey-weinstein-donation_us_59dd407be4b01df09b770c6c.
Ford Foundation Advisory Committee on Endowment Management, “Managing educational endowments: Report to the Ford Foundation,” (1969). New York: Ford Foundation.
Hansmann, Henry. “The Role of Nonprofit Enterprise”. The Yale Law Journal, Volume 89, Number 5 (1980): 835-902.
Hansmann, Henry. “Ownership of the Firm” (1988). Faculty Scholarship Series. 5041. https://openyls.law.yale.edu/handle/20.500.13051/4581.
Harvard University, “Financial Report Fiscal Year 2017,” (2017), https://finance.harvard.edu/files/fad/files/final_harvard_university_financial_report_2017.pdf.
Harvard University, “Harvard Congressional Report,” (March 31, 2016).
Hatch, Orrin G., Brady, Kevin, and Roskam, Peter J. “Congressional Letter to Colleges,” (2016), www.documentcloud.org/documents/2711522-Congressional-Letter-to-Colleges-Re-Endowments.html.
Lewin, Tamar. “Princeton Settles Money Battle Over Gift,” The New York Times (December 10, 2008), http://www.nytimes.com/2008/12/11/education/11princeton.html.
National Association of College and University Business Officers, “2016 NACUBO-Commonfund Study of Endowments Press Release,” https://www.nacubo.org/Press-Releases/2016/2016%20NACUBO%20Commonfund%20Study%20of%20Endowments%20Final%20Data.
Nichols, Andrew and Santos, Jose Luis, “A Glimpse Inside the Coffers: Endowment Spending at Wealthy Colleges and Universities,” The Education Trust, (August 4, 2016), https://edtrust.org/resource/a-glimpse-inside-the-coffersendowment-spending-at-wealthy-colleges-and-universities/.
Reed, Tom, “Outline: Reducing Excessive Debt and Unfair Costs of Education Act of 2015”, https://www.documentcloud.org/documents/2711324-Rep-Tom-Reed-University-Endowment-Legislation.html.
Rosenberg, John S. “Harvard Endowment Increases Modestly to $37.1 Billion During Early Stages of Overhaul,” Harvard Magazine, (September 19, 2017), https://harvardmagazine.com/2017/09/harvard-endowment-37-1-billion-on-8-1-percent-return.
Steinberg, Jacques. “Yale Returns $20 Million to an Unhappy Patron,” The New York Times (March 15, 1995), http://www.nytimes.com/1995/03/15/us/yale-returns-20-million-to-an-unhappy-patron.html.
Swenson, David. “Pioneering Portfolio Management: An Unconventional Approach to Institutional Investment” Simon and Schuster, (2009). pp 26-31.
Tobin, James. “What Is Permanent Endowment Income?” The American Economic Review, vol. 64, no. 2, (1974), pp. 427–432. JSTOR, www.jstor.org/stable/1816077.
United States Senate Committee on Finance. “Baucus, Grassley Write to 136 Colleges, Seek Details of Endowment Pay-outs, Student Aid,” (January 24, 2008), https://www.finance.senate.gov/release/baucus-grassley-write-to-136-colleges-seek-details-of-endowment-pay-outs-student-aid.
University of Virginia, “Financial Report: 2016-2017,” (2017), http://www.virginia.edu/financialreport/UVAFInancialReport2017.pdf.
Woodhouse, Kellie. “Doing Their Fair Share?” Slate, (May 22, 2015), http://www.slate.com/articles/life/inside_higher_ed/2015/05/wealthy_universities_like_harvard_leave_low_income_students_behind_despite.html.
Yale University, “2016: The Yale Endowment,” (2016), https://static1.squarespace.com/static/55db7b87e4b0dca22fba2438/t/58ece6bd579fb356c857e2a4/1491920595529/Yale_Endowment_16.pdf.
Yale University Office of the Provost, “Data at a Glance,” (2018), https://provost.yale.edu/budget/data-glance.
Zinshteyn, Mikhail. “How can wealthy private colleges better serve low-income students?” PBS News Hour, (January 24, 2017), https://www.pbs.org/newshour/education/can-wealthy-private-colleges-better-serve-low-income-students.
115th Congress, “H.R.1 – An Act to provide for reconciliation pursuant to titles II and V of the concurrent resolution on the budget for fiscal year 2018” (2017), https://www.congress.gov/bill/115th-congress/house-bill/1/text.
Endnotes
- See Grassley and Baucus 2008 (www.finance.senate.gov/release/baucus-grassley-write-to-136-colleges-seek-details-of-endowment-pay-outs-student-aid), Hatch, Brady and Roskam 2016 (www.documentcloud.org/documents/2711522-Congressional-Letter-to-Colleges-Re-Endowments.html), and the recently passed Tax Cuts and Jobs Act, all of which demonstrate public policy makers’ concerns with large endowments accumulated by colleges and universities. ↑
- The excise tax applies to colleges and universities with endowments per student of $500,000 or more that have at least 500 students. Among other issues, exactly how it will be implemented is still unclear. For example, how to measure net investment income and the number of students will both need to be clarified. ↑
- Private non-profits can generate profits, despite their name, but cannot distribute these profits to owners or shareholders, which non-profits do not have. Hansmann (1980) calls this the non-distribution constraint. Hansmann, Henry. “The Role of Nonprofit Enterprise”. The Yale Law Journal, Volume 89, Number 5 (1980): 835-902. ↑
- If the donor of an institutional endowment fund is still alive, the institution’s board may remove spending restrictions with the donor’s written consent. The board may also modify any restrictions that were designated by the board itself. In other cases, court approval is necessary prior to invading principal. In 2015, Sweet Briar College, on the verge of closing due to financial trouble, was granted permission by the state of Virginia to spend down $16 million in previously restricted endowment principal. This agreement came in conjunction with an alumnae group promise to deliver $12 million in donations. See “The Real Work of ‘Saving 2 Colleges Has Yet to Be Done,” The Chronicle of Higher Education (September 8, 2015), https://www.chronicle.com/article/The-Real-Work-of-Saving-/232901 ↑
- Earnings on restricted endowment funds are classified in annual financial statements as temporarily restricted, indicating that they can only be spent for the restricted purpose during that time period. Once spent for the restricted purpose, the funds are reclassified from restricted to unrestricted for accounting purposes. ↑
- See “USC Film School ‘Will Not Proceed’ with $5 Million Harvey Weinstein Donation,” Huffington Post (October 10, 2017), https://www.huffingtonpost.com/entry/usc-will-not-proceed-with-5-million-harvey-weinstein-donation_us_59dd407be4b01df09b770c6c ↑
- See “Princeton Settles Money Battle Over Gift,” The New York Times (December 10, 2008), http://www.nytimes.com/2008/12/11/education/11princeton.html and “Yale Returns $20 Million to an Unhappy Patron,” The New York Times (March 15, 1995), http://www.nytimes.com/1995/03/15/us/yale-returns-20-million-to-an-unhappy-patron.html ↑
- Not all nonprofit organizations are tax exempt, but all with 501(c)(3) status are. Private, non-profit and public higher education institutions are eligible for 501(c)(3) status. ↑
- Henry Hansmann, “Ownership of the Firm” (1988). Faculty Scholarship Series. 5041. http://digitalcommons.law.yale.edu/fss_papers/5041 ↑
- Andrew Nichols and Jose Luis Santos, “A Glimpse Inside the Coffers: Endowment Spending at Wealthy Colleges and Universities,” The Education Trust, (August 4, 2016), https://edtrust.org/resource/a-glimpse-inside-the-coffersendowment-spending-at-wealthy-colleges-and-universities/, Mikhail Zinshteyn, “How can wealthy private colleges better serve low-income students?” PBS News Hour, (January 24, 2017), https://www.pbs.org/newshour/education/can-wealthy-private-colleges-better-serve-low-income-students, and Kellie Woodhouse, “Doing Their Fair Share?” Slate, (May 22, 2015),http://www.slate.com/articles/life/inside_higher_ed/2015/05/wealthy_universities_like_harvard_leave_low_income_students_behind_despite.html ↑
- Assumes a 4.5% spending rate. ↑
- This analysis only includes institutions in the following Carnegie Classes: Doctoral Universities (Highest, Higher, and Moderate Research Activity), Master’s Colleges & Universities (Larger, Medium, and Small Programs), and Baccalaureate College (Arts & Sciences Focus, Diverse Fields, and Mixed Baccalaureate/Associate’s). Institutions enrolling fewer than 500 undergraduate students were excluded from the analysis to remove schools that almost exclusively cater to graduate students (such as medical campuses, which tend to have large endowments). ↑
- The public institutions with the largest endowments are Texas A&M University-College Station, University of Michigan-Ann Arbor, University of Virginia-Main Campus, and Ohio State University-Main Campus. ↑
- This includes undergraduate and graduate students. ↑
- There are institutions excluded from this analysis due to Carnegie Class and/or enrollment size with particularly high endowments per student, including Olin College of Engineering, Julliard School of Music, and Soka University of America. ↑
- There are a few exceptions, such as MIT and Cornell, which are land-grant universities. The University of Pennsylvania’s School of Veterinary Medicine receives a quarter of its operating budget from state funding. ↑
- Ranking institutions by endowment or endowment per student would not give information on how many students are benefitting from the institutions with different levels of endowments. Sorting students into deciles according to the endowment per student at their institution shows more easily the extent to which students are benefiting from endowments across higher education. ↑
- In other words, the top decile includes the approximately 10% of students at the institutions that have the highest endowments per student. If an institution fell between deciles, we allocated all the students from that institution to the decile with the smaller number of students without this institution, rather than splitting up students from an individual institution. We also could have allocated students this way. Since we are averaging across students and institutions in each decile, both methods are very similar. The actual percentages of students in each decile can be found in the appendix. ↑
- The share of endowments that is restricted varies across institutions. According to 2016 reports to Congress, 84 percent of Harvard’s endowment is restricted and 63 percent of New York University’s endowment funds are restricted. Grinnell College’s endowment is comprised of only about 31 percent restricted funds. The 2016 reports to Congress were responses to a list of questions to colleges and universities with endowments greater than $1 billion. See Hatch, Brady, Roskam (2016). Some institutions have posted their responses on their websites. ↑
- It may be difficult to maintain total spending when the spending rate from the endowment is increased, since it means the institution must reduce spending from unrestricted funds. ↑
- National Association of College and University Business Officers, “2016 NACUBO-Commonfund Study of Endowments” Press Release, https://www.nacubo.org/News/2017/3/Final-Report-for-the-2016-NACUBO-Commonfund-Study-of-Endowments-is-Now-Available ↑
- This change was in response to work done at the time by the Ford Foundation and James Tobin. James Tobin, “What Is Permanent Endowment Income?” The American Economic Review, vol. 64, no. 2, 1974, pp. 427–432. JSTOR, JSTOR, www.jstor.org/stable/1816077 and David Swenson, “Pioneering Portfolio Management: An Unconventional Approach to Institutional Investment” Simon and Schuster, 2009. pp 26-31 and Ford Foundation Advisory Committee on Endowment Management, “Managing educational endowments: Report to the Ford Foundation,” 1969. New York: Ford Foundation. ↑
- For reference, see Harvard University 2017 Financial Report at: https://finance.harvard.edu/files/fad/files/final_harvard_university_financial_report_2017.pdf. Harvard Magazine considered similar rough arithmetic in a Fall 2017 article: https://harvardmagazine.com/2017/09/harvard-endowment-37-1-billion-on-8-1-percent-return ↑
- An interesting question is whether other policies put in place by the current administration have increased expected real future returns on financial assets, offsetting the impact of the excise tax for these institutions. The increase in the stock market has resulted in significant positive returns on most endowments over the last 12 months, but the issue is the long run real return. ↑
- See plans for the Reducing Excessive Debt and Unfair Costs of Education Act of 2015, https://www.documentcloud.org/documents/2711324-Rep-Tom-Reed-University-Endowment-Legislation.html ↑
- An example of the letters sent to high-endowment schools can be viewed at https://www.documentcloud.org/documents/2711522-Congressional-Letter-to-Colleges-Re-Endowments.html ↑
- As in Figures 1, in Figures 7 through 11, students are ranked by the endowment per student at the institution they attend, and the deciles refer to deciles of students. The numbers of institutions in each decile differ. ↑
- Education and related expenses include spending on instruction, student services, the education share of spending on central academic and administrative support, and operations and maintenance. The metric was compiled using 2015 data by the Delta Cost Project at American Institutes for Research. 1,316 of the 1,375 institutions in the other analyses are included in this analysis. The remaining institutions have missing data. ↑
- This spending metric was obtained through IPEDS. It includes expenses for activities specifically organized to produce research outcomes and either commissioned by an agency external to the institution or separately budgeted by an organizational unit within the institution. The category includes institutes and research centers, and individual and project research. ↑
- Foundations face a minimum spending constraint that prevents them from what is considered excessive savings. ↑
- In addition to the Tax Cuts and Jobs Act, see proposals from Congressman Tom Reed, who has circulated draft bills that would require large endowment schools to spend a set amount of money on tuition assistance or face penalties (such as losing tax exempt status). ↑
- Congress sent a list of questions to colleges and universities with endowments greater than $1 billion. See Hatch, Brady, Roskam (2016). Some institutions have posted their responses on their websites. ↑
- Berea College, “Quick Facts,” https://www.berea.edu/. ↑
Attribution/NonCommercial 4.0 International License. To view a copy of the license, please see http://creativecommons.org/licenses/by-nc/4.0/.