Diversity in the New York City Dance Community
Foreword
by Leah Krauss, Senior Program Officer for Dance and Special Projects, Mertz Gilmore Foundation, and Lane Harwell, Executive Director, Dance/NYC
Creating an inclusive and equitable workforce in dance and culture, as in any industry, requires baseline demographic data to guide action and measure progress over time. Commissioned by the Mertz Gilmore Foundation, this report by Ithaka S+R furthers the movement to create equity in dance by shedding light on the gender and racial makeup of the dance workforce, both artistic and administrative, as represented by the staffs and boards of the New York City Department of Cultural Affairs’ grantees.
Leveraging data available from Ithaka S+R’s “Diversity in the New York City Department of Cultural Affairs Community” published in January 2016,[1] and building on a prior study on North American arts museums commissioned by The Andrew W. Mellon Foundation,[2] this report offers some encouraging news for dance. In terms of gender and racial diversity, dance leads the major disciplines of theater, music, and museums among the department’s grantees. At 58%, the percentage of female dance workers significantly outpaces the wider cultural workforce (53% female) and even the New York City population as a whole (also 53% female, according to recent census data).
Using categories from the 2000 U.S. Census, the data show 54% of the dance workforce is non-Hispanic white, 17% is black or African American, 10% is Hispanic, 7% is Asian, 3% is two or more races, 0.5% is Native Hawaiian or Pacific Islander, and 0.3% is American Indian or Alaskan Native. These data suggest that dance organizations are less racially homogeneous than the wider cultural workforce, which is 62% non-Hispanic white, and could play a role in modeling inclusive practices to colleague disciplines.
But the data also show plenty of room for progress. For instance, while racially diverse relative to the full arts sample, dance does not come close to reflecting the racial makeup of the New York City population, which is 33% non-Hispanic white. In general, racial diversity in the workforce decreases the farther one looks up the ladder of seniority, from junior to senior staff positions. Approximately 72% of dance board members are non-Hispanic white. The data do not get granular enough to show the scarcity of female choreographers and artistic directors, especially at the largest dance institutions, a fact well known to field insiders.
Above all, the findings make the case for action to help the dance workforce to better mirror the city’s racial diversity. They invite constructive responses for policy and programs to address racial inequities that exist along the continuum of career readiness and advancement in dance—from enhanced classroom practices to paid internships and leadership and antiracism training at dance organizations.
While work to increase racial diversity in dance is of clear value, concurrent action is needed to address workforce demographics that were not a meaningful part of the study and are too often excluded from discussions about diversity, equity, and inclusion—for instance, disability, LGBTQ, and socioeconomic status. Recent Dance/NYC research at the nexus of disability and dance reveals the paucity of disabled artists and the entrenched patterns of exclusion in our field that need to be addressed.[3]
The opportunity for local government and philanthropic action to create equity in dance is particularly ripe because the NYC Department of Cultural Affairs is starting work on the city’s first comprehensive cultural plan this year, and is actively identifying and supporting new ways to promote diversity in the cultural community. The Theater Subdistrict Council has announced a $2 million funding initiative to train underrepresented theater professionals, a model that we recommend adapting for dance. Taking an expansive view to this work is critical to ensuring that dance becomes truly inclusive of the interests of all of New York City’s artists and communities.
A study like this involves many people. For their vision in assessing their grantees, we are grateful to the staff of the New York City Department of Cultural Affairs and Commissioner Tom Finkelpearl; for their insights, we thank Deputy Commissioner Edwin Torres and Deputy Commissioner and General Counsel Kristin Sakoda. For its early support of Diversity in the New York City Department of Cultural Affairs Community, we thank the Rockefeller Brothers Fund and Program Director Ben Rodriguez-Cubenas. At Ithaka S+R, Liam Sweeney took the lead on investigating the data as it relates to dance organizations. Most important, we thank the dance groups who willingly gave their time and effort to make the research a success. The biggest way we can repay those efforts is by making the most meaningful use of the information.
Methodology
In early 2015, Ithaka S+R undertook a project to understand the demographics of cultural organizations in New York City. With financial support from the Mertz Gilmore Foundation and the Rockefeller Brothers Fund (RBF), Ithaka S+R administered a survey to recipients of Department of Cultural Affairs (DCLA) funds in the 2014 fiscal year. The survey population exceeded 1,000 organizations. About 90% of them completed the survey.[4]
The survey involved two steps, and provided two types of data. First, the grantee submitted a spreadsheet with the demographics of each staff and board member affiliated with the organization. Demographic categories included race, ethnicity, gender, disability status, and decade born. The survey instrument also collected human resources data about jobs, level of seniority, employment status, and decade hired. The demographic categories were designed to be compatible with the census. The human resources categories were developed with the help of DCLA.
After receiving the spreadsheet, the respondent was asked to complete a questionnaire exploring barriers to increasing diversity in the organization, as well as successful initiatives toward that end.[5] The results were aggregated and presented to DCLA, Mertz Gilmore, and RBF in late 2015, and published as a report in early 2016.
After sharing the findings, the Mertz Gilmore Foundation expressed interest in analyzing the results specifically for dance organizations. The following analysis resulted from subsequent discussions of the value of a discipline specific analysis of the existing data.
Tailoring the Quantitative Analysis
Of the 119 organizations DCLA categorized as “Dance,” 105 (88%) responded to the survey. Working with Lane Harwell of Dance/NYC, we endeavored to understand whether the existing data set needed to be adapted in any way to tailor our analysis for the dance discipline. Certain organizations that were categorized as multi-discipline or folk arts by DCLA were identified as primarily dance organizations. They were included in the analysis. In order to make geographic comparisons, the borough of each organization was included. Finally, Ithaka S+R adapted the job category graphs (Figures 6 and 21). The base population for these graphs in the “Diversity in the New York City Department of Cultural Affairs Community” report included volunteers, as well as staff and board members. In this report, the population is updated to exclude volunteers from all categories except board members. This more accurately reflects the paid staff positions without distorting the number of board members, many of whom were also characterized as volunteers. To streamline graphs, categories reflecting less than one percent were suppressed.
Ithaka S+R is disappointed not to be able to report on disability in dance. The survey of DCLA organizations did ask respondents to identify staff as persons with or without disabilities. However, nearly zero organizations responded with records reflecting staff with disabilities. This clearly does not reflect this population within the workforce of New York City’s cultural sector. We therefore determined that the cultural sector in New York does not yet maintain these records or does not feel comfortable reporting them.
This report follows a presentation of findings by the DCLA staff, Deputy Commissioner Edwin Torres and Deputy Commissioner and General Counsel Kristin Sakoda, at the Dance/NYC Symposium in February 2016.
Findings
There are just under 3,700 paid staff, nearly 1,000 board members, and 375 other volunteers among respondents in the dance community. Half of the organizations have fewer than 15 staff. The eight organizations with over 100 staff make up just under 50% of the total staff population. This staff concentration reflects New York City cultural organizations on the whole—there are a handful of large organizations and many small ones.
Gender
Aggregate Measure
Figure 1: Gender Total and Percent
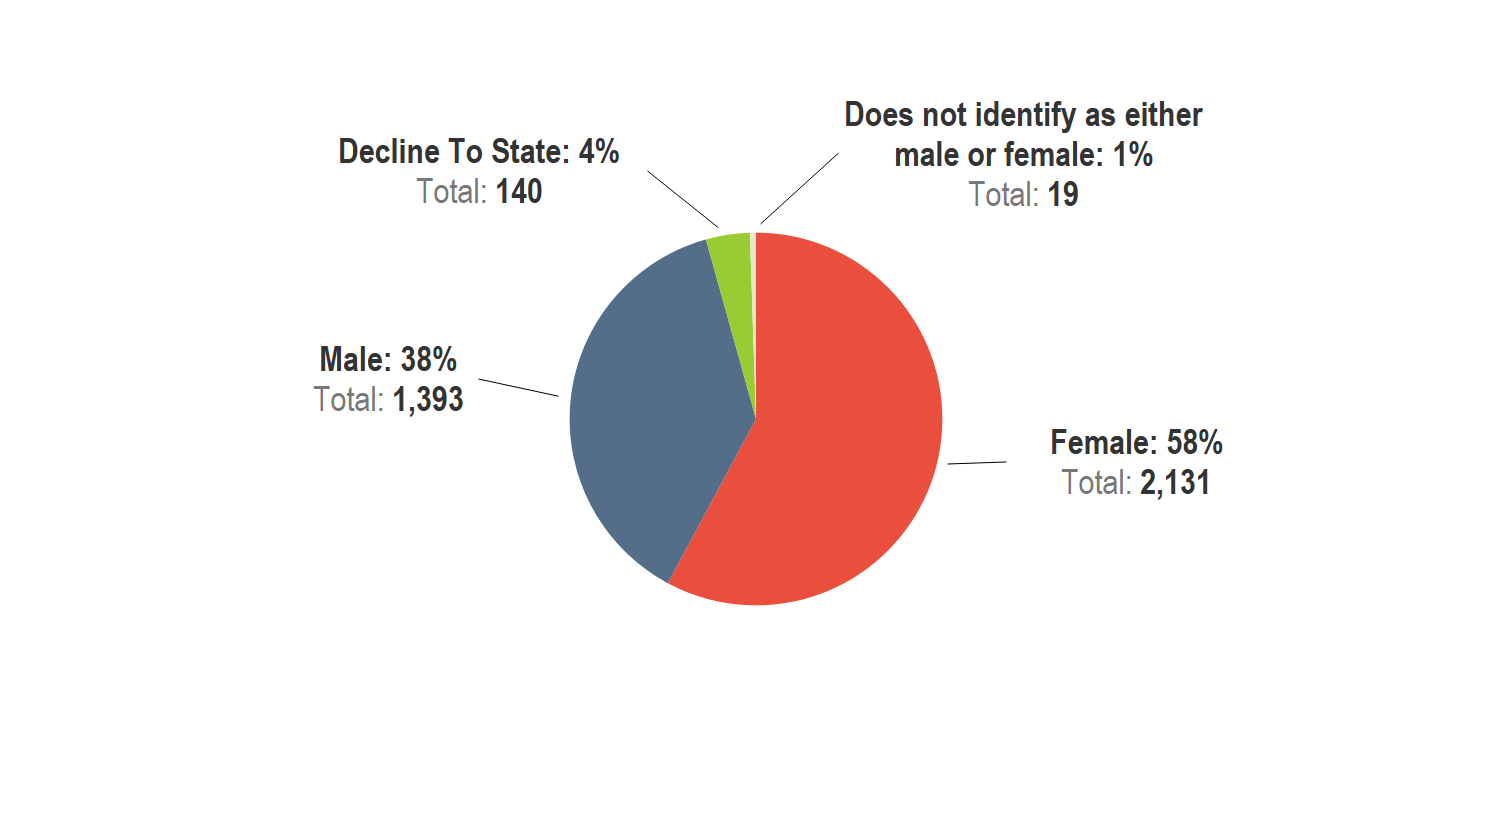 Across the discipline, staff are 58% female and 38% male, as seen in Figure 1. Just under 20 dance staff did not identify as either male or female, and about 4% declined to state their gender. As a discipline dance is five percentage points more female than DCLA grantees on the whole, as well as New York City overall.
Figure 2: Total Dance Staff and Percent Female by Borough
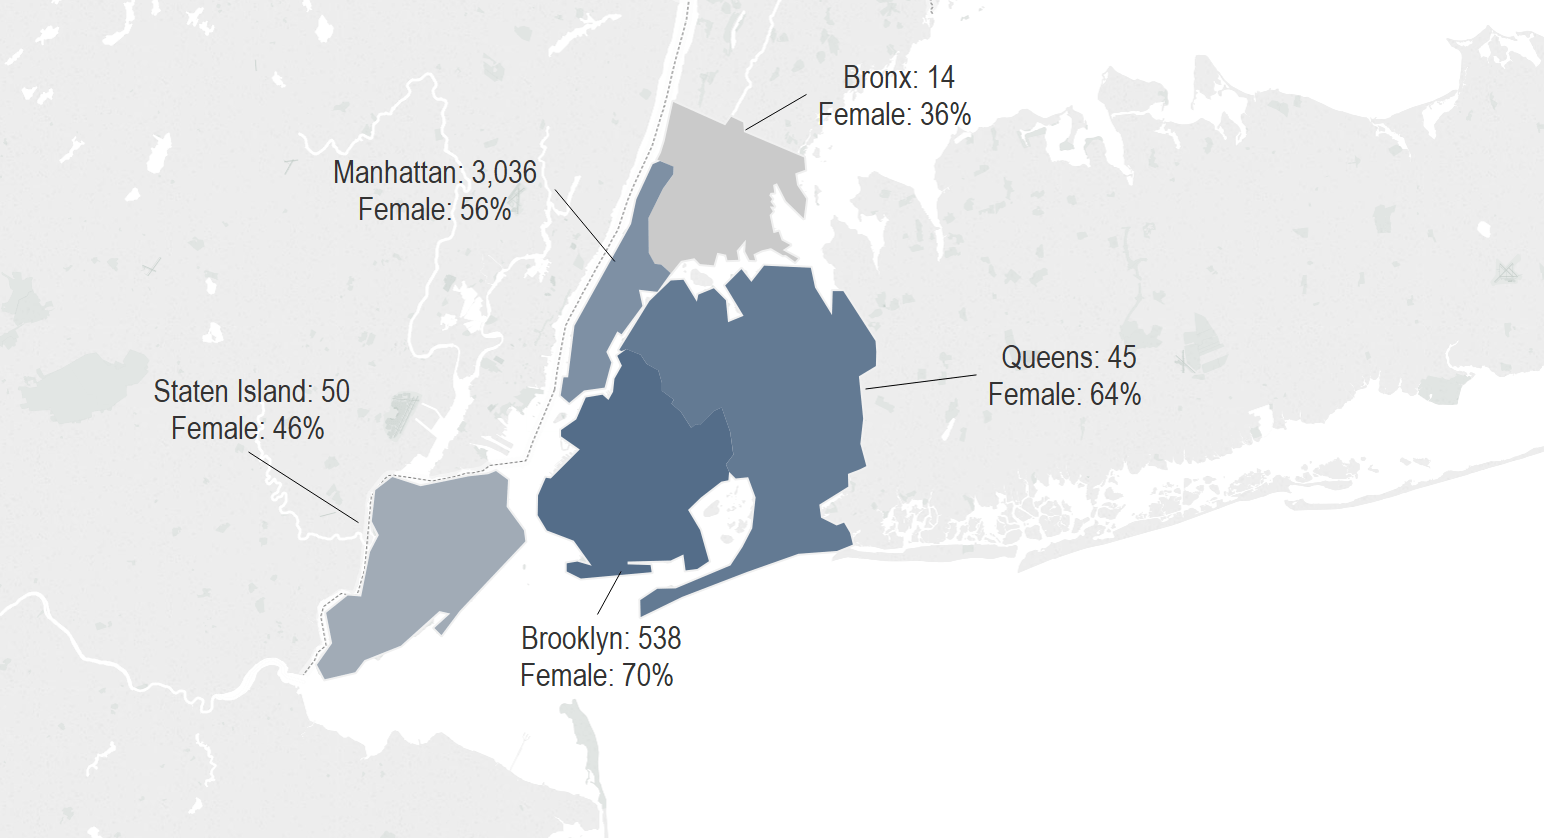
Figure 2 shows the number of dance staff in each borough, as well as the percentage of female staff. Each borough is shaded from light to dark to reflect the percentage of female staff from least to greatest. Most dance organizations are in Manhattan, where over 3,000 staff are employed. Manhattan dance staff are 56% female. Brooklyn is the next largest borough for dance, with over 500 employed. It is the most female at 70%. Queens (64%), Staten Island (46%), and the Bronx (36%) have 50 staff or fewer. How do these percentages for dance compare to the overall population of each borough? Manhattan is a near match, the borough is 53% female. Brooklyn is also 53% female; dance staff in Brooklyn are 17% higher than the residential population. Queens, Staten Island, and the Bronx are 52%-53% female. Note that staff are not necessarily residents of the boroughs they work in.
Figure 3: Gender by Level Total and Percent
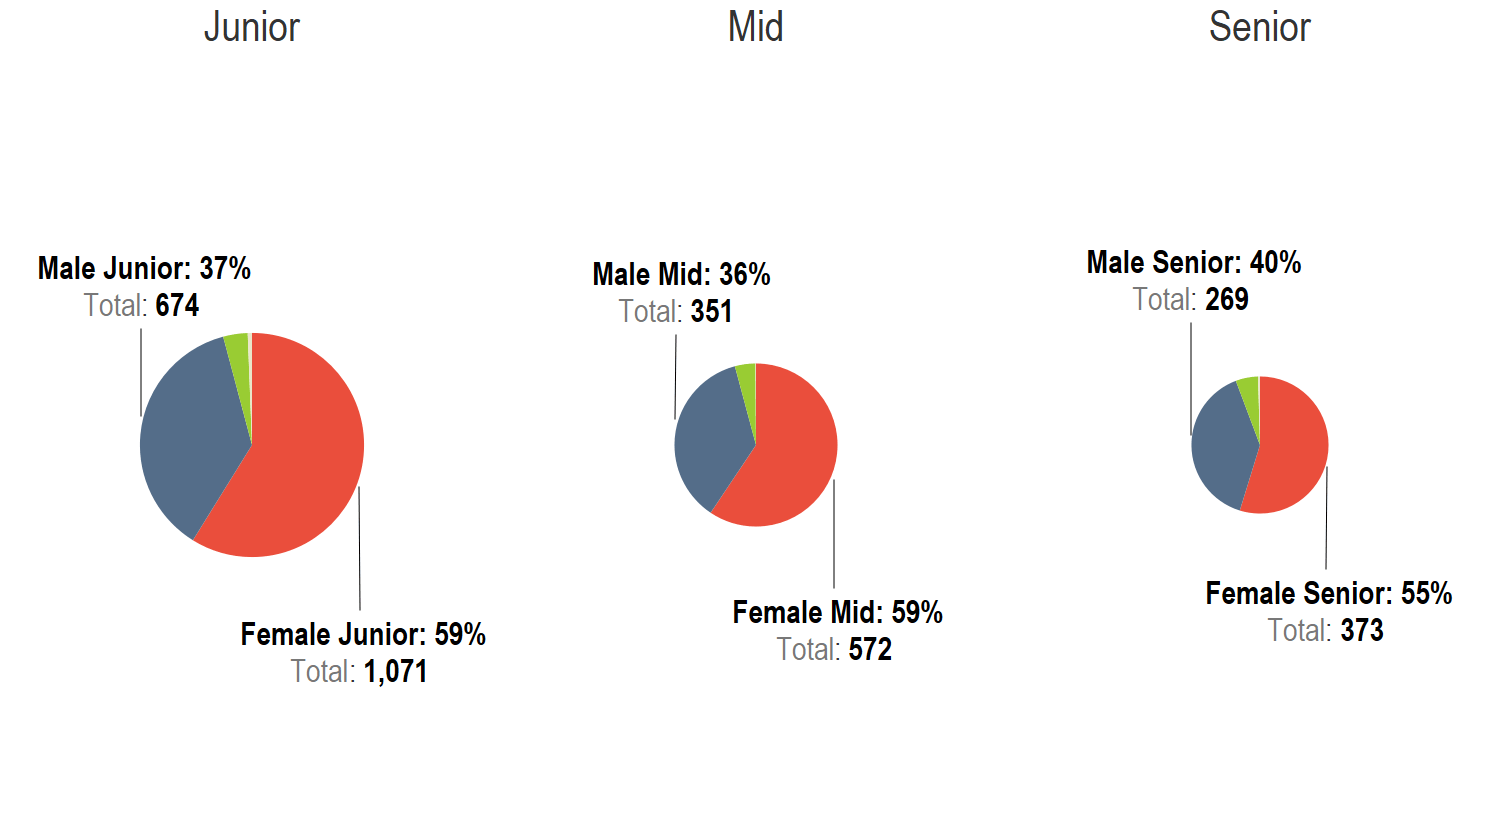 Figure 3 shows the total number and percentage of dance staff based on level of seniority. The size of each graph corresponds to the number of staff in each category. For the DCLA community we observed a pattern: staff grew slightly more female as their level of seniority increased.[6] Among dance organizations we found the reverse, that positions are about 4% less female in senior roles than junior roles.
Figure 4: Volunteer Gender Total and Percent
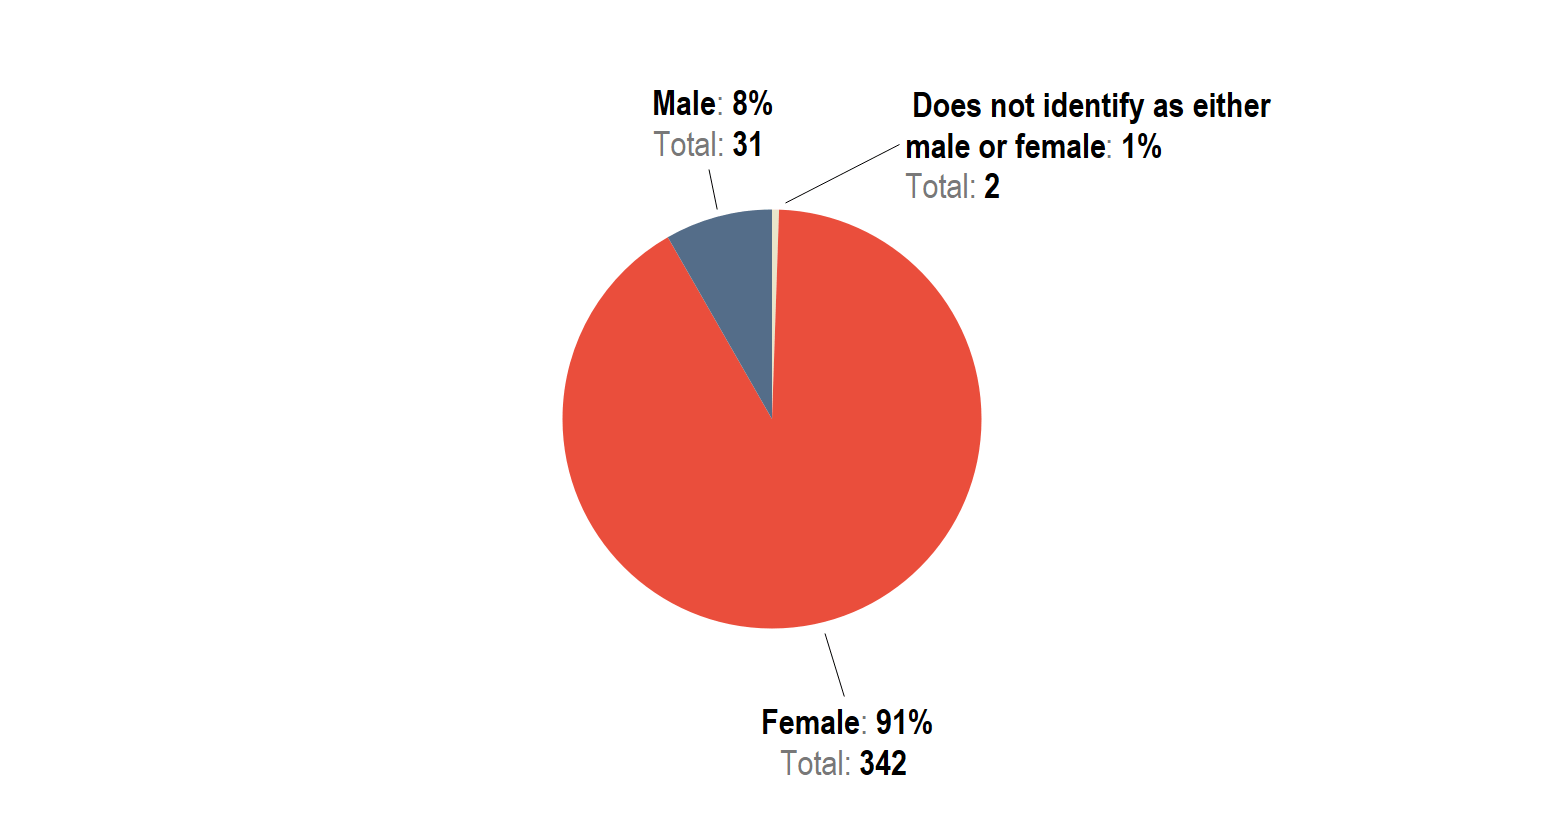 Figure 4 shows the gender composition of volunteers among dance organizations. Volunteers in the dance community are overwhelmingly female—over 90%. Most of these volunteers were reported for $10+ million organizations (over 200 of them). Volunteers in $10+ million organizations are 99% female. 94% of those volunteers are in community engagement. All of them are female. We return to this finding when looking at volunteers by race.
Budget
Figure 5: Gender Budget Category Total and Percent Female
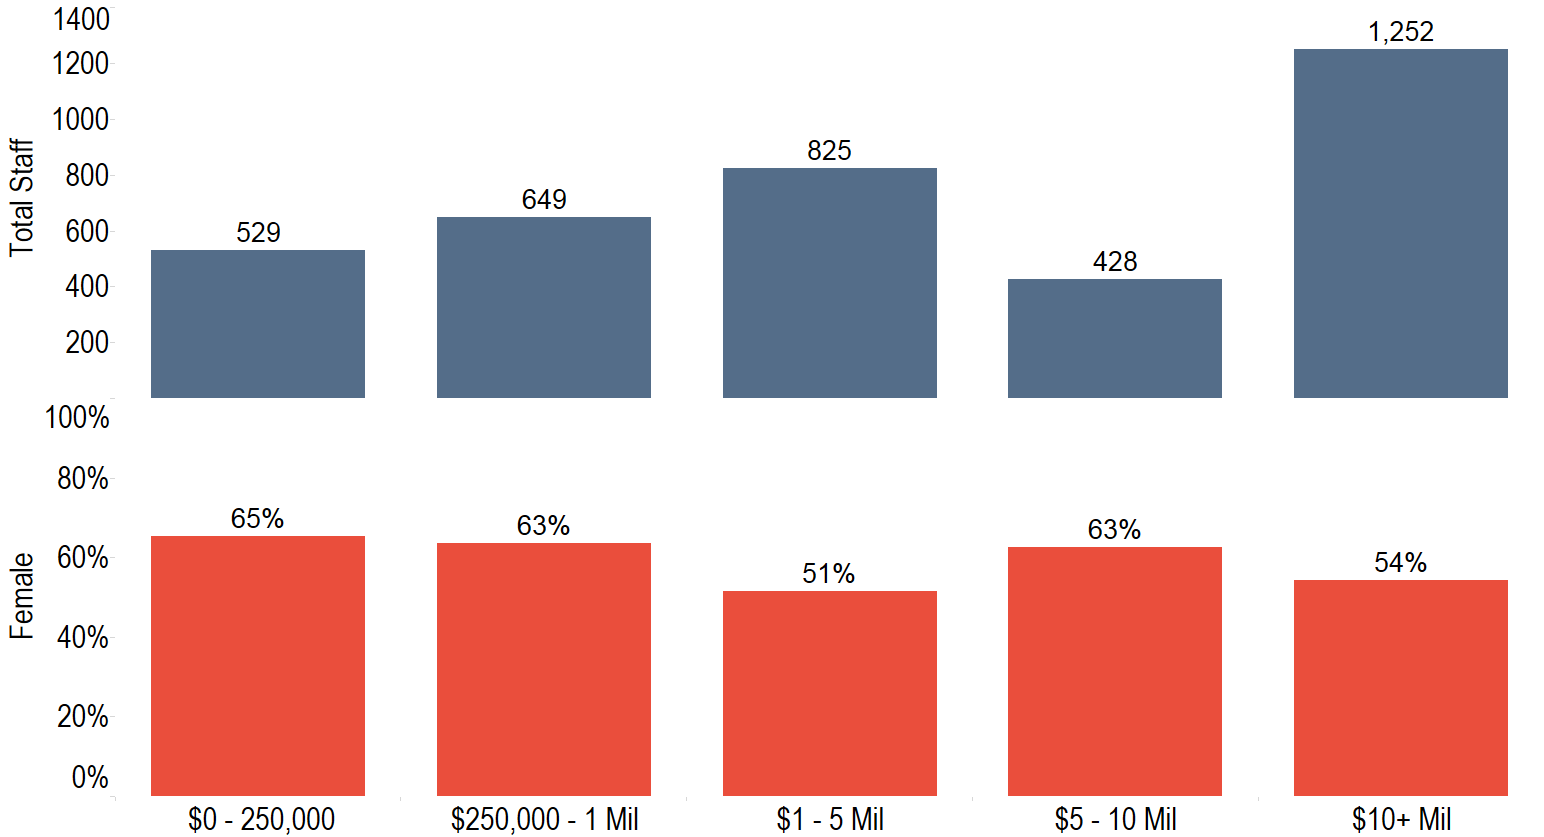
Figure 5 shows staff by budget category. The top graph shows the total number of staff in each budget category, and the bottom graph shows the percent of female staff in that category. While nearly all volunteers at $10+ million organizations are female, the staff for those organizations is less female than the total dance staff (54% vs 58%). A large number (15%) of dance employees in the $1-5 million category declined to state gender. Otherwise, the pattern across budget categories is similar between dance organizations and DCLA grantees.
Job Type
Figure 6: Gender Job Type Total and Percent Female
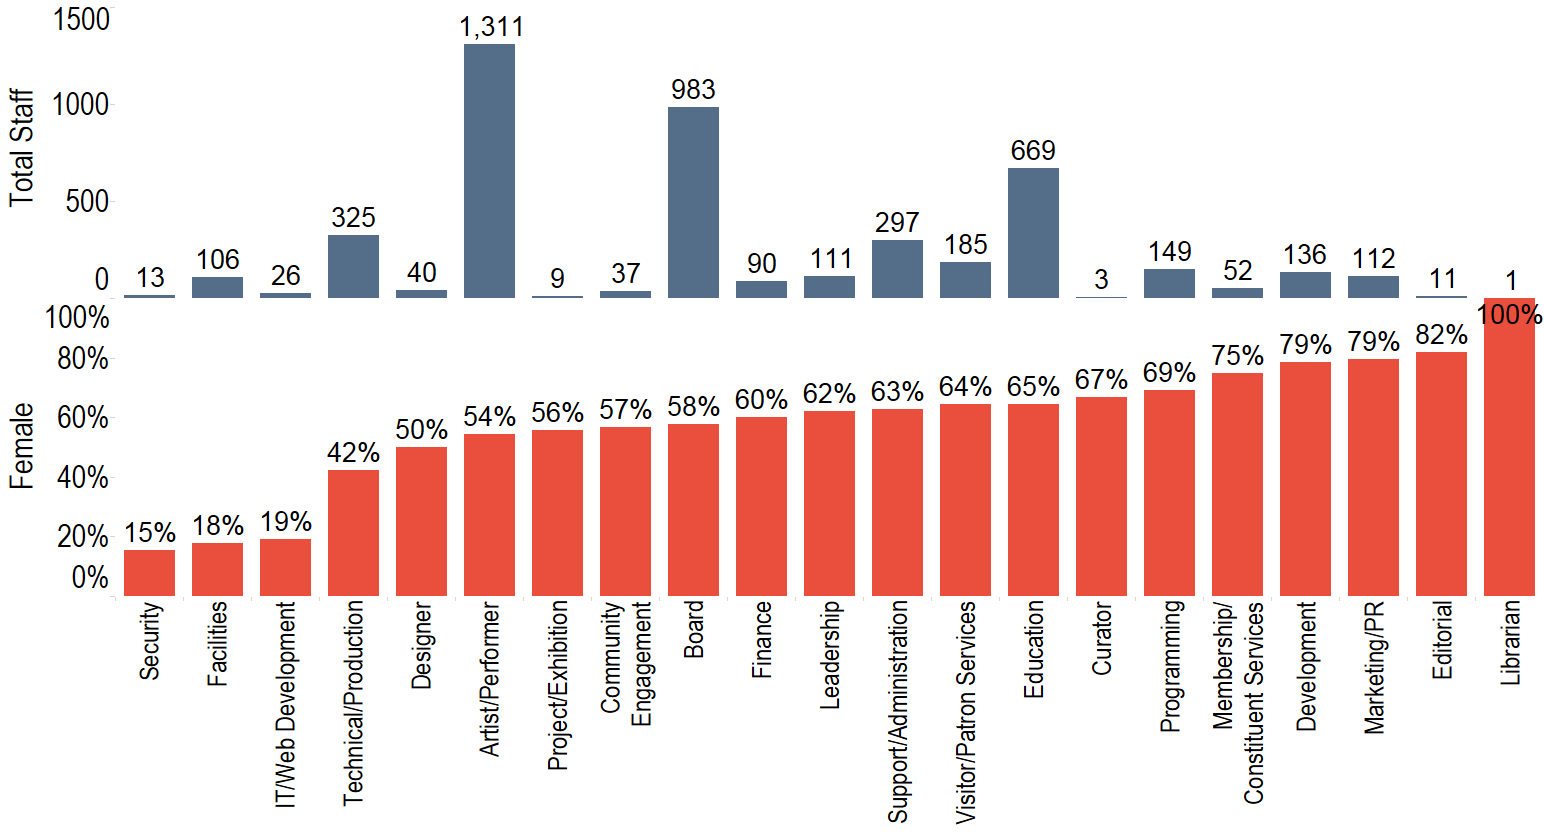
Figure 6 shows the number of staff in each job type on the top bar graph, and the percentage of female staff in that category on the bottom. Unsurprisingly, only a subset of the job types were heavily recorded for dance organizations. We found a pattern similar to DCLA grantees and the museum community: the percentage of men is highest in security and facilities positions. Figures 7-10 take a closer look at several of the larger job categories. As mentioned in the methodology, this graph excludes volunteers from all positions except for board members.
Figure 7: Artist/Performer Gender Total and Percent
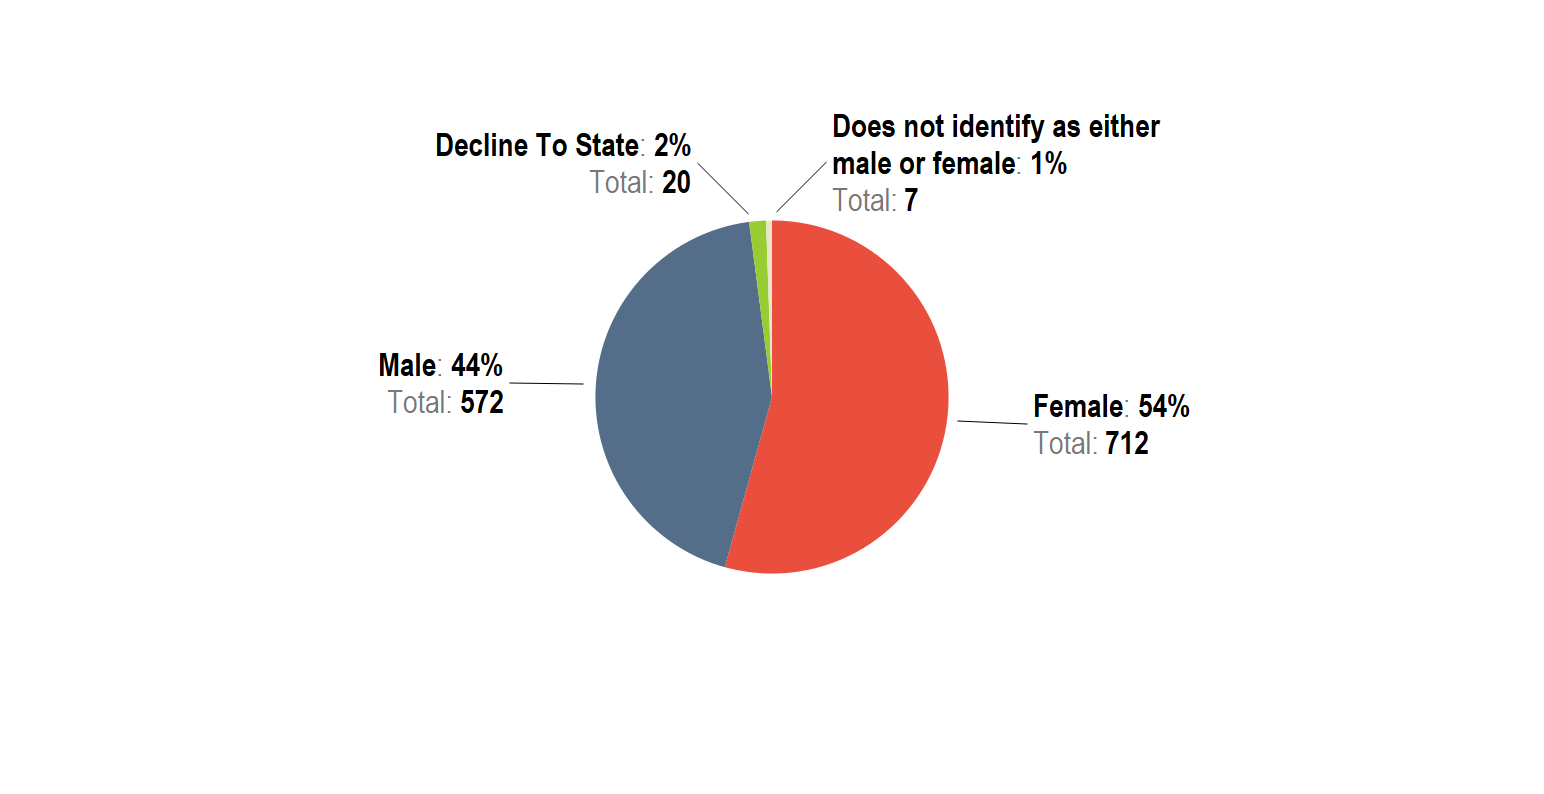 Figure 7 shows Artists/Performers in dance organizations are 54% female, five percentage points higher than DCLA funded organizations.
Figure 8: Leadership Gender Total and Percent
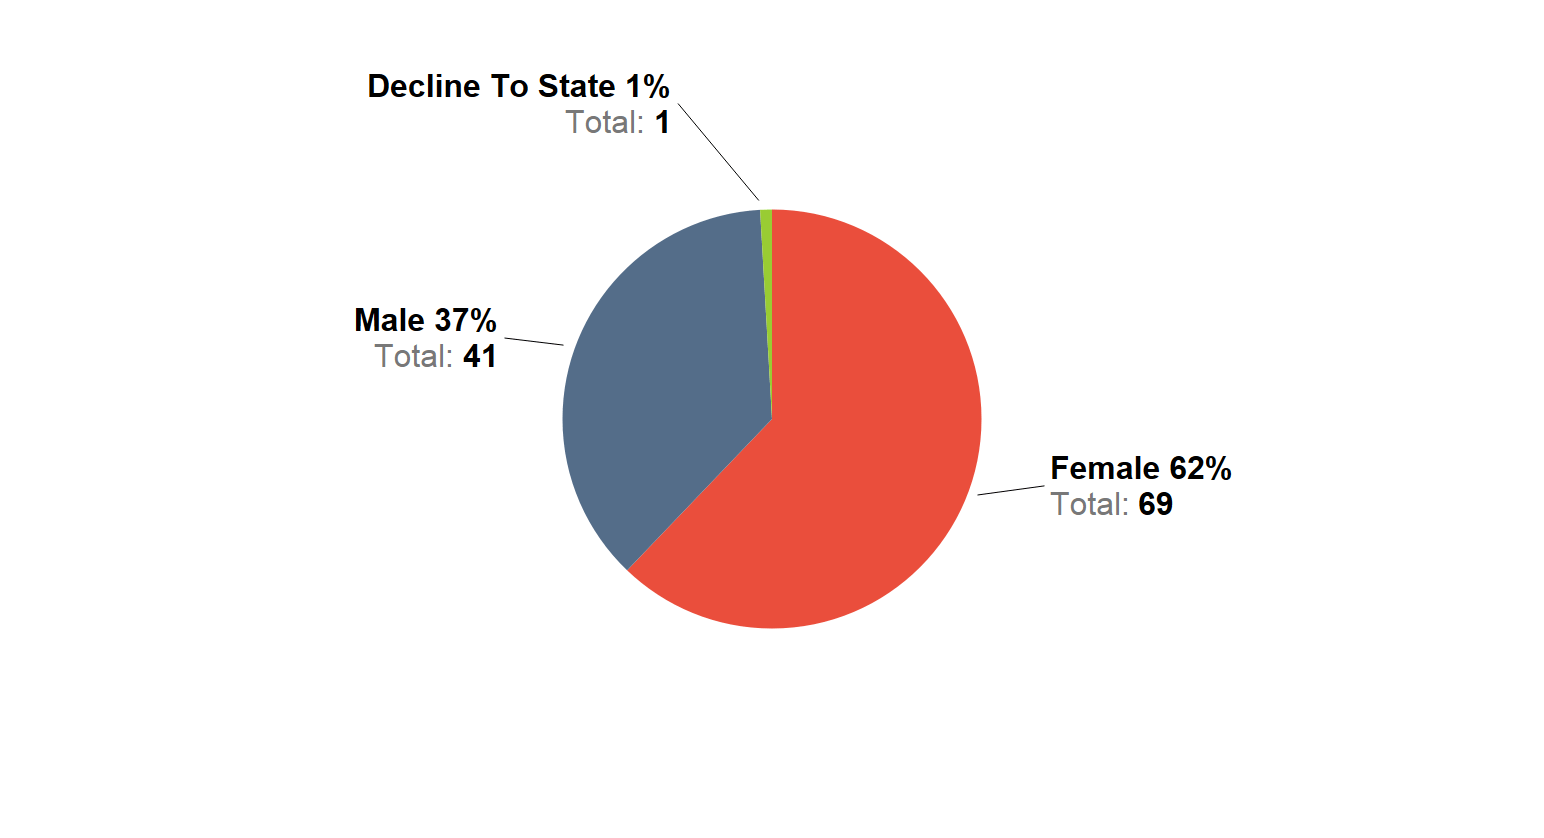 Figure 8 shows the total number and percent of leadership positions by gender. Leadership positions are 62% female, also five percentage points more female than DCLA as a whole.
Figure 9: Board Gender Total and Percent
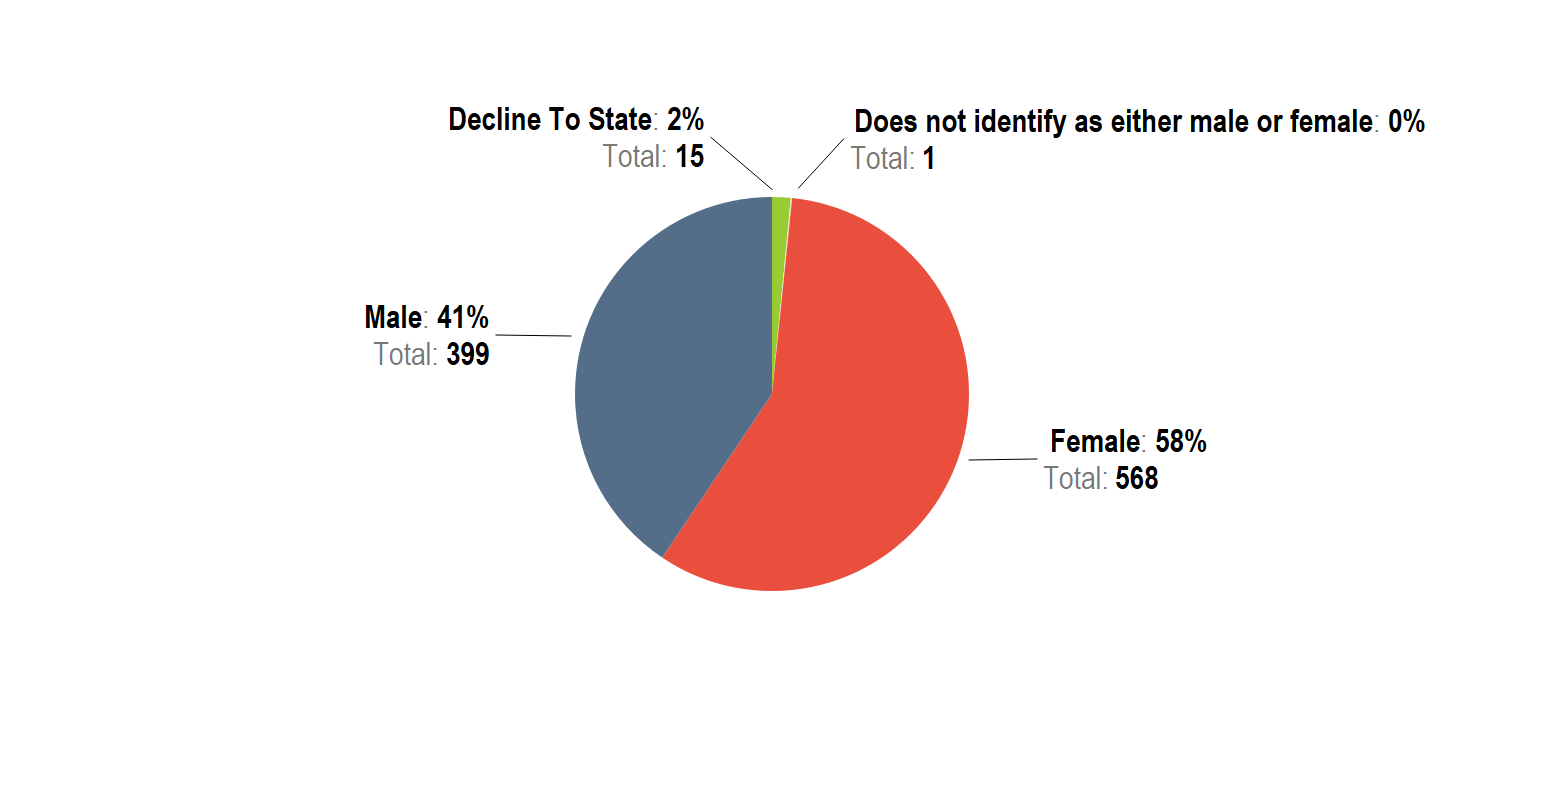 Figure 9 shows the total number and percent of board members by gender. Board members are 11 percentage points more female in dance organizations than among all DCLA grantees.
Figure 10: Technical/Production Gender Total and Percent
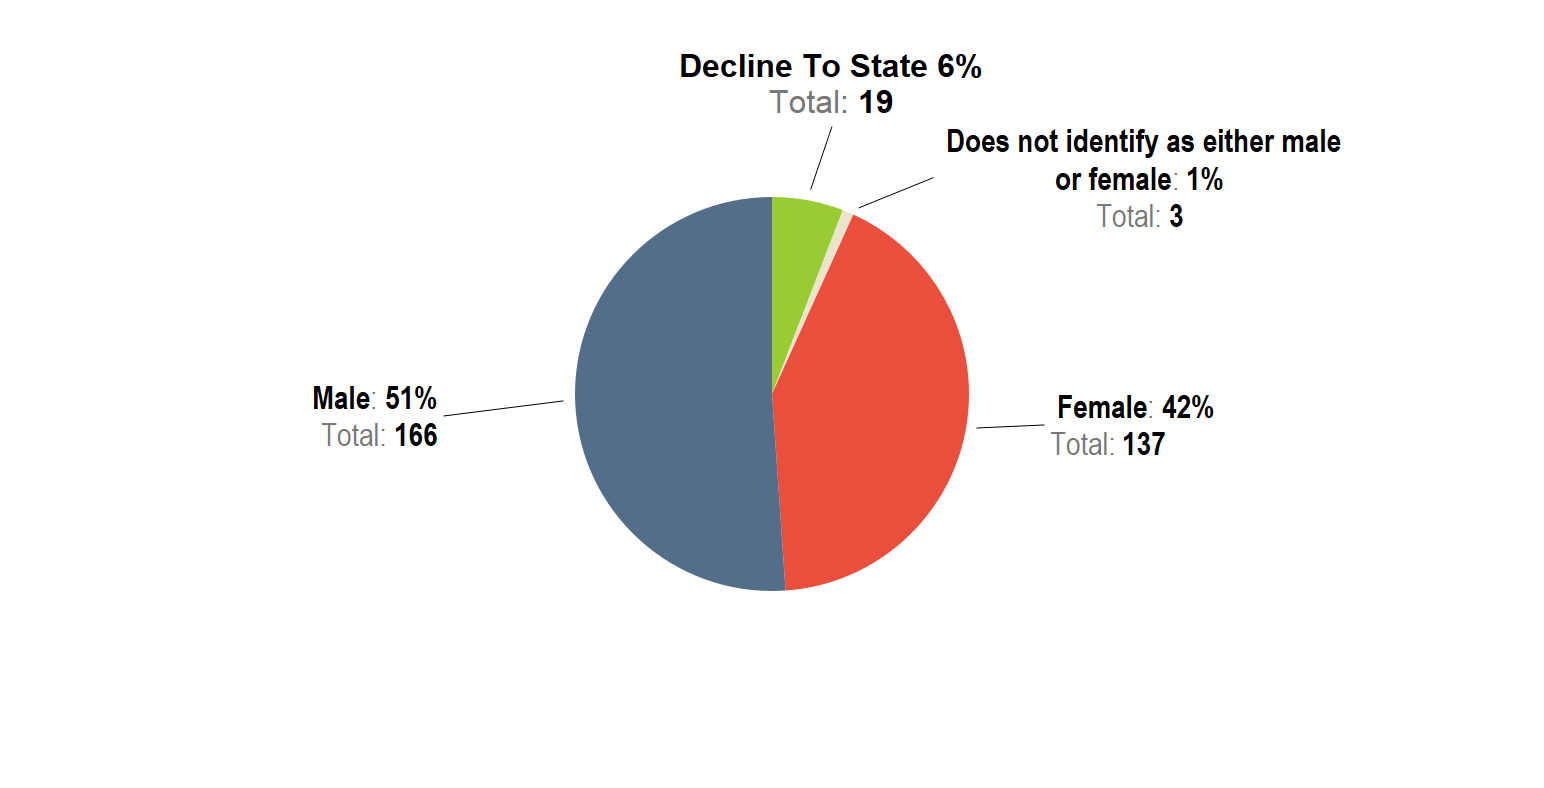
Figure 10 shows the total number and percent of technical/production staff for dance organizations. Technical/production staff are eight percentage points more female than the DCLA community overall.
Decade Born and Decade Hired
The survey instrument collected data on the decade born and decade hired of each staff member in order to understand how age relates to race and gender, and to gauge the degree to which shifting city-wide and national demographics are reflected in recently hired staff.
Figure 11: Decade Born Gender Total and Percent
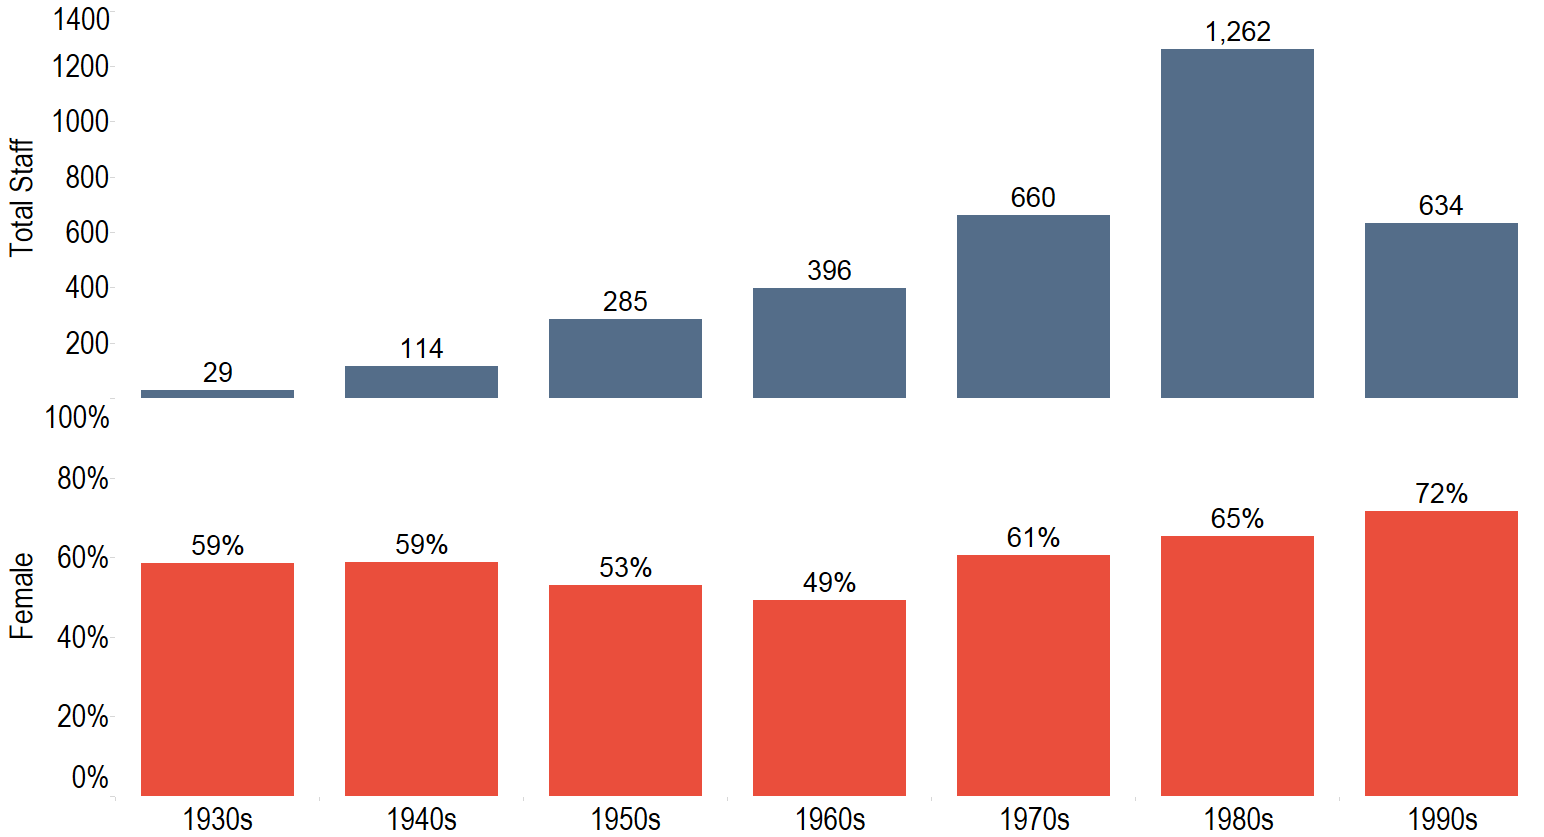
Figure 11 shows the total number of staff born in a given decade on the top bar graph, and the percent of female staff born in that decade. We see a similar trend when looking at decade born for dance organizations as compared to the DCLA community. There is a notable dip in the 1960s. This is explored further in Figures 12-14.
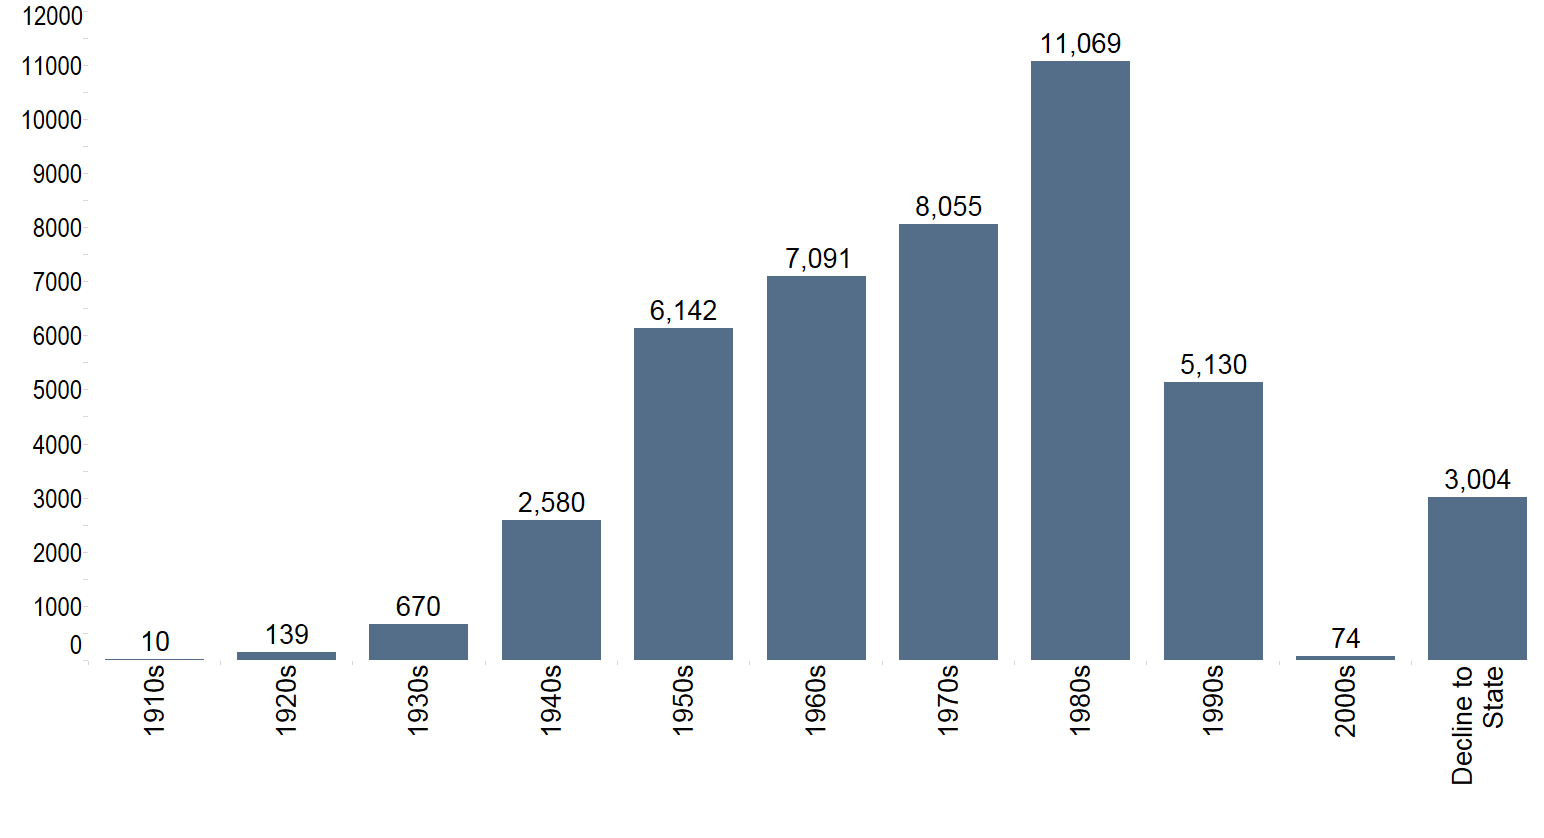
Figure 12: Decade Born Dance Artists Overall
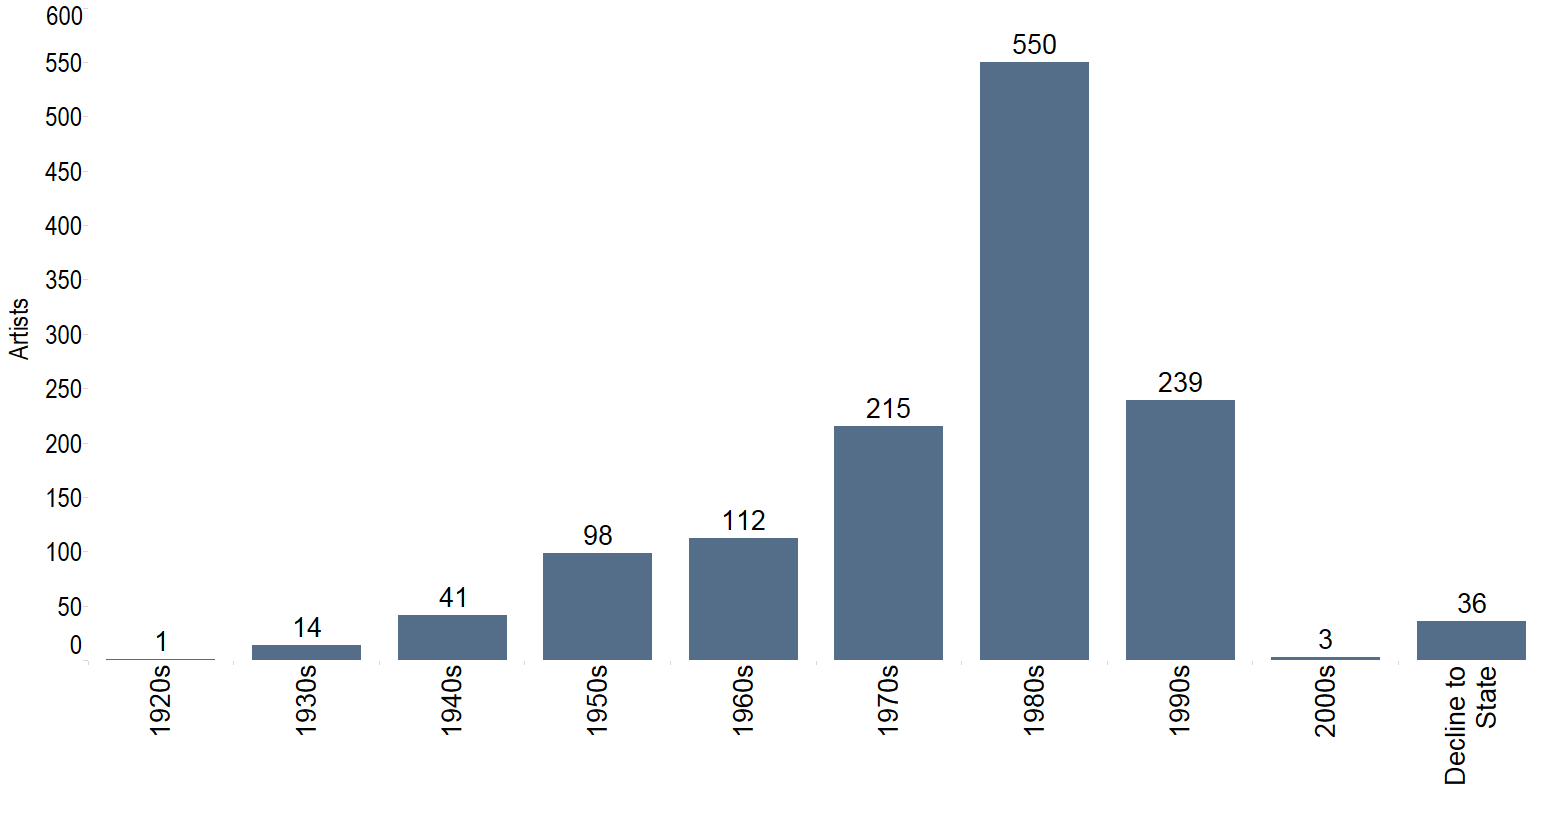 Figure 12 shows the total number of artists/performers in the dance discipline by their decade of birth. This shows us that a plurality of artists/performers in this discipline were born in the 1980s. The next largest age group are artists/performers born in the 1990s.
Figure 13: Decade Born DCLA Grantee Artists/Performers Overall
 For DCLA grantees overall, artists/performers born in the 1970s are the second largest age group, as seen in Figure 13. This reflects that artists/performers in the dance community are younger than the overall DCLA community.
Figure 14: Artists/Performers born in the 1960s
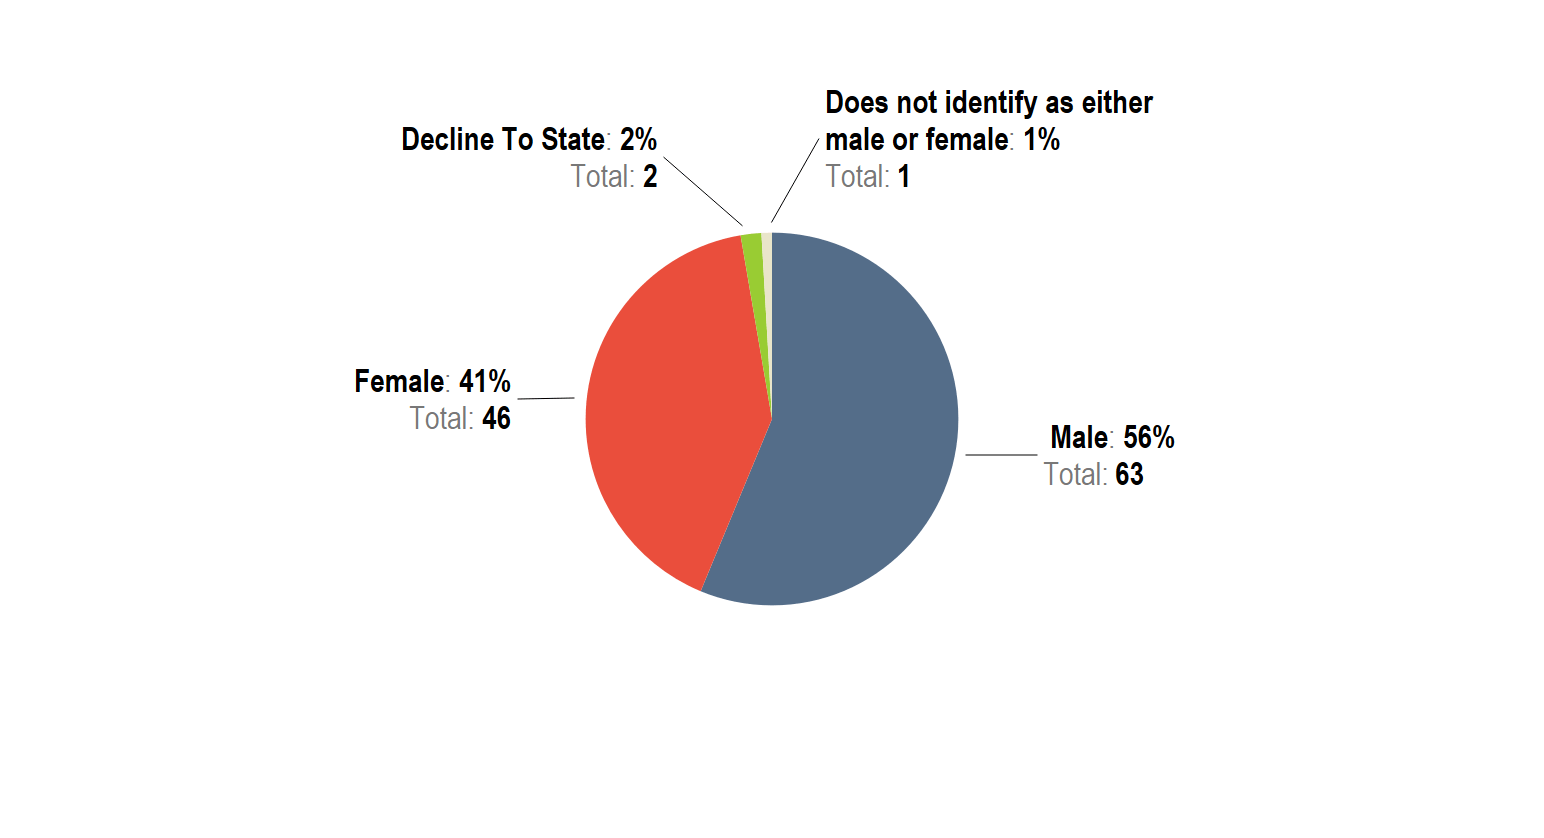 Figure 14 shows that artists/performers born in the 1960s are 56% male, 12 percentage points higher than the average for artists/performers in the dance discipline. This partially accounts for the dip seen in the “1960s” category in figure 11.
Figure 15: Decade Hired Gender Total and Percent
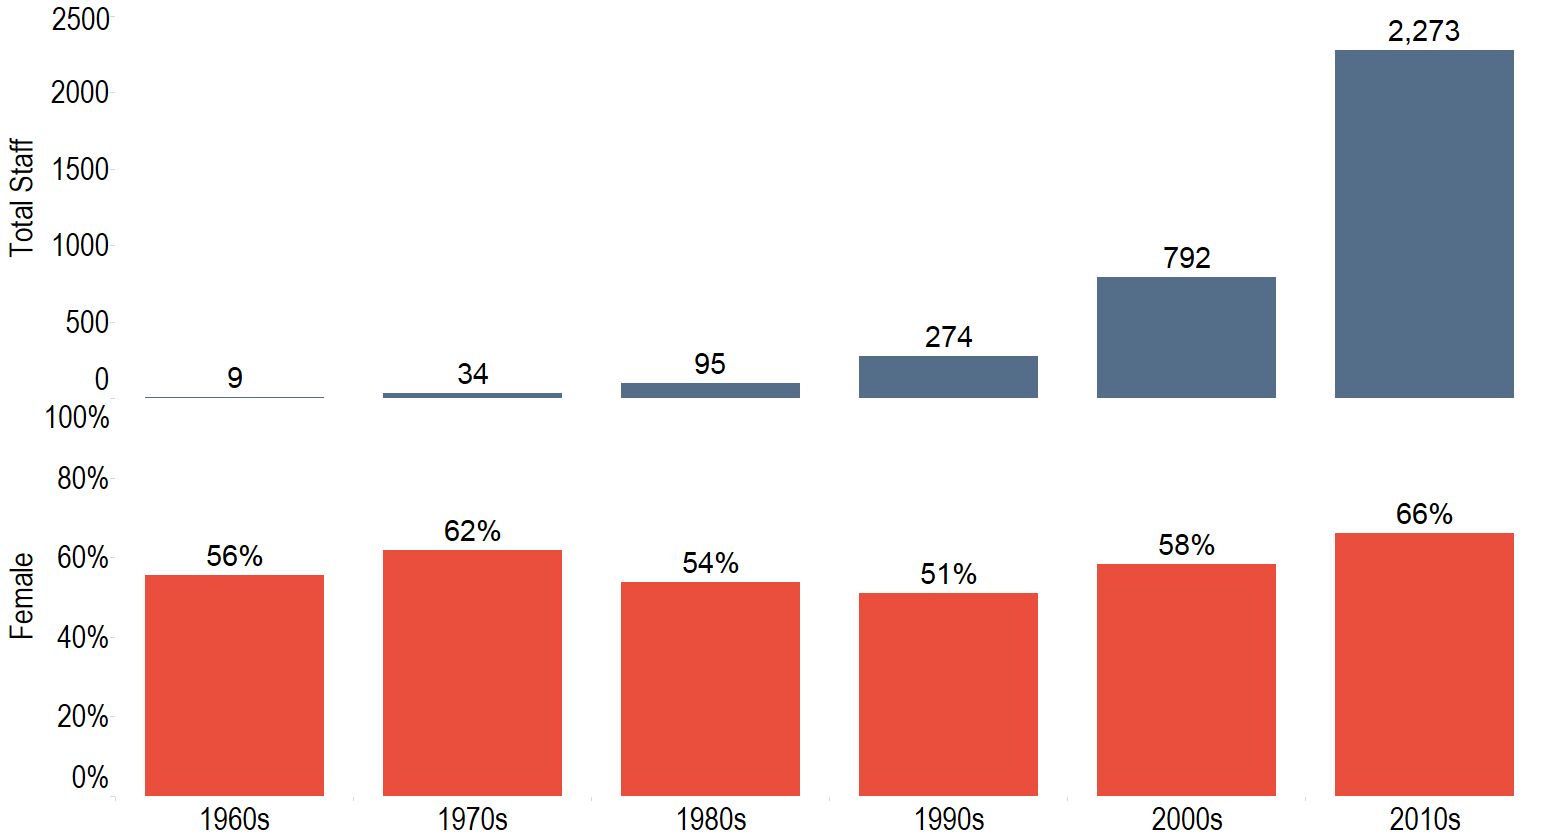
Figure 15 shows the number of staff born in a given decade on the top bar graph, and the percent of female staff in that decade on the bottom. When looking at the staff of dance organizations by decade hired, there is a pattern similar to DCLA as a whole; the percentage of female staff is highest in the largest category—those hired in the 2010s.
Race/Ethnicity
Aggregate Measure
Figure 16: Race Total and Percent[7]
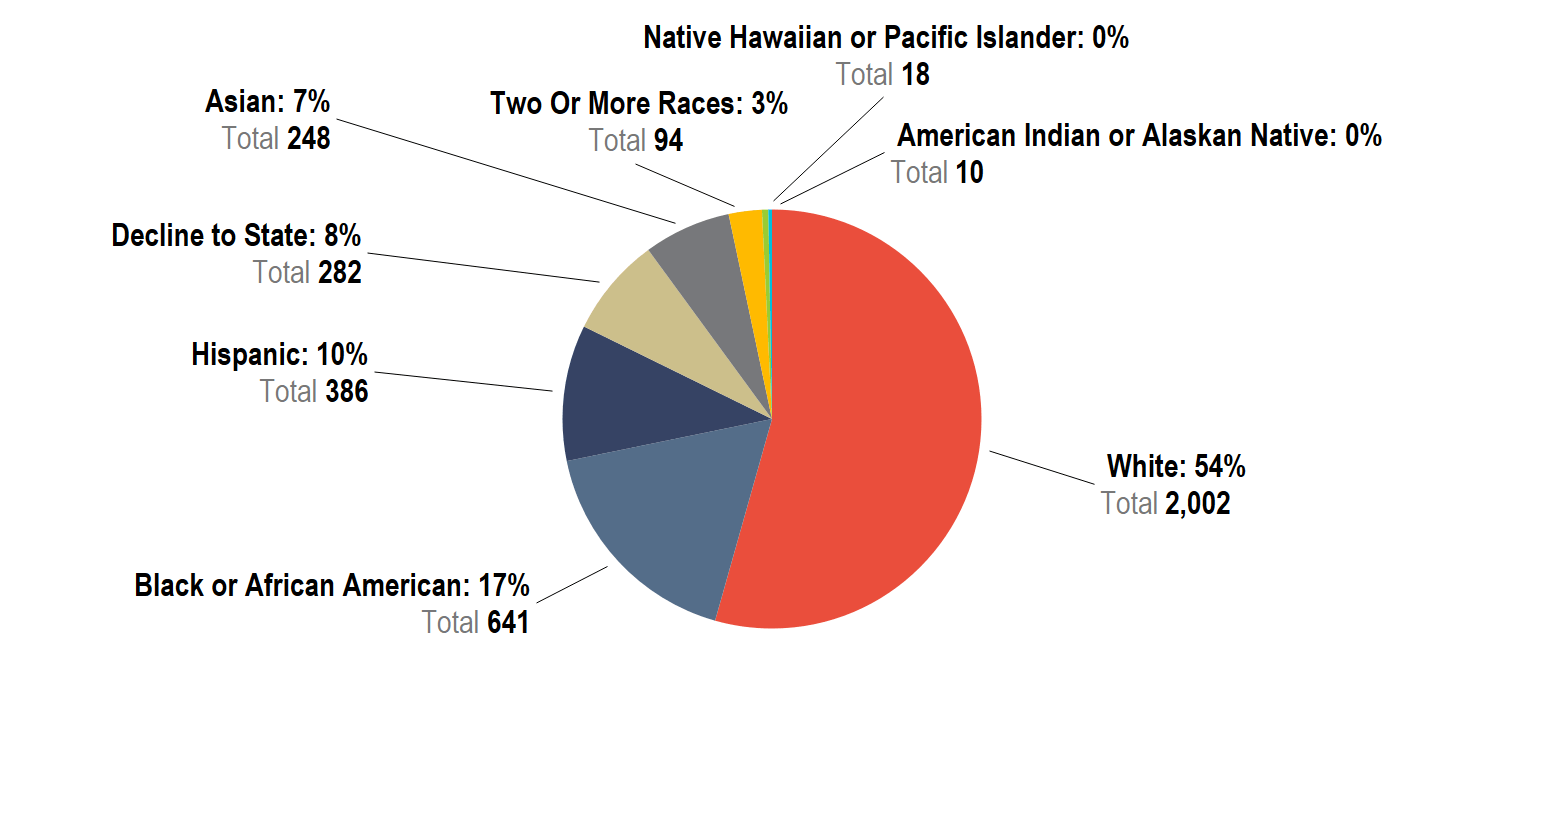 Figure 16 shows the total number and percent of dance staff in each racial category.[8] DCLA grantees as a whole are eight percentage points more white than dance staff. Black or African American staff are two percentage points higher in the dance discipline than DCLA overall. “Decline to State” is five percentage points higher among dance organizations.
Figure 17: Total Staff and Percent Race by Borough
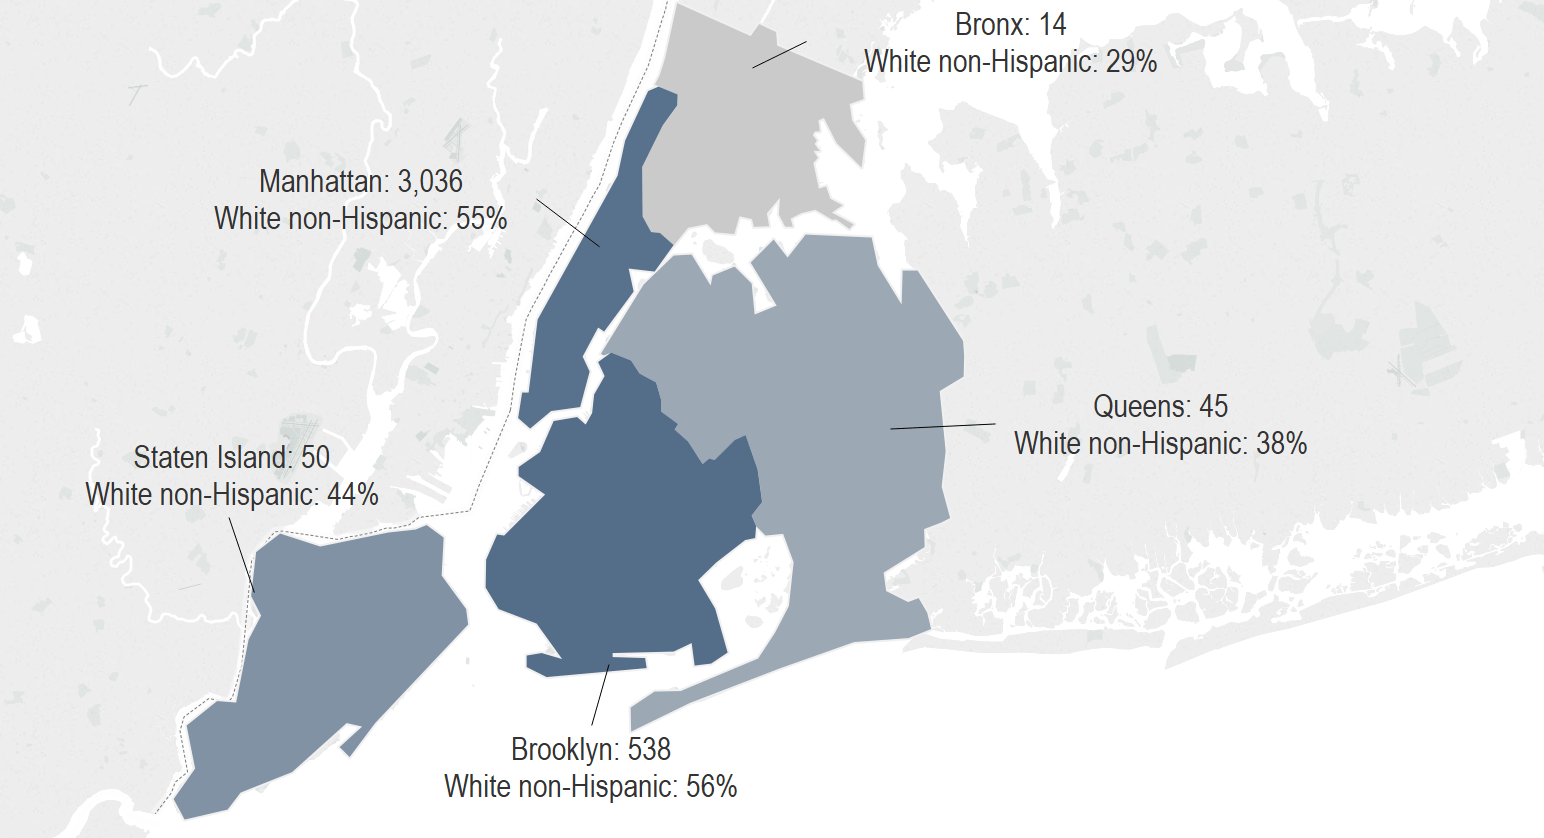
Figure 17 shows the total number and percentage of white non-Hispanic dance staff by borough. Each borough is shaded from light to dark to reflect the percentage of white non-Hispanic staff from least to greatest. Brooklyn and Manhattan have roughly the same percentage of white non-Hispanic staff, 56% and 55% respectively. For Manhattan this is seven percentage points above the overall population of the borough, which is 48% white non-Hispanic. In Brooklyn it is significantly higher than the borough’s 36% white non-Hispanic residents. Queens (38%), Staten Island (44%), and the Bronx (29%) have an average percent white non-Hispanic residential population of 28%, 64%, and 11%, respectively.
Figure 18: Race Total Staff Separated by Level of Seniority
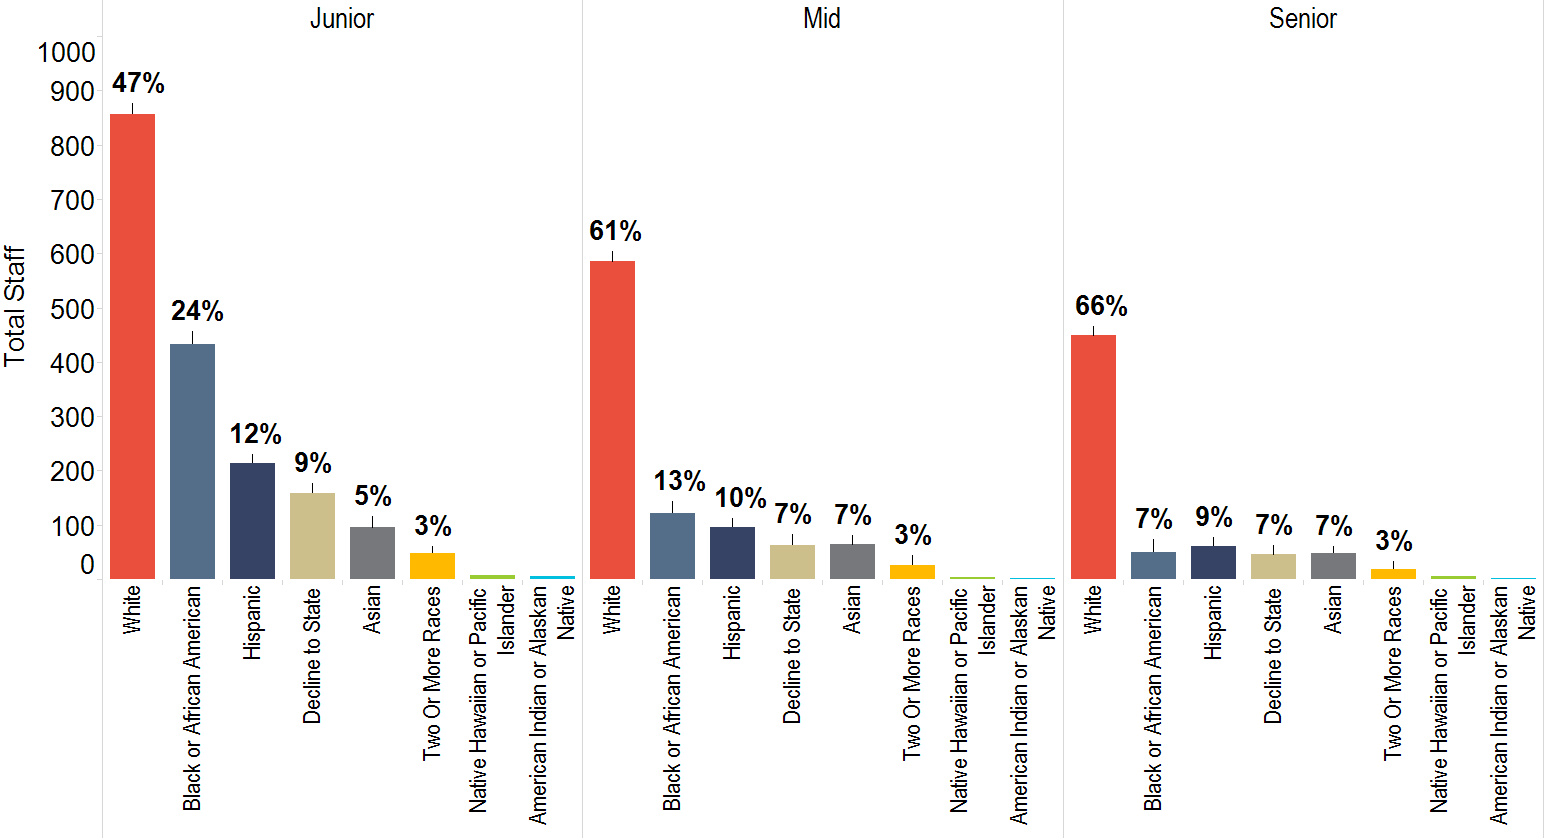
Figure 18 shows staff organized by racial group and separated into levels of seniority. There is a similar trend to the overall DCLA community when looking at race by level of seniority. Bars representing people of color flatten as positions increase in seniority. The percentage of white staff is lower than the aggregated white staff at DCLA grantees across the board.
Figure 19: Race Education Totals and Percent
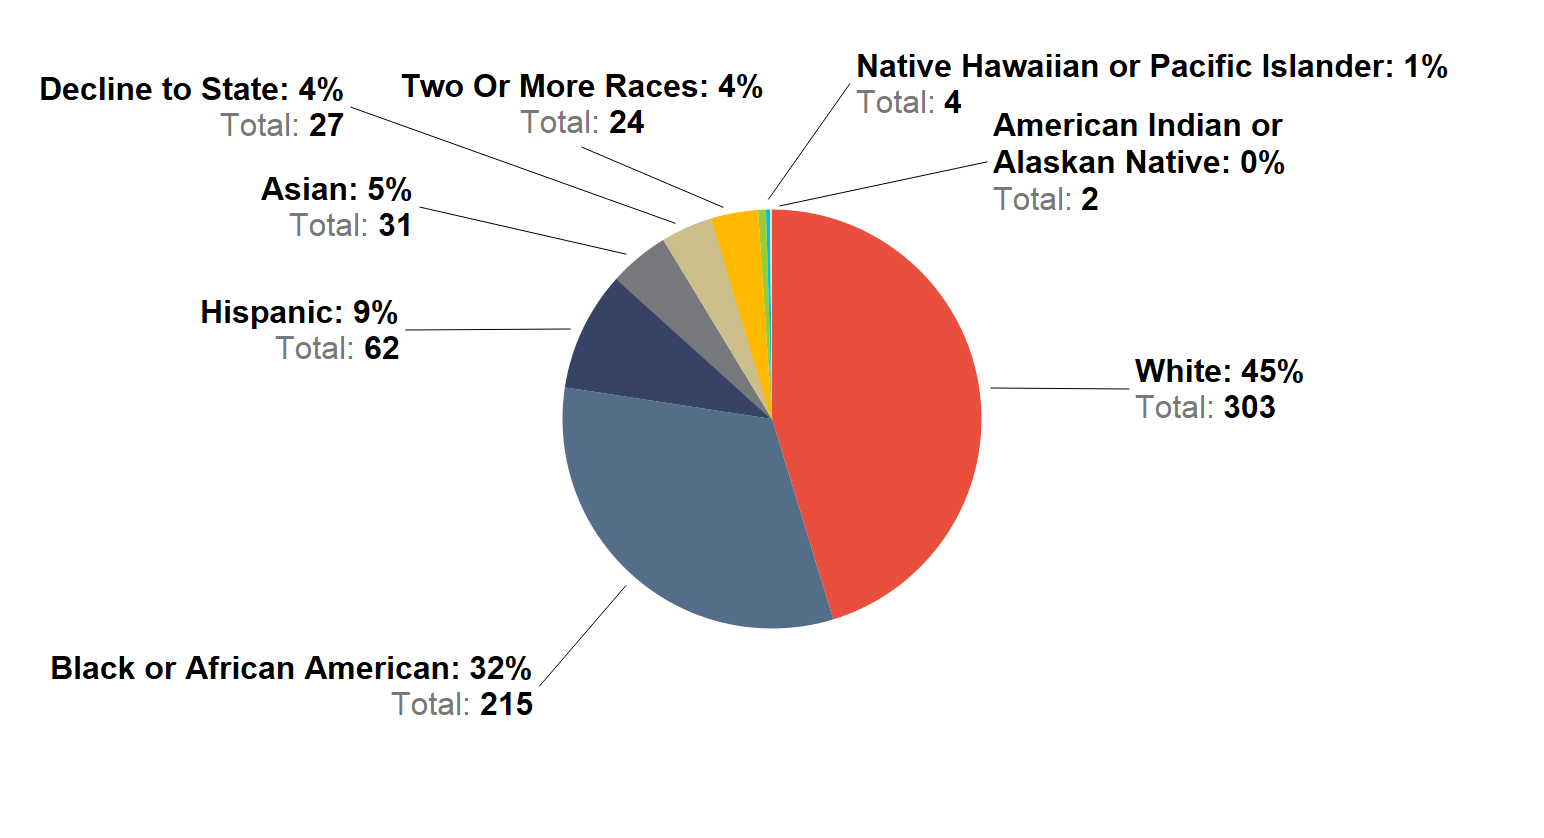
Figure 19 focuses on educators in dance. At 32%, the percentage of black educators in dance is twice as high as in the overall DCLA community.
Figure 20: Race Education Staff by Level
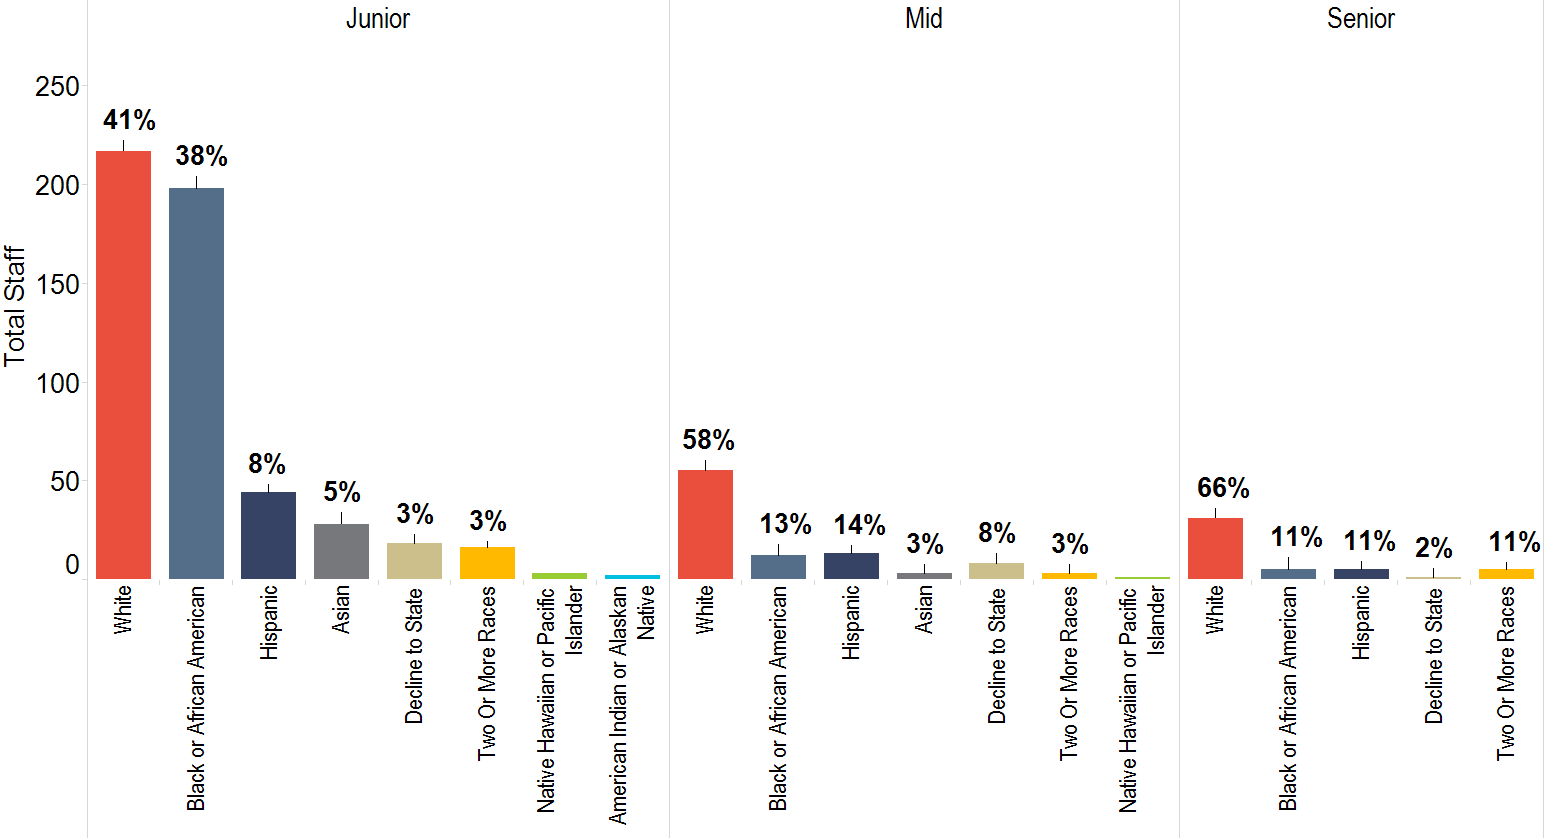
Figure 20 shows these educators separated by level of seniority. There is a high percentage of black staff in junior education positions. We found that 75% of black educators in junior positions are in $10+ million organizations.
Figure 21: Race Volunteer Percent
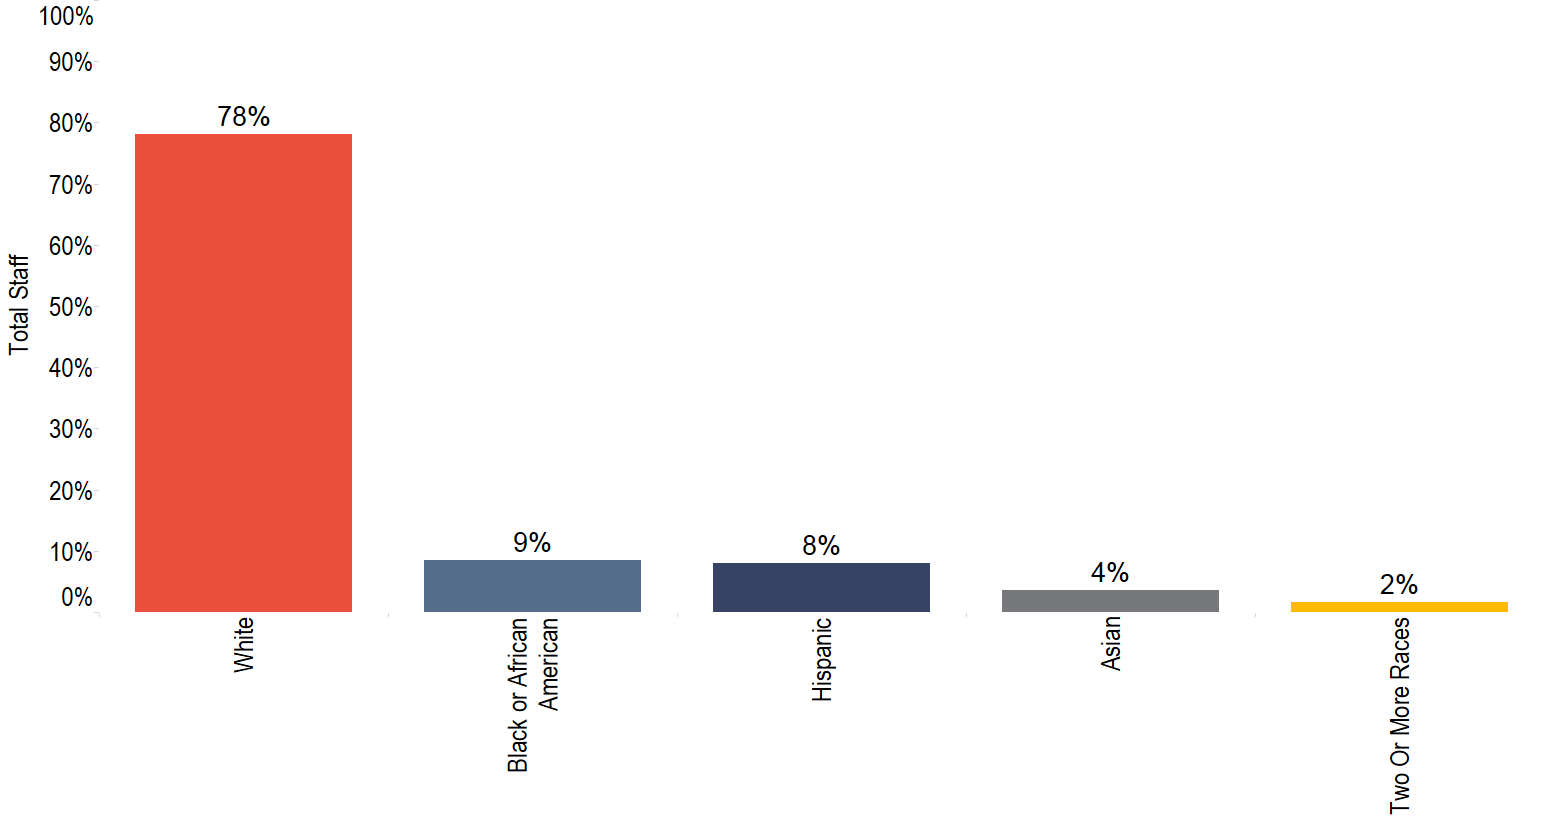
Figure 21 shows volunteers organized by race/ethnicity. 78% of volunteers are white. Most white volunteers are in $10+ million organizations, and overwhelmingly they are found in the Community Engagement job type. Coupled with the findings for volunteers by gender, it appears most volunteers in dance are white women involved in community engagement in $10+ million organizations.
Job Type
Figure 22: Race Job Type Total and Percent White Non-Hispanic
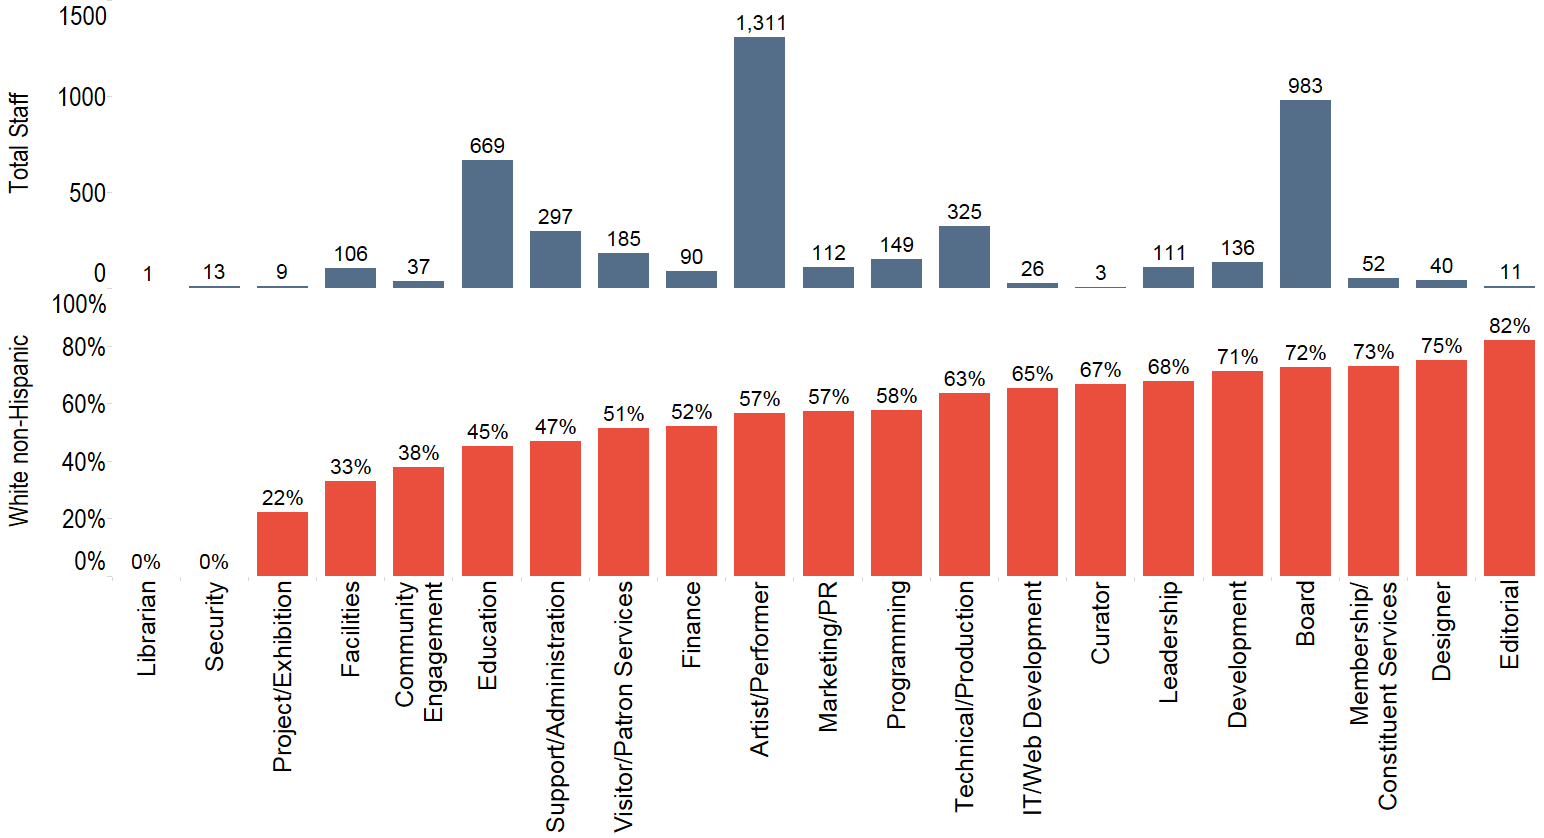
Figure 22 shows the relationship between the total number of dance staff in a job type (top graph) and the percent of white non-Hispanic staff (bottom graph). While those volunteering in community engagement are mostly white, paid community engagement staff are mostly people of color. Figures 23-25 take a closer look at artists, leadership, and board members.
Figure 23: Race Artists Totals and Percent
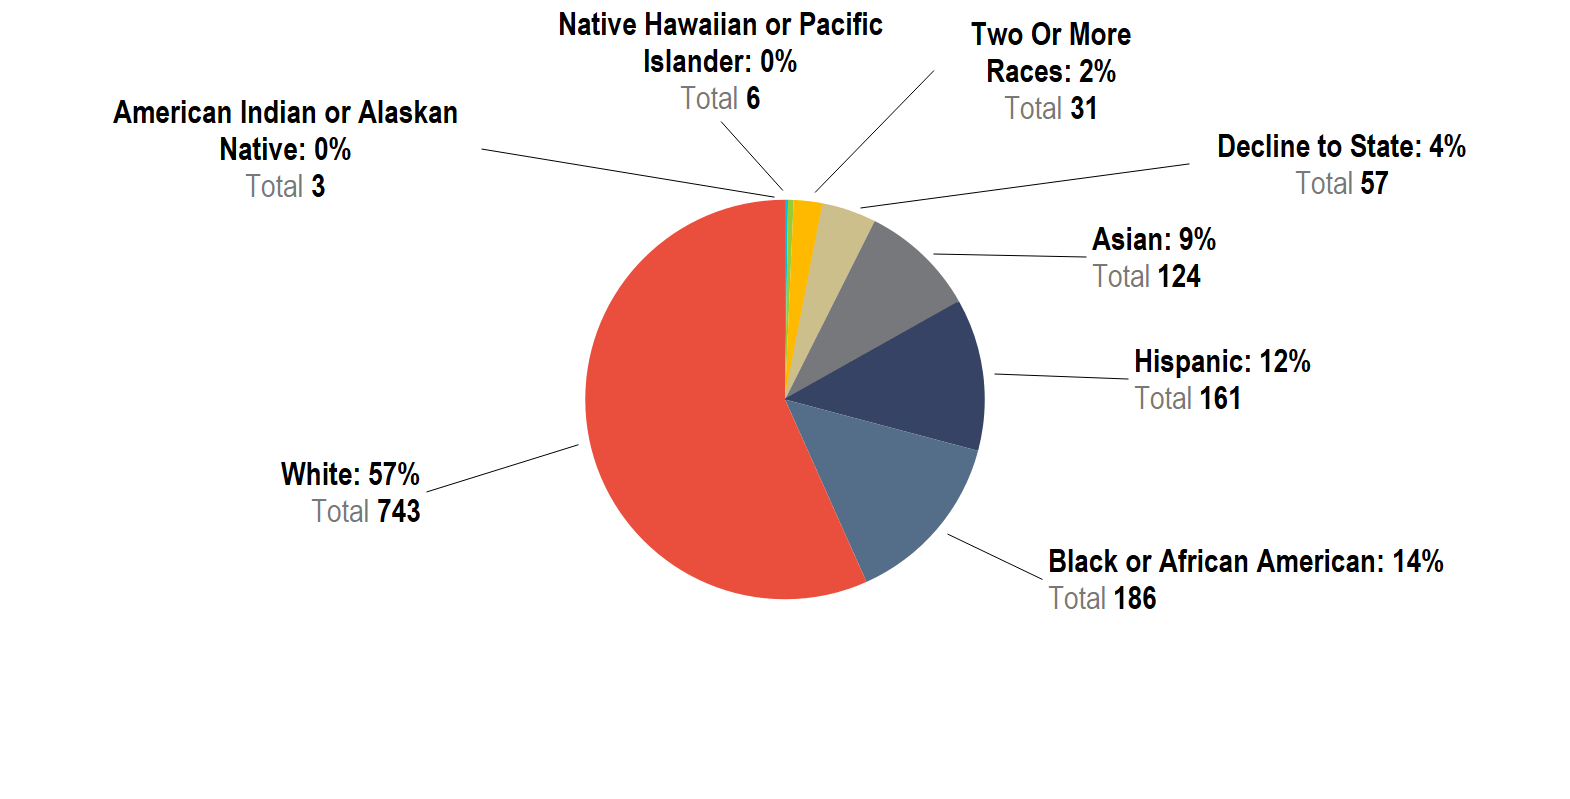 Figure 23 shows the total number and percentage of artists/performers staffed in dance organizations by race/ethnicity. Among dance organizations, artists/performers are two percentage points less white than DCLA overall.
Figure 24: Race Leadership Total and Percent
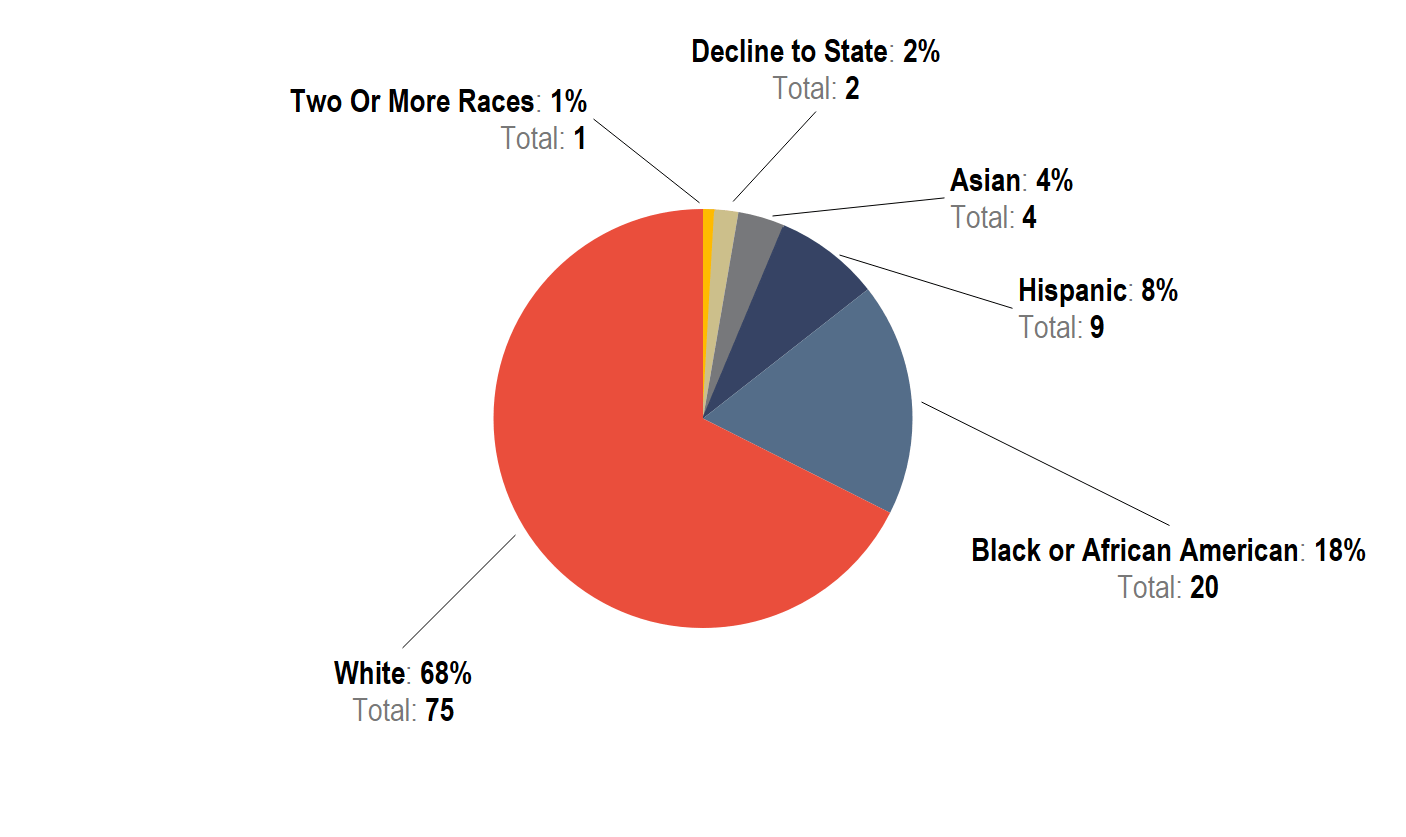 Figure 24 shows the total number and percent of those in the dance community categorized in the “Leadership” job type (executive directors or C level staff) organized by race/ethnicity. There were twice as many black leaders in the dance community as the DCLA community (by percentage). The base for this graph is significantly smaller, 106 total staff.
Figure 25: Race Board Totals and Percent
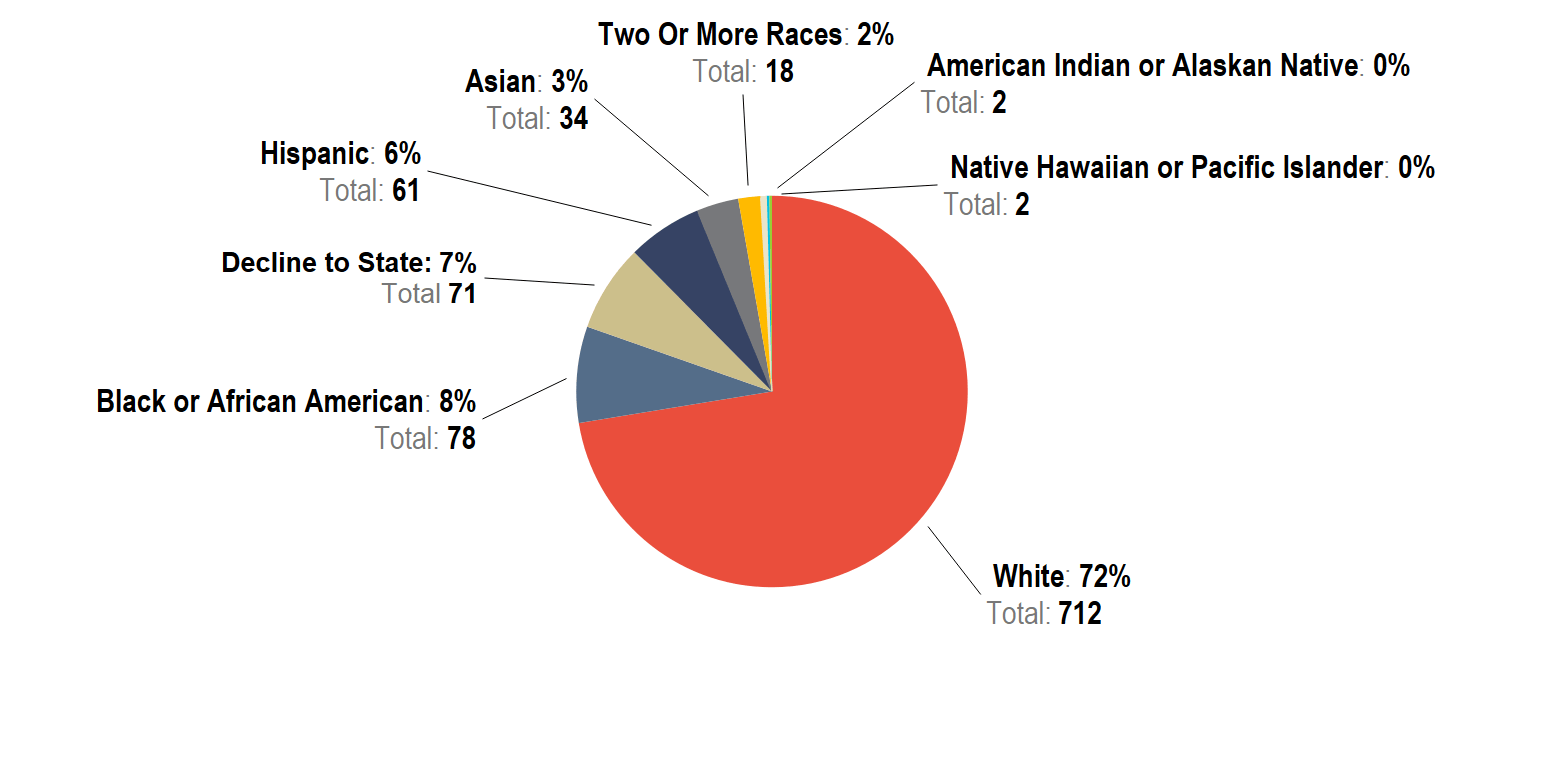 Figure 25 shows total number and percent of board members in the dance community by race/ethnicity.
Decade Born and Decade Hired
Figure 26: Race Decade Born Total and Percent
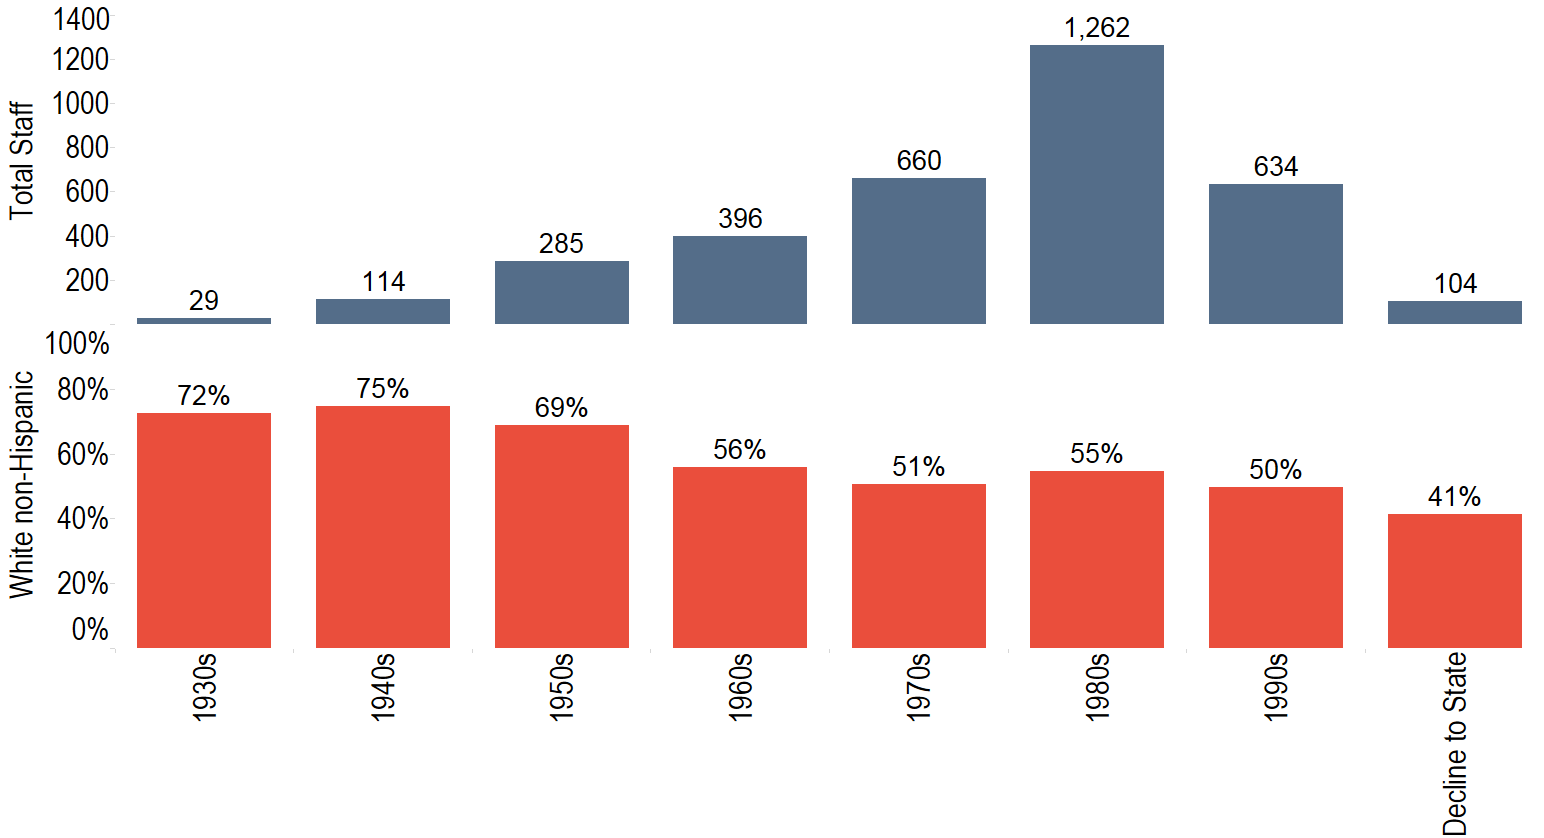 Figure 26 shows the total number of dance staff born in a given decade (top graph) and the percent of white non-Hispanic dance staff born in each decade (bottom graph). This graph reveals a similar trend to overall staff of DCLA funded groups. Younger staff are more racially diverse.
Figure 27: Race Decade Hired Total and Percent
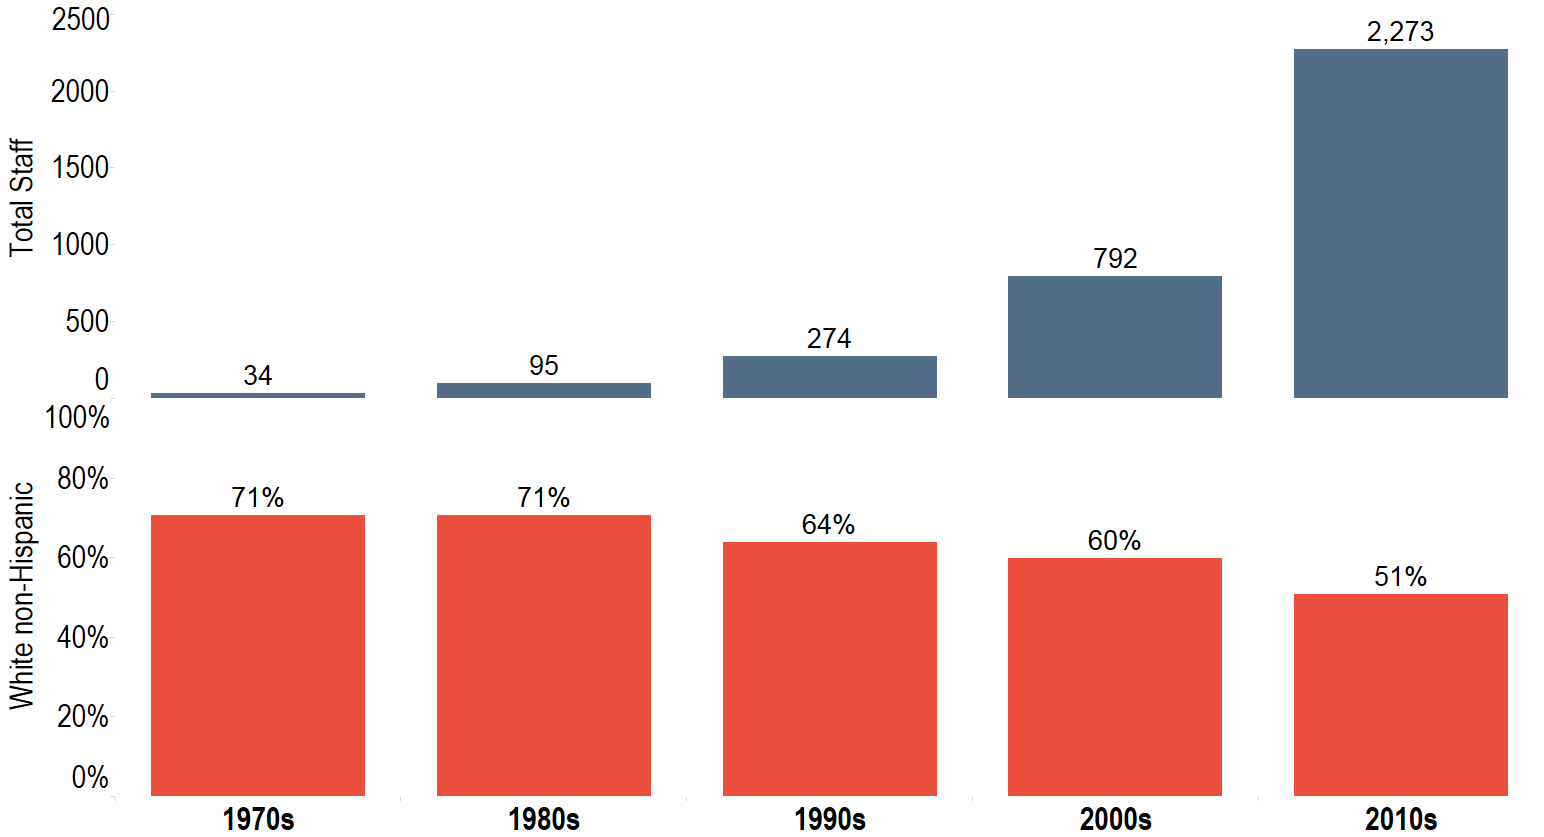
Figure 27 shows the total number of dance staff hired in a given decade (top graph) and the percent white non-Hispanic staff hired in that decade (bottom graph). This graph also reveals the same pattern as the overall DCLA community. Newer hires are more racially diverse.
Conclusion
When these findings were presented at the Dance/NYC Symposium it was evident how deeply engaged the dance community is with issues of diversity, equity, and inclusion in the cultural sector. Gauging how these findings ought to be interpreted depends on the context through which they are viewed. Regardless, the data allow us to have a more informed perspective on the demographics of dance organizations.
In the aggregate, the discipline has slightly more female staff and more people of color than New York City cultural organizations on the whole. As a ratio there are twice as many black or African American staff in leadership positions. Education is a growing field in the DCLA community, and among dance organizations there is a high ratio of black or African American educators. Most of them are in junior positions and in organizations with large budgets. The data also showed noteworthy characteristics in the field of community engagement, especially between staff and volunteers. These findings could be enriched through another iteration of the survey in a few years.
These findings represent a benchmark for the dance community in New York City to better understand their demographics and measure change over time. We hope this report will be useful in contributing to an informed conversation about issues of diversity, equity, and inclusion in New York City’s cultural sector.
- Roger C. Schonfeld and Liam Sweeney, “Diversity in the New York City Department of Cultural Affairs Community,” Ithaka S+R, 28 January 2016, http://sr.ithaka.org?p=276381. ↑
- Roger C. Schonfeld, Mariët Westermann, and Liam Sweeney, “The Andrew W. Mellon Foundation Art Museum Staff Demographic Survey,” The Andrew W. Mellon Foundation, 28 July 2015, https://mellon.org/programs/arts-and-cultural-heritage/art-history-conservation-museums/demographic-survey/. ↑
- Anne Coates, in collaboration with task force, “Discovering Disability: Data & NYC Dance,” Dance/NYC, http://www.dance.nyc/uploads/DanceNYC-ReportDisability-Final(Linco).pdf ↑
- We received spreadsheets from 88% of respondents and completed questionnaires from 92% of respondents. ↑
- For more information on the survey methodology see Roger Schonfeld and Liam Sweeney, “Diversity in the New York City Department of Cultural Affairs Community,” Ithaka S+R, 28 January 2016, http://sr.ithaka.org?p=276381. ↑
- We defined levels as follows—senior: reports to the board or CEO; mid: supervised by staff but has independent financial, programmatic, or operational responsibilities; junior: has no direct reports and work is directly supervised. ↑
- We use “White” in graphs that show all race/ethnicity categories as opposed to “White non-Hispanic” in the binary analysis (such as Figure 22) because in the former case, those who declined to state ethnicity but identified their race as white have been included in the “White” category, whereas in the binary analysis those who declined to state ethnicity were excluded from the category “White non-Hispanic.” ↑
- Race categories are based on the 2000 census. ↑
Attribution/NonCommercial 4.0 International License. To view a copy of the license, please see http://creativecommons.org/licenses/by-nc/4.0/.