Strengthening Mississippi’s Economic Future Through Postsecondary Investment
Executive Summary
In the United States, experts predict that 70 percent of jobs will require a postsecondary credential in the next decade.[1] Currently, 44 percent of Mississippi residents possess education and training beyond high school.[2] In an effort to improve the state’s ability to competitively attract and retain workforce talent, the Mississippi Education Achievement Council (EAC) adopted a statewide postsecondary attainment goal in October 2020. Policymakers, education leaders, advocates, business leaders, and other stakeholders have set their sights on achieving 55 percent attainment for 25-to-64-year-olds in the state by 2030, and 60 percent attainment by 2035. [3] In addition to the benefits of higher levels of attainment for both the individual and state, the resolution also specifically describes the need for Mississippi to close critical achievement gaps, targeting resources to achieve equitable outcomes for underrepresented groups and regional areas
As Mississippi prepares to support the statewide postsecondary attainment goal, understanding the returns to higher education is crucial to determining where to invest resources. Ithaka S+R has partnered with the Woodward Hines Education Foundation to provide Mississippi policymakers, advocates, and legislators with information they need to make strategic investments in postsecondary education that can increase attainment of high-value postsecondary credentials, especially amongst lower-income Mississippians, people of color, and residents in rural communities, ultimately strengthening the labor market by supplying an educated, trained workforce to meet current and future demands.[4] To understand how postsecondary investments can best serve the needs of individuals and the state, our analysis seeks to answer three central questions: 1) what are the individual returns to higher education in the state; 2) what are the statewide economic returns to higher education; and 3) how can we plan for future investments in high-opportunity credentials?
Based on our analysis, we conclude with three key recommendations:
- Invest to provide earnings and employment opportunities to Mississippians. If Mississippi increased its attainment rate from the current 42 percent to 60 percent among 25-to-64-year-olds, the state could potentially gain over $376 million annually in increased tax revenue and decreased social services spending, as a more educated population would earn higher wages. There are several challenges and barriers that prevent students from accessing and completing higher education; consequently, Mississippi can invest in systemic approaches to creating seamless information and pathways to jobs that pay living wages. For example, in establishing transfer pathways and articulation agreements between community colleges and four-year institutions, students can be better informed about opportunities to further their education, within a system that is equipped to provide that information and a smooth transition. Additionally, investing in services that meet the entire range of students’ needs, both inside and outside of the classroom, can significantly increase their chances of obtaining a postsecondary credential with minimal debt or interruption. Supports such as these can increase the likelihood that students will make timely progress towards earning their credentials and increase completion rates.
- Invest in programs that meet social and labor needs. By identifying gaps in labor supply, and racial gaps in credential production, the state can craft policy that works to fill in labor needs while simultaneously improving equity and contributing to a stronger economy. Investing in solutions such as a state grant program that targets teachers in high-need areas and loan repayment programs for people working as nurses will address critical shortages in the state. Moreover, targeting investments that create postsecondary opportunities related to particular occupations that are key to state and local economies (e.g., accountants, constructions supervisors, electricians) will grow the economy.
- Invest to close equity gaps in attainment and earnings. By ensuring equitable access to well-resourced colleges and universities for students of all races and developing policies that work to reduce employment inequity, Mississippi has the potential to greatly boost its economy. Increasing Black Mississippians’ attainment rate (associate’s degree and higher) by 13 points to the level of white Mississippians would result in 71,486 additional high-value credentials for Black Mississippians and increase the state’s attainment rate by over five percentage points, netting over $100 million annually in economic returns to the state. Investing in developmental education policies that work with, not against, students that need the most support, and creating pathways in high-wage careers, particularly for Black Mississippians and women, is especially beneficial to the state. Black Mississippians with a bachelor’s degree earn 1.52 times more in lifetime income than if they only receive a high school diploma, compared to white residents who earn 1.37 times more in income. Women with a bachelor’s degree earn 1.75 times more in lifetime earnings than if they only receive a high school diploma, compared to men who earn 1.53 times more income.
Mississippi’s Attainment Rate Is Increasing, But Growth Is Not Equally Distributed
Postsecondary attainment is on the rise
Postsecondary attainment is measured as the percentage of working-aged adults that hold a postsecondary credential. When the population is increasing, credential production must outpace this population growth in order to increase attainment and meet social and economic needs in the state. However, the types of credentials that are being earned, and which groups of Mississippians are earning them, is important for how the benefits of postsecondary attainment are distributed.
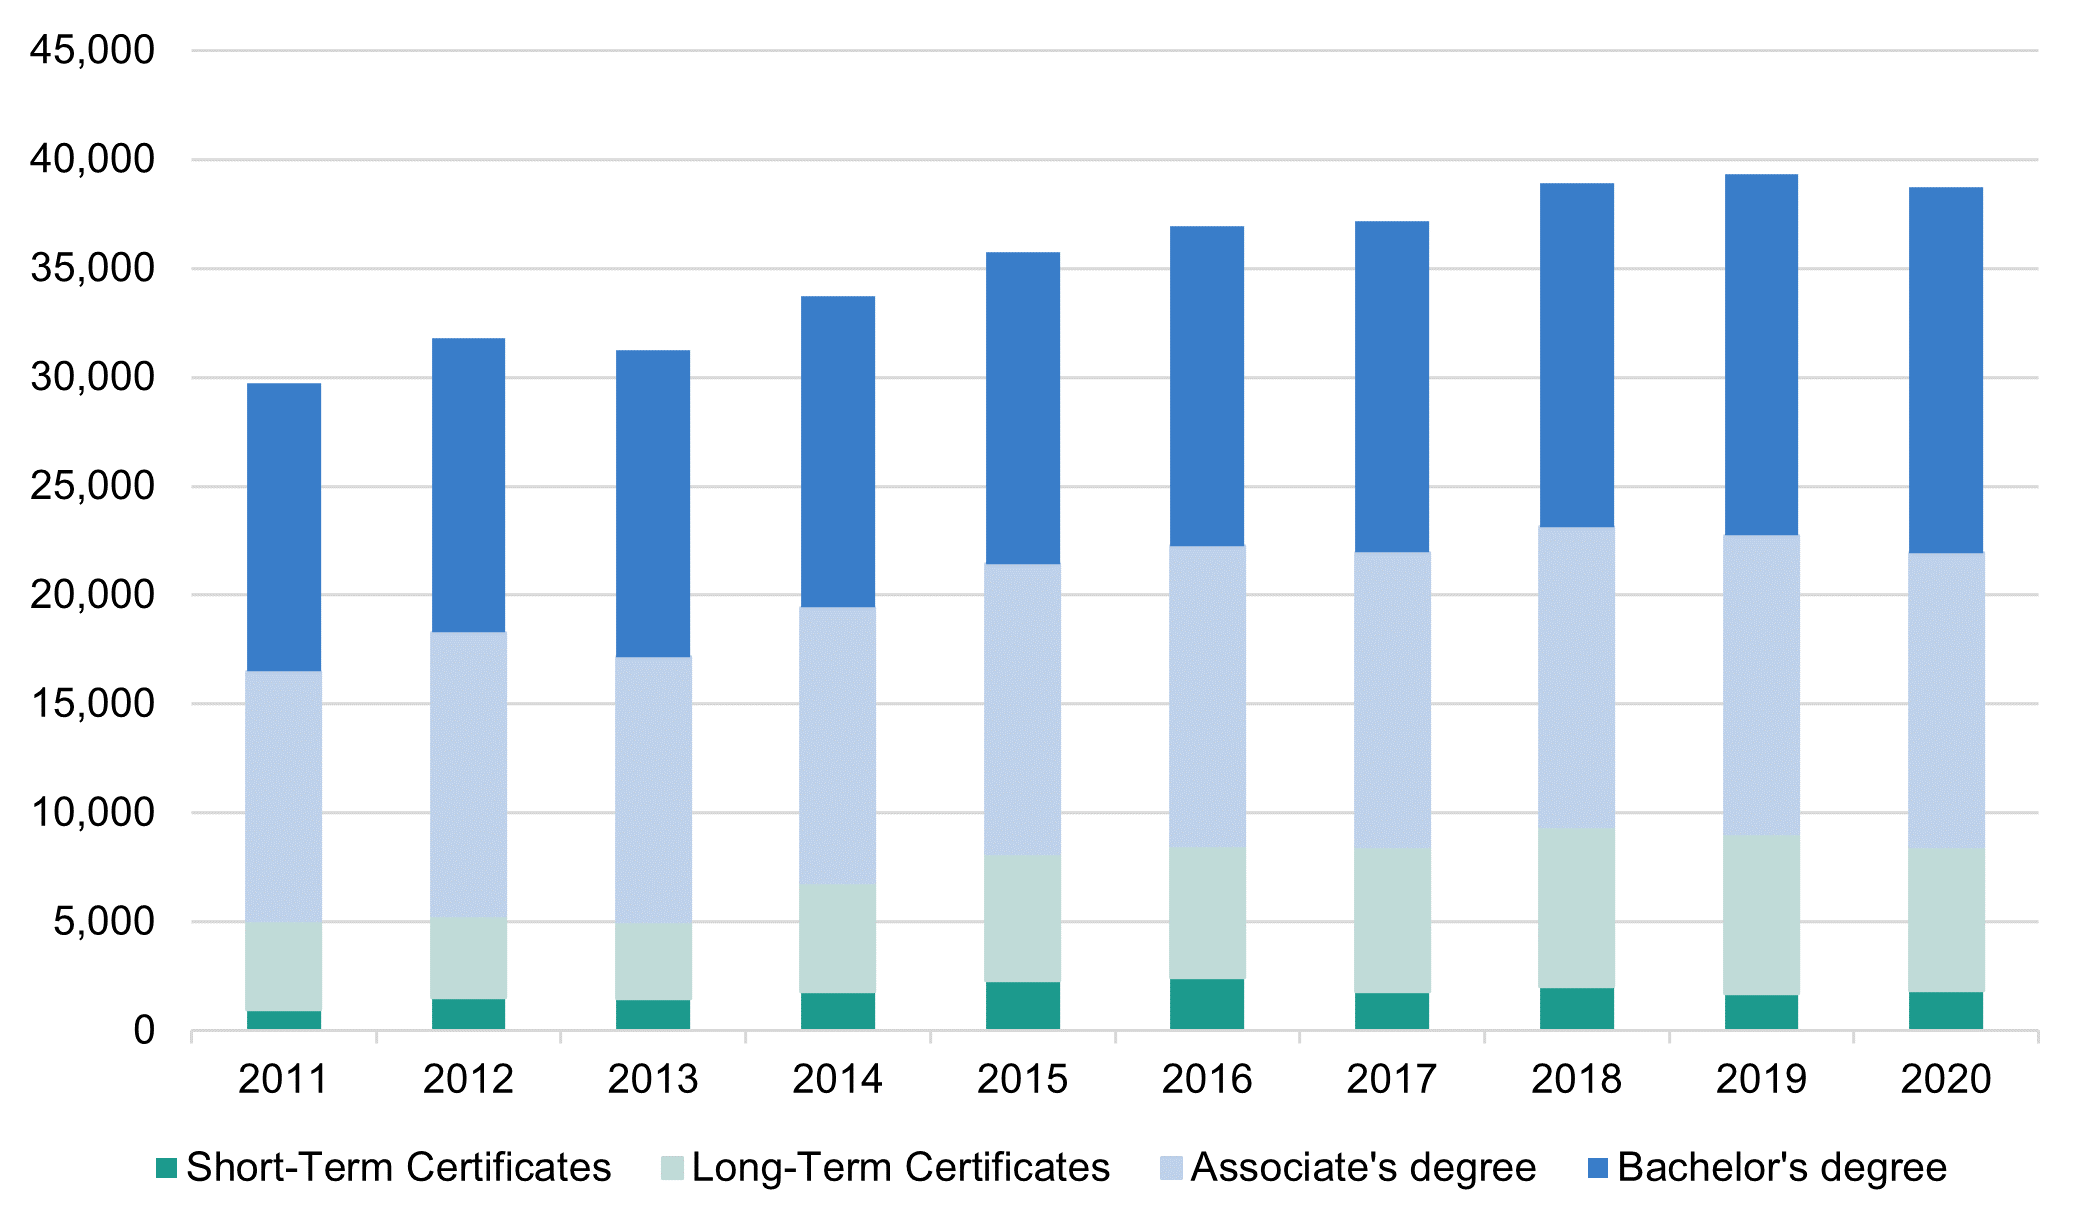
Mississippi has made progress in increasing the number of postsecondary credentials earned over the past decade. The number of credentials awarded from Mississippi institutions has increased 30 percent since 2011, helping to increase the degree attainment rate (i.e., associate’s degree or higher) from 30.3 percent in 2011 to 34.5 percent in 2020.[5] However, there is great opportunity to make continued progress. Amongst Mississippians aged 25 to 65, only 42.4 percent have a postsecondary credential (a postsecondary certificate, an associate’s degree, or a bachelor’s degree) as of 2019.[6] This is nearly 10 percentage points less than the national attainment rate of 51.9 percent and is likely contributing to the state being ranked last in the country for gross domestic product (GDP) per resident.[7]
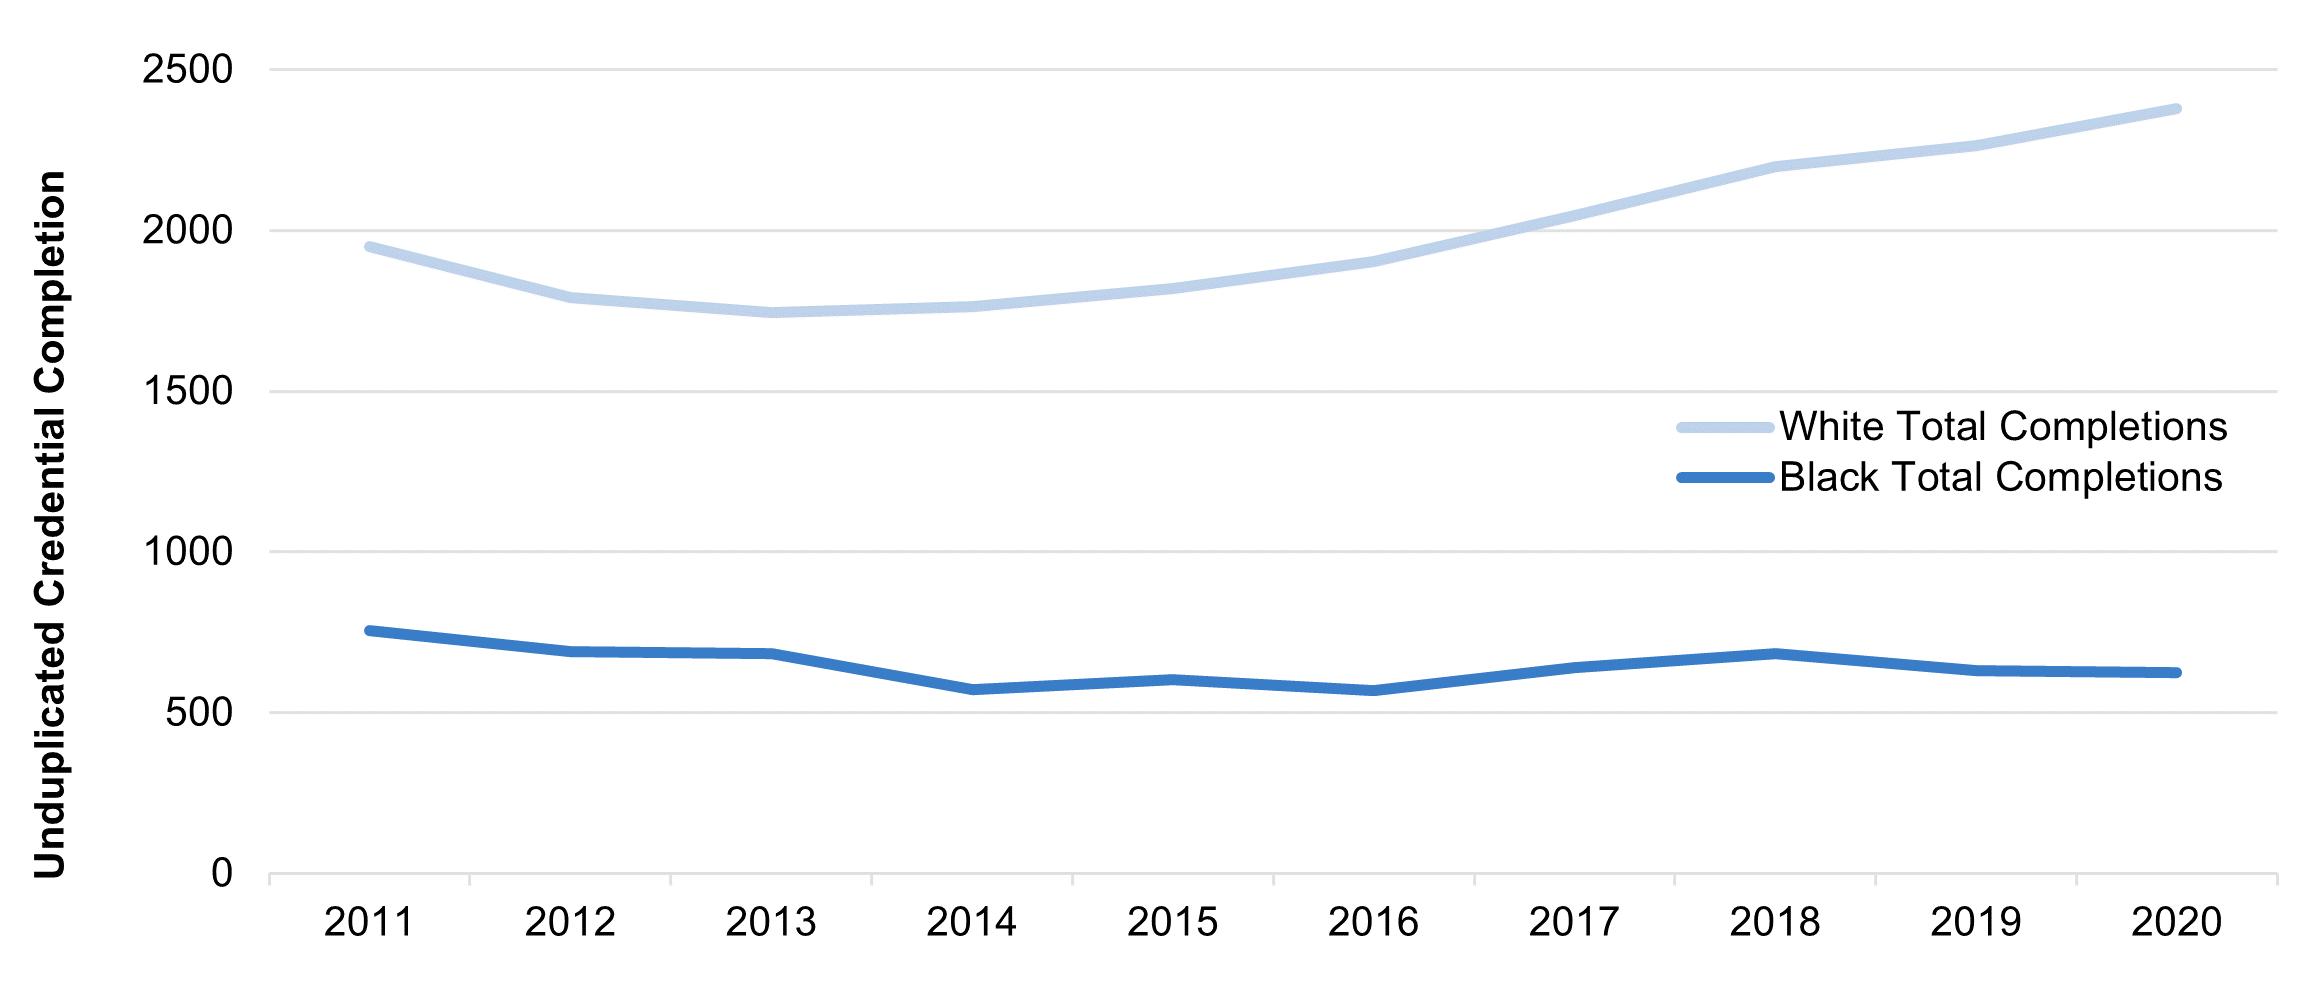
Figure 1: Number of postsecondary credentials awarded at Mississippi institutions, by year
Mississippians are earning more of all types of credentials, but disproportionately more short- and long-term certificates
Of course, the composition of these credentials matter for meeting labor market needs and ensuring individuals are investing in valuable educational opportunities. As seen in Figure 1, since 2011, the attainment of both long-term certificates (one-to-two-year programs) and short-term certificates (less than one year) have grown by a combined 67 percent and increased their relative share of total credential attainment from 17 percent in 2011 to 22 percent in 2020. This growth has helped the state increase its levels of postsecondary attainment, albeit through shorter-term credentials.
While we know degrees generally increase an individual’s earnings trajectory, the evidence is less clear on the value of shorter certificate programs. A study conducted by the Community College Research Center at Columbia University used administrative data to estimate the effect of earning an associate’s degree, a long-term certificate, or a short-term certificate on wages. The study found that, although earnings varied widely based on field of study, a student who completed an associate’s degree or long-term certificate earned higher wages that those that did not. Associate’s degree earners yielded higher returns than those that earned a long-term credential across all fields of study. The study found that short-term certificate earners, on average, saw little or no effect on wages in most fields of study when compared to students who earned some college credit but dropped out without a credential.[8]
For Black Mississippians, current trends in credential production may limit future economic opportunity
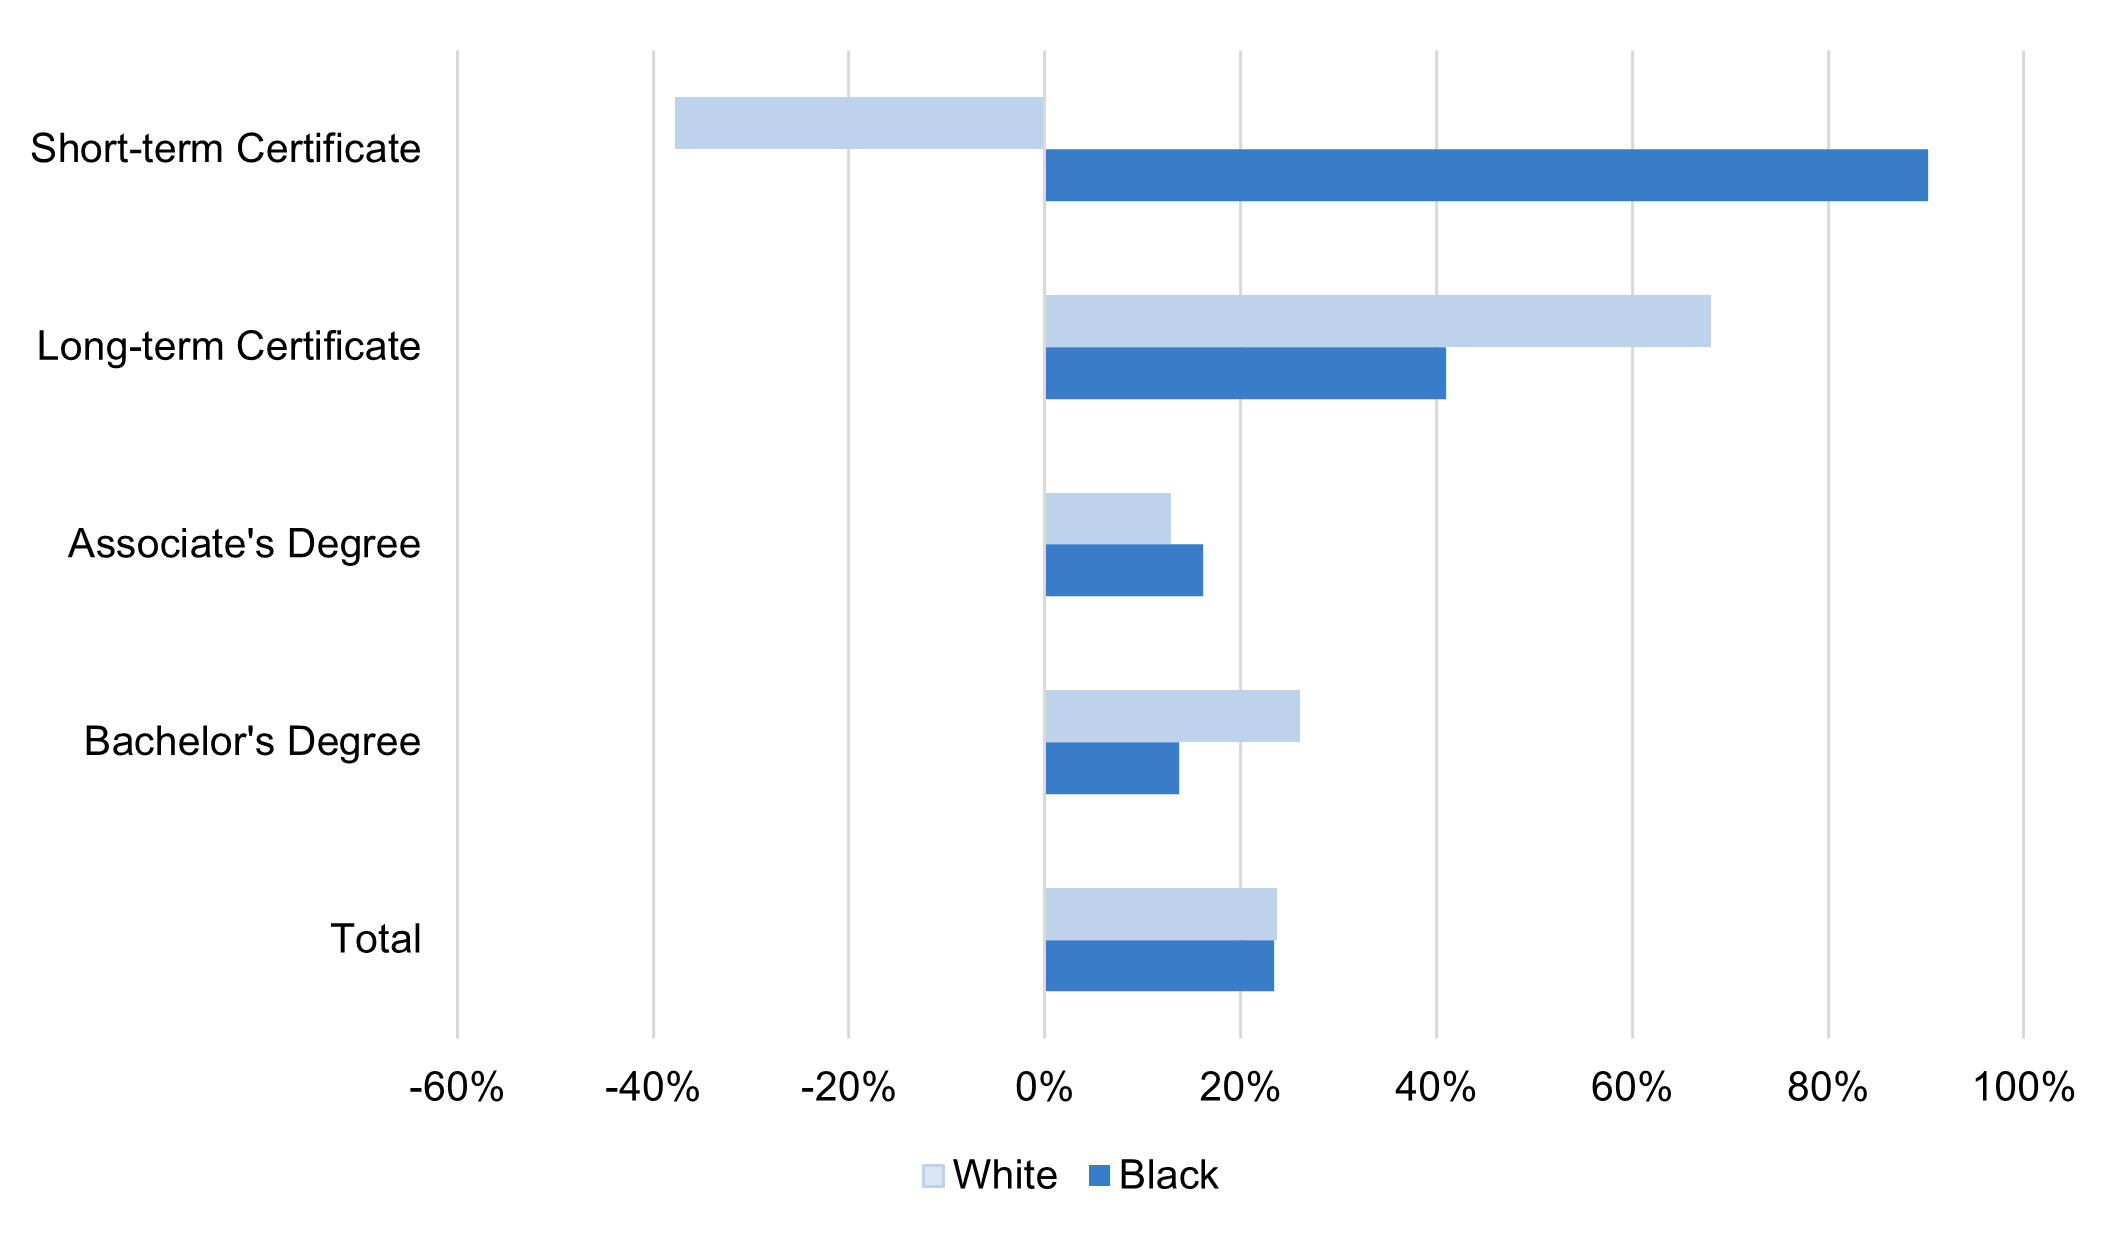
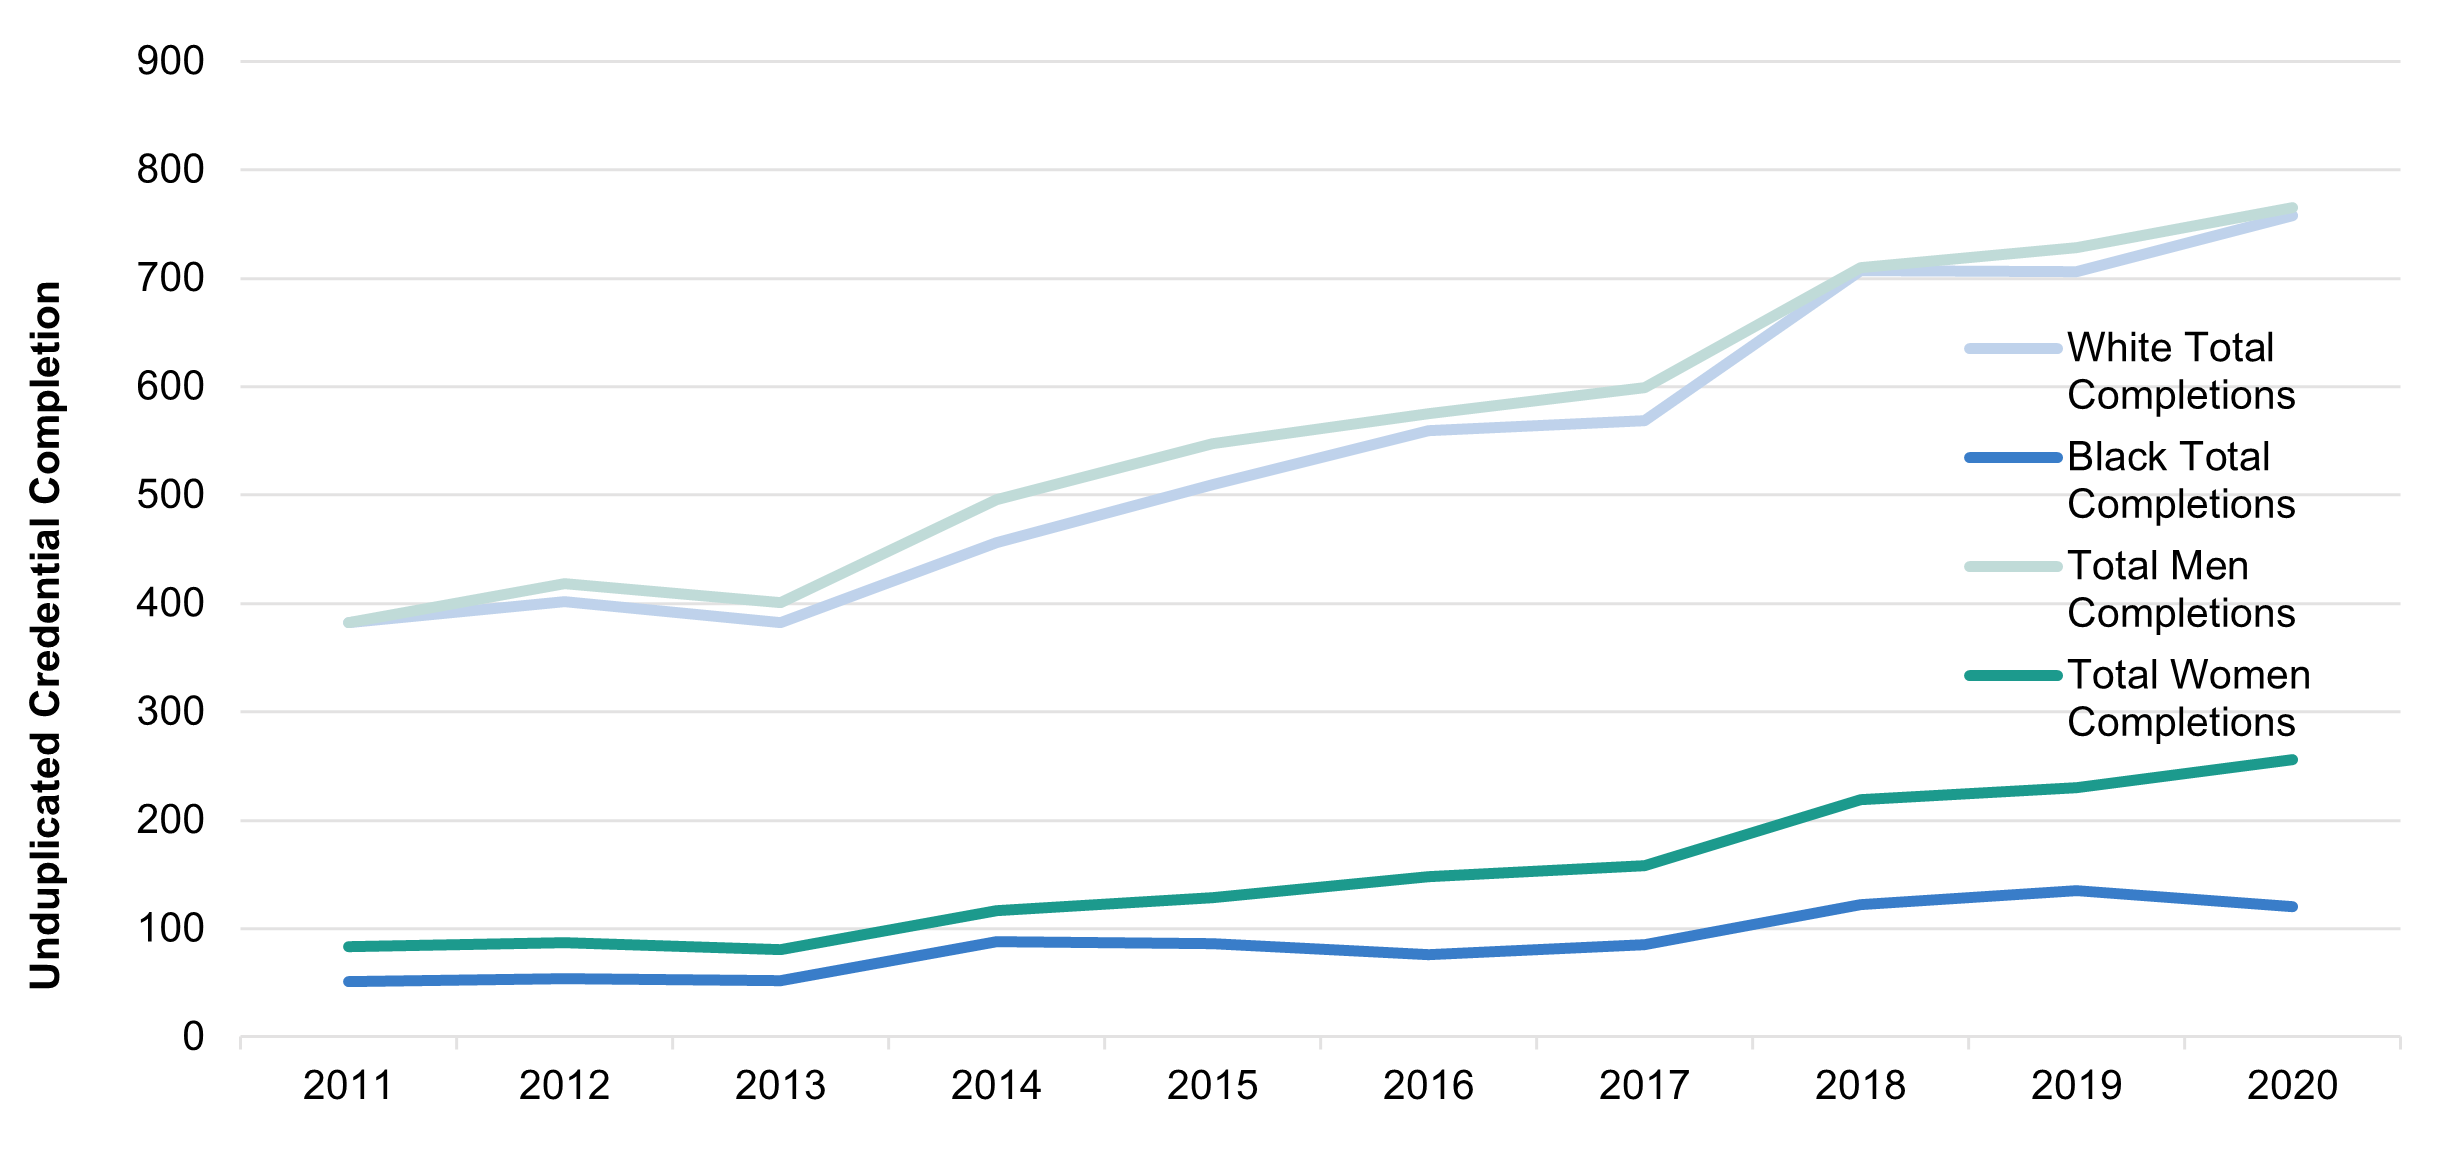
Importantly, since 2011, the growth in attainment for Black Mississippians is more likely to come from short-term certificates, as shown in Figure 2. These trends in credential completion may have important implications for whether or not the state can meet its labor market needs, and who benefits the most from the current patterns in credential production.
From 2001 to 2020 the credential attainment rate (associate’s degree and higher) for white Mississippians increased from 31.7 percent to 39.5 percent, while the attainment rate for Black Mississippians increased from 19 percent to 27 percent. Although attainment rates for both racial categories have grown, large discrepancies remain. Closing Mississippi’s racial attainment gap will be an important part of raising the state’s overall attainment.
Figure 2: Percent change in credential production for Black and white Mississippians (2011-2020)
A diversifying population requires strategic and targeted investments
It is important to examine the context for the recent growth in postsecondary attainment in order to understand the trajectory of the state. As the proportion of Black Mississippians grows, targeting the gap in attainment between Black and white residents becomes increasingly important. The demographic makeup of the state has slightly changed since 2001. The proportion of Black, non-Hispanic Mississippians has grown from 36 percent to 38 percent, while the proportion of white, non-Hispanic Mississippians has fallen from 61 percent to 56 percent. These two racial demographic groups make up the overwhelming majority of the state’s population, with the third highest demographic group, Hispanic, only comprising 3 percent of the state’s population in 2019.[9] As the state’s population continues to diversify, it will be imperative to target investments in ways that produce parity in attainment rates.
Investments in Higher Education Can Boost Attainment and the Economy
Attaining a postsecondary credential has the potential to improve the life circumstances of Mississippians and their families. Nationwide, earning a postsecondary credential is associated with higher lifetime wages, less reliance on social services and supports, and increased civic engagement.[10] Increasing postsecondary attainment will likely also improve Mississippi’s state economy. As individuals secure jobs that pay living wages, they become less reliant on social services, increase their personal spending, and generate additional tax revenue for the state. These benefits are likely to increase the state’s GDP, attract new industry, and expand labor market opportunities.
Nationwide, the economic benefits of a postsecondary degree have been well documented. College graduates earn more, on average, across all major occupation sectors than those with only a high school diploma.[11] Research from Georgetown University’s Center on Education and the Workforce found that, on average, bachelor’s degree recipients earn 31 percent more than those with only an associate’s degree, and 84 percent more than those with only a high school diploma.[12] Although difficult to ascertain, several studies have estimated the causal effect of increased postsecondary education on earnings. These studies found that, on average, holding all else equal, each year of college led to an increase in earnings of between 9 and 15 percent.[13]
Upskilling the state’s population will boost economic development as well. As the population earns higher wages and is less reliant on public assistance, the state will have more revenue to spend. Investing in a strong talent pipeline is “perhaps the most effective long-term economic growth strategy,” as businesses will be enticed to come to the states with an educated and diverse workforce.[14] Additionally, 51.5 percent of Mississippians aged 55 and older are not participating in the labor force due to retirement, compared to the national average of 49.7 percent. As residents of the state age out of the labor force and retire, increasing attainment is crucial to maintaining a qualified workforce.[15]
Besides the economic benefits, higher levels of education are associated with a host of nonpecuniary benefits. Individuals with higher levels of education are more likely to find themselves in jobs with opportunities for self-accomplishment and independence, and in positions that are considered “more rewarding.” More schooling is linked to lower levels of unemployment and reliance on public assistance, two factors that are connected to depression and low self-esteem. There is also evidence that higher levels of education are associated with better physical and mental health outcomes, and lower divorce rates. Taken together, increasing educational attainment stands to benefit both individuals and the state. To this end, strategic investments that increase attainment are a good deal for Mississippians.
Research tells us that funding can have a significant impact on statewide higher education outcomes as public colleges rely on state support to provide instruction and serve students. Academic supports, mentoring programs, and other core services are proven methods that lead to increased student retention and degree completion. These programs can be costly, however, and examples of falling state support of higher education have been linked to stagnate bachelor’s degree attainment.[16] Moreover, decreases in state appropriations are linked to lower completion rates, particularly for students at less-selective four-year institutions and community colleges.[17] Increased appropriations have been linked to lower student debt originations, shortened time to degree, and to various indicators of financial health for individuals, such as higher rates of car ownership, home ownership, and substantial increases in credit score.[18]
Meanwhile, Mississippi has steadily divested from higher education which has likely contributed to its sluggish gains in postsecondary attainment rates. The Urban Institute ranks Mississippi fortieth among US states in state and local higher education expenditures per full time enrolled student (FTE), ranking lower than neighboring states Alabama, Arkansas, and Texas. Mississippi’s state and local education appropriations per FTE peaked in 2000 at $10,292 per FTE (in 2021 dollars), at which point Mississippi was almost equal to the national average appropriations per FTE. Since 2000 this figure has decreased 31 percent to $7,061, only 76 percent of the US average. General operating appropriations have seen an even more dramatic fall in recent years, decreasing 37.8 percent from $8,707 in 2001 to $5,418 in 2021.[19] These troubling trends are likely to hamstring Mississippi colleges’ abilities to serve students and limit the growth in the state’s attainment.
Findings and Recommendations
To strengthen Mississippi’s economic future, we recommend the state invest to provide more postsecondary opportunities to Mississippians, closing equity gaps in attainment and earnings, and support programs that meet social and business needs. The following sections outline our recommendations and the analyses conducted to reach them.
Investing to provide earnings and employment opportunities for Mississippians
Investing in higher education is a necessary step in reaching Mississippi’s stated attainment goal, and the increased earnings and employment potential that individuals can expect from higher levels of education show that investments made by the state now will pay off over the long term. It’s well known that individuals with a bachelor’s degree tend to earn more than those without one. But what does this difference look like in Mississippi specifically? What are the estimated lifetime economic returns to postsecondary education for Mississippi residents, and how do these vary by credential type? Answering these questions can help guide how the state can strategically invest in higher education.
Using American Community Survey (ACS) five-year estimates, we have created a series of earnings curves that help Mississippi’s policymakers better understand the premiums associated with a postsecondary credential in the state. Each curve in Figure 3 represents the average earnings trajectory of a Mississippian with a specified level of education. Each line tracks the average cumulative earnings across an individual’s working lifetime in 2020 dollars, adjusted for inflation. Individuals who attain a postsecondary credential see an initial dip in their earnings as they pay for college, but see their earnings rise well above the high school diploma shortly thereafter. The designation “Some College” includes all individuals with some postsecondary education, but no credential. Although we are not able to directly state that sub-associate’s degree credential earnings track in the exact same way as “Some College,” we estimate earnings curves for certificate programs using College Scorecard data in Appendix A, which closely match our “Some College” curves from the ACS.
Figure 3: Estimated lifetime earnings of Mississippians by postsecondary credential[20]
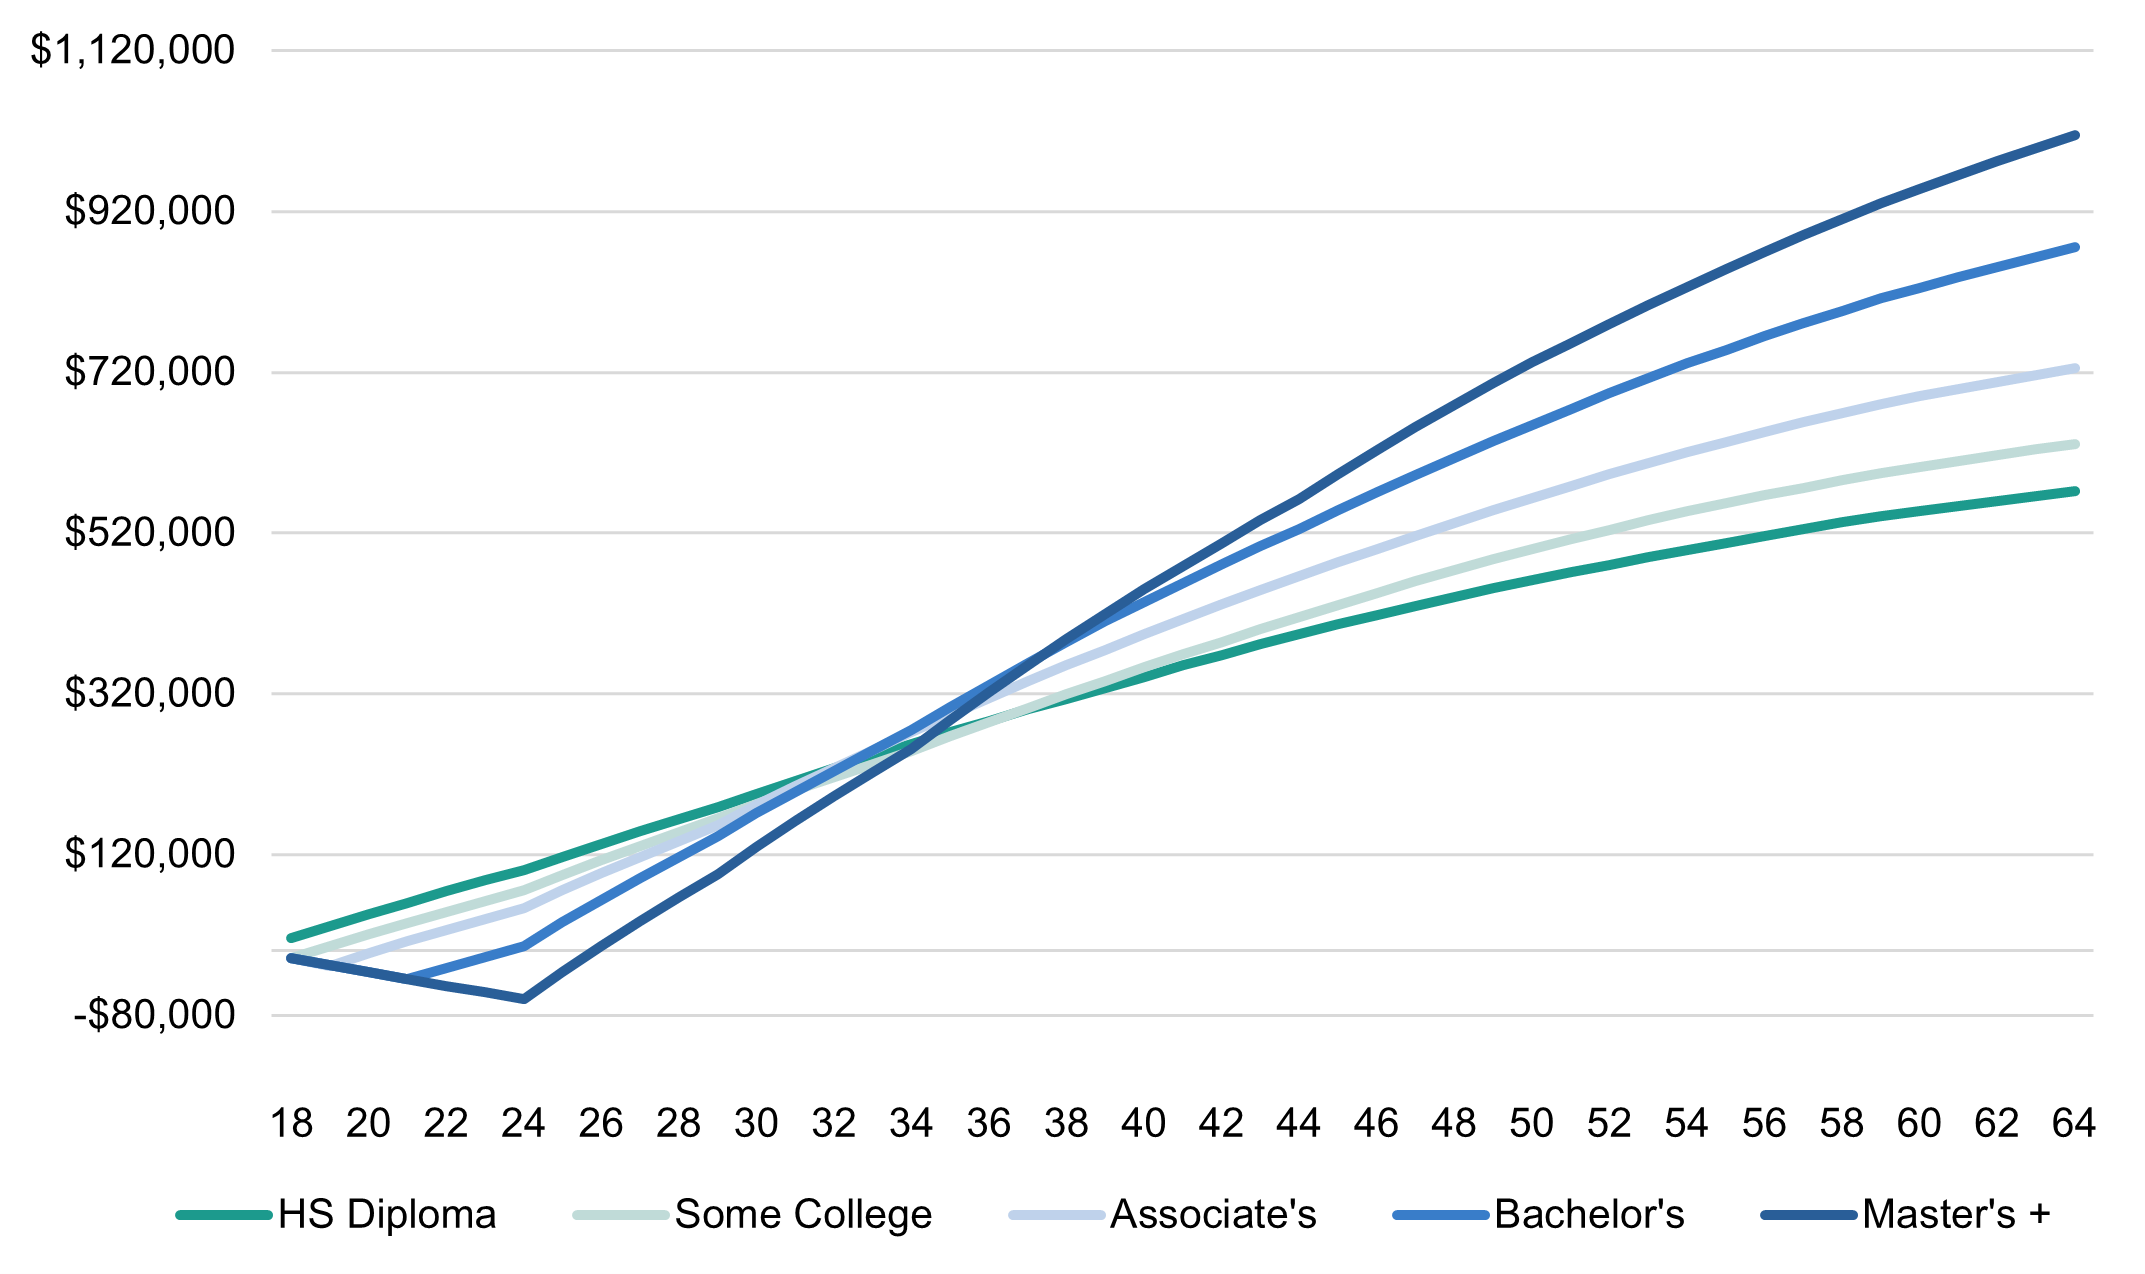
At greater levels of educational attainment, Mississippians earn more in lifetime income. This trend holds across demographic groups.
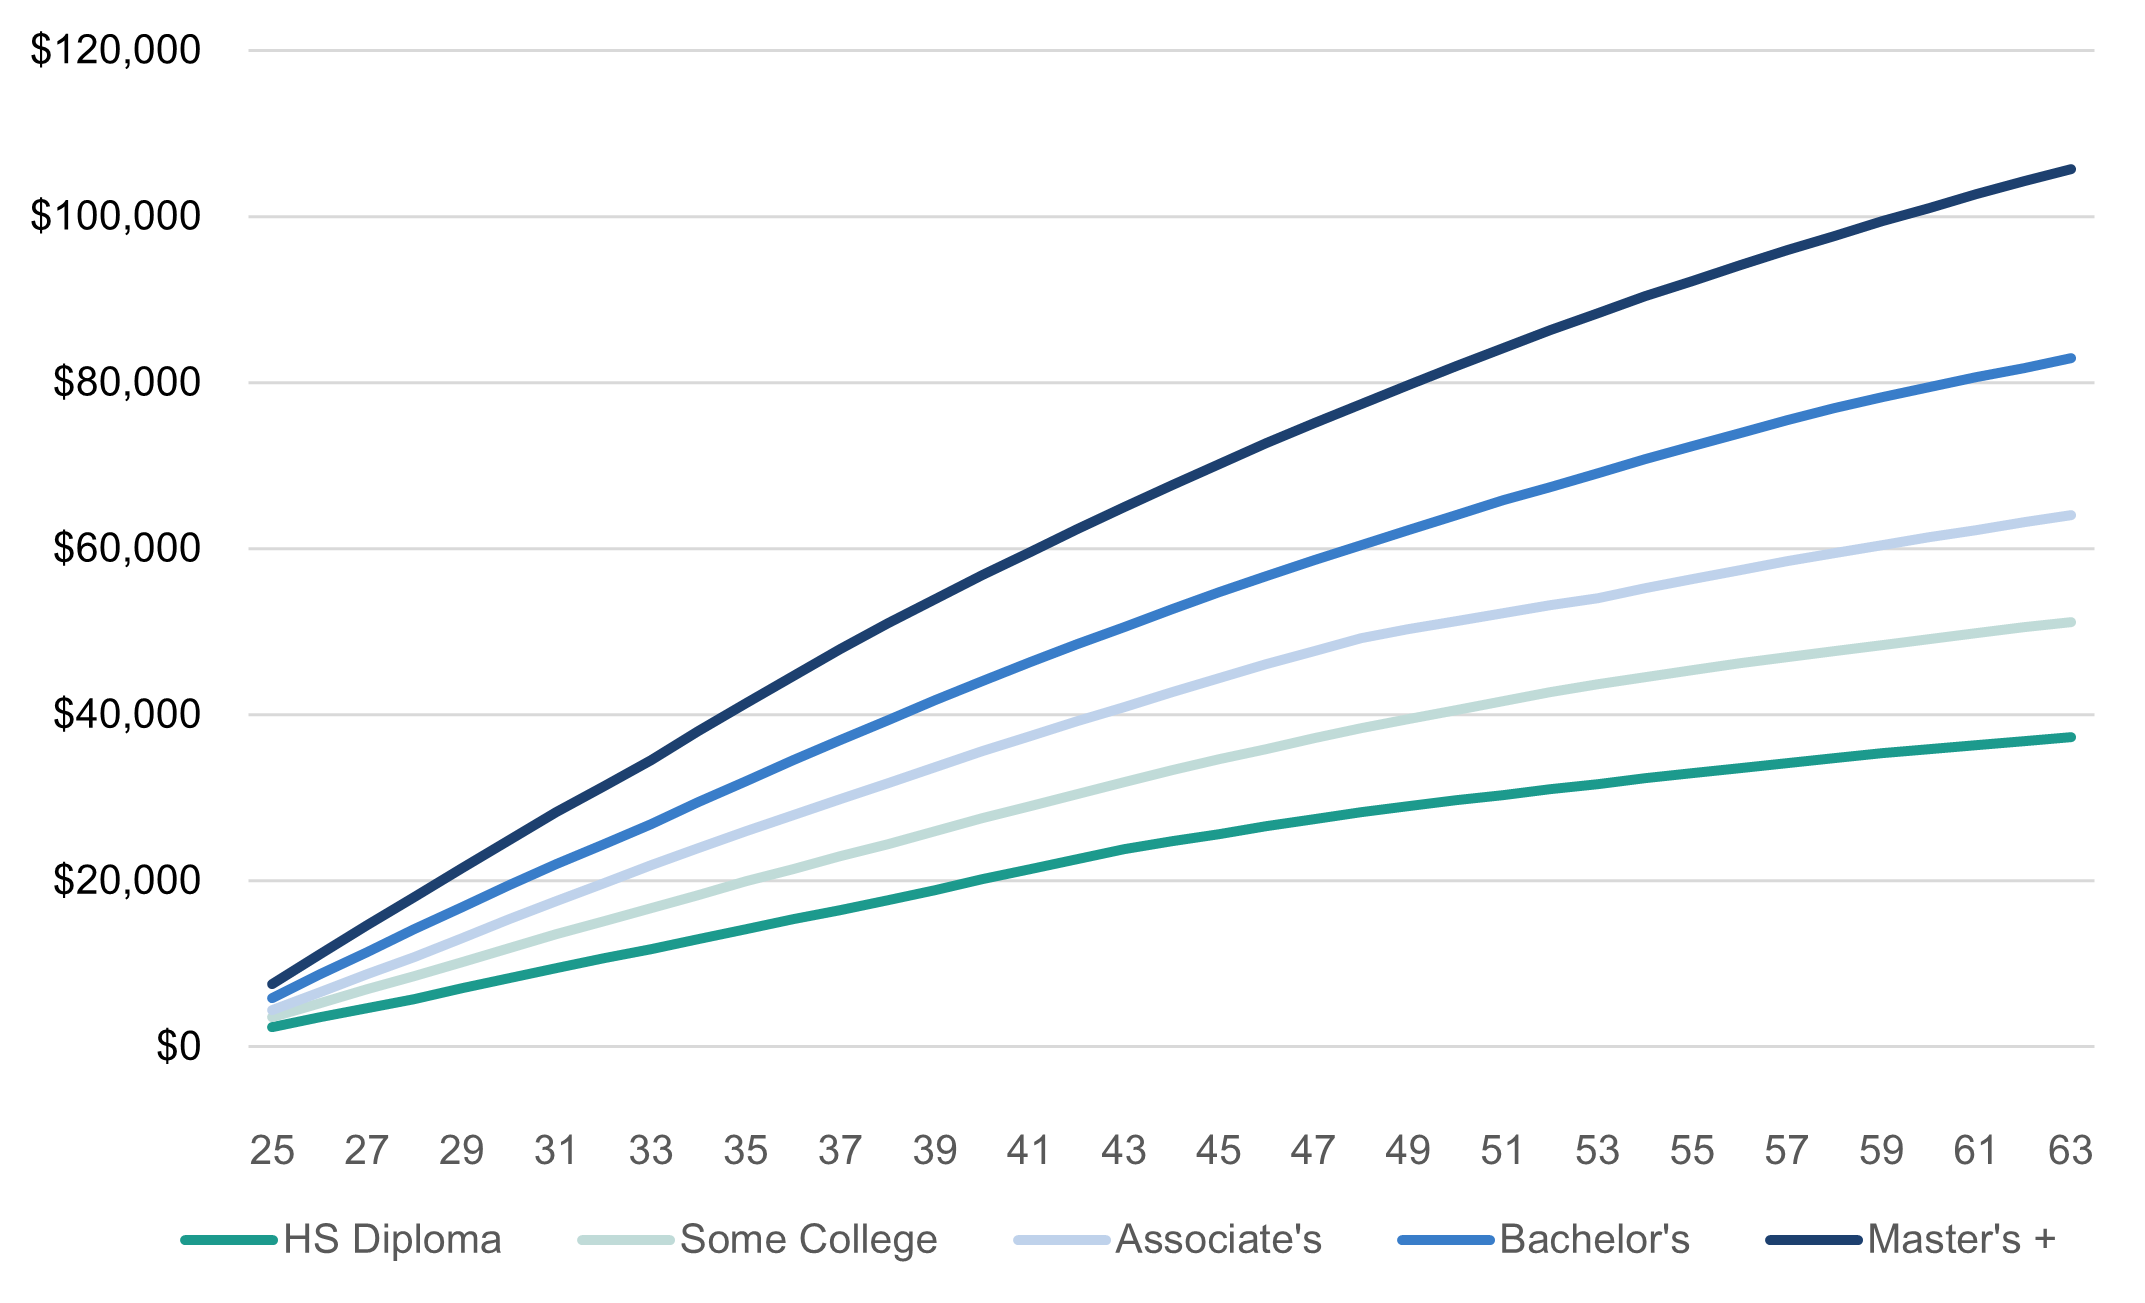
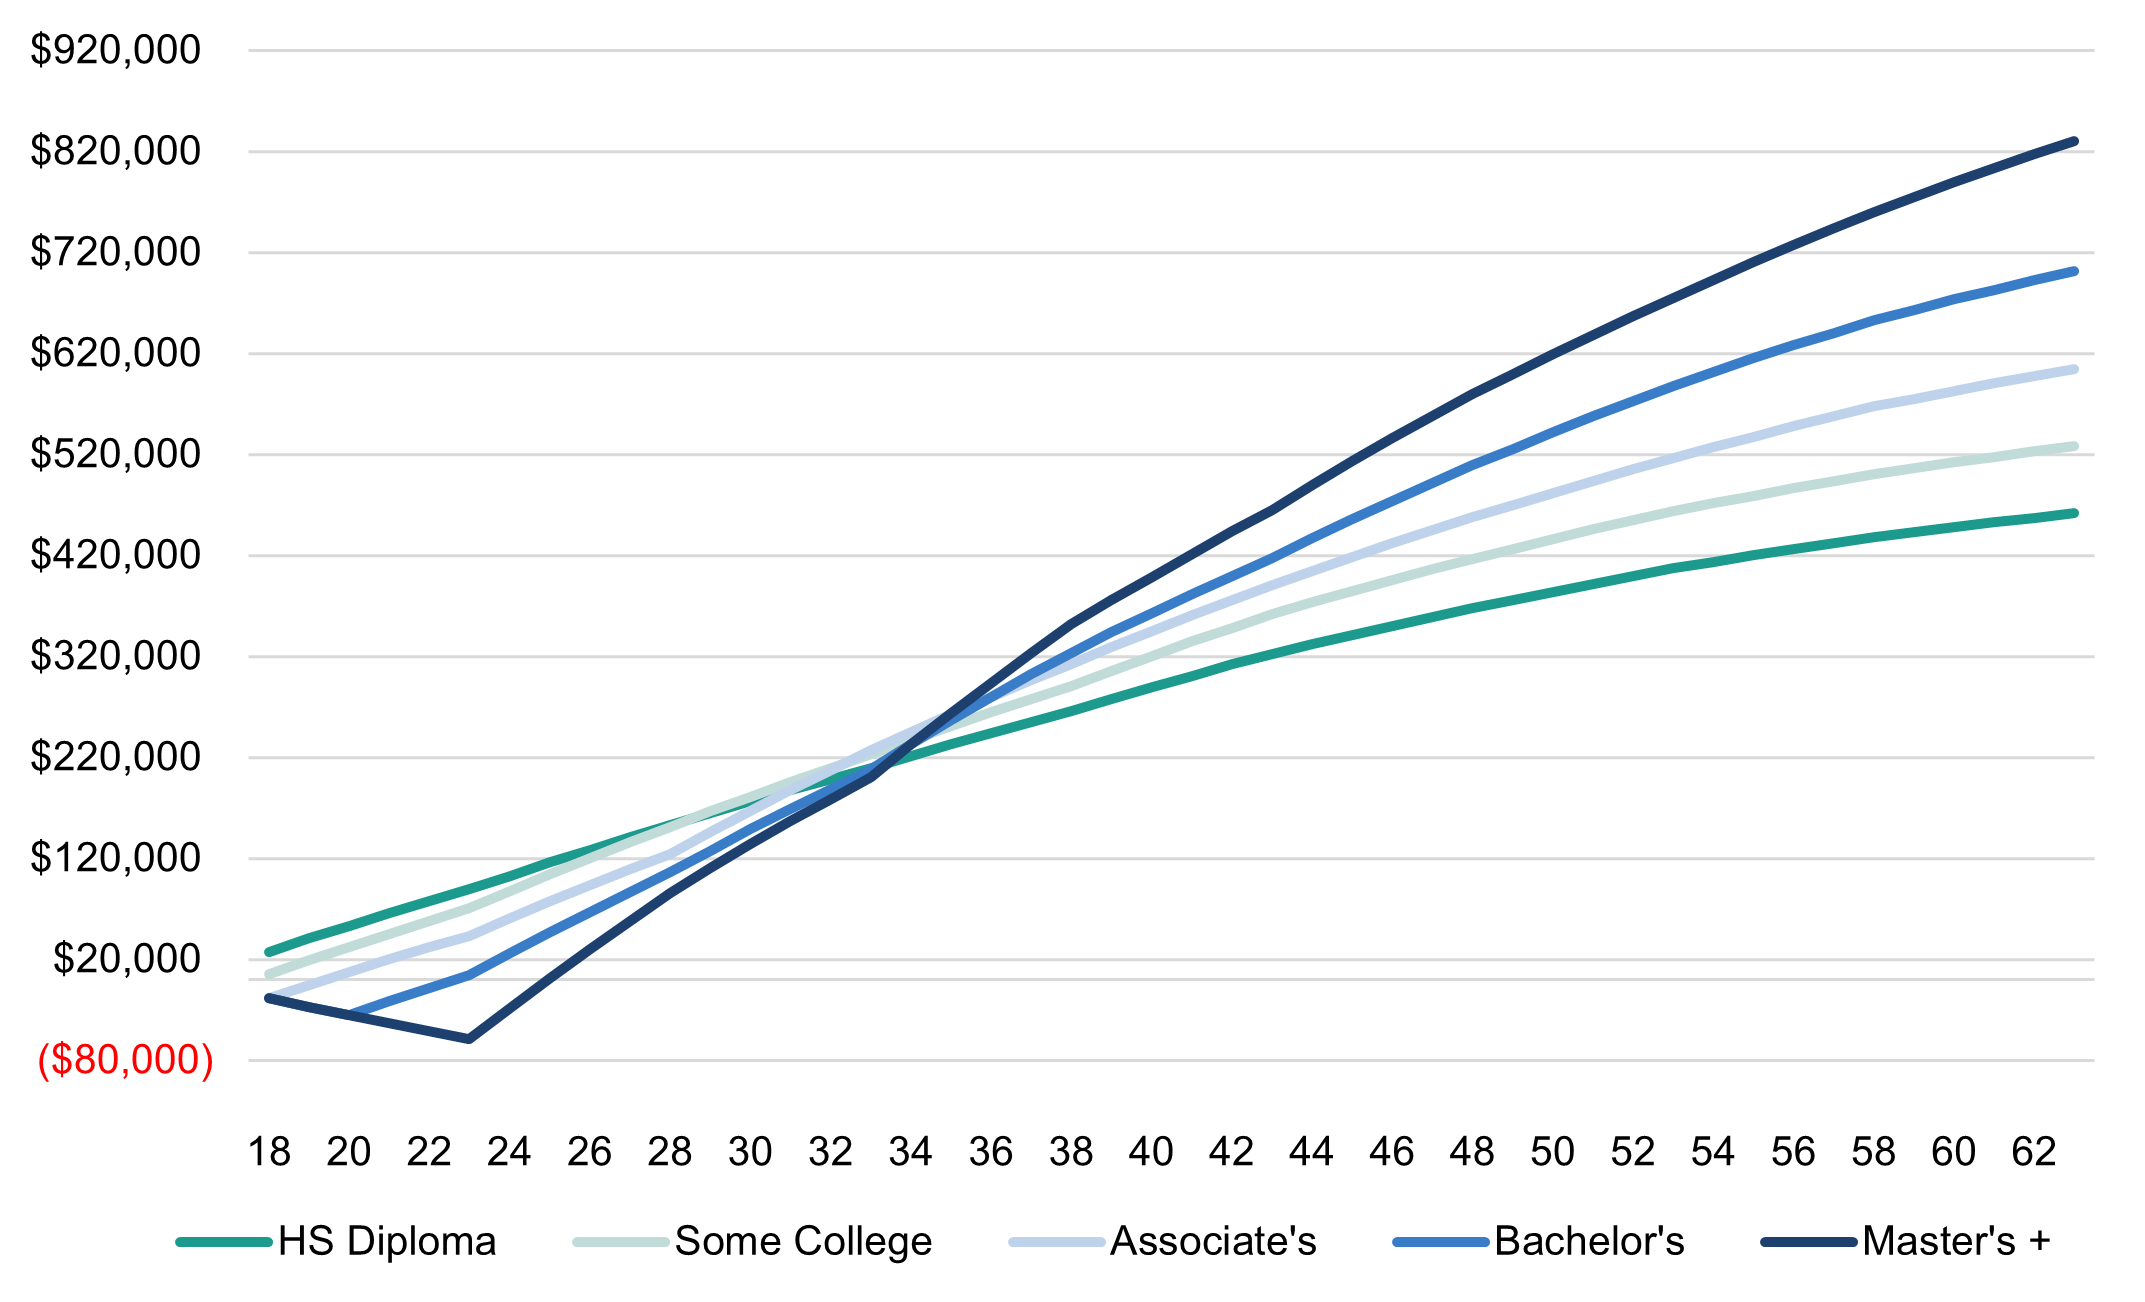
Not only do higher levels of education mean higher earnings for individuals, but the returns to the state are high. Figure 4 shows a set of earnings curves that track the cumulative returns to the state from individuals at different levels of attainment. These returns are tracked over an individual’s working lifetime, in 2020 dollars, and are adjusted for inflation. Returns to the state are calculated by combining the expected state tax revenue Mississippi gains, on average, at each level of education, with the average amount that Mississippi spends on social services at each education level. The state earns more in income tax, sales tax, and property, and spends less on Medicaid and social services at each level of higher education.
Figure 4: Estimated lifetime returns to the state of Mississippians by postsecondary credential
The public return on investment to higher education has the potential to boost the state’s coffers by millions of dollars. We estimate that every percentage point increase in Mississippi’s attainment rate has the potential to increase the state’s net revenues by more than $21 million annually.[21] Based on current population totals, Mississippi would need 265,541 additional credentials to increase attainment by 17.6 percentage points and reach its 60 percent attainment goal. Figure 5 shows the additional revenue the state can expect to earn if this credential gap is closed. Figure 5 outlines how the returns to the state would vary based on the type of credentials that were gained to make up the 265,541 gap. “Some college” represents the expected return to the state if this gap was closed entirely by sub-associate’s credential production. Likewise, the bachelor’s degree bar represents the returns the state could expect if each credential produced to fill the gap was a bachelor’s degree. The proportional category represents what the state could expect to earn if the credential gap was filled with the same combination of bachelor’s degrees, associate’s degrees, and sub-associate’s credentials that we see in the state today.
Figure 5: Estimated annual fiscal benefits Mississippi can expect from increased state tax revenue and reduced social services spending by reaching its educational attainment goal
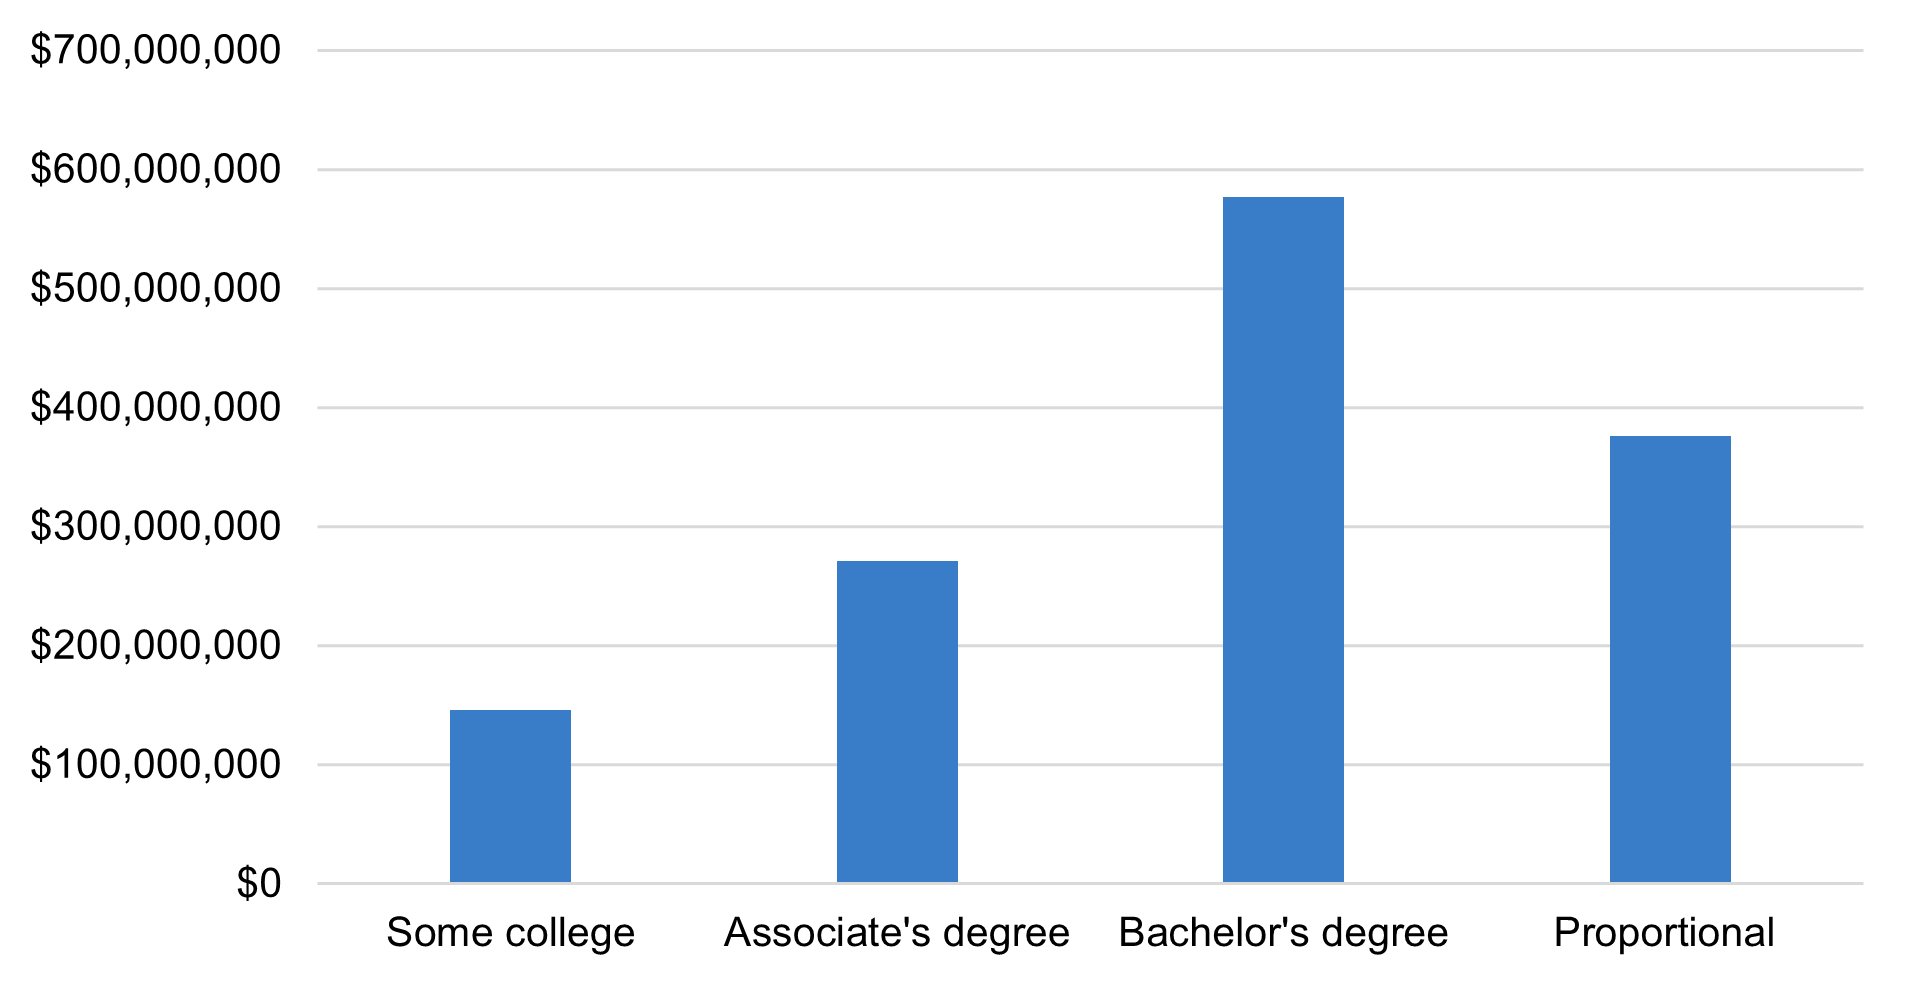
As Mississippi moves closer towards 60 percent attainment, considering which types of credentials are being earned is important. Bachelor’s degrees offer the greatest opportunity for improving the earnings of individuals and the returns to the state. However, labor market needs in the state should be considered when making investments, as discussed below.
Recommended Solutions
Transfer
47 percent of graduates from public Mississippi high schools go on to attend a community college in the state, while only about 16 percent attend a public university. Of this group, only 35.8 percent of those who attend community college graduate within three years, and 18.1 percent transferred to a four-year public institution in Mississippi. Roughly 52 percent of Mississippi high school graduates who attend a public four-year institution in the state graduate within six years.[22] Longer time-to-degree combined with the fact that 64 percent of students who complete a bachelor’s degree attend multiple institutions before completing their credentials means that policies that fail to meet the changing patterns of students can lead to a deficit in completions.[23] Strategies that address declines in enrollment and changing transfer patters are necessary steps for the state to meet its attainment goals.
Articulation agreements and transfer pathways help increase transparency around which credits will transfer and help create defined pathways that students can follow. 2+2 articulation agreements are one of the most common forms, where associate’s degree graduates from state community colleges are guaranteed to transfer all their credits to a four-year state institution and enter at the junior-level standing. Transfer pathways operate in a similar fashion, but while articulation agreements do not guarantee that a student’s earned credit will count towards a specific degree, transfer pathways outline the set of courses needed for a student to complete a specific bachelor’s degree after transferring to a four-year institution. Pathways also guarantee that course credit will count towards the intended major requirements.[24] Currently, Mississippi has adopted policies on articulation agreements and a transferable core of lower-division courses.[25] The state guarantees that students who graduate with an associate’s degree from a Mississippi community college and complete the core curriculum with a “C” or higher will satisfy the core at the Mississippi Institution of Higher Learning (IHL) they transfer to. In addition, all courses with a grade of “C” or higher completed as a part of an associate’s degree will be accepted by all IHL institutions.[26]
In addition to having a common core policy, Mississippi also has a reverse transfer agreement. Reverse transfer policies can help those students who have already transferred from a Mississippi community college by requiring public institutions to retroactively grant students an associate’s degree after transferring to a four-year institution.[27] Research has shown that attaining an associate’s degree after transferring to a four-year institution can have positive effects on retention, bachelor’s degree attainment, and boost the confidence of transfer students as they continue their educational journey.[28]
One policy that Mississippi has not implemented at its four-year public institutions is common course numbering. Offering common course numbers, titles, and descriptions, institutions can ease the administrative burden of articulating credits and help students easily transfer across institutions, reducing the credit cost of transfer. More than a simple numbering system, common course numbering offers an opportunity for the state to increase transparency and improve understanding across its universities.
By addressing some key issues, the state has made a great start in crafting a higher education landscape that meets the needs of the transfer students. However, there are several models of improvement that can be replicated to even better support students who need greater flexibility. The Mississippi Articulation and Transfer Tool (MATT) is a good resource for students interested in transferring to a four-year institution, but a statewide set of guaranteed pathways is one of the best ways to simplify the transfer process and provide a clear roadmap.[29] Tennessee has adopted one such transfer pathways program, and this may be used as an example as Mississippi looks to build upon the progress they have already made.[30] Tennessee’s 2021 annual report on articulation and transfer in higher education identified that Tennessee Transfer Pathways (TTP) students in the fall 2014 cohort were “more likely than the overall cohort to have earned both an associate’s and a bachelor’s degree six years after initial enrollment.”[31]
Mississippi may also consider investing in an institutional debt forgiveness program. “Stranded credits” are previously earned academic credits that are inaccessible to a student because of owed debt to an institution. These institutional debts, which are often the result of small fees that disproportionally affect economically disadvantaged students, prevent students from accessing their transcripts or reenrolling at an institution. Around 20,000 students at Mississippi public universities owe an average of $3,000 in institutional debt. Investing in a program that unlocks the transcripts of students with little debt can help thousands of Mississippians attain a postsecondary credential.[32]
Wraparound services
One proven method of improving credential attainment and student’s time-to-degree is the introduction of wraparound support services. Wraparound services involve a holistic approach to student success that revolves around ensuring that the entire range of student needs are addressed. The most successful wraparound support programs address student’s academic performance, socioeconomic status, financial health, and logistic capability by ensuring coordination between counselors, advisors, financial services, and transportation services. These programs attempt to remove the life obstacles that sometimes block student success.[33] Evidence from the University of Chicago’s Urban Labs study shows that “providing comprehensive supports to community college students significantly increases their chances of obtaining an associate degree within three years.”[34]
The City University of New York’s (CUNY) ASAP program represents one of the most successful examples of a wraparound services program. Services provided to the program participants include comprehensive advisement (from an advisor with a small caseload), access to enhanced career services and tutoring, linked courses and seminars for ASAP participants, flexibility with registration, tuition waivers, transportation services, and more.[35] Results from a study conducted by Scrivener and colleagues show that ASAP almost doubled the three-year graduation rates from community colleges and lead to increased enrollment. Despite the large costs associated with ASAP, the program’s success led to a lower cost per degree for ASAP program participants than for those in the general student body.[36] Since 2007, the CUNY ASAP program has been expanded, and it now serves 25,000 students at an average cost of $3,440 per student annually.[37] While this may seem like a high cost, external evaluations have found an average savings of $6,500 per graduate from the program, due in large part to the greatly increased graduation rates.[38]
This example shows how a programmatic change implemented by an entire community college system can lead to dramatically improved results for students across the state.
2. Investing in programs that meet social and labor market needs
Understanding the way that workforce needs intersect with credential attainment in the state is a crucial piece to crafting policy solutions that help Mississippians succeed economically now and in the future. Knowing what jobs are growing, which provide the most opportunity for individuals, and where there may be a gap between credential production and expected job openings can help policymakers meet the needs of local businesses as well as local communities that are facing teacher and nursing shortages. This year it was reported that Mississippi hospitals have about 3,000 total nursing vacancies. Filling the state’s hospitals with qualified workers is vital in the face of the coronavirus pandemic.[39] Mississippi is also facing a teacher shortage, a critically important workforce need when it comes to preparing individuals for college and raising the attainment rate in the state.[40] Businesses looking for workers skilled in technical and STEM fields are also having difficulty filling jobs; CNBC’s 2022 business competitiveness rankings designated Mississippi as one of the worst states for business in the country.[41]
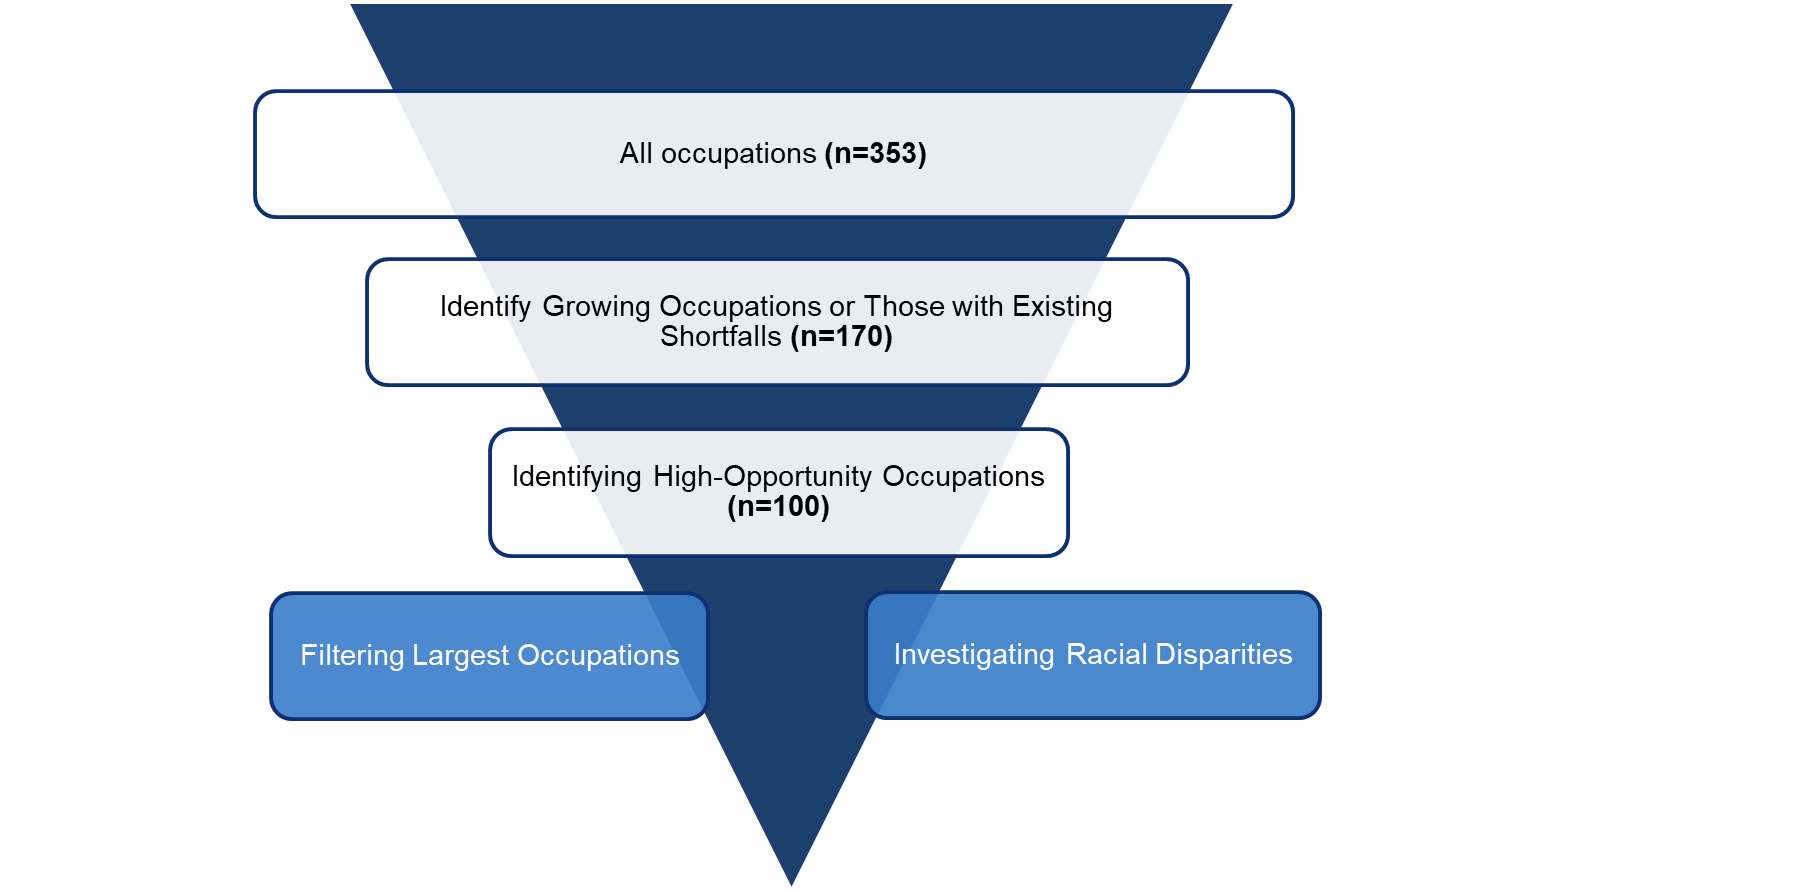
In order to more thoroughly investigate the workforce needs of the state, we used Occupations Projections data from the Mississippi Department of Employment Security (MDES), employment and wage data from the Occupational Employment and Wage Statistics (OWES), and credential completion data from the National Center for Education Statistics (NCES) Integrated Postsecondary Education Data System (IPEDS) to develop a list of high-opportunity occupations. There are three key economic questions that matter when considering what occupations or career fields are designated “high-opportunity” in Mississippi. First, is the earnings potential for these jobs higher than average in the state? Second, is there current employment potential—or a current shortfall between credential production in associated fields at Mississippi institutions and the expected number of annual job openings? And third, is there projected to be future employment potential—does the occupation make up a large portion of employment in the state, or is the occupation projected to grow in the future? To estimate which occupations are considered “high-opportunity,” we identified occupations with either current or future employment potential, and of that group, identified those occupations with high earnings potential. A full list of high-opportunity occupations is available in the appendix of this report. We then filtered this list to investigate the occupations that take up the largest chunk of overall employment in the state and those where there is an opportunity for investments that target racial disparities.
Figure 6: Mississippi high-opportunity occupations
From within our list of high-opportunity occupations, several offer a unique prospect for investment. Figure 7 shows which among the largest occupations in our list are projected to continue growing throughout the decade, and which have a current shortfall between the number of credentials earned in fields associated with the occupation at Mississippi institutions and the average expected annual job openings. This list is comprised of:
- Elementary school teachers
- Welders, cutters, solderers, and brazers
- Construction supervisors
- Electricians
- Heavy and tractor trailer truck drivers
- Industrial machine mechanics
The data show that these occupations are underfilled, and the demand for workers in these fields will only grow in the future. Ensuring that proper pipelines are set in place to fill in-demand jobs is a vital step in improving the economy.
Figure 7: Mississippi high-opportunity occupations with high employment growth and current employment potential
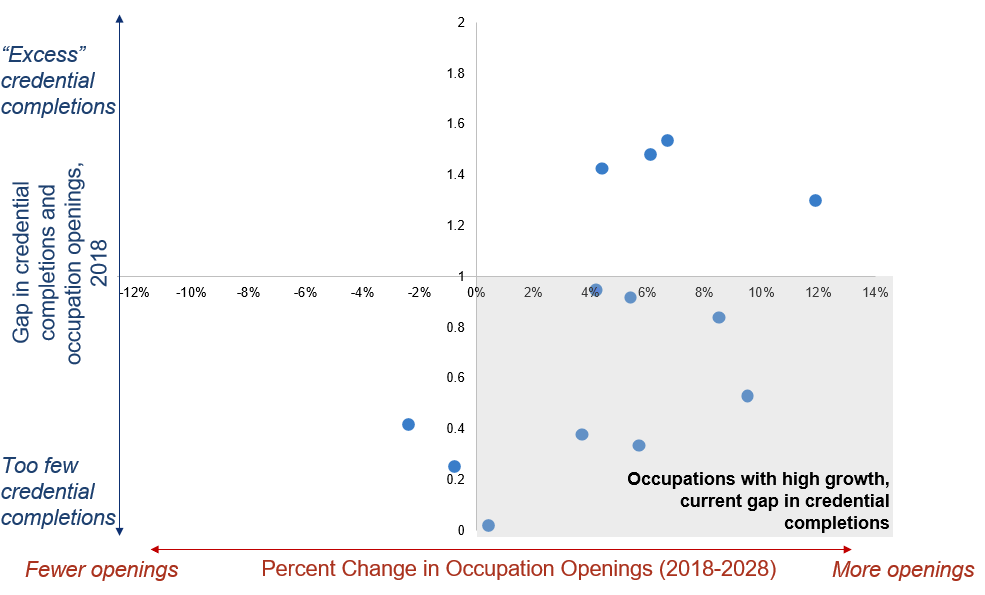
Note that each dot on Figure 7 represents one of the 13 largest Mississippi high-opportunity occupations in terms of overall employment.
Out of our list of high-opportunity occupations, we also identified which occupations have an overrepresentation of white students earning related credentials.[42] Six of these occupations have more than 500 annual expected job openings and are primed for strategic investments to close equity gaps.
Figure 8: Mississippi high-opportunity occupations with racial potential racial disparities
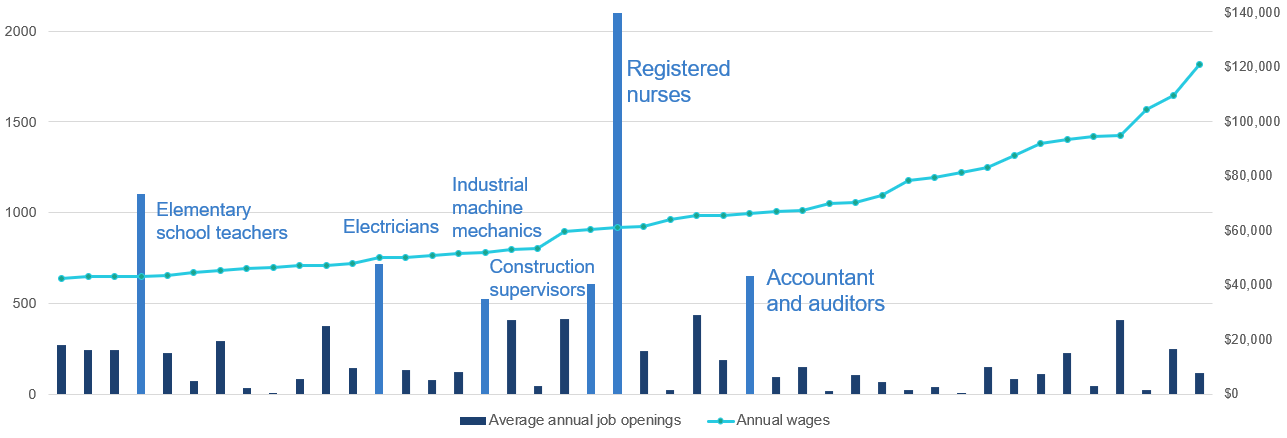
Achieving equitable outcomes for individuals in the state, boosting economic growth, and aligning labor market supply with workforce needs are not separate issues. Investments should be made that consider these together. By identifying gaps in labor supply, and racial gaps in credential production, the state can craft policy that works to fill in labor needs while simultaneously improving equity and contributing to a stronger economy.
Regional differences
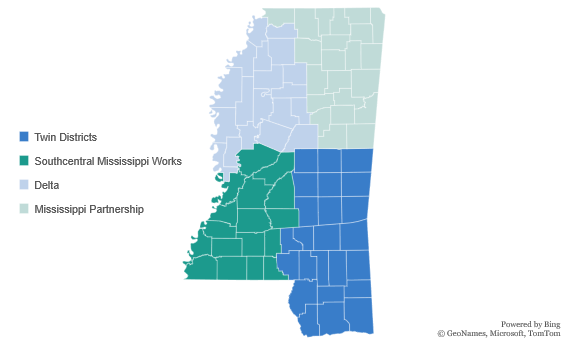
The returns to education differ by region of the state. To examine this, we split the state into the four standard workforce development areas (WDA) used by the Mississippi Department of Employment Security (MDES). Due to data restrictions, the WDA borders have been slightly changed in our analysis.[43] Here, the Delta region contains counties Tate, Yaloshuba, Grenada, Montgomery, and Attala, which are all considered part of the Mississippi Partnership area.
Figure 9: Mississippi Workforce Development Areas
We have replicated our earnings curve analysis for the different regions of the state. Just as the different regions of Mississippi have different workforce needs, the expected labor market returns to education also vary. These differences underlie the importance of carefully crafting state policy to meet the needs of the four regions. In areas where we see low returns to those who only receive a high school diploma, and high returns to those who attain a bachelor’s degree, we understand that incentivizing pathways to bachelor’s degrees for the people in this region is the most efficient allocation of resources. The following figure presents our estimates for the cumulative lifetime earnings of residents in the four WDAs.
Figure 10: Cumulative lifetime earnings for Mississippians by region and postsecondary credential
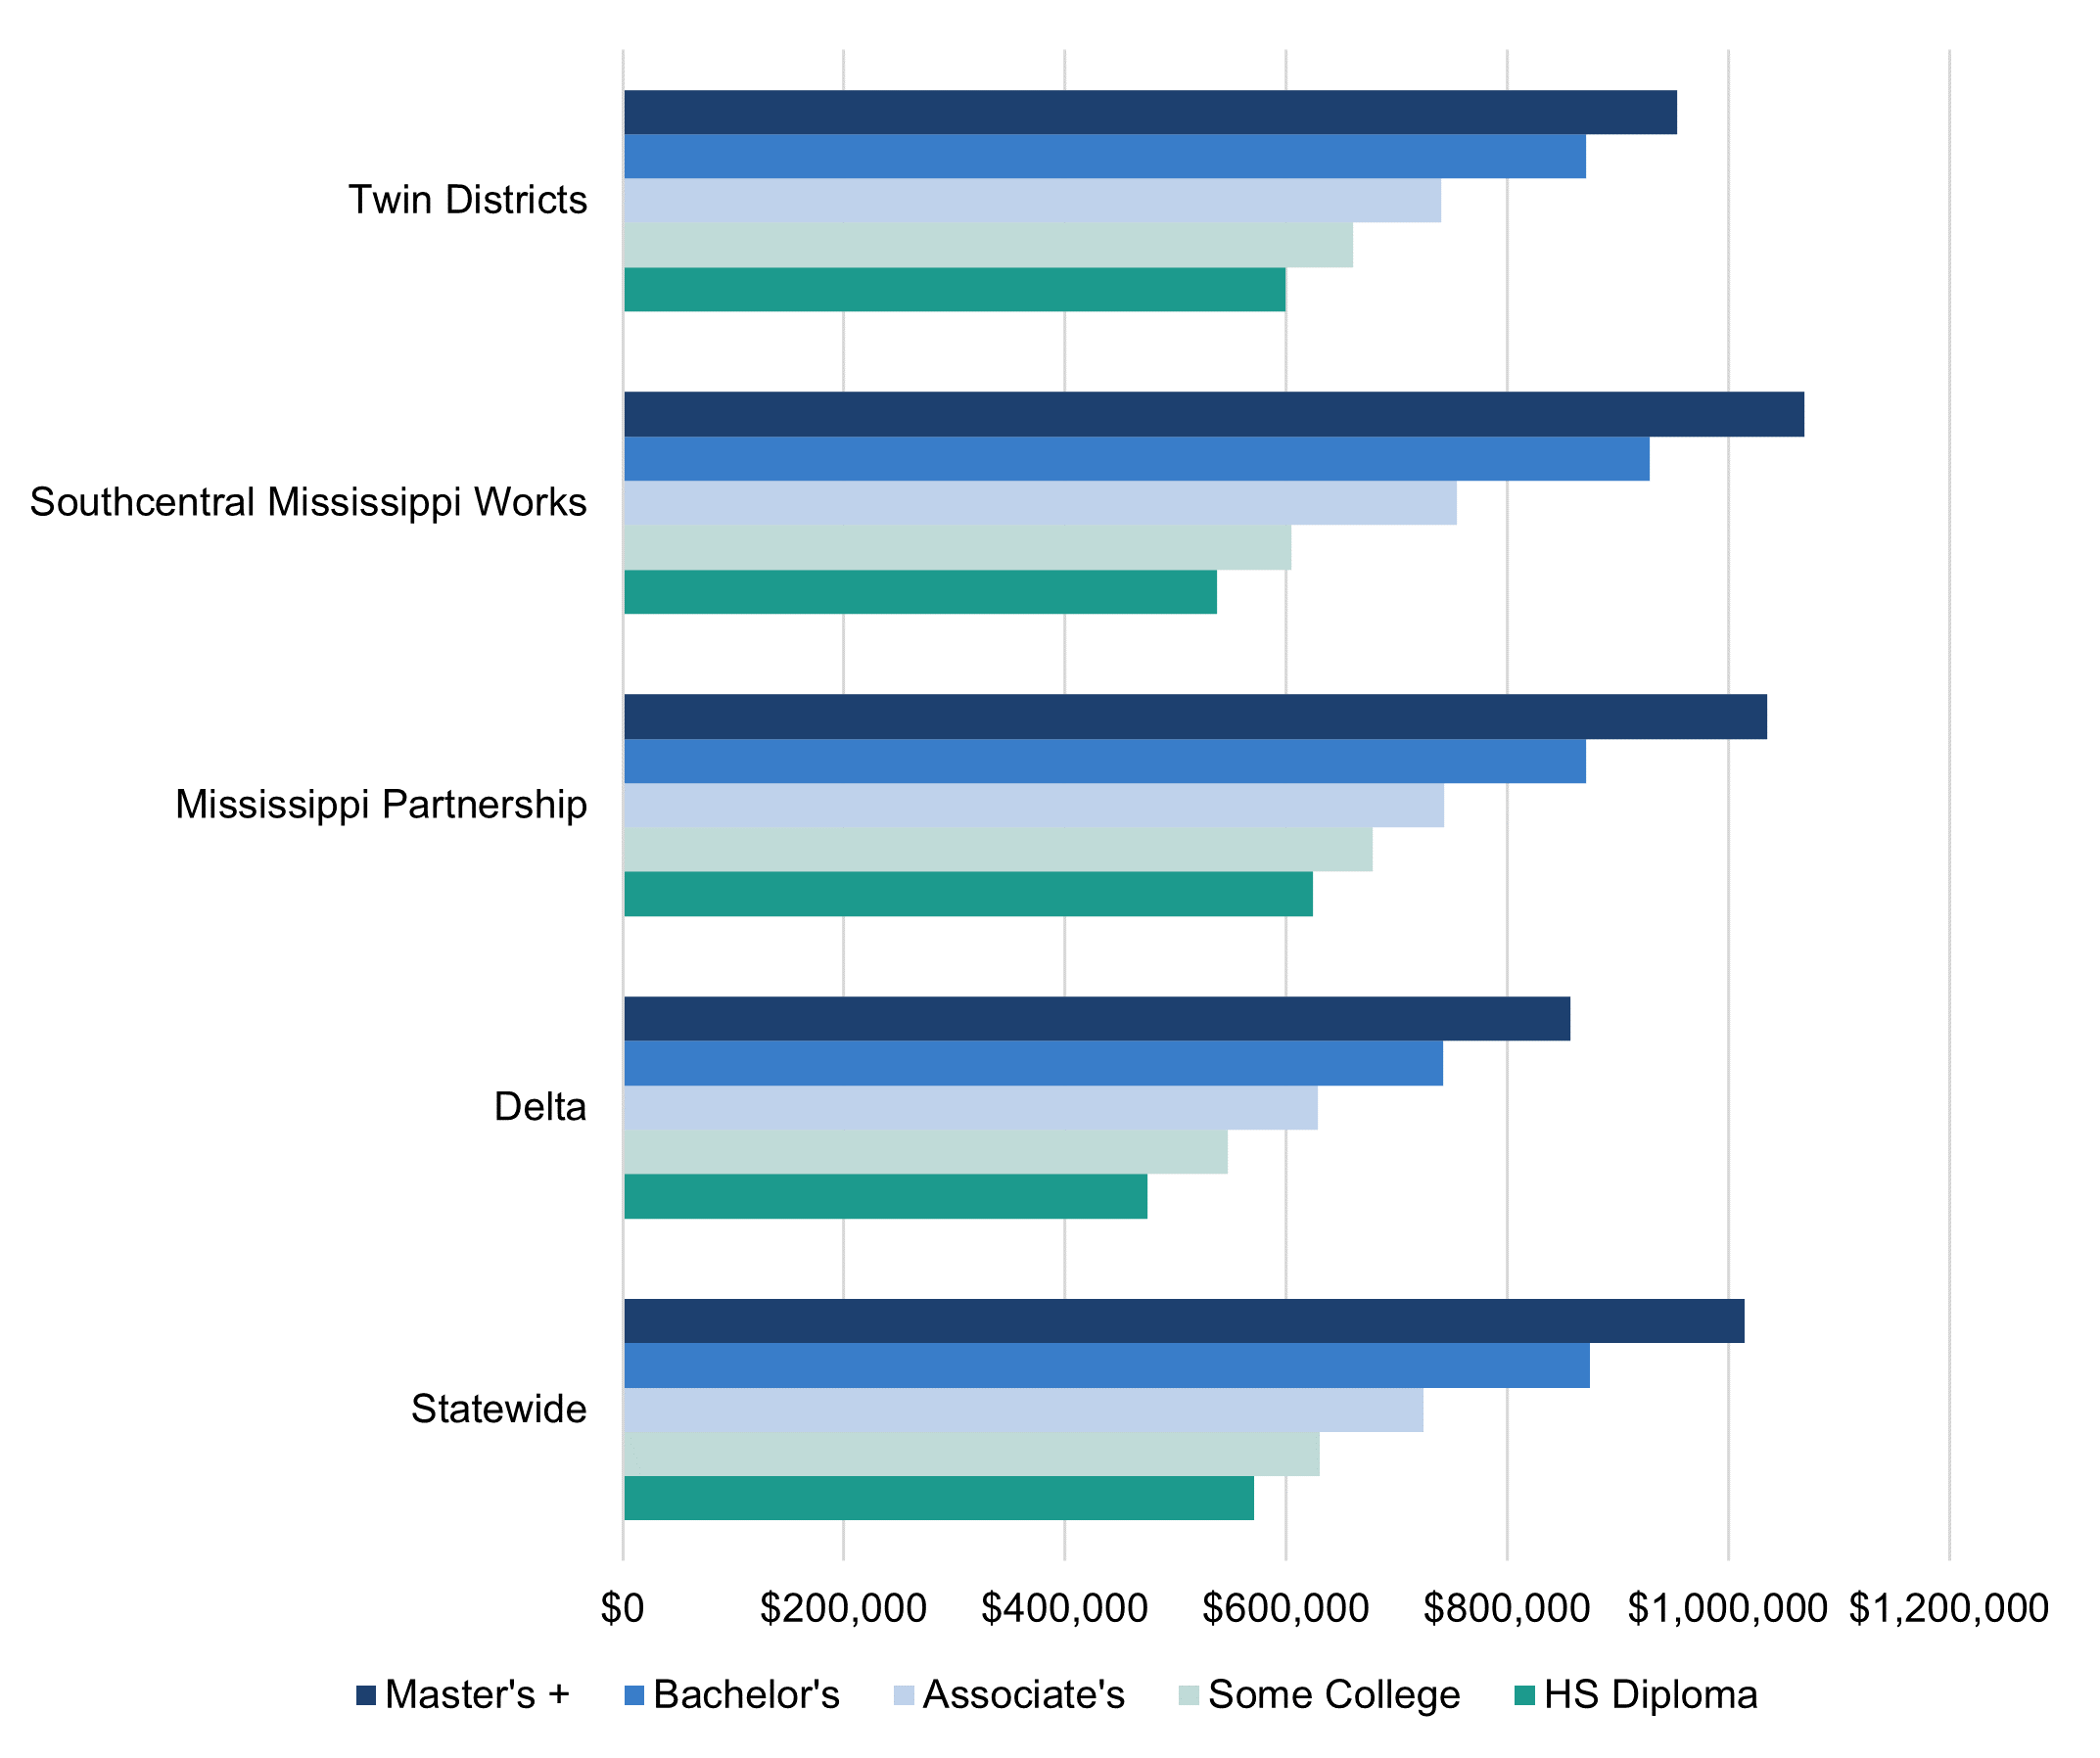
Here we see that the Delta region has the lowest earnings across all education levels. Interestingly, the Southcentral Mississippi Works region has some of the lowest earnings for those at the sub-associate degree level, but the earnings for those with a bachelor’s degree are some of the highest in the state. This wide difference is likely driven in part by the presence of Jackson in this WDA and indicates important differences across regions in the state. While individuals in the Twin Districts region may be able to find well-paying jobs at lower levels of attainment, those living in the Southcentral region may need a bachelor’s degree to earn a living wage.
Figure 11: Cumulative lifetime earnings for Mississippians by region and postsecondary credential, relative to earning a high school diploma
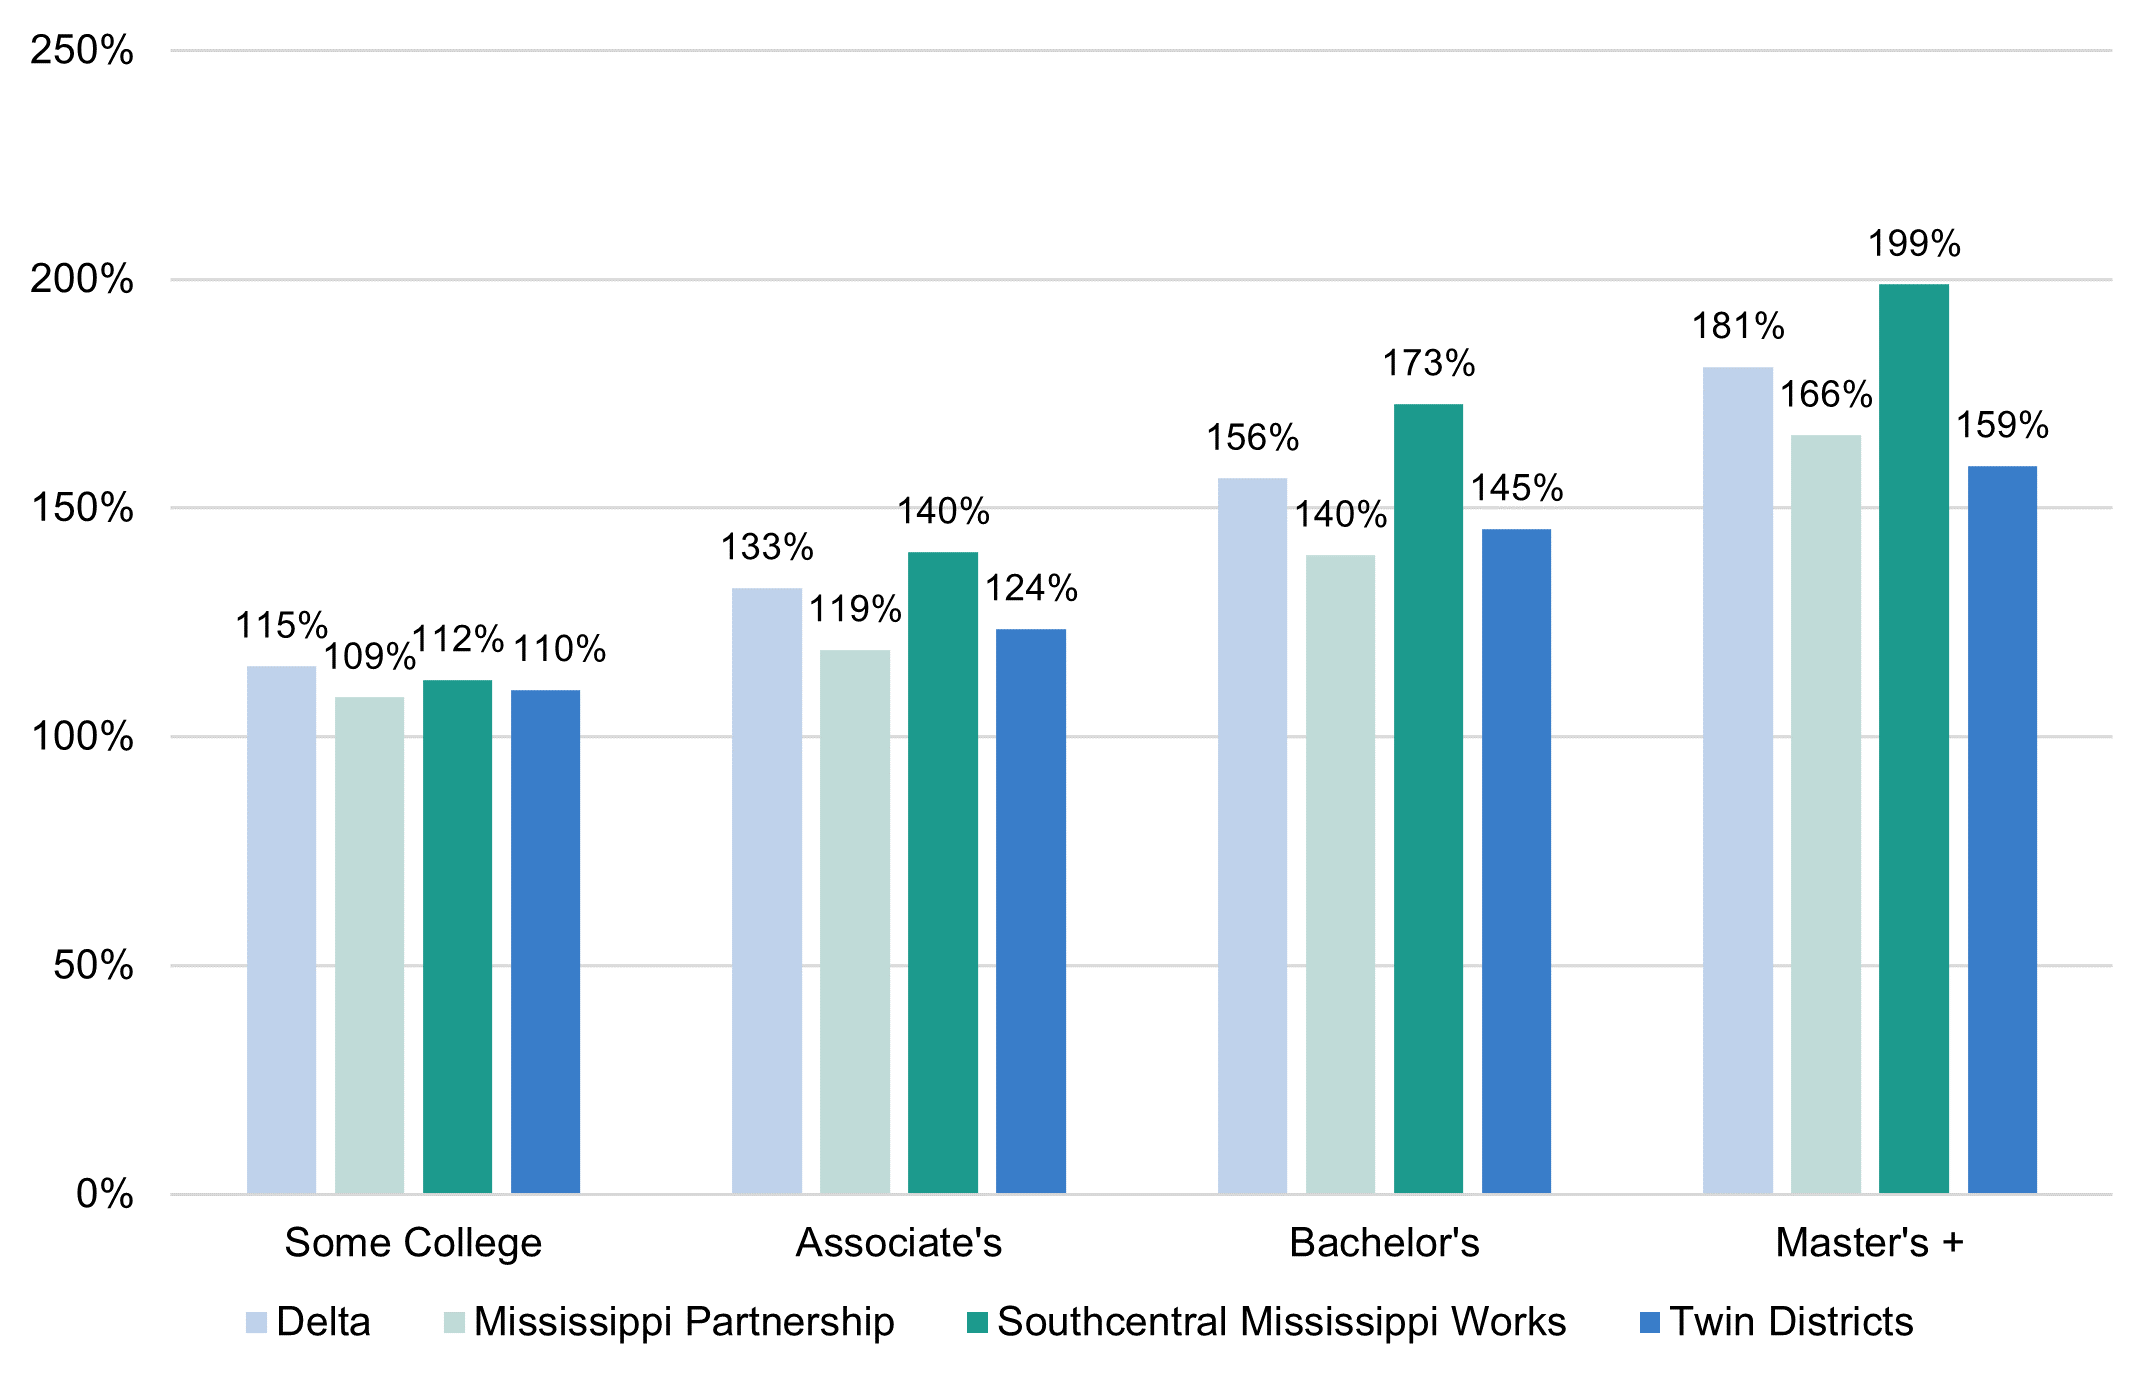
Taking this analysis one step further, individuals in the Southcentral region of the state can expect 1.73 times more in lifetime earnings with a bachelor’s degree than they would with only a high school diploma, by far the largest margin in the state. Mississippians in the Southcentral and Delta regions see the highest relative returns to higher education across all credential types. Understanding the differences in the earnings individuals can expect across local labor markets will help develop economic policy that benefits the entire state.
Recommended solutions
Addressing teacher shortages
With over 3,000 certified teacher vacancies in the state, policies that attract and retain a qualified workforce will have to be implemented. Having an adequate pool of teachers is necessary to prepare students with the tools and education they need to succeed at the postsecondary level. Education graduates pursuing jobs in states with more economic opportunity is part of what’s driving this shortfall. Another factor driving the lack of teacher supply is the falling number of education credentials produced from Mississippi institutions. Since 2011, associate’s degree completions in education have fallen by 46 percent, bachelor’s degree completions have fallen by 31 percent, and master’s degree completions have fallen by 9 percent.
The state took a step forward in 2022 by legislating a pay raise and placing average teacher salaries above the regional average.[44] This raise in wages should help to incentivize Mississippi graduates to stay in state when looking for work, but as education credential completion has fallen in the state since 2011, ensuring that there is a qualified pool of students completing degrees from Mississippi institutions is vital. Recent data also shows that, despite the bump in pay, one in five teachers in Mississippi left the occupation or the state last year.[45] In the most recent data, attrition rates appear to be highest in the state’s worst performing districts, and the US Department of Education’s Teacher Shortage Area (TSA) reports show statewide shortages in mathematics, science, special education, and world language for all grades K-12 in the 2021-2022 school year.[46] The federal government offers Teacher Education Assistance for College and Higher Education (TEACH) grants to incentivize students across the country to graduate with education credentials and teach in high-need fields for a minimum of four school years.[47] These grants offer students up to $3,772 a year in funds (as of FY22) that can be used towards completing their degree. Mississippi can develop a state version of this grant that better matches the needs of the workforce.
A 2020 report from Mississippi First points to stagnate wages and growing tuition costs as the driving factors in the “drying up” of Mississippi’s credential-pursuing educator pipeline. The report suggests that the state update the 1998 Critical Teacher Shortage Act, which was created to improve the pipeline of in-service (licensed teachers) and pre-service (undergraduate candidates) educators in the state.[48] The benefits offered to in-service teachers has remained, but the Critical Needs Teacher Scholarship Program, which offered forgivable loans to pre-service educators, has been removed. The report recommends that the state revamp the Critical Teacher Shortage Act by reintroducing provisions that attract undergraduates into the educator pipeline and incentivize their placement in a critical shortage district. Their recommendations involve parting ways with the loan program and instead creating a grant program to award and incentivize students without the financial risk associated with forgivable loans. Developing a state grant program that targets teachers in critical-need areas should provide an extra boost, and work to immediately begin filling empty positions.
Incentivizing nursing careers
The state has already started taking steps to address nursing shortages. The new Nursing Respiratory Therapy Education Incentive program represents an acknowledgement that Mississippi must do more to attract new nursing students to the state’s institutions. The program is structured around loan forgiveness: students can apply to have their loans forgiven after working in the state for five years after graduation. Students that leave the state or do not end up working as nurses for five years will have to pay the entirety of their loan with interest.[49] Loan forgiveness programs are, by nature, a riskier financial proposition for students. Ideally, all students who intend on becoming nurses in Mississippi will do so, but changing life circumstances may alter plans and designing a nursing incentive program that will not in any way act to the detriment of students who graduate from the state’s institutions is a more equitable approach to incentivizing students. After all, nurses or not, the goal is to use the state’s resources to create an educated and prosperous workforce across all career types. Lawmakers may want to reconsider the Hospital Nurses and Respiratory Therapist Retention Loan Repayment Program, a loan repayment program that would not only attract new students to the field, but could also recruit active nurses to work in the state, thus filling the nursing pipelines in two ways and doing more to address the current need for nurses.[50] Loan repayment programs are also less risky for students, especially if allocated on a per-year basis.
Investing in higher education to close equity gaps in attainment and earnings
Targeting racial and gender equity gaps in educational attainment will be a key strategy as the state moves closer to achieving its educational attainment goal. Attaining higher levels of education can dramatically increase the earnings of thousands of Black Mississippians, and the state sees some of the largest relative returns in increased tax dollars and reduced social spending when Black Mississippians attain higher levels of education. More importantly, as stated in the resolution officially adopting Mississippi’s attainment goal: “The Education Achievement Council is committed to equitable postsecondary outcomes and seeks to close educational equity gaps, where race is no longer a predictor of educational outcomes.”[51]
Boosting economic demand through employment equity
In Mississippi, more than one in every five women live in poverty, one of the highest rates in the country.[52] Women of color are overrepresented in low-wage work, and our research shows that Black residents with a bachelor’s degree see similar rates of employment as white residents with only a high school diploma.[53]
The long-term competitiveness of the state hinges on its ability to bring a diverse set of Mississippians into the labor market. Racial and gender discrimination in the labor market is the driving force behind the difference in outcomes we see across residents of different demographics and education levels. Reducing these barriers is necessary to achieve equitable outcomes for all Mississippians and boost the state’s economy. One study shows that if the state achieved “full employment across all racial and gender groups,” Mississippi’s economy could be $2.5 billion stronger every year. The same study estimates that, in this ideal labor market condition, an additional 171,000 Mississippians would be brought into the workforce, 47,000 fewer residents would live in poverty, and the state would receive almost $600 million in additional tax revenue.[54]
Attainment
Data from Mississippi’s State Longitudinal Data System, Lifetracks, shows that, among Mississippians who graduated from four-year public institutions in 2016, there was an almost 25-percentage point difference in the six-year graduation rates of white residents and Black residents, at 62 percent and 37 percent respectively. Additionally, among first-time full-time students progressing from their freshman to sophomore years of college, white students had a retention rate of 80 percent, compared to only 68 percent for Black students.[55] The Education Trust’s state equity report card for Black Americans ranks Mississippi 37 out of 41 states in attainment. When looking at enrollment representation, or how well the percentage of Black undergraduates reflect the racial/ethnic composition of the population in Mississippi, the Ed Trust gives the state a B+ in community and technical college representation, but only a C+ at four-year institutions, and an F for the racial gap at selective colleges in the state. Mississippi also earns a D in bachelor’s degree representation, and a D in the gap between white and Black Mississippians in bachelor’s degree attainment.[56]
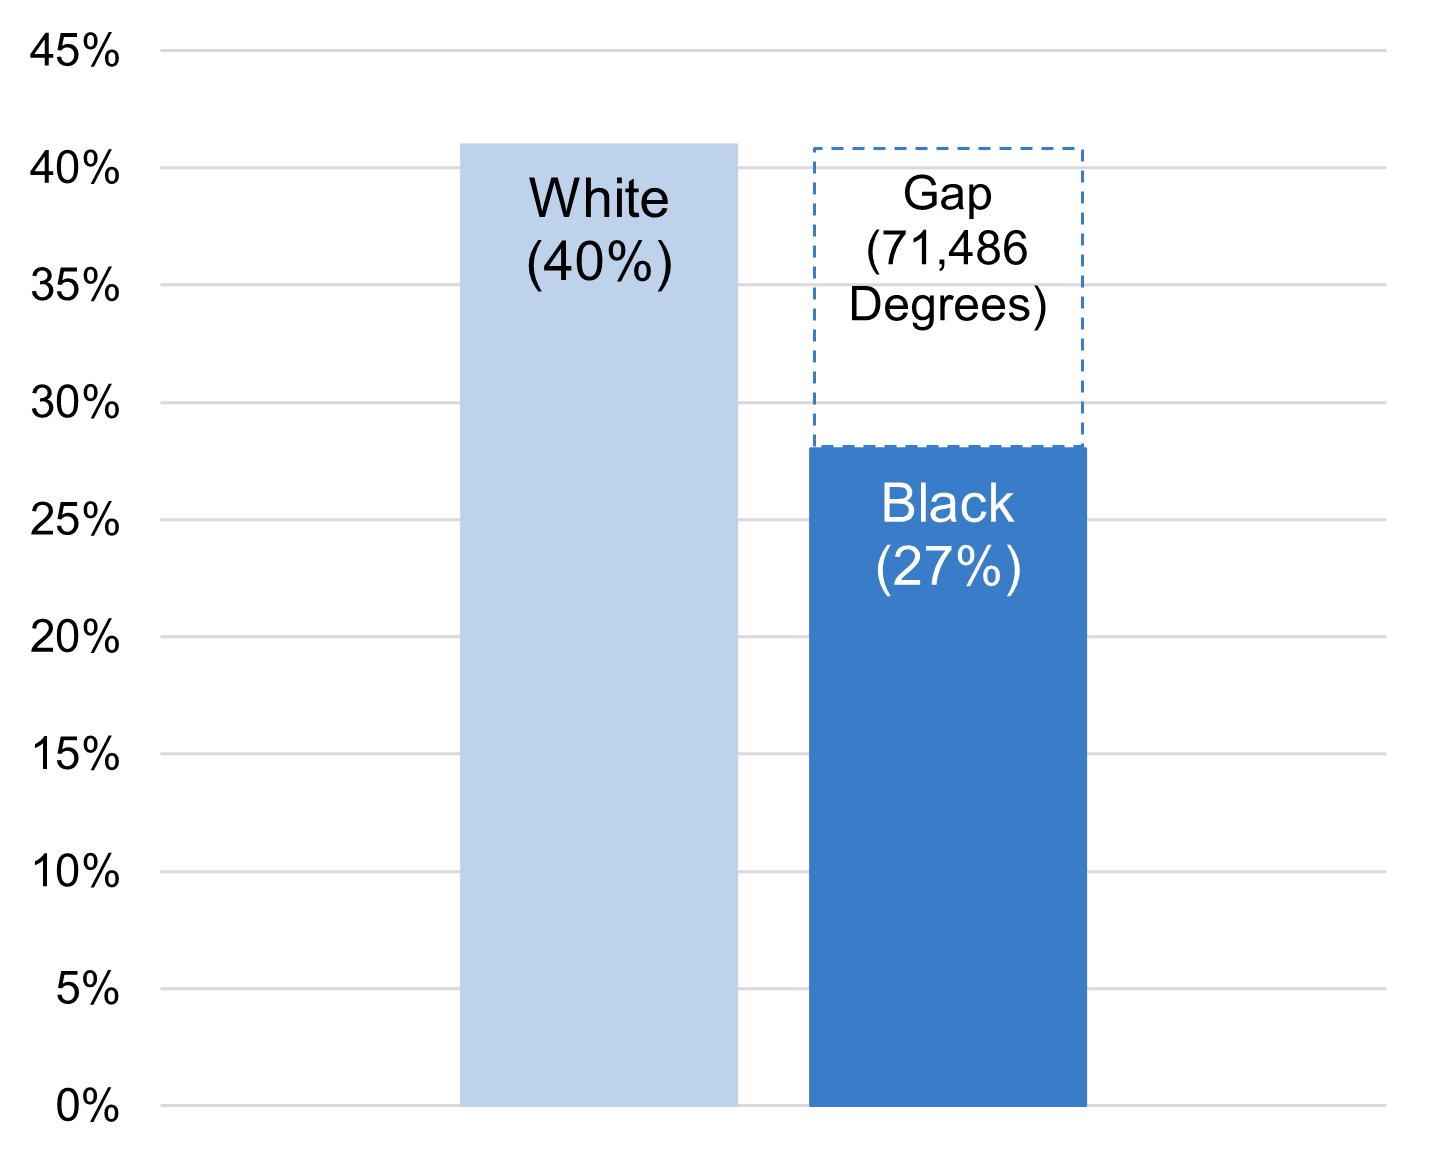
Closing the racial attainment gap is imperative for the state to meet future labor market demands. Not only will closing the gap lead to improved outcomes for individuals, but the economic returns to the state promise to be great. 40 percent of working aged white Mississippians have earned an associate’s degree or higher compared to only 27 percent of Black Mississippians. Closing this gap could result in 71,486 Black working age adults earning a high value postsecondary degree, increasing the overall attainment rate by almost five percentage points.
Figure 12: Closing the racial attainment gap
Earnings and employment
Gaps in attainment are critically important to consider when examining the lifetime earnings of individuals across demographic groups. Figures 13 and 14 show the earnings associated with white Mississippians and Black Mississippians.
Figure 13: Estimated lifetime earnings of white Mississippians by postsecondary credential
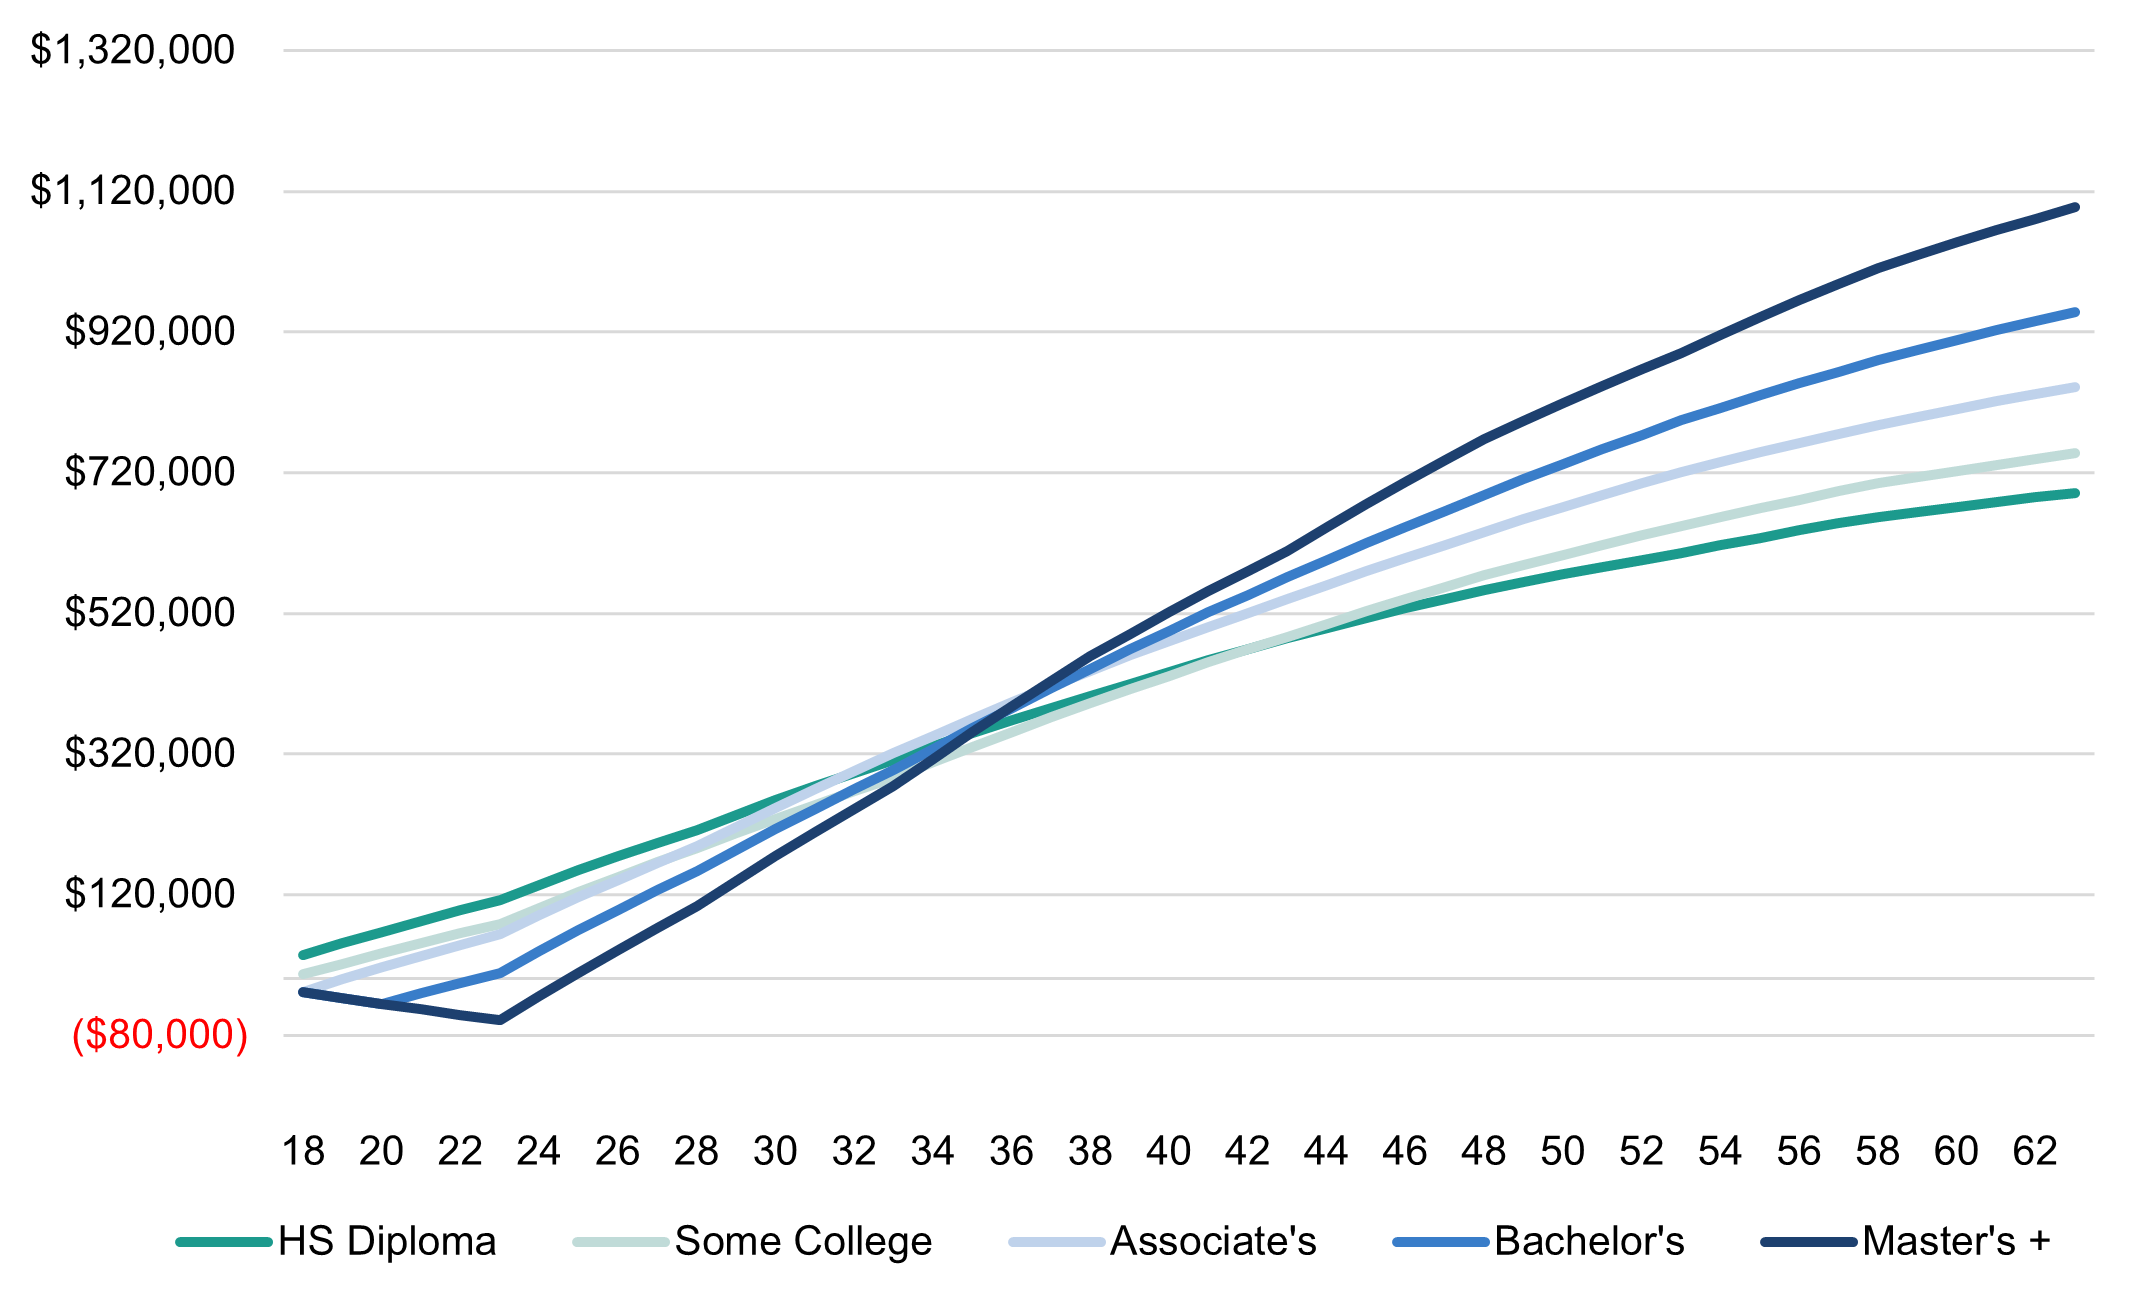
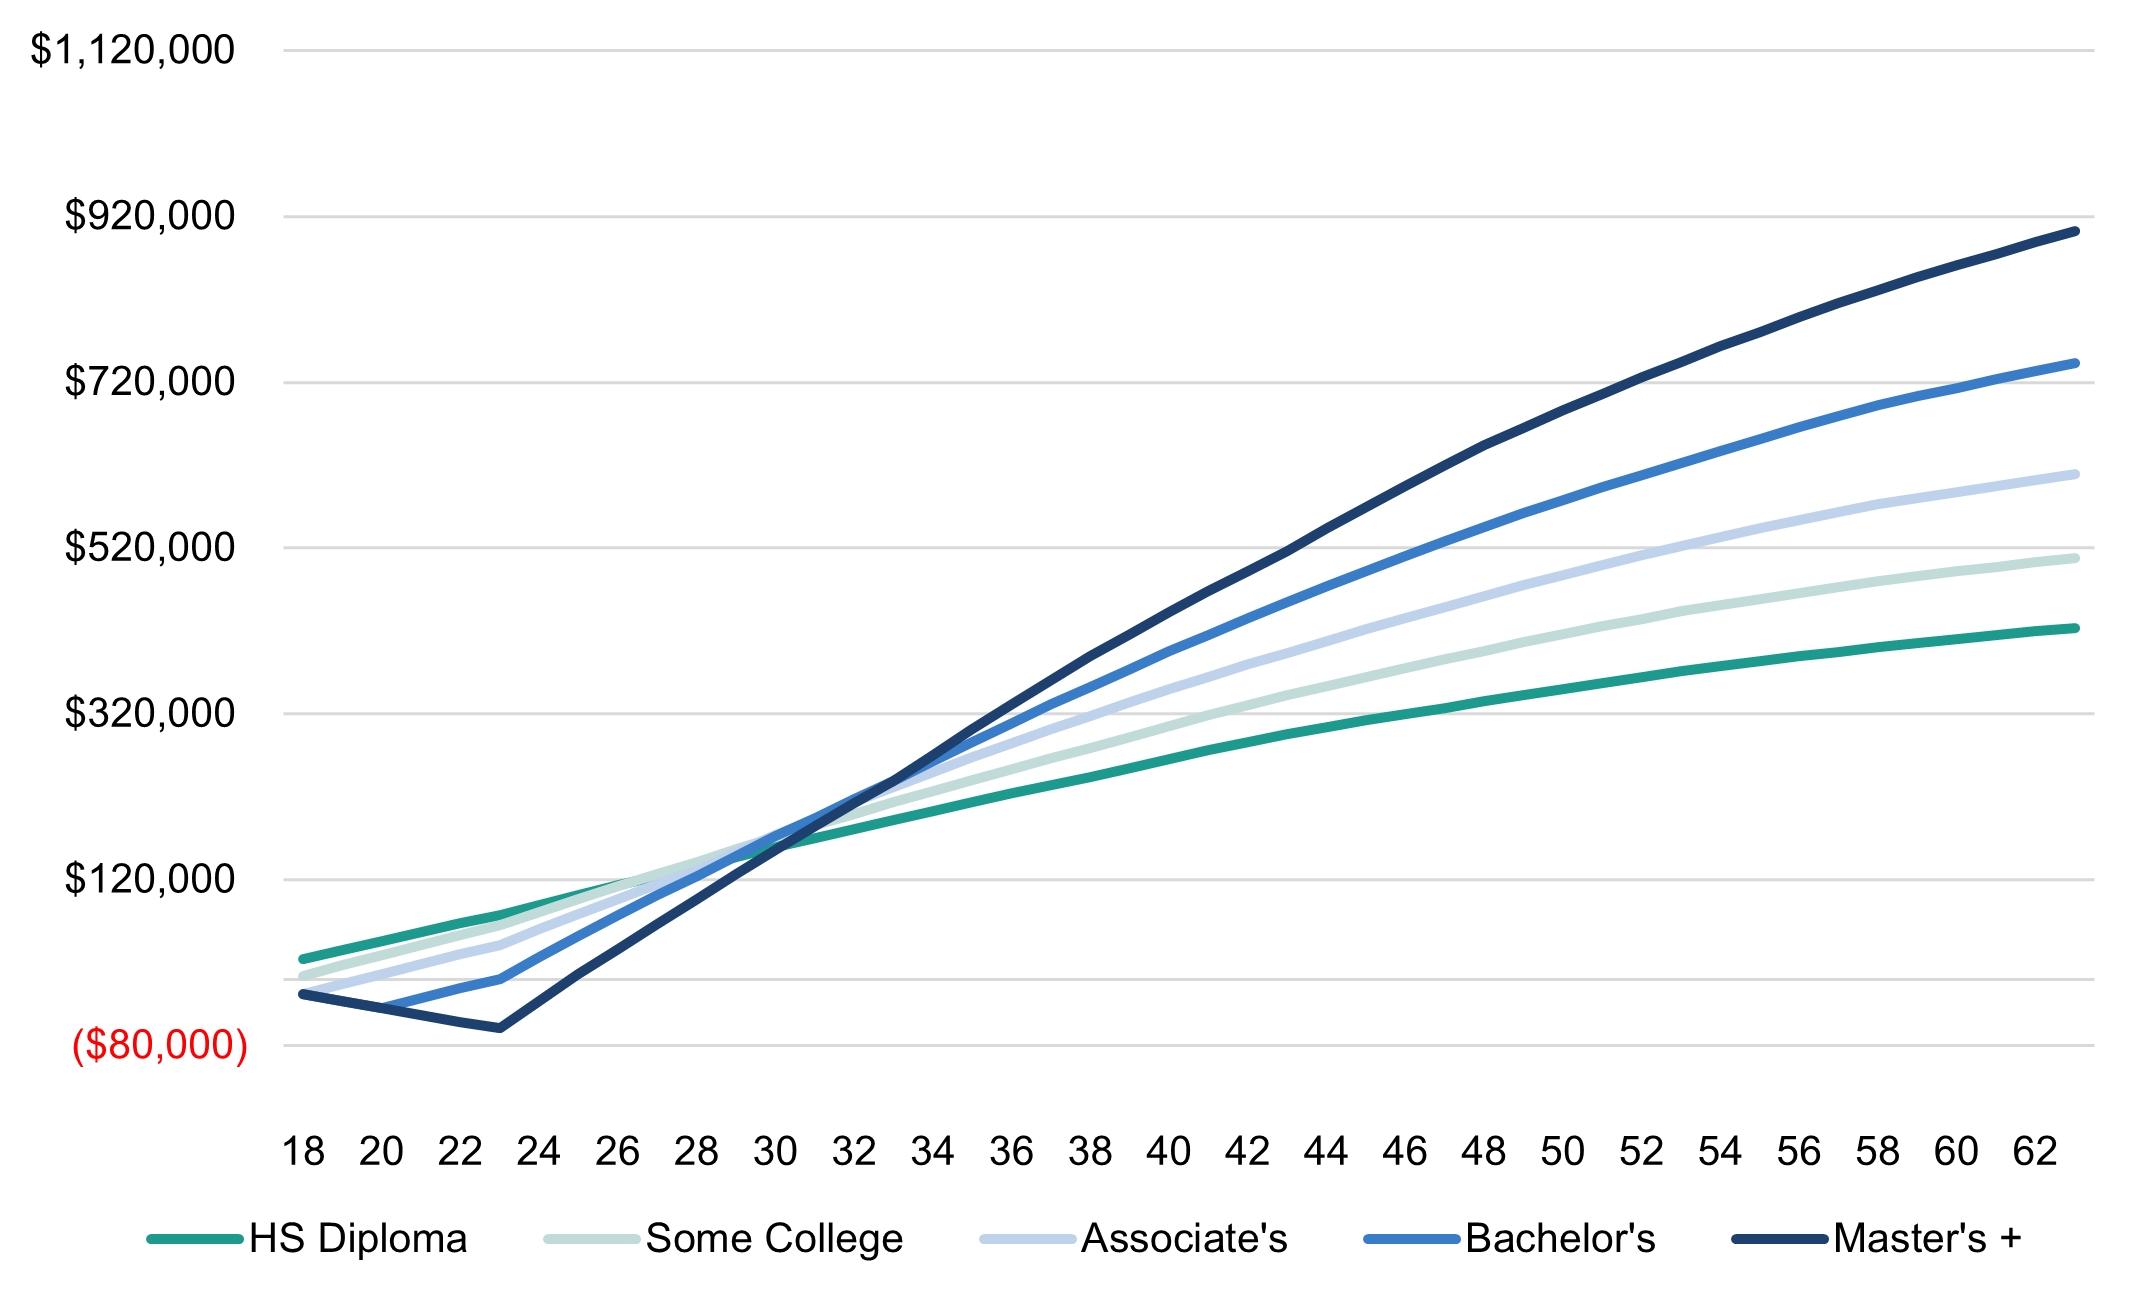
Figure 14: Estimated lifetime earnings of Black Mississippians by postsecondary credential
White Mississippians earn more than Black Mississippians across all education levels, but the relative difference in earnings between only attaining a high school diploma and attaining a postsecondary credential are significantly different across race. White Mississippians with only a high school diploma can expect to earn a similar amount in lifetime earnings as Black Mississippians with bachelor’s degrees. This discrepancy in earnings reflects a legacy of discrimination in the labor market. One study on discrimination in the US labor market found that “discrimination resulting from employer prejudice is quantitatively more important than skill differences [between Black and white residents] to explain wage and employment gaps.”[57] Other research shows that Black job seekers may be half as likely to find employment as white job seekers, and the Black-white gap in wages has only widened since 2000.[58] To earn a living wage in the state, Black residents are required to earn a bachelor’s degree, while white residents may be able to earn a similar wage with only a high school diploma.
Now turning to the lifetime earnings gap between men and women, we see a similar trend. Men with a bachelor’s degree are expected to earn more than $375,000 more than women with the same level of education in lifetime earnings. Men with only a high school diploma are expected to earn about the same in lifetime income than women with a bachelor’s degree in Mississippi. Again, this pay gap is most likely indicative of discrimination in the labor market.
Figure 15: Estimated lifetime earnings of male Mississippians by postsecondary credential
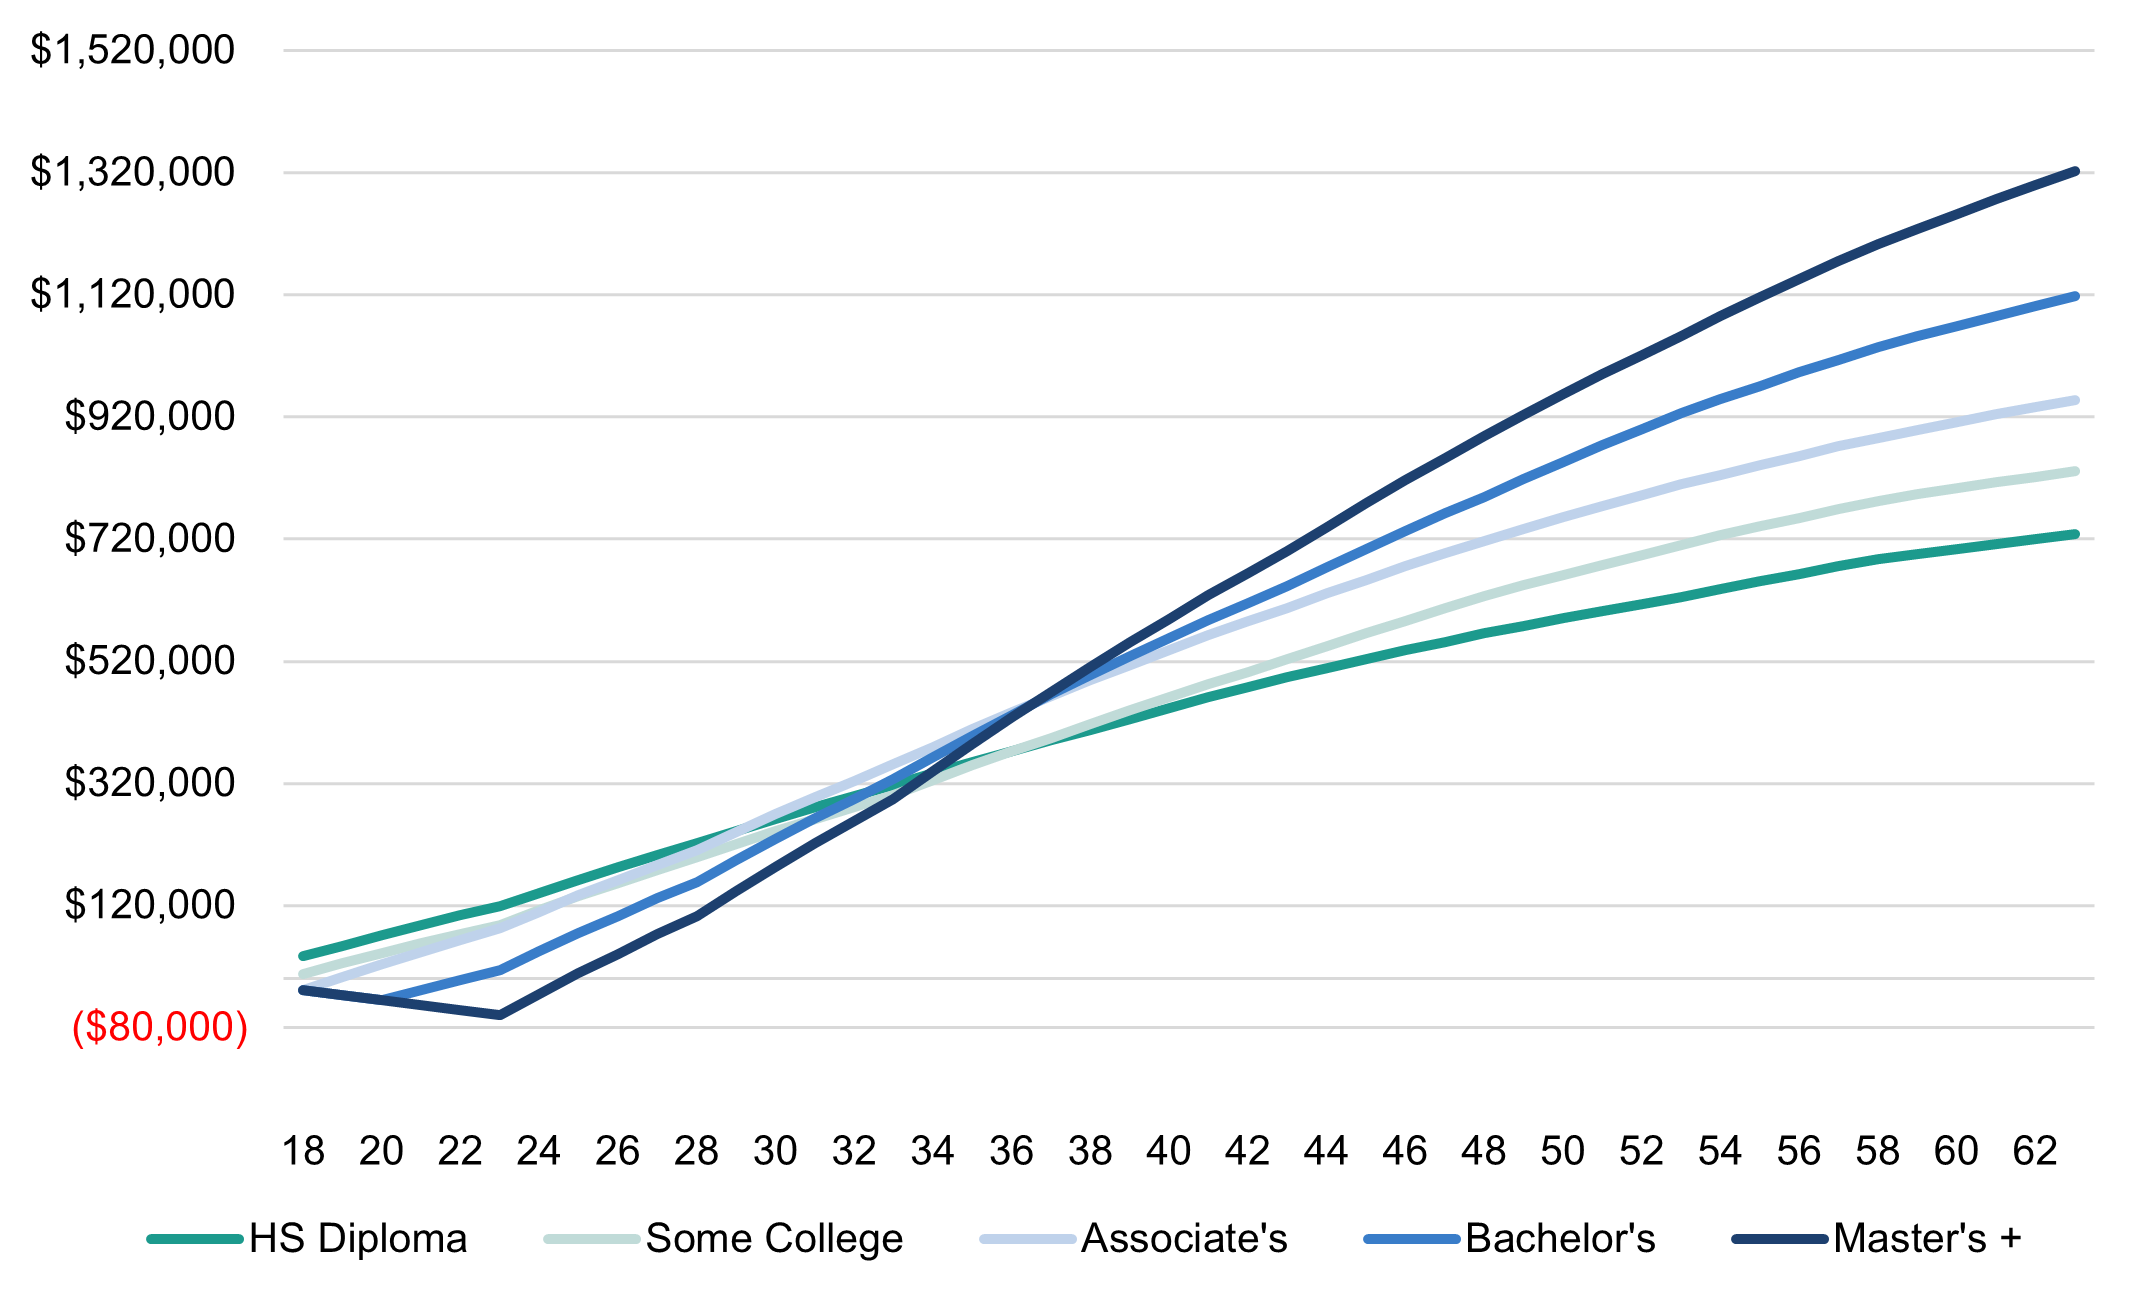
Figure 16: Estimated lifetime earnings of female Mississippians by postsecondary credential
These gaps in expected lifetime earnings are destructive to the state’s economy. The labor market does not act efficiently when discrimination is present, and higher levels of unemployment drain the state’s resources and stagnate growth. We can clearly see where the biggest opportunities for growth are. Concentrating resources towards the education of underrepresented and underpaid populations of the state results in the largest returns on investment. Figure 17 shows the expected lifetime earnings of each demographic group by postsecondary credential, relative to if they had only earned a high school diploma. In this figure we see that the relative earnings of Black residents are much higher compared to those of the white residents of the state, and the relative earnings of women are much higher than those of men.
Figure 17: Cumulative lifetime earnings for Mississippians by race, sex, and postsecondary credential, relative to earning a high school diploma
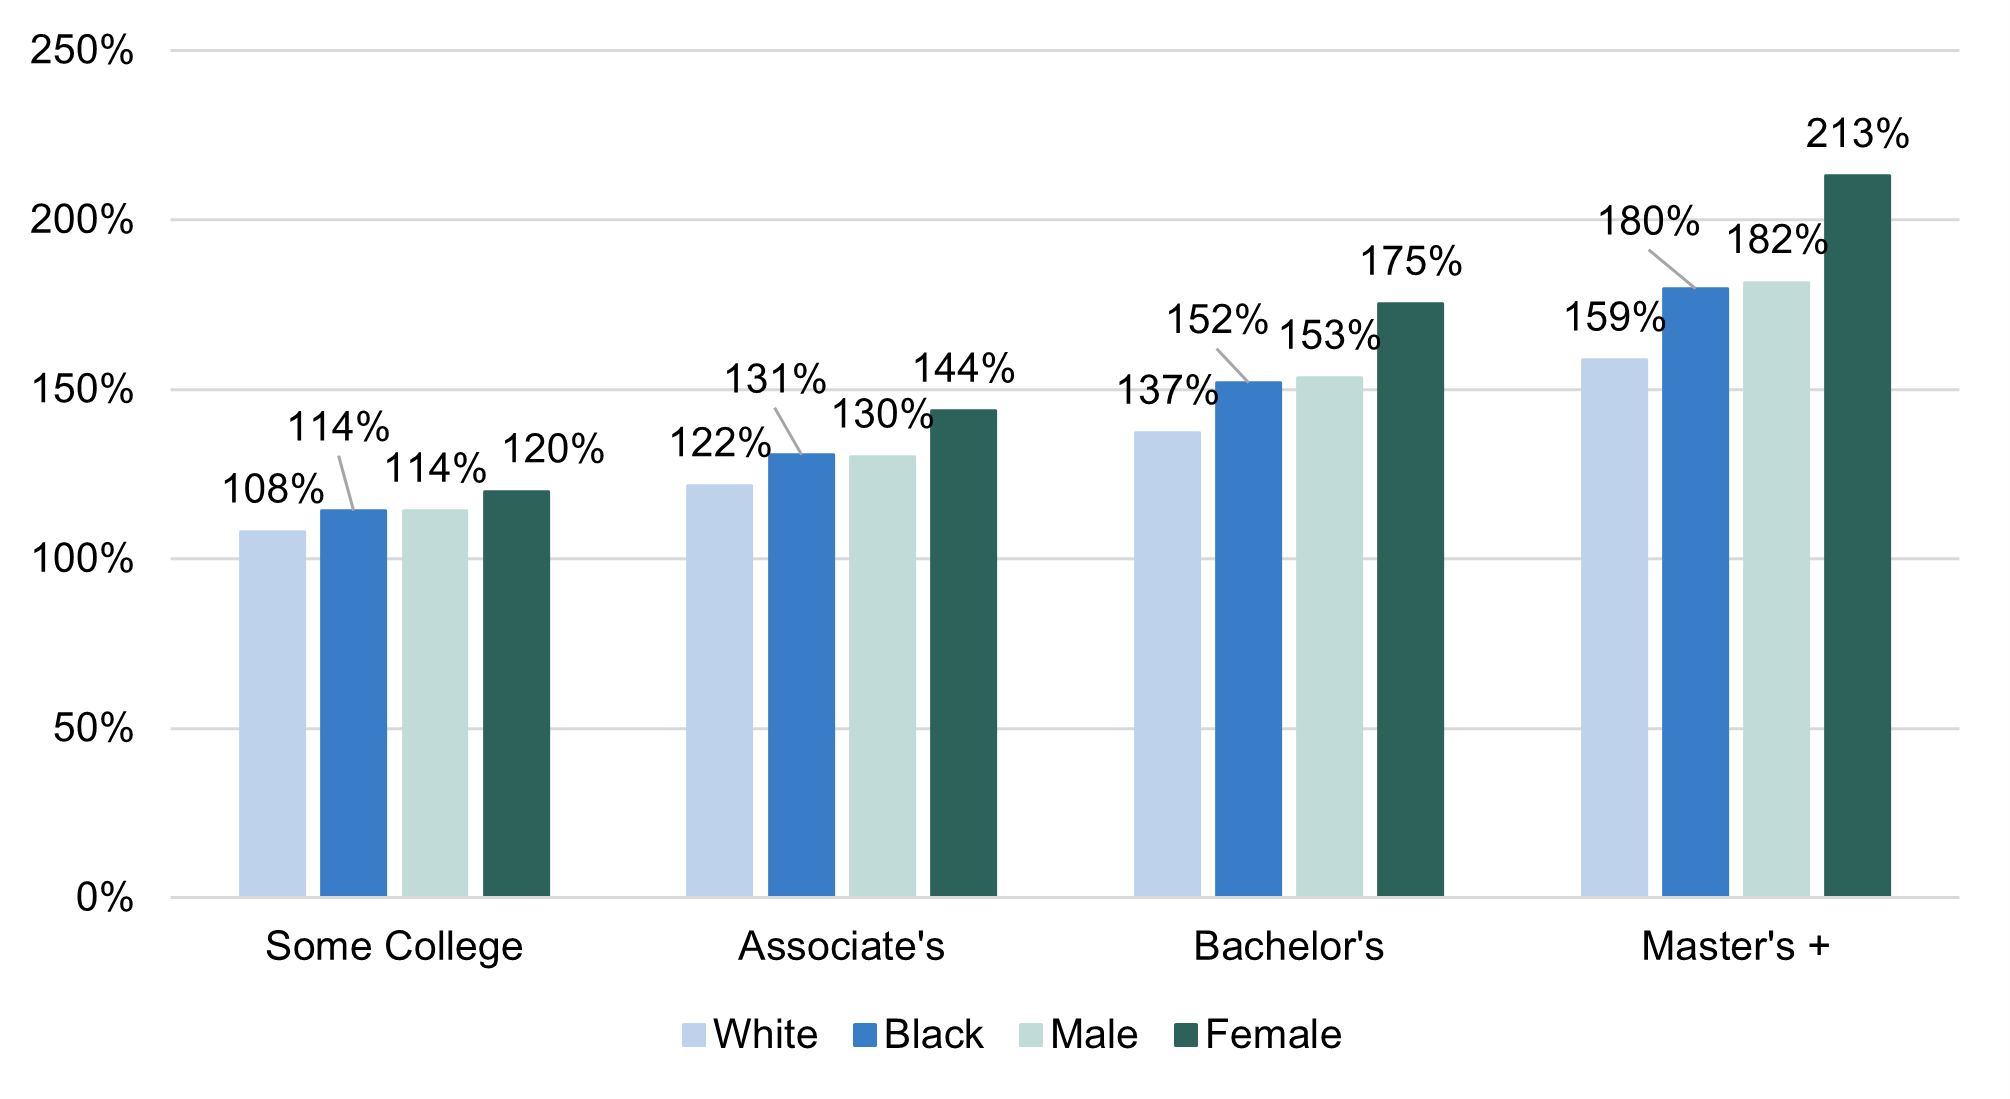
Black residents with a bachelor’s degree earn 1.52 times more in lifetime income than if they had only received a high school diploma, compared to white residents who earn 1.37 times more in income. Women with a bachelor’s degree earn 1.75 times more in lifetime earnings than if they had only received a high school diploma, compared to men who earn 1.53 times more income. This disparity in returns to individuals presents an opportunity for targeted investment by the state. Mississippi can do more to decrease its poverty rate and boost its economy by investing in educational opportunities for the underrepresented and systemically underpaid members of the population.
Investing in educational opportunities for Black and female Mississippians has the greatest fiscal return for the state. Figure 18 shows the percent difference in public returns associated with a given level of educational attainment, relative to only earning a high school diploma.
Figure 18: Cumulative return to the state of Mississippians by race, sex, and postsecondary credential, relative to earning a high school diploma
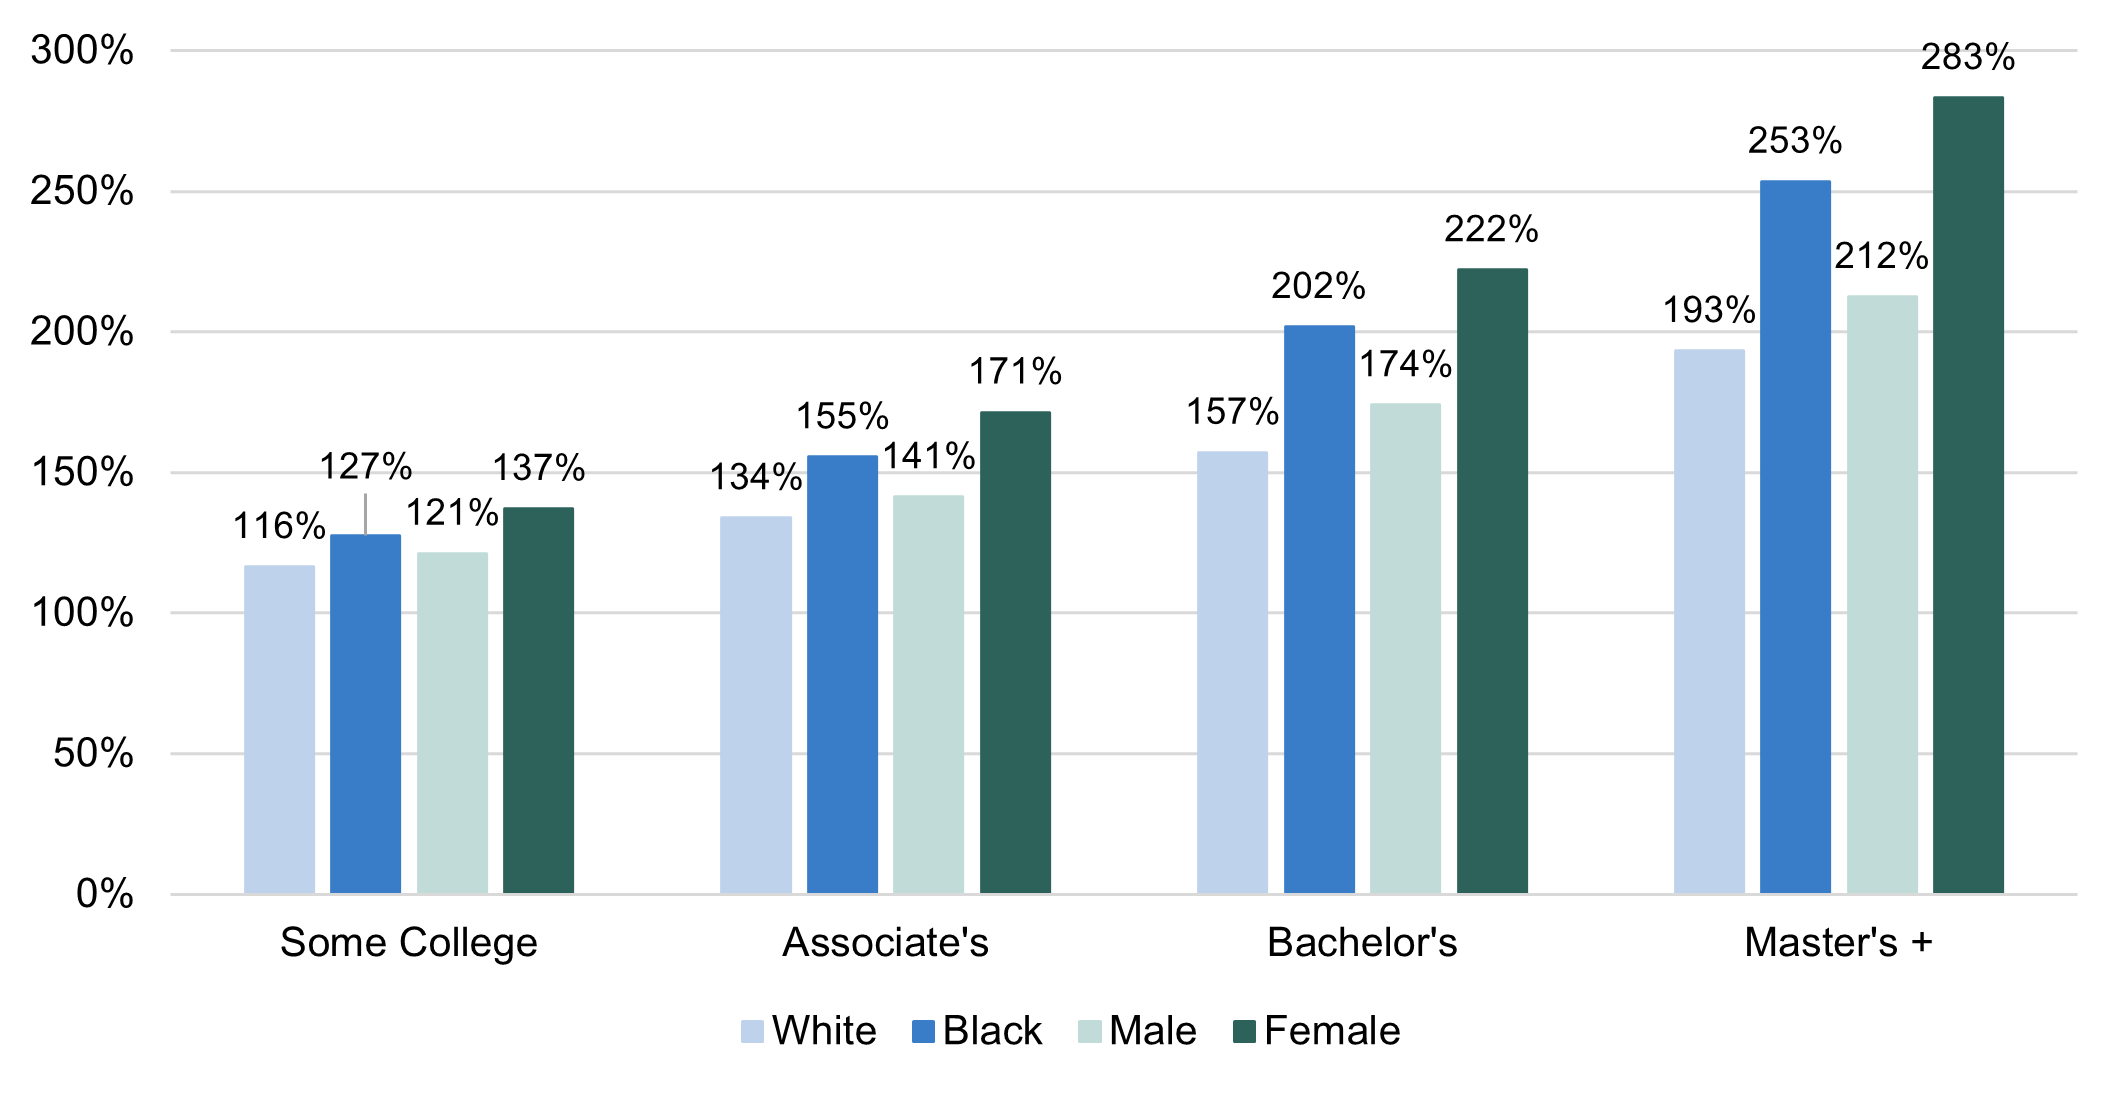
Here we see that Black residents with a bachelor’s degree return over two times more in increased tax revenue and reduced social and Medicaid spending than if they had only received a high school diploma, compared to white residents who return 1.57 times more. In addition, women who earn a bachelor’s degree return 2.22 more to the state, while men return 1.74 times more.
Not only do targeted investments return more to the state, but increased levels of education also lead to increased levels of employment in the state, especially for Black Mississippians and women. Figure 19 shows the difference in employment rates associated with a given level of educational attainment compared to only earning a high school diploma.
Figure 19: Percentage difference in employment rate compared to a high school diploma only, by race and sex
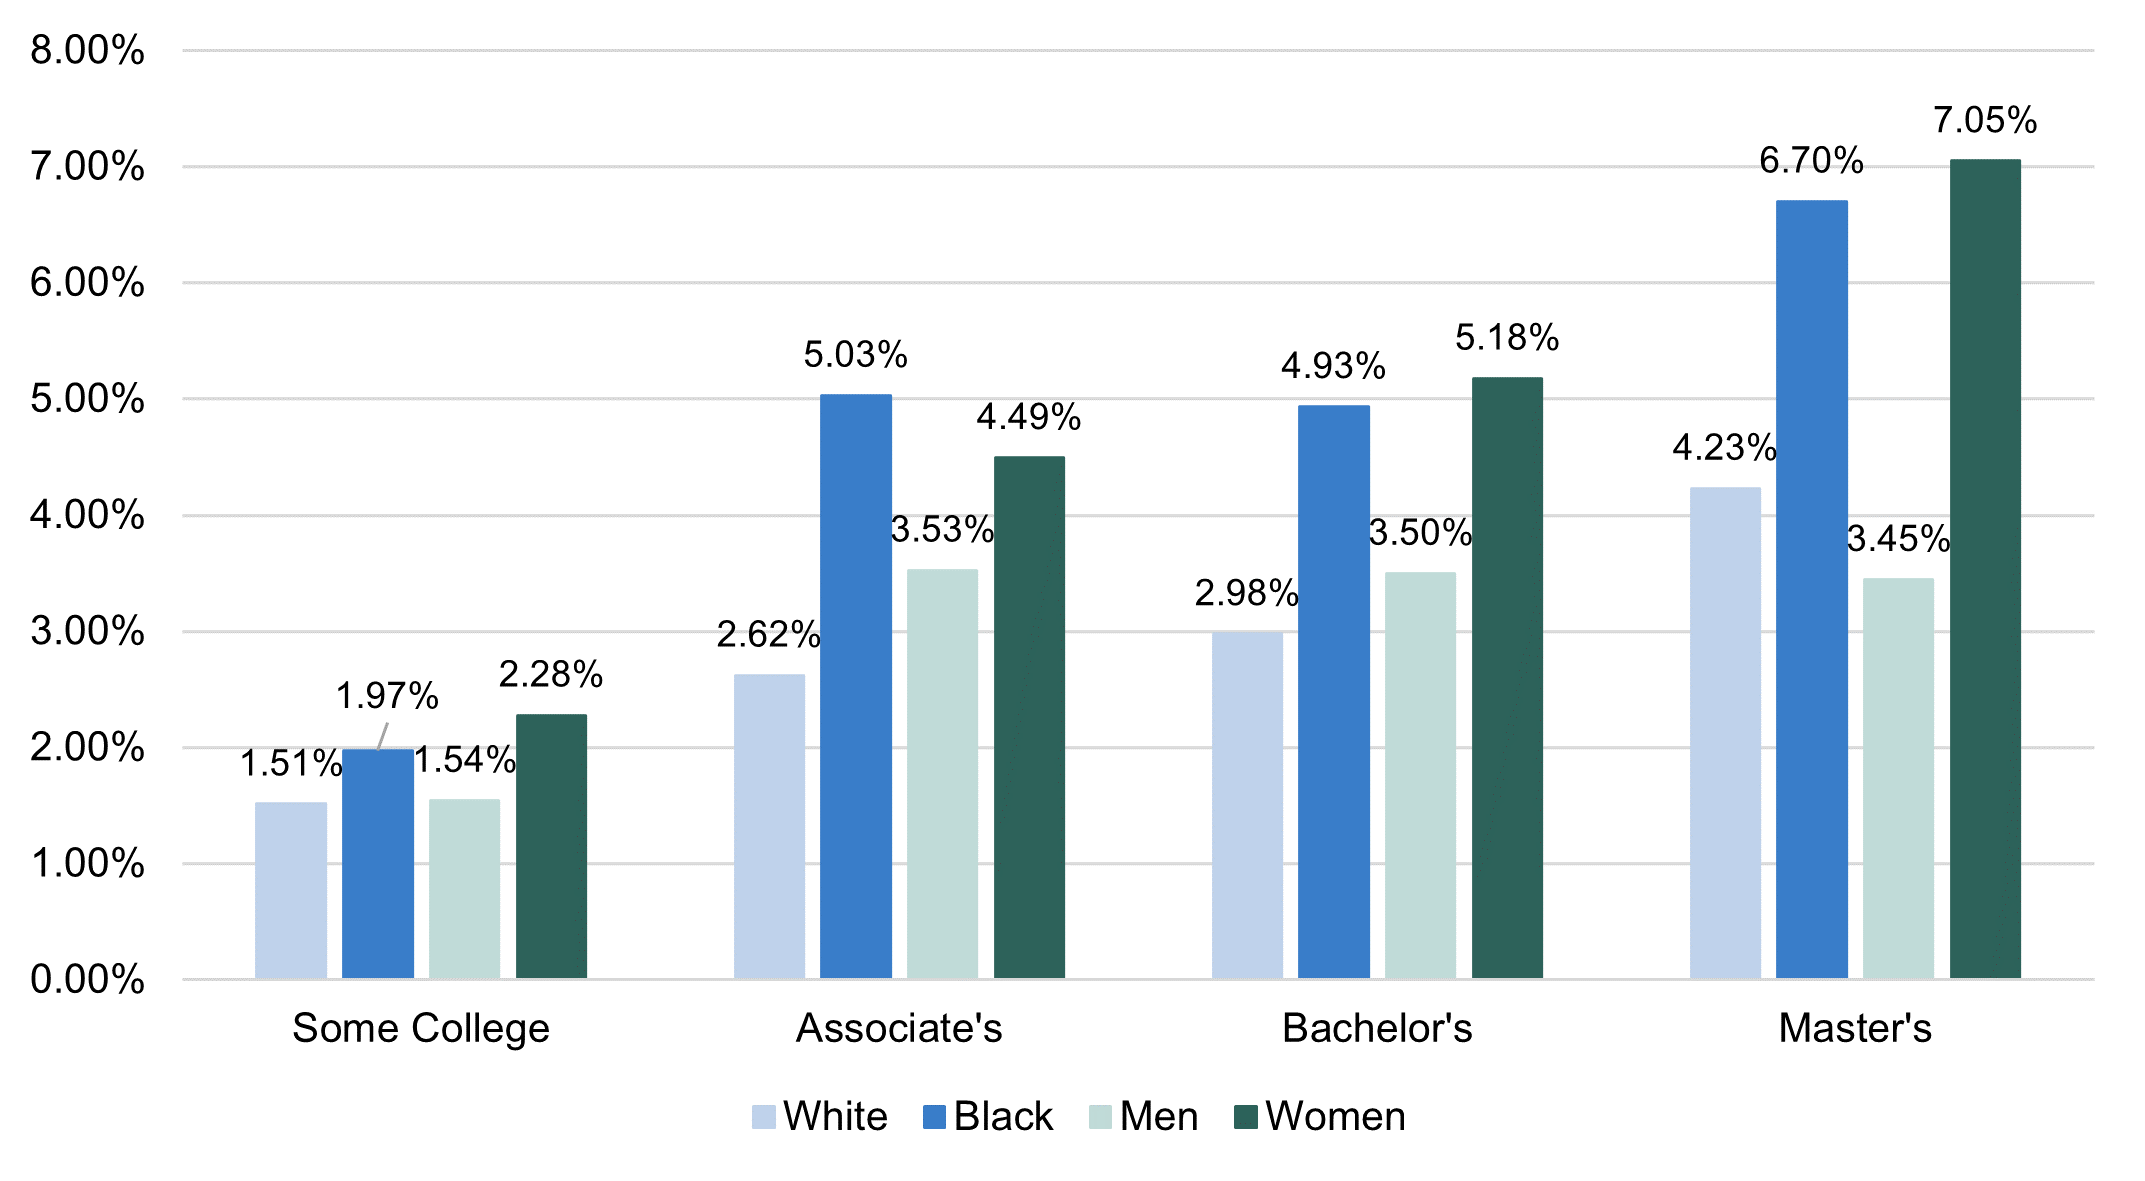
Relative employment levels increase with higher levels of education across all demographic groups, but we see especially for Black residents and women, earning just an associate’s degree can lead to much higher levels of employment than only obtaining a high school diploma.
Recommended solutions
Ensure equitable access to well-resourced colleges and universities and investing in the State’s HBCUs
Just as combating discrimination and inequality in the workforce will help boost the economy of the state, ensuring that all students, regardless of race, ethnicity, gender, have access to the best performing and well-resourced colleges in universities is imperative. In the previous sections, we examined the stark differences in outcomes, especially across racial groups, that Mississippians can expect after obtaining a postsecondary degree. Diversifying the state’s flagship university will play a key role in making sure all Mississippians have access to well-resourced institutions. The University of Mississippi has the largest endowment of any public university in the state, allowing the institution to divert more resources to offer better scholarships, robust student success services, and attract top level faculty.[59] But one report shows that Mississippi has the largest gap in the country between the percent of Black students that graduate from high school in the state and the percent of Black students who enroll at the public flagship institution in the fall. Explicit and implicit discriminatory practices contribute to this over 40 percentage point gap, and addressing these issues at the system-wide level is critical if the state wishes to achieve more equitable outcomes for underrepresented groups.[60]
Part of ensuring access to well-resourced institutions is guaranteeing that the institutions that primarily serve minority groups are well resourced. There are seven Historically Black Colleges and Universities (HBCUs) in Mississippi that serve tens of thousands of students.[61] Nationwide, the average economic mobility rate of HBCUs, or the percent of students who have parents in the bottom 20 percent of the income distribution and reach the top 20 percent of the income distribution, is 3 percent. This is almost double the average across all other US colleges, which sits at about 1.6 percent.[62] HBCUs have historically been the primary institutions where Black Americans could obtain postsecondary degrees, a particularly important role in the history of Mississippi. Mississippi HBCUs face some unique challenges, including a legacy of underfunding and unequal opportunity.[63] But these institutions offer large returns to the state. Our analysis shows that the relative returns associated with the attainment of a bachelor’s degree, relative to only earning a high school diploma, are some of the highest in the state for Black Mississippians. As higher education institutions that center learning for Black Mississippians, HBCUs play an important role in boosting the Mississippi economy. In addition, a study conducted by the UNCF estimates that the six standalone private and public HBCUs in the state have an annual economic impact of $774 million, accounting for direct spending by HBCUs, and economic activity of the faculty and staff that attend the institution.[64]
When considering how to best support underrepresented groups and HBCUs, the state should consider funding adequacy. Research consistently finds that lower-income or underrepresented groups are more likely to attend community colleges or other institutions that receive less funding than more selective four-year institutions. Not only are these institutions funded at lower levels, but the groups of students attending them likely require more funding per-student to succeed due to lower academic preparation, on average.[65] Some research has found that the average spending per degree at community colleges was $73,940 in 2009, as opposed to $65,632 at public research institutions and 55,358 at public master’s institutions.[66] In contrast to the K-12 education system, research on funding adequacy in the higher education sphere is sparse. Some studies have observed that the cost of educating lower-income students ranged from 23 percent to 168 percent more than other students.[67] An important step in reaching funding adequacy in the higher education system is evaluating the problem. The state should invest in research that analyzes the needs of current underrepresented students, and what additional dollars would be necessary to reach funding adequacy.
Developmental education
In 2018, 21 percent of first-time students enrolled at public universities in Mississippi were enrolled in remedial courses. Of that group of students, 42 percent were Black, nine percent were white, with the rest reporting as “other” or Hispanic. Although developmental education is an important step in getting students who may have been underserved at the K-12 level “up to speed” with their classmates, these courses have the chance to delay or disrupt a student’s progress towards their degree, adding an additional layer of financial stress for students who can’t afford it. For example, nationally only about half of students assigned to developmental education courses complete their sequence.[68] Some research has shown that placement into developmental education has a negative effect on the number of college credits a student earns and overall attainment. One study found these results more pronounced for university students and more detrimental for those placed in reading and writing courses rather than in math.[69] In lieu of this, the racial disparity between students being placed in development courses needs to be examined, and the state should implement innovative practices that help students’ chances at completing.
Mississippi has implemented several recommended practices on developmental education. According to a 50-state tracker developed by the Education Trust, Mississippi is one of only 36 states that has a state- or system-wide developmental education assessment and placement policy. The state also has a uniform “cut score” and allows for multiple measures to be used when deciding developmental education placement.[70] These measures include consideration of high school performance, ACT scores, placement testing, special interests and skills, as well as consideration of other non-cognitive factors.[71] The IHL policy also explicitly addresses which instructional methods will be used in their developmental education program and allows for corequisite support in intermediate classes. Only about half of US states have policies that address all these features. However, there’s more Mississippi can do to improve in this area.
States like Texas and Florida have passed legislation with the intent to reduce the number of students assigned to developmental education courses. While Mississippi does well to use multiple measures when considering placement, Florida has gone so far as to ban the use of placement exams for developmental courses. One study evaluating Florida’s policy, adopted in 2014, found that it led to a smaller percentage of students enrolled in developmental courses, and higher overall success rate for those students that were enrolled.[72] A separate study used an economic lens to evaluate the success of Florida’s reform. This research found that the total cost per completer (including costs to the institution and student) was $894 lower in English, and $1851 in math.[73] Florida’s reform measures led to more completions at a lower cost to students and institutions.
California may provide another example, with their landmark AB 705 law first passed in 2017. The law identifies the adverse consequences associated with the incorrect assignment of a student into a developmental education course and prohibits community colleges from requiring students to take a prerequisite course unless they are “highly unlikely to have success in a higher-level course without it.”[74] The law also requires colleges to use multiple measures in determining course placement, moving away from standardized testing, and towards the use of high school coursework when determining developmental education placement. The results have been successful: in the 2016-2017 school year only 27 percent of California community college students had completed a transfer-level math course in their first year. By the 2019-2020 school year this number had reached 20 percent.[75] Completion rates have also increased in transfer-level English courses. Despite the success, advocates in California are pushing the state to go even further to limit developmental education courses. This example shows that, although Mississippi has taken steps to evaluate students broadly and implement innovative practices, there is still space to grow.
While Mississippi does well to allow for corequisite support in intermediate classes, requiring institutions to implement a corequisite support model for all developmental education paths could greatly improve student outcomes.[76] In a corequisite support model, students are immediately enrolled in credit bearing courses while receiving additional support. In 2018, the University System of Georgia switched their mode of developmental education, requiring all institutions to adopt full corequisite support models in math and English. The resulting completion rates in gateway math courses rose by 47 percent, and completion rates in gateway English courses rose by 26 percent.[77] Mississippi can follow Georgia’s example by amending their current corequisite policy and requiring corequisite support to be implemented, closing equity gaps and increasing completion rates for all students.
Creating pathways in high wage careers
Simply put, some careers make more money than others. When we look at the huge disparities between expected lifetime earnings for white residents and Black, or between men and women, policymakers need to consider what pathways are available to underrepresented students in high-wage careers, and how we can multiply or broaden these pathways. Figure 20 shows the estimated lifetime earnings of bachelor’s degree holders in the state, segmented by degree type.
Figure 20: Estimated lifetime earnings of bachelor’s degree recipients from Mississippi institutions by field of degree
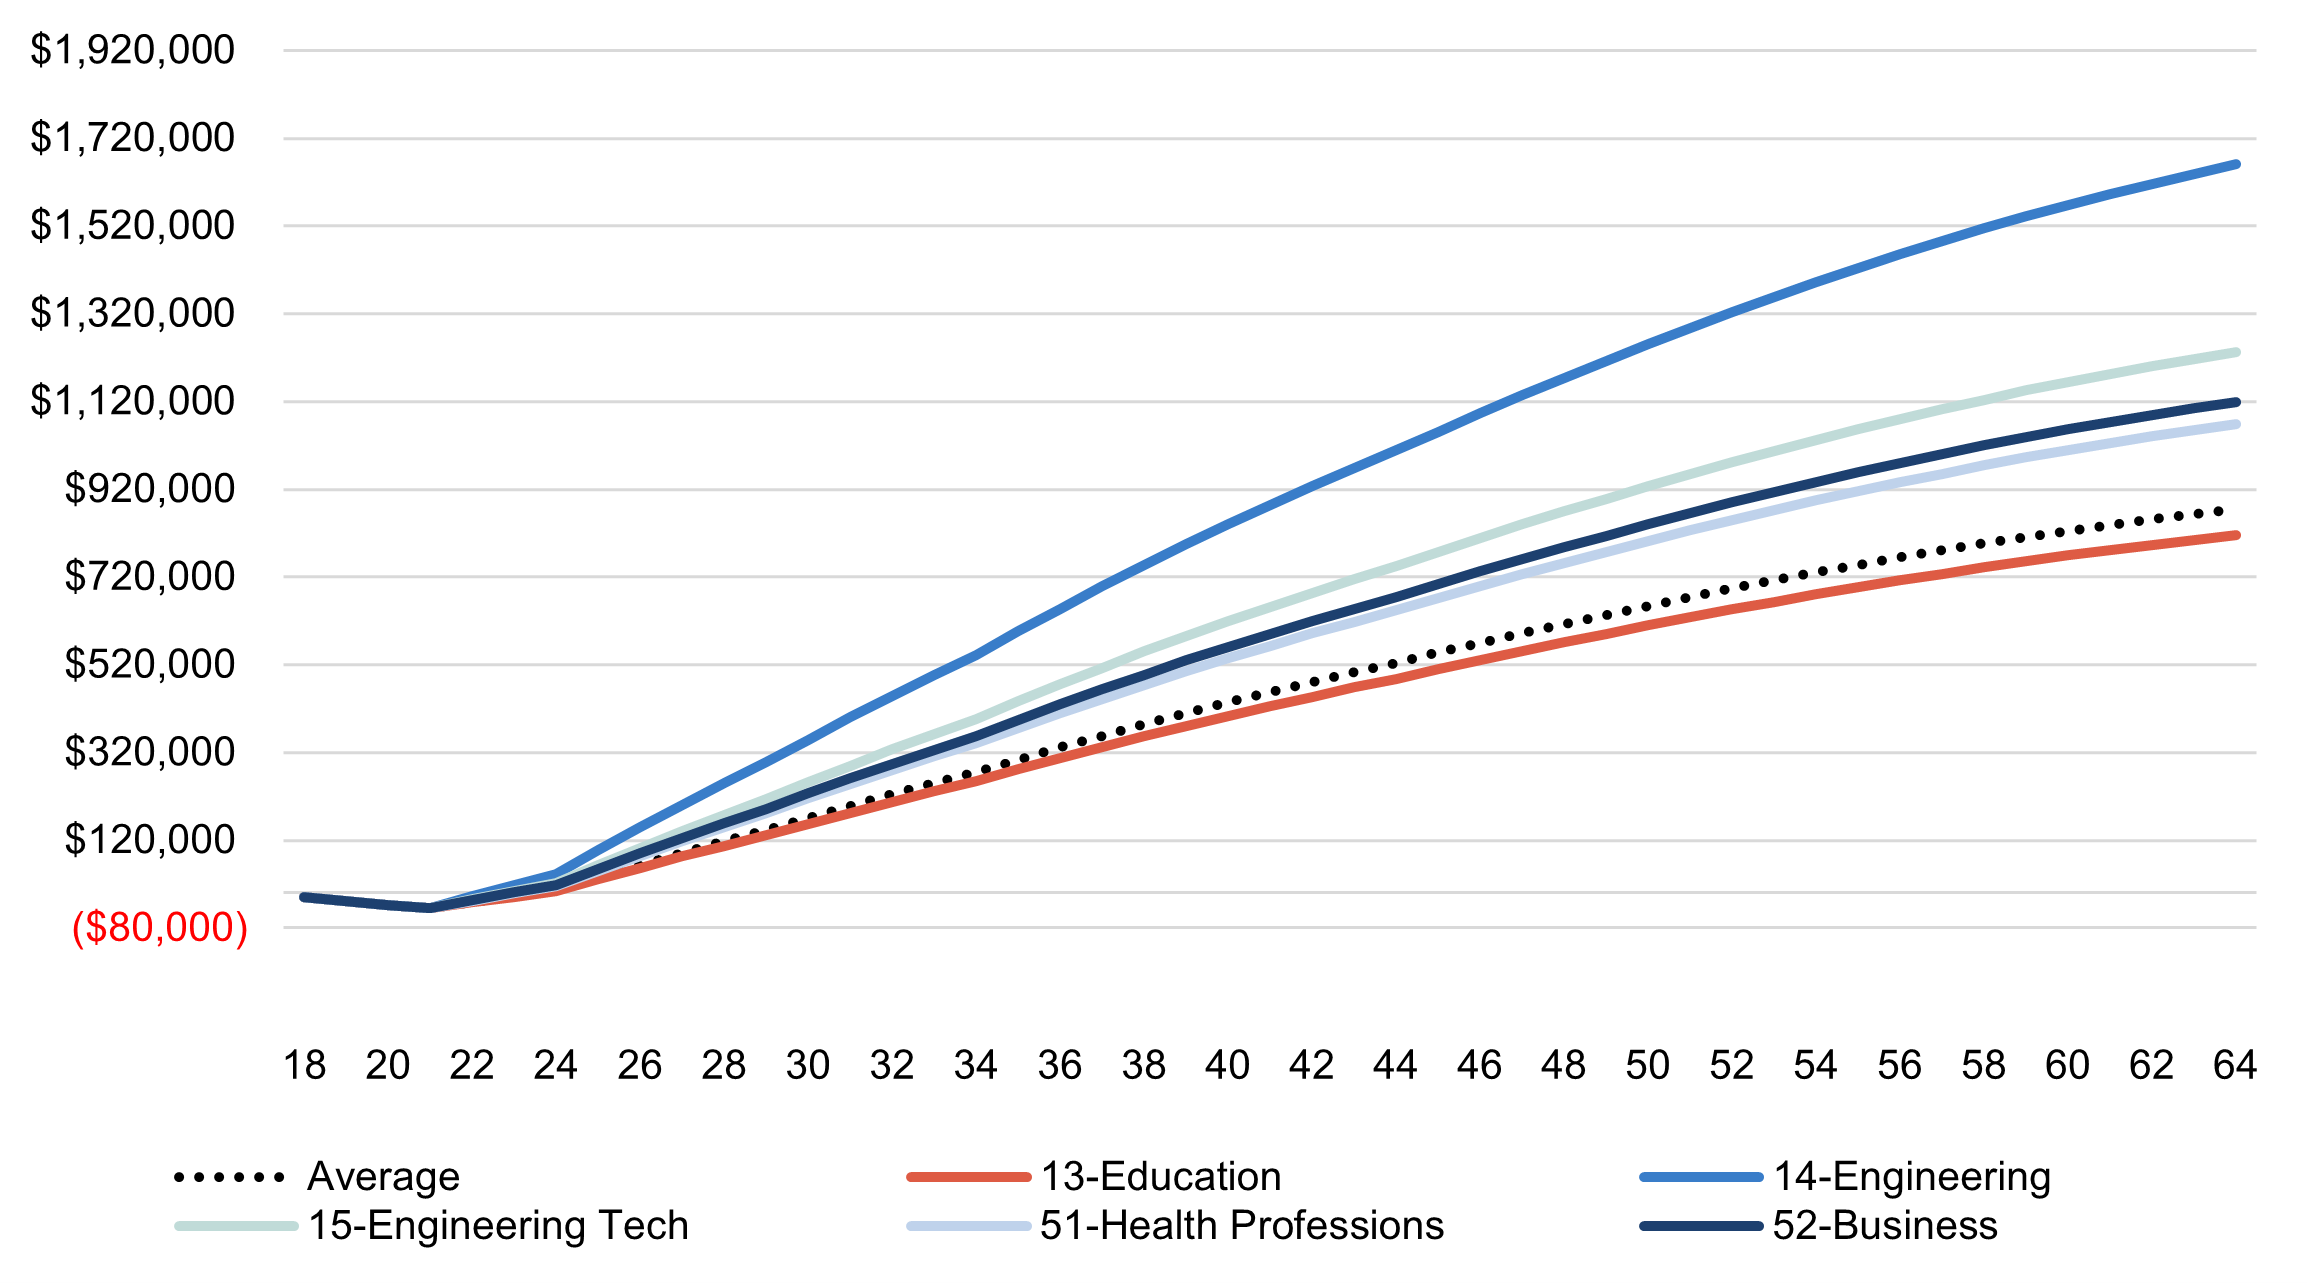
Engineering, engineering technology, business, and health all yield some of the highest returns for Mississippians. Bachelor’s degree completions in business, management, and marketing for white Mississippians dwarf the completions number for Black Mississippians, and the divide is growing larger. Since 2011, bachelor’s completions in business have risen 22 percent for white Mississippians and fallen 17 percent for Black residents.
Figure 21: Bachelor’s degree completions in business over time
As seen in Figure 22, Bachelor’s degree completions in the engineering field have risen across the board in 2011, but the gulf in overall completions between men and women, as well as white and Black residents, is enormous.
Figure 22: Bachelor’s Degree Completion in Engineering Over Time
Investing in programs that increase the number of women and other underrepresented Mississippians in STEM, business, and other high-paying degree programs will be necessary in order to reach more equitable outcomes in lifetime earnings. Crafting a financial aid policy that targets these groups and incentivizes their pathway into high-paying programs will play a vital role in Mississippi’s workforce reaching its potential.
Closing Remarks
Mississippi has an enormous amount to gain by investing in proven strategies to increase postsecondary attainment in high-value credentials, close equity gaps in attainment and employment, and increase alignment between credentials earned and labor market demand. Our analyses of Mississippi’s credential and labor market data finds that greater levels of educational attainment translate to higher lifetime earnings for individuals in the state, and higher returns to the state across all demographic groups.
Making these investments has the potential to greatly improve the economy and the lives of Mississippians. For example, if Mississippi increased its attainment rate from the current 42 percent to 60 percent among 25-to-64-year-olds, the state could potentially gain over $376 million in increased tax revenue and decreased social services spending, as its more educated population would earn higher wages. Increasing Black Mississippians’ attainment rate (associate’s degree and higher) by 13 points to the level of white Mississippians would result in 71,486 additional high-value credentials for Black Mississippians and increase the state’s attainment rate by over 5 percentage points, netting over $100 million in economic returns to the state.
There is great potential to improve the lives of Mississippi’s residents and its economy by increasing postsecondary attainment. The state’s most recent history of growing attainment rates suggests that continued forward progress is possible. This paper highlights the areas where additional investment is needed to realize equitable and high-value attainment rate growth and proposes policies and strategies that have demonstrated effectiveness in addressing Mississippi’s unique challenges. Making these investments is essential to giving all Mississippians the opportunity to thrive.
Definitions and Appendix
Postsecondary credentials
In this report we track the credentials earned, or “completions,” at postsecondary institutions in Mississippi. The total number of completions we cite is the total sum earned at Title IV institutions in the state.
Attainment
The attainment rate in the state is the percentage of Mississippians aged 45-to-64 who hold a high-value certificate, college degree, or industry-recognized credential. Using census data, we can track the attainment rate of Mississippians with an associate degree or higher but are unable to precisely determine the total attainment rate that includes high-value certificates and industry-recognized credentials.
Individual earnings
Estimation of the lifetime earnings curves of individuals in Mississippi seen in figures throughout the report was done primarily using data from IPUMS USA. Our sample consists of individual-level data from the 2020 American Community Survey (ACS). Our sample includes data on all Mississippians ages 25-to-64 who have obtained at least a high school diploma. We use different age cuts of the population to estimate what individuals in the state can expect to earn at different education levels throughout their career. These estimates are then discounted with an average interest rate of 3 percent. We replicate this process for different cuts of the population, estimating the earnings that Mississippians of different race, gender, and geographic location can expect to earn at the “some college,” associate’s degree, bachelor’s degree, and master’s degree levels.
“Some college” and certificate attainment
One limitation of using ACS data for our analysis is that associate’s degrees are the lowest postsecondary credential attainment level tracked in the US census. The only lower level of postsecondary education tracked is the “some college” level of attainment, defined as “some college credit, but less than one year of college credit.” This level likely includes the population of Mississippians that obtained a sub-associate’s degree credential (whether that be short-term, long-term, or a workforce credential), as well as the population of individuals that started at a higher education institution, earned some credit, but no degree, and stopped out. Ideally, we wanted to use this “some college” population of individuals as a proxy for determining the expected lifetime earnings of Mississippians who earn sub-associate’s degree credentials. To test the viability of this method, we use earnings data from the College Scorecard, comparing earnings of associate’s degree graduates from Mississippi intuitions with sub-associate’s credential completers from Mississippi intuitions. We then apply the resulting scalar to our individual earnings curves estimates and compare them with the estimates obtained from simply using the “some college” designation. Figures 23 and 3 show the resulting earnings curves using the certificate scalar.
Figure 23: Earnings by highest credential with certificate scalar included
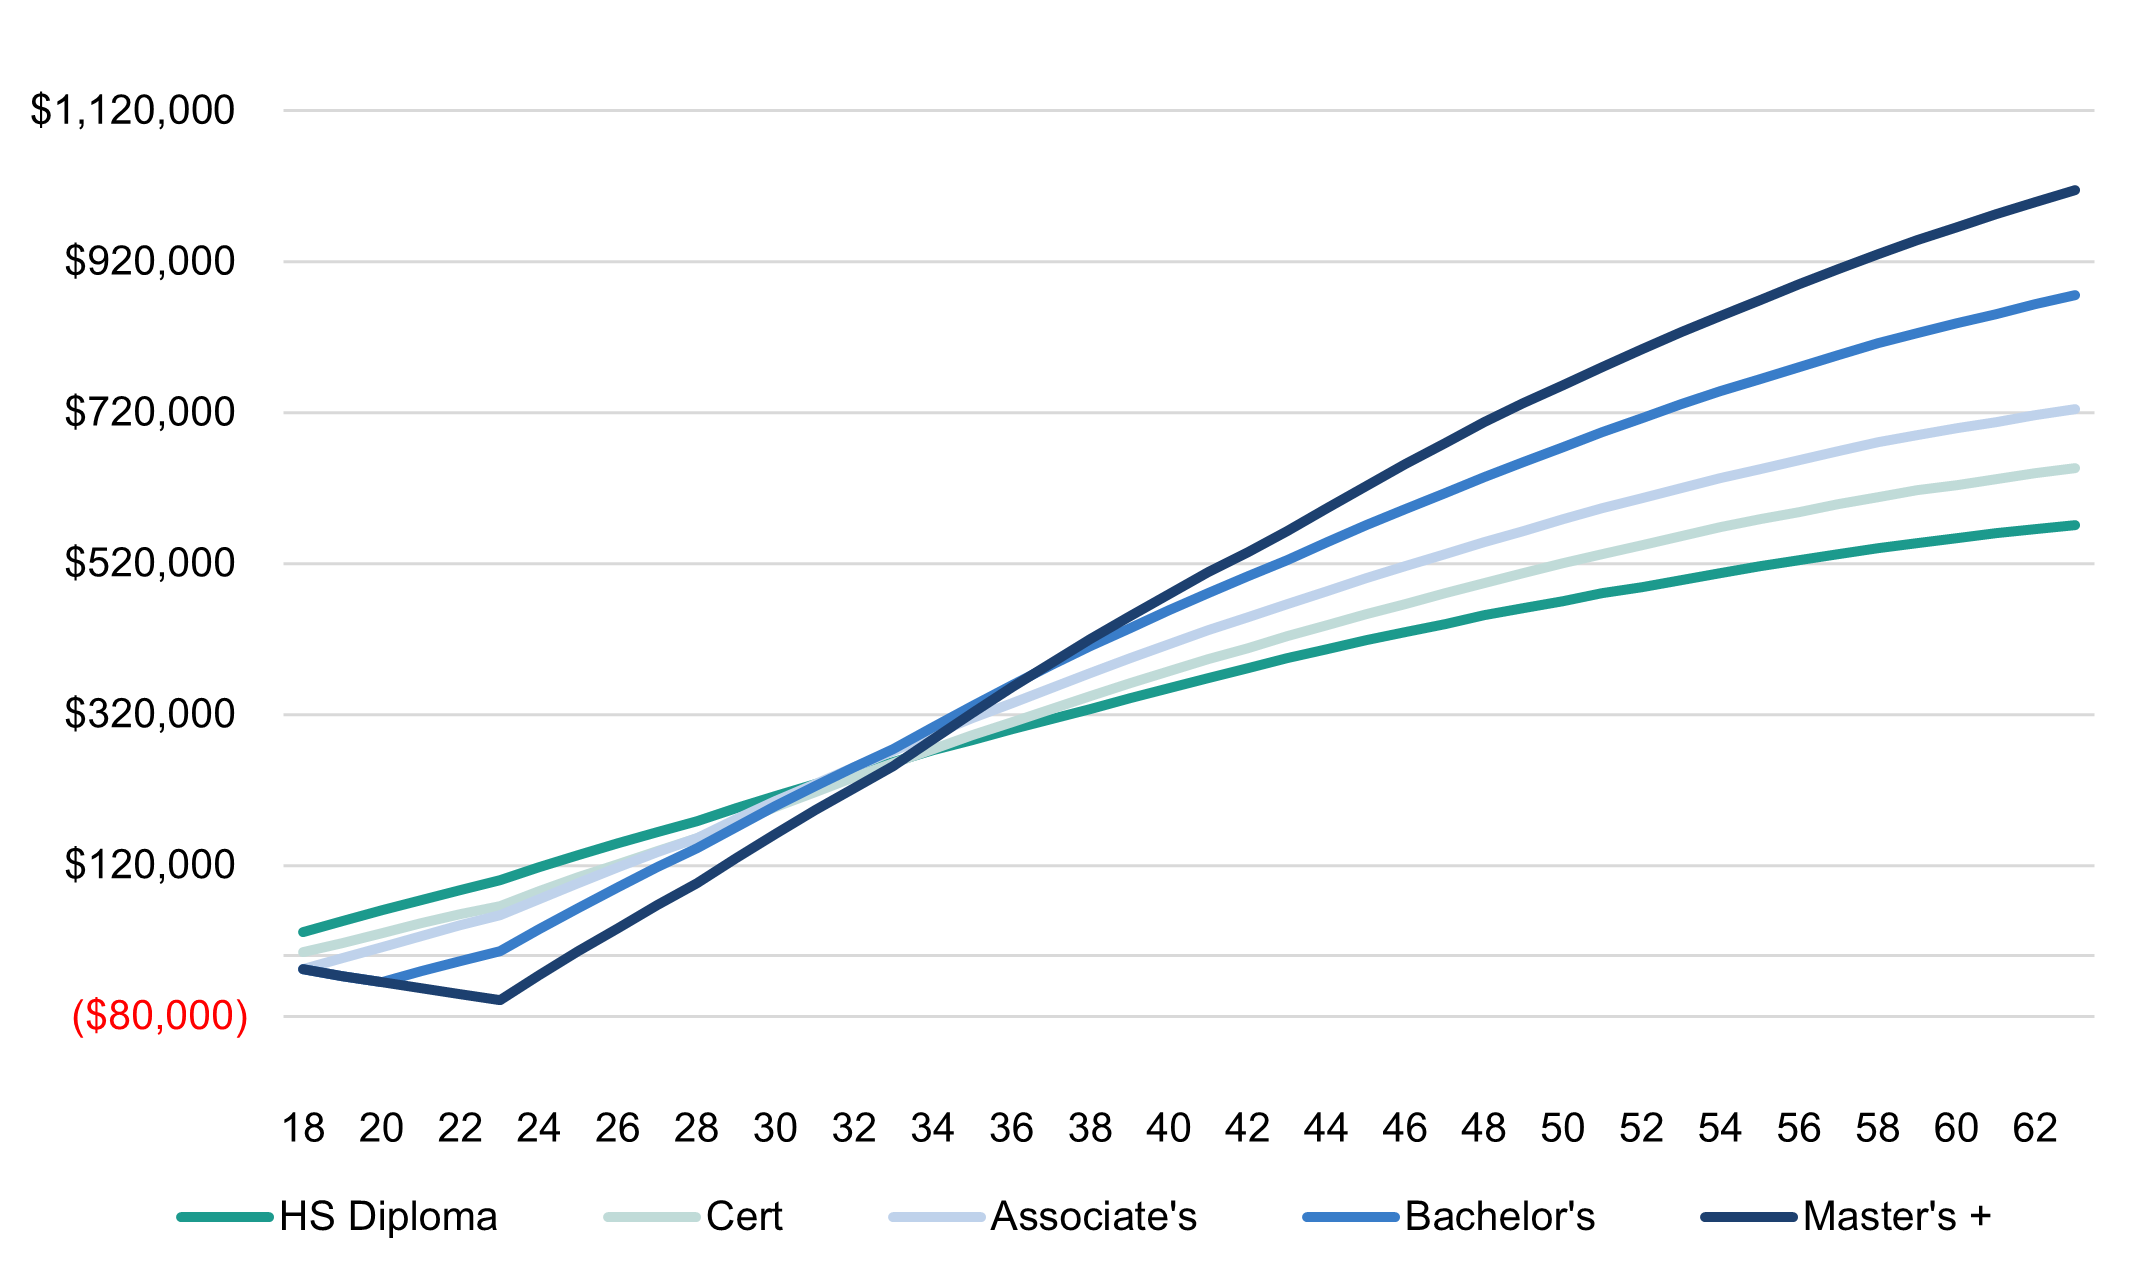
Figure 3: Estimated lifetime earnings of Mississippians by postsecondary credential
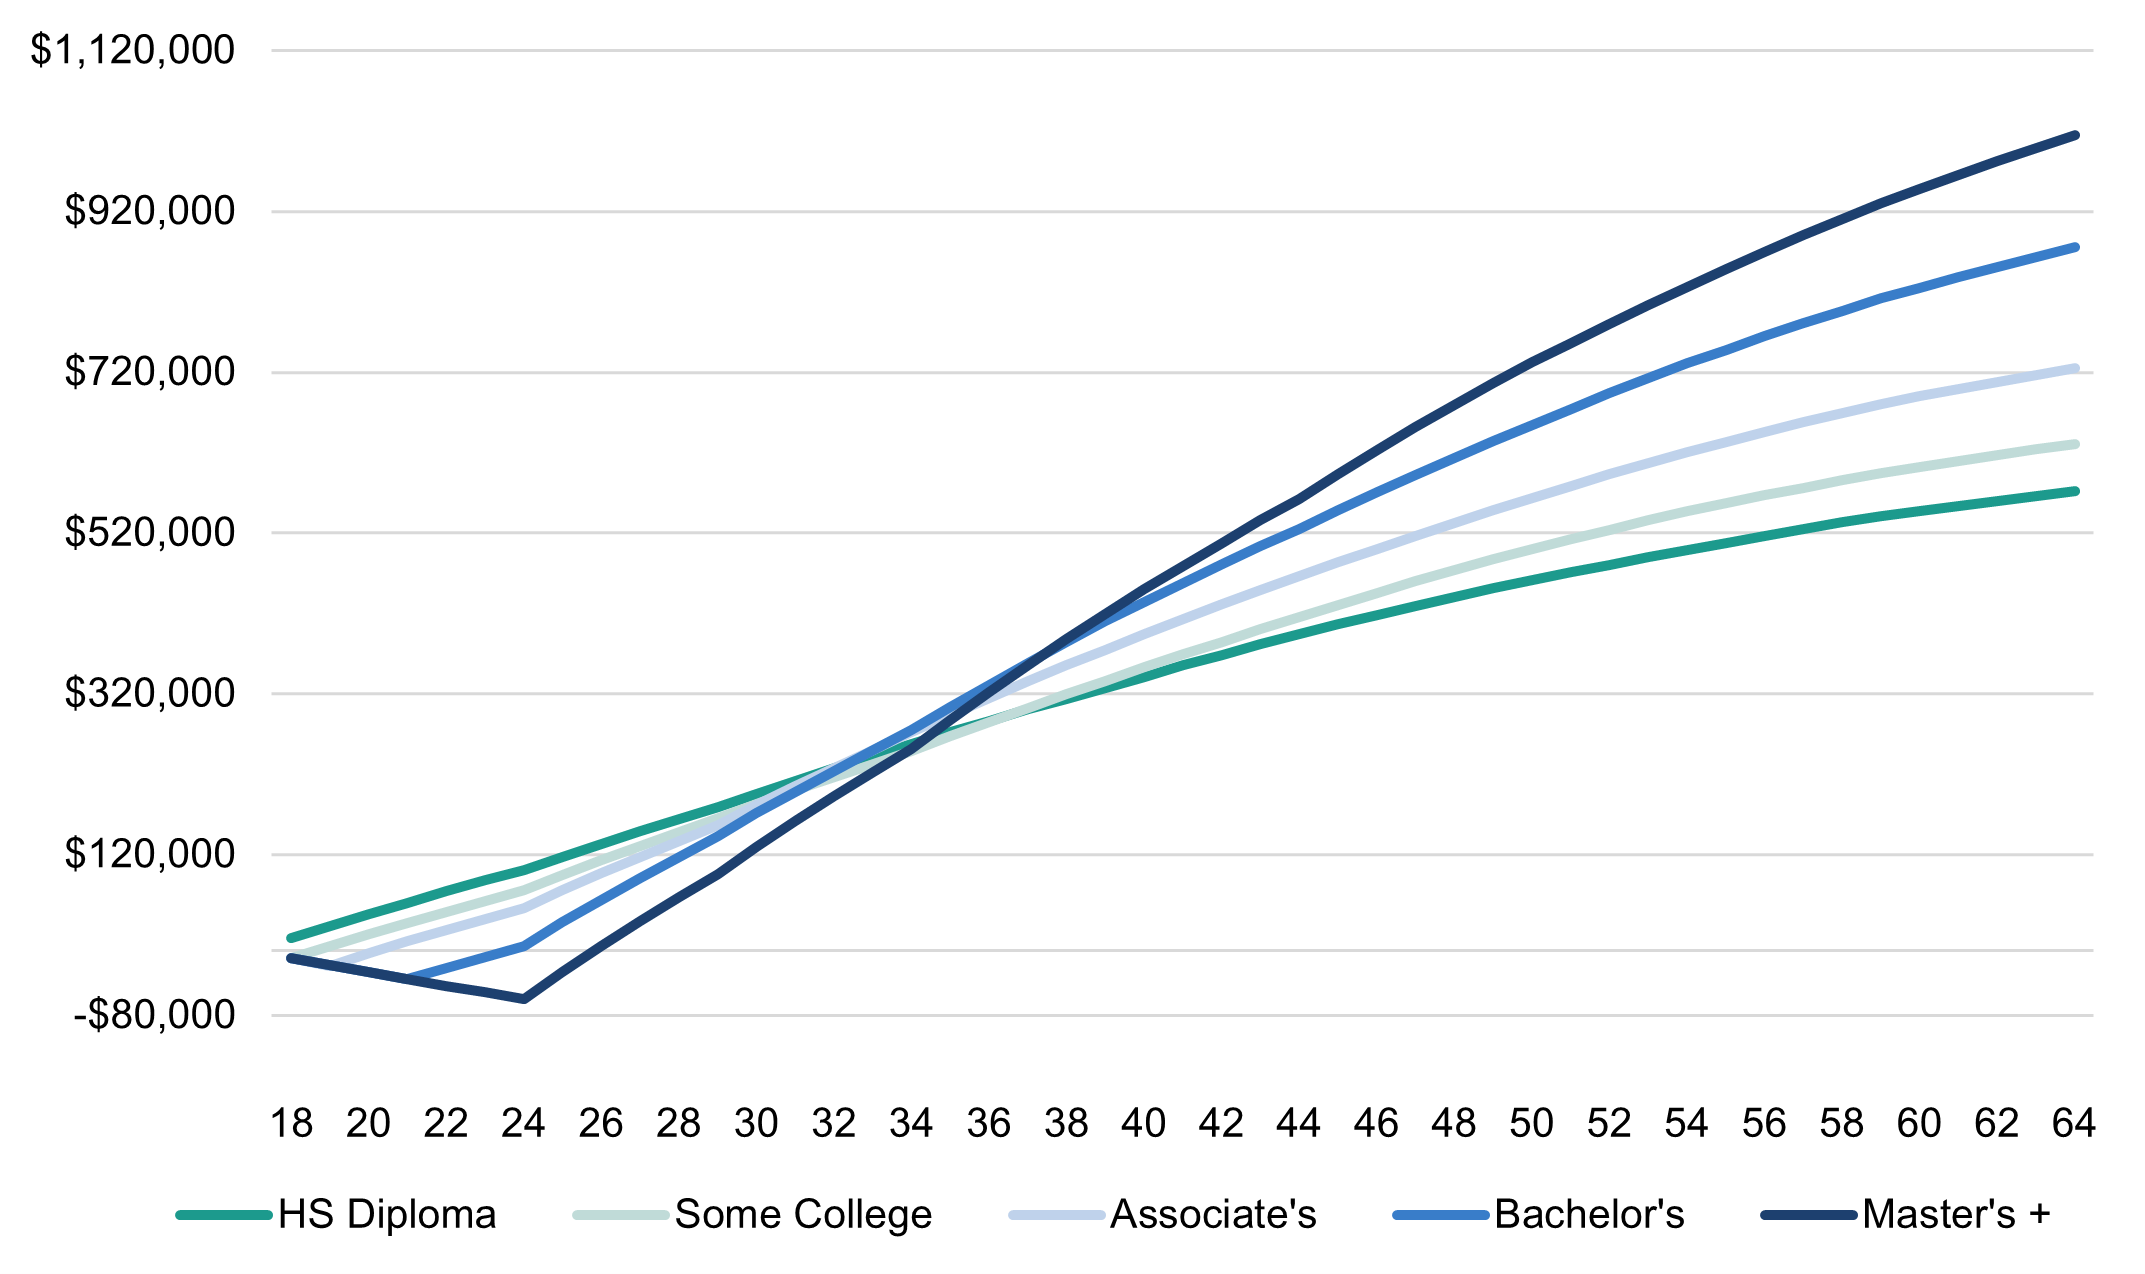
The trajectory and magnitude of both curves are remarkably similar, with estimated total lifetime earnings of $647 thousand for the average Mississippian using the certificate scalar, and lifetime earnings of $631 thousand using the “some college” designation. In this we find that the “some college” education designation is a reliable category to use as a proxy for determining what individuals can expect to earn with a sub-associate’s credential. One possible limitation of this method is that the College Scorecard only collects data on earnings one, two, and three years after graduation. Data is also not available from every single intuition in the state. However, we matched IPEDS data to the earnings data to estimate what percent of credentials earned at Mississippi intuitions came from intuitions with earnings data availability. The result of this analysis showed that over 50 percent of graduates are represented in the earnings data. We took averages across all three earnings estimates to determine the total average earnings for the state, which we used to create our credential scalar.
Returns to the state
Our method for determining the average lifetime returns to the state for individuals in Mississippi based on education level involved a slightly more complex set of analyses than the individual returns. To start, we combine data from multiple sources to create an estimate of tax contributions made to the state by each individual based on their characteristics. We also estimate the average cost to the state in Medicaid and welfare spending. Once again, we create these estimates for the state overall as well as for individual subgroups.
The individual income estimates serve as the basis for our analysis on tax contributions. We use the same sample here of Mississippians aged 25-64 with at least a high school diploma, calculating their total personal income with 2020 ACS five-year estimates. Income tax contributions are calculated by assigning individuals into their corresponding tax brackets based on total household income. To calculate sales tax and property tax, a few extra steps are necessary. Using the Institute on Taxation and Economic Policy’s (ITEP) estimates for the effective state tax rates paid by all income groups in Mississippi, we can evaluate how much of an individual Mississippian’s personal income is spent on sales tax and property tax. By stratifying individuals based on household income, we assign individuals into different income brackets, then multiply their tax burden by their personal incomes. We then multiply this number by a ratio of Mississippi’s state sales tax and property tax receipts over total sales tax and property tax receipts (comprised of state and local tax receipts). For sales tax, this ratio is large, at almost 98 percent. For property tax, this number is miniscule, as almost all property tax receipts go to local governments. Combining the estimated income tax, sales tax, and property tax contributions by individual allows us to estimate the median tax contribution by demographic group, age, and education level.
Information on Medicaid spending by individuals is only available through Community Population Survey (CPS) microdata, once again made accessible by IPUMS. Due to limitations in data collection, we used 2011 data on Medicaid spending. After collecting this data, we adjust for inflation, then generate averages by demographic group, age, and education level. After coming up with these estimates, we combine them with estimates on welfare spending by individual, available through the 2020 ACS five-year estimates. Combining this information on cost to the state with expected tax contributions, we estimate the total public return for individuals throughout their working life, across different education levels.
High-opportunity occupations
The following list encompasses our list of 100 high-opportunity occupations. The data presented here lists the occupation title, associated SOC code, 2020 employment, the projected employment growth through 2028, the average annual job openings, and the average annual wage. All data are specific to Mississippi.
| SOC Code | Occupation Title | 2020 Employment | Percent Employment Growth (2018-2028) | Average Annual Job Openings | Annual Wage |
| 29-1141 | Registered Nurses | 28,800 | 11.9% | 2,100 | $61,250 |
| 53-3032 | Heavy and Tractor-Trailer Truck Drivers | 21,900 | 3.7% | 2,950 | $45,540 |
| 11-1021 | General and Operations Managers | 17,300 | 6.1% | 2,520 | $89,350 |
| 25-2021 | Elementary School Teachers, Except Special Education | 12,150 | 4.2% | 1,100 | $43,280 |
| 43-1011 | First-Line Supervisors of Office and Administrative Support Workers | 11,950 | -0.8% | 1,345 | $48,650 |
| 25-2031 | Secondary School Teachers, Except Special and Career/Technical Education | 9,040 | 4.3% | 700 | $46,100 |
| 41-4012 | Sales Representatives, Wholesale and Manufacturing, Except Technical and Scientific Products | 8,080 | 0.4% | 835 | $59,170 |
| 51-1011 | First-Line Supervisors of Production and Operating Workers | 6,510 | 0.7% | 700 | $61,570 |
| 51-4121 | Welders, Cutters, Solderers, and Brazers | 5,870 | 5.4% | 720 | $44,340 |
| 13-2011 | Accountants and Auditors | 5,800 | 6.7% | 650 | $66,450 |
| 49-3023 | Automotive Service Technicians and Mechanics | 5,760 | -2.4% | 590 | $42,740 |
| 25-2022 | Middle School Teachers, Except Special and Career/Technical Education | 5,750 | 4.4% | 455 | $48,210 |
| 47-1011 | First-Line Supervisors of Construction Trades and Extraction Workers | 5,590 | 8.5% | 605 | $60,390 |
| 47-2111 | Electricians | 5,120 | 9.5% | 715 | $49,980 |
| 49-9041 | Industrial Machinery Mechanics | 5,060 | 5.7% | 525 | $52,060 |
| 49-1011 | First-Line Supervisors of Mechanics, Installers, and Repairers | 4,420 | 3.1% | 435 | $65,630 |
| 11-3031 | Financial Managers | 3,710 | 16.5% | 410 | $95,120 |
| 29-1171 | Nurse Practitioners | 3,640 | 23.5% | 250 | $109,550 |
| 13-1071 | Human Resources Specialists | 3,160 | 4.4% | 315 | $54,430 |
| 11-9111 | Medical and Health Services Managers | 3,140 | 17.9% | 330 | $100,680 |
| 49-2022 | Telecommunications Equipment Installers and Repairers, Except Line Installers | 3,060 | -13.0% | 305 | $52,970 |
| 23-1011 | Lawyers | 2,970 | 7.6% | 225 | $93,380 |
| 51-4041 | Machinists | 2,800 | 4.4% | 245 | $43,140 |
| 11-9032 | Education Administrators, Kindergarten through Secondary | 2,800 | 5.2% | 245 | $77,530 |
| 49-3031 | Bus and Truck Mechanics and Diesel Engine Specialists | 2,740 | 4.0% | 270 | $42,440 |
| 41-3021 | Insurance Sales Agents | 2,680 | 10.9% | 415 | $59,680 |
| 47-2152 | Plumbers, Pipefitters, and Steamfitters | 2,650 | 10.5% | 445 | $47,650 |
| 13-2072 | Loan Officers | 2,650 | 8.9% | 235 | $61,690 |
| 29-1051 | Pharmacists | 2,560 | 3.5% | 115 | $121,100 |
| 49-9021 | Heating, Air Conditioning, and Refrigeration Mechanics and Installers | 2,430 | 12.6% | 250 | $44,220 |
| 13-1161 | Market Research Analysts and Marketing Specialists | 2,410 | 19.1% | 375 | $47,300 |
| 29-2034 | Radiologic Technologists and Technicians | 2,280 | 6.6% | 145 | $48,100 |
| 21-1012 | Educational, Guidance, and Career Counselors and Advisors | 2,140 | 10.0% | 260 | $51,130 |
| 11-9141 | Property, Real Estate, and Community Association Managers | 2,130 | 7.4% | 225 | $43,680 |
| 13-1111 | Management Analysts | 2,000 | 12.0% | 260 | $75,570 |
| 49-9051 | Electrical Power-Line Installers and Repairers | 2,000 | 4.4% | 185 | $65,640 |
| 13-1041 | Compliance Officers | 2,000 | 4.3% | 215 | $58,970 |
| 17-2112 | Industrial Engineers | 1,870 | 9.6% | 150 | $83,140 |
| 11-9051 | Food Service Managers | 1,820 | 12.5% | 410 | $53,050 |
| 23-2011 | Paralegals and Legal Assistants | 1,680 | 15.5% | 250 | $48,240 |
| 13-1151 | Training and Development Specialists | 1,580 | 8.9% | 190 | $55,750 |
| 27-3031 | Public Relations Specialists | 1,510 | 4.2% | 290 | $45,200 |
| 27-2022 | Coaches and Scouts | 1,500 | 11.3% | 280 | $49,340 |
| 29-1123 | Physical Therapists | 1,490 | 19.8% | 110 | $91,960 |
| 29-1126 | Respiratory Therapists | 1,460 | 21.1% | 120 | $51,480 |
| 47-2211 | Sheet Metal Workers | 1,430 | 6.2% | 190 | $46,700 |
| 25-1071 | Health Specialties Teachers, Postsecondary | 1,430 | 24.3% | 200 | $162,670 |
| 21-1022 | Healthcare Social Workers | 1,430 | 14.3% | 165 | $48,260 |
| 49-3042 | Mobile Heavy Equipment Mechanics, Except Engines | 1,330 | 2.5% | 165 | $46,810 |
| 11-9033 | Education Administrators, Postsecondary | 1,330 | 7.9% | 160 | $101,480 |
| 25-2032 | Career/Technical Education Teachers, Secondary School | 1,320 | 2.9% | 75 | $50,860 |
| 45-4022 | Logging Equipment Operators | 1,310 | -15.5% | 270 | $46,050 |
| 29-1127 | Speech-Language Pathologists | 1,310 | 26.6% | 150 | $67,250 |
| 13-1031 | Claims Adjusters, Examiners, and Investigators | 1,280 | -3.8% | 105 | $70,510 |
| 11-9021 | Construction Managers | 1,210 | 8.3% | 150 | $84,280 |
| 49-3021 | Automotive Body and Related Repairers | 1,210 | 0.0% | 110 | $42,910 |
| 33-1021 | First-Line Supervisors of Firefighting and Prevention Workers | 1,180 | 3.3% | 80 | $47,140 |
| 11-3021 | Computer and Information Systems Managers | 1,050 | 9.0% | 110 | $107,170 |
| 49-3011 | Aircraft Mechanics and Service Technicians | 1,040 | 6.7% | 95 | $66,930 |
| 49-9099 | Installation, Maintenance, and Repair Workers, All Other | 970 | 7.2% | 80 | $44,670 |
| 25-3011 | Adult Basic Education, Adult Secondary Education, and English as a Second Language Instructors | 920 | -7.7% | 95 | $47,430 |
| 31-2021 | Physical Therapist Assistants | 850 | 22.6% | 135 | $50,120 |
| 29-1122 | Occupational Therapists | 830 | 18.8% | 80 | $87,640 |
| 37-1012 | First-Line Supervisors of Landscaping, Lawn Service, and Groundskeeping Workers | 820 | 16.9% | 245 | $43,020 |
| 11-9151 | Social and Community Service Managers | 800 | 9.6% | 125 | $56,100 |
| 33-3021 | Detectives and Criminal Investigators | 780 | 2.0% | 65 | $67,550 |
| 53-7021 | Crane and Tower Operators | 680 | -2.9% | 80 | $48,650 |
| 29-2032 | Diagnostic Medical Sonographers | 670 | 15.6% | 50 | $62,600 |
| 49-9062 | Medical Equipment Repairers | 600 | 0.0% | 30 | $43,360 |
| 17-3031 | Surveying and Mapping Technicians | 600 | 7.1% | 70 | $44,780 |
| 25-1072 | Nursing Instructors and Teachers, Postsecondary | 590 | 20.3% | 65 | $72,840 |
| 53-2012 | Commercial Pilots | 540 | 4.9% | 45 | $94,630 |
| 29-2031 | Cardiovascular Technologists and Technicians | 450 | 5.4% | 35 | $46,070 |
| 19-2099 | Physical Scientists, All Other | 360 | 2.7% | 35 | $91,490 |
| 11-3061 | Purchasing Managers | 350 | 3.8% | 45 | $111,350 |
| 17-1011 | Architects, Except Landscape and Naval | 330 | 11.4% | 40 | $79,440 |
| 21-2011 | Clergy | 330 | 18.2% | 45 | $53,600 |
| 51-4111 | Tool and Die Makers | 320 | -4.4% | 40 | $50,740 |
| 49-3043 | Rail Car Repairers | 270 | 4.3% | 25 | $51,880 |
| 49-9052 | Telecommunications Line Installers and Repairers | 260 | 23.9% | 135 | $52,040 |
| 19-2041 | Environmental Scientists and Specialists, Including Health | 260 | 5.6% | 65 | $50,860 |
| 29-2035 | Magnetic Resonance Imaging Technologists | 240 | 6.3% | 20 | $63,880 |
| 13-2071 | Credit Counselors | 220 | 11.1% | 25 | $42,160 |
| 25-9099 | Educational Instruction and Library Workers, All Other | 220 | 0.0% | 20 | $44,290 |
| 47-2021 | Brickmasons and Blockmasons | 210 | 9.5% | 25 | $44,420 |
| 53-2011 | Airline Pilots, Copilots, and Flight Engineers | 200 | 0.0% | 20 | $104,680 |
| 13-1075 | Labor Relations Specialists | 190 | -8.0% | 100 | $67,650 |
| 11-9071 | Gambling Managers | 190 | 13.3% | 40 | $79,530 |
| 51-8092 | Gas Plant Operators | 190 | -5.0% | 20 | $64,260 |
| 49-2092 | Electric Motor, Power Tool, and Related Repairers | 190 | 0.0% | 15 | $43,890 |
| 29-2033 | Nuclear Medicine Technologists | 180 | 3.7% | 15 | $70,100 |
| 29-1124 | Radiation Therapists | 150 | 5.3% | 10 | $92,600 |
| 19-3051 | Urban and Regional Planners | 120 | 7.7% | 25 | $67,360 |
| 27-3042 | Technical Writers | 100 | 11.8% | 20 | $78,450 |
| 17-3027 | Mechanical Engineering Technologists and Technicians | 100 | 6.1% | 35 | $61,130 |
| 19-2021 | Atmospheric and Space Scientists | 70 | 8.3% | 15 | $80,320 |
| 33-3031 | Fish and Game Wardens | 40 | 0.0% | 5 | $46,460 |
| 19-1022 | Microbiologists | 30 | 0.0% | 5 | $81,230 |
| 51-6092 | Fabric and Apparel Patternmakers | 1.4% | 100 | $45,220 | |
| 49-2097 | Audiovisual Equipment Installers and Repairers | 0.0% | 10 | $45,940 |
Endnotes
-
As cited in “Resolution Adopting a Postsecondary Attainment Goal in Mississippi,” Mississippi Education Achievement Council, 2020, http://www.mississippi.edu/eac/downloads/eac_attainment_goal_resolution_adopted_10-22-2020[52].pdf. ↑
-
“A Stronger Nation,” Lumina Foundation, 2022, https://www.luminafoundation.org/stronger-nation/report/#/progress/state/MS.↑
-
“Resolution Adopting a Postsecondary Attainment Goal in Mississippi,” Education Achievement Council, 2020, http://www.mississippi.edu/eac/downloads/eac_attainment_goal_resolution_adopted_10-22-2020[52].pdf.↑
-
The authors would like to acknowledge the Woodward Hines Educational Foundation for supporting this work. We would also like to thank Lloyd Gray, Casey Prestwood, Jay Allen, Rhea Williams-Bishop, Leah Smith, and Courtney Taylor for their time, feedback, and interest in this work.↑
-
An additional 7.9 percent of Mississippians have earned a sub-associate’s degree credential as of 2019, bringing the attainment rate to 42.4 percent.↑
-
This attainment rate is based on Lumina’s most recent data, current up to 2019. We expect that the attainment rate may be higher today, but still falls well short of the state’s 60 percent attainment goal. “Mississippi Progress,” Lumina Foundation, 2019, https://www.luminafoundation.org/state/mississippi/.↑
-
“Per Capita Real Gross Domestic Product (GDP) of the United States in 2021, by State,” statista, 2022, https://www.statista.com/statistics/248063/per-capita-us-real-gross-domestic-product-gdp-by-state/.↑
-
Mina Dadgar and Madeline Joy Weiss, “Labor Market Returns to Sub-Baccalaureate Credentials: How Much Does a Community College Degree or Certificate Pay?” Community College Research Center: Teachers College at Columbia University, June 2012, https://files.eric.ed.gov/fulltext/ED533520.pdf. We will discuss variation across fields of study later in this paper.↑
-
Many of our analyses of race/ethnicity focus on the white-Black gaps because of the small population sizes of other demographic groups. Although our analyses may not be able to provide detailed insights for these other groups of Mississippians, we believe it is important for the state to ensure opportunities and investments are distributed equitably across all residents.↑
-
Jennifer Ma, Matea Pender, and Meredith Welch, “Education Pays 109: The Benefits of Higher Education for Individuals and Society,” College Board, 2019, https://research.collegeboard.org/media/pdf/education-pays-2019-full-report.pdf.↑
-
Phillip Oreopoulos and Uros Petronijevic, “Making College Worth It: A Review of the Returns to Higher Education,” University of Toronto, 2013, https://oreopoulos.faculty.economics.utoronto.ca/wp-content/uploads/2014/08/23_01_03.pdf.↑
-
Anthony P. Carnevale, Stephen J. Rose, and Ban Cheah, “The College Payoff: Education, Occupations, Lifetime Earnings,” Georgetown Center on Education and the Workforce, 2011, https://cew.georgetown.edu/wp-content/uploads/2014/11/collegepayoff-summary.pdf.↑
-
Joshua D. Angrist and Stacey H. Chen, “Schooling and the Vietnam-Era GI Bill: Evidence from the Draft Lottery,” American Economic Journal: Applied Economics 3 (April 2011): 96–119, https://www.jstor.org/stable/41288630#metadata_info_tab_contents; and Thomas Lemieux and David Card, “Education, Earnings, and the ‘Canadian G.I. Bill’,” Canadian Journal of Economics 34, no. 2 (2001): 313–44, https://www.researchgate.net/publication/4819397_Education_Earnings_and_the_Canadian_GI_Bill.↑
-
Joel Kotkin, Delore Zimmerman, Mark Schill, Matthew Leiphon, Ryan Aasheim, and Zina Klapper, “Enterprising States: Getting Down to Business,” US. Chamber of Commerce, 2013, p. 26, https://issuu.com/mhendrix/docs/es2013.↑
-
Sarah Flood, Miriam King, Renae Rodgers, Steven Ruggles, J. Robert Warren and Michael Westberry,.Integrated Public Use Microdata Series, Current Population Survey: Version 10.0 [dataset], Minneapolis, MN: IPUMS, 2022, https://doi.org/10.18128/D030.V10.0.↑
-
David J. Deming, “Increasing College Completion with a Federal Higher Education Matching Grant,” The Hamilton Project, 2017, https://vtechworks.lib.vt.edu/bitstream/handle/10919/90835/IncreasingCollegeCompletionHigEduc.pdf?sequence=1&isAllowed=y.↑
-
John Bound, Michael Lovenheim, and Sarah Turner, “Why Have College Completion Rates Declined? An Analysis of Changing Student Preparation and Collegiate Resources,” National Bureau of Economic Research, 2009, https://www.nber.org/system/files/working_papers/w15566/w15566.pdf.↑
-
Rajashri Chakrabarti, Nicole Gorton, and Michael F. Lovenheim, “State Investment in Higher Education: Effects on Human Capital Formation, Student Debt, and Long-Term Financial Outcomes of Students,” National Bureau of Economic Research, 2020, https://www.nber.org/papers/w27885.↑
-
“State Higher Education Finance (SHEF) State Profile: Mississippi,” State Higher Education Executive Officers Association, 2022, https://shef.sheeo.org/state-profile/mississippi/.↑
-
Steven Ruggles, Sarah Flood, Ronald Goeken, Megan Shouweiler and Matthew Sobek, IPUMS USA: Version 12.0 [dataset], Minneapolis, MN: IPUMS, 2022, https://doi.org/10.18128/D010.V12.0. All earnings curve figures and estimates are created using data from IPUMS USA.↑
-
See appendix for a more thorough discussion of methodology.↑
-
“Lifetracks AdHoc Reports,” Lifetracks, 2022, https://lifetracks.ms.gov/.↑
-
“Time to Degree – 2016,” National Student Clearinghouse Research Center, 2016, https://nscresearchcenter.org/signaturereport11/.↑
-
Cindy Le, Elizabeth Davidson Pisacreta, James Dean Ward, and Jesse Margolis, “Expanding Pathways to College Enrollment and Degree Attainment: Policies and Reforms for a Diverse Population,” Ithaka S+R, 12 December 2019, https://sr.ithaka.org/publications/expanding-pathways-to-college-enrollment-and-degree-attainment/.↑
-
“50-State Comparison: Transfer and Articulation 2022,” Education Commission of the States, 2022, https://reports.ecs.org/comparisons/transfer-and-articulation-2022.↑
-
“IHL Policies and Bylaws,” Mississippi Board of Trustees of State Institutions of Higher Learning, 2022, p. 88, http://www.mississippi.edu/board/downloads/policiesandbylaws.pdf.↑
-
“50-State Comparison: Transfer and Articulation 2022,” Education Commission of the States, 2022, https://reports.ecs.org/comparisons/transfer-and-articulation-2022.↑
-
Jason L. Taylor and Matt Giani, “Modeling the Effect of the Reverse Credit Transfer Associate’s Degree: Evidence from Two States,” The Review of Higher Education 42, no. 2 (2019): 427-455, https://doi.org/10.1353/rhe.2019.0002; Edén Cortes-Lopez and Jason L. Taylor, “Reverse Credit Transfer and the Value of the Associate’s Degree: Multiple and Contradictory Meanings,” Community College Journal of Research and Practice (2018): 1-17, https://doi.org/10.1080/10668926.2018.1556358.↑
-
“MATT: Mississippi Articulation & Transfer Tool,” MyWay Mississippi, https://matttransfertool.com/.↑
-
“Tennessee Transfer Pathway,” https://www.tntransferpathway.org/.↑
-
“Articulation and Transfer in Tennessee Higher Education 2021 Report,” Tennessee Higher Education Commission, 2021, p. 29, https://www.tn.gov/content/dam/tn/thec/bureau/research/other-research/all-other/articulation/Articulation_and_Transfer_2021_Final.pdf.↑
-
James Ward and Julia Karon, “A State-by-State Snapshot of Stranded Credits Data and Policy,” Ithaka S+R, 4 May 2021, https://sr.ithaka.org/blog/a-state-by-state-snapshot-of-stranded-credits-data-and-policy/.↑
-
“Attainment for All: Postsecondary Pathways,” The Hunt Institute, 2020, https://hunt-institute.org/wp-content/uploads/2022/04/final-A4A-brief-april-22.pdf.↑
-
“Community College Support Program Significantly Improves Degree Attainment,” University of Chicago Urban Labs, 2021, https://urbanlabs.uchicago.edu/news/community-college-support-program-significantly-improves-degree-attainment.↑
-
Susan Scrivener, Michael J. Weiss, Alyssa Ratledge, Timothy Rudd, Colleen Sommo, and Hannah Fresques, “Doubling Graduation Rates: Three-Year Effects of CUNY’s Accelerated Study in Associate Programs (ASAP) for Developmental Education Students,” mdrc, 2015, p. 18, https://www.mdrc.org/publication/doubling-graduation-rates.↑
-
Ibid., 20.↑
-
“CUNY ASAP: Scaling Intensive Student Support Services to Rase Graduation Rates at Bronx Community Colleges,” Results for America, 2021, https://www1.cuny.edu/sites/asap/wp-content/uploads/sites/8/2021/05/28283961_For-RFA_CUNY_Case-Study.pdf.↑
-
“Significant Increases in Associate Degree Graduation Rates: CUNY Accelerated Study in Associate Programs (ASAP), City University of New York, 2022, https://www1.cuny.edu/sites/asap/wp-content/uploads/sites/8/2022/10/CUNY-ASAP-Program-Overview_-October-22_Web-Final.pdf.↑
-
Sara DiNatale, “’No One Is Applying’: Omicron Pushes Understaffed Hospital System into Crisis Mode,” Mississippi Today, 11 January 2022, https://mississippitoday.org/2022/01/11/mississippi-understaffed-hospital-system-crisis-omicron/.↑
-
Julia James, “Teacher Shortage: Mississippi Lacks 3,000 Certified Teachers,” Mississippi Today, 20 December 2021, https://mississippitoday.org/2021/12/20/mississippi-teacher-shortage-3000-teacher-vacancies/.↑
-
Scott Cohn, “America’s Worst State for Business: Mississippi is Cheap, but Its Workforce Weak,” CNBC, 13 July 2022, https://www.cnbc.com/2022/07/13/workforce-makes-mississippi-americas-worst-state-for-business.html.↑
-
According to Lifetracks, 58 percent of students at Mississippi public universities are white. We use this as our guide and identify occupations in which the credential production in associated fields is over 58 percent white.↑
-
Data at the sub-state level is available by census defined PUMAS, or Public Use Microdata Areas. PUMAs can contain a multitude of counties, and while most fell completely within the WDA borders as constructed, a few have counties split across the Delta and Mississippi Partnership areas. In these cases, the entire PUMA was designated as a part of the Delta region, as the majority of counties in both PUMAs were a part of the Delta WDA.↑
-
Geoff Pender, “Lawmaker Pass Largest Teacher Pay Raise in Mississippi History,” Mississippi Today, 22 March 2022, https://mississippitoday.org/2022/03/22/lawmakers-pass-largest-teacher-pay-raise-in-mississippi-history/.↑
-
Courtney Ann Jackson, “Mississippi Teacher Attrition Rate Ticks Up this School Year and Is Worse in Low-performing Districts,” WLBT, 6 October 2022, https://www.wlbt.com/2022/10/06/mississippi-teacher-attrition-rate-ticks-up-this-school-year-is-worse-low-performing-districts/.↑
-
“Teacher Shortage Area Reports,” US. Department of Education Office of Postsecondary Education, 2022, https://tsa.ed.gov/#/reports.↑
-
“TEACH Grants,” Federal Student Aid, 2022, https://studentaid.gov/understand-aid/types/grants/teach.↑
-
Toren Ballard and Rachel Canter, “Nothing in the Pipes: Educator Crisis in Mississippi,” Mississippi First, December 2020, https://issuu.com/mississippifirst/docs/pipeline_view.↑
-
Molly Minta, “New Loan Program Aimed at Nursing Shortage Will Create More Student Debt, Won’t Add New Nurses This Year,” Mississippi Today, 13 June 2022, https://mississippitoday.org/2022/06/13/new-nursing-shortage-loan-program/.↑
-
“Committee Substitute for Senate Bill No. 2419”, Mississippi Legislature, Regular Session 2022, http://billstatus.ls.state.ms.us/documents/2022/pdf/SB/2400-2499/SB2419PS.pdf.↑
-
“Resolution Adopting a Postsecondary Attainment Goal in Mississippi,” Education Achievement Council (2020), http://www.mississippi.edu/eac/downloads/eac_attainment_goal_resolution_adopted_10-22-2020[52].pdf.↑
-
Alexandra Bastien, James Crowder Jr., Justin Scroggins, Pamela Stephens, and Sarah Treuhaft, “Boosting Economic Growth in Mississippi through Employment Equity,” PolicyLink, May 2018, 2, https://www.policylink.org/sites/default/files/EmploymentEquityMississippi_05_18_18.pdf.↑
-
Based on the population of 25-64 year-olds with at least a high school diploma in the state. Average employment rate for Black bachelor’s degree holders is 94.8 percent, average employment rate for white high school diploma recipients is 94.4 percent.↑
-
Alexandra Bastien, James Crowder Jr., Justin Scroggins, Pamela Stephens, and Sarah Treuhaft, “Boosting Economic Growth in Mississippi through Employment Equity,” PolicyLink, May 2018, 2-10, https://www.policylink.org/sites/default/files/EmploymentEquityMississippi_05_18_18.pdf.↑
-
Lifetracks AdHoc Reports,” Lifetracks, 2022, https://lifetracks.ms.gov/.↑
-
State Equity Report Card Overview: Mississippi – Black Americans, The Education Trust, https://www.stateequity.org/.↑
-
Daniel Borowczyk-Martins, Jake Bradley, and Linas Tarasonis, “Racial Discrimination in the U.S. Labor Market: Employment and Wage Differentials by Skill,” IZA: Institute of Labor Economics, 2017, 1-49, https://www.iza.org/publications/dp/8176/racial-discrimination-in-the-us-labor-market-employment-and-wage-differentials-by-skill.↑
-
Valerie Wilson, “The Costs of Racial and Ethnic Labor Market Discrimination and Solutions that Can Contribute to Closing Employment and Wage Gaps,” Economic Policy Institute, 2022, https://www.epi.org/publication/wilson-testimony-costs-of-racial-and-ethnic-labor-market-discrimination/.↑
-
“UM Endowment Builds to Record $775 Million,” University of Mississippi News, 2021, https://news.olemiss.edu/um-endowment-builds-to-record-775-million/.↑
-
Meredith Kolodner, “Many State Flagship Universities Leave Black and Latino Students Behind,” The Hechinger Report, 2018, https://hechingerreport.org/many-state-flagship-universities-leave-black-latino-students-behind/.↑
-
There are six standalone HBCUs in the state: Jackson State University, Alcorn State University, MS Valley State University, Coahoma Community College, Tougaloo College, and Rust College. Additionally, the Utica Campus of Hinds Community College is considered an HBCU embedded within the HCC system.↑
-
“How HBCUs Can Accelerate Black Economic Mobility,” McKinsey & Company, July 2021, https://www.mckinsey.com/industries/education/our-insights/how-hbcus-can-accelerate-black-economic-mobility.↑
-
James T. Minor, “A Contemporary Perspective on the Role of Public HBCUs: Perspicacity from Mississippi,” The Journal of Negro Education 77, no. 4 (Fall 2008), pp. 323-335, https://www.jstor.org/stable/25608702#metadata_info_tab_contents.↑
-
“HBCUs Make America Strong: The Positive Impact of Mississippi’s Historically Black Colleges and Universities,” UNCF, 2014, https://uncf.org/programs/mississippi-impact.↑
-
Richard D. Kahlenberg, “How Higher Education Funding Shortchanges Community Colleges,” The Century Foundation, 2015, pp. 6-8, https://vtechworks.lib.vt.edu/bitstream/handle/10919/83636/FundingCommunityColleges.pdf?sequence=1&isAllowed=y.↑
-
Ibid., 7.↑
-
Ibid., 8↑
-
Xianglei Chen and Sean Simone, “Remedial Coursetaking at U.S. Public 2- and 4-Year Institutions: Scope, Experiences, and Outcomes,” NCES US Department of Education, 2016, https://nces.ed.gov/pubs2016/2016405.pdf.↑
-
Jeffrey C. Valentine, Spyros Konstantopoulos, and Sara Goldrick-Rab, “What Happens to Students Placed Into Developmental Education? A Meta-Analysis of Regression Discontinuity Studies,” Review of Educational Research 87, no. 4 (2017): 806-833, https://doi.org/10.3102%2F0034654317709237.↑
-
“50-State Comparison: Developmental Education Policies,” The Education Trust, 2020, https://www.ecs.org/50-state-comparison-developmental-education-policies/.↑
-
IHL board policy Section 602.B, p. 99, http://www.mississippi.edu/board/downloads/policiesandbylaws.pdf.↑
-
Jeffrey C. Valentine, Spyros Konstantopoulos, and Sara Goldrick-Rab, “What Happens to Students Placed Into Developmental Education? A Meta-Analysis of Regression Discontinuity Studies,” Review of Educational Research 87, no. 4 (2017): 806-833, https://doi.org/10.3102%2F0034654317709237.↑
-
Christine G. Mokher, Toby J. Park-Gaghan, and Shouping Hu, “What Happens to Efficiency and Equity? The Cost Implications of Developmental Education Reform,” Research in Higher Education 62, no. 2 (2021): 151-174, https://link.springer.com/content/pdf/10.1007/s11162-020-09593-w.pdf?pdf=button.↑
-
“Assembly Bill No. 745,” California Legislative Information, 2017, https://leginfo.legislature.ca.gov/faces/billNavClient.xhtml?bill_id=201720180AB705.↑
-
Lilah Burke, “Years After California Limited Remediation at Community Colleges, Reformers Want More Fixes,” Higher Ed Dive, 2022, https://www.highereddive.com/news/years-after-california-limited-remediation-at-community-colleges-reformers/623288/.↑
-
IHL board policy Section 608.E, p. 105, http://www.mississippi.edu/board/downloads/policiesandbylaws.pdf.↑
-
“No Room for Doubt: Moving Corequisite Support from, Idea to Imperative,” Complete College America, 2021, p. 10, https://completecollege.org/wp-content/uploads/2021/04/CCA_NoRoomForDoubt_CorequisiteSupport.pdf.↑