Library Acquisitions Pilot: Looking At The Data
In an earlier blog post we discussed a methodology we are testing to gauge whether a cross institutional analysis of library acquisitions may be possible in the future by leveraging next generation integrated library systems (ILS), which store libraries’ data in the cloud and, in some cases, allow for one member library to generate a report that can be run easily for any of their customers. In this post we share a dashboard (below) that shows how we could visualize such data, delving into the vendors libraries purchase from and how much they spend in particular disciplines. At this point, the data we have gathered are extremely limited, and we present the dashboard for demonstration purposes only. We share this in order to show both the limitations and possibilities of expanding a data collection effort to other libraries that use similarly configured integrated library systems.
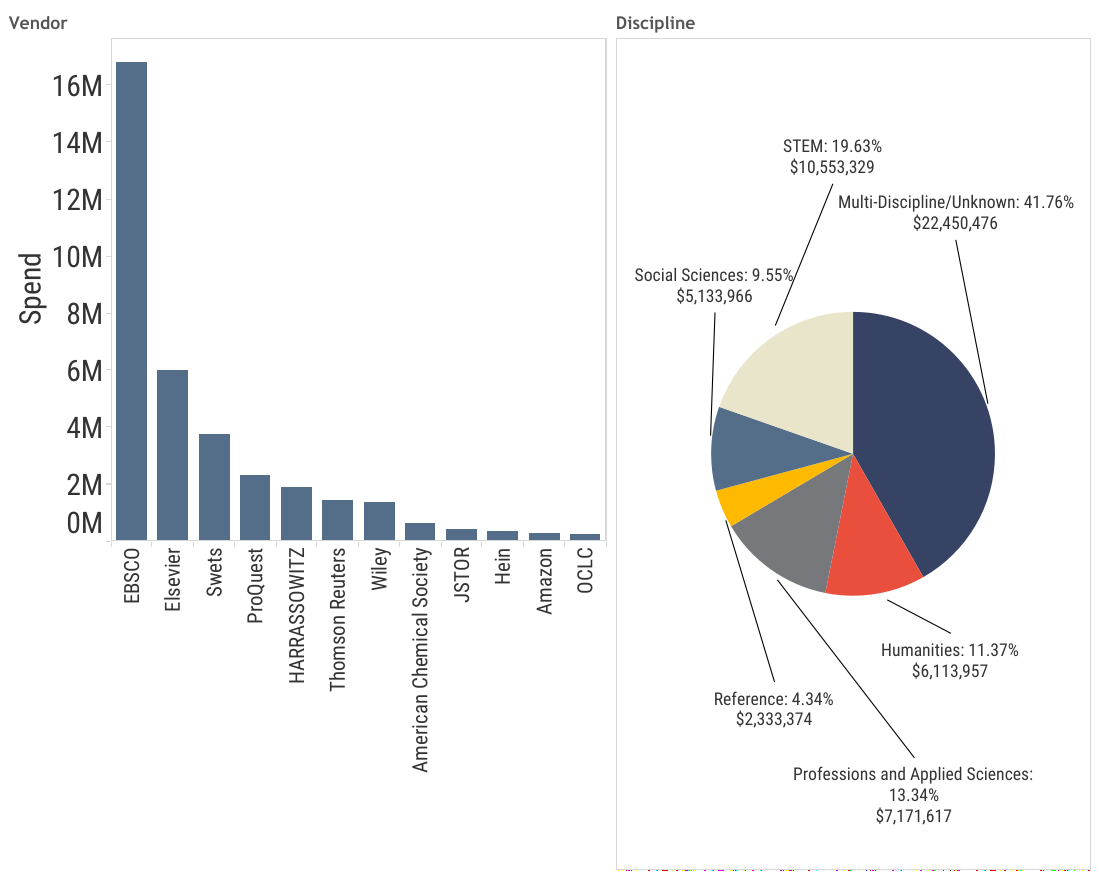
The acquisitions dashboard shows purchases made by our pilot organizations, separated by vendors. Some of our pilot organizations were able to provide the full three years of data we requested (FY-2013 to FY-2015) while others were only able to provide a single year. As a result, this dashboard shows purchases made during FY-2013, a year for which we have full acquisition records from each participating library. In aggregate, the pilot libraries have purchased at least $200,000 worth of content from these vendors, so smaller vendors are not included. Our pilot group is composed of four large research libraries from different regions in the U.S., each of which has implemented Ex Libris’s ILS, Alma. These data are anonymized and aggregated by institution.
Purchases are shown in a bar chart on the left, and include books, serials, computer files, maps, music, visual materials and mixed materials.
The pie chart to the right of the vendor bar chart represents the percentage and total amount spent on a given discipline. This pie chart also functions as a filter for the vendor bar chart. Click on one of the disciplines and notice that the vendor graph shifts. For instance, click on STEM and EBSCO increases relative to other vendors. Select reference, a category that includes the Library of Congress disciplines “General Works” (A) and “Bibliography, Library Science, Information Resources (General)” (Z), and Thomson Reuters is the primary vendor. It is worth noting that EBSCO’s sales include purchases through YBP, to reflect its recent acquisition. Further analysis could uncouple these vendors to look at respective sales, or explore specific material types like print books or databases.
The multi-discipline/unknown category reflects the records for which a discipline category was not assigned in the acquisitions record. When measured by spend this category accounts for just over 40% of existing records. This is largely because libraries tend not to assign disciplines to large package purchases of electronic content, such as journal “big deals,” which are typically entered as a single item in the ILS. (As an example, if you filter on this category, Elsevier increases relative to other vendors, due to its large journal packages.) This is an artifact of the way the data have been recorded in the ILS, and is a limitation of the methodology. It is likely that any dashboard will not fully account for libraries’ spend within particular disciplines, as so many resources will fall into this category.
The data also show that these four libraries purchased over $200,000 of materials from Amazon, mostly books in the humanities. Through a larger sample we could see whether spending patterns with Amazon vary based on the budget of the library, and whether this spend increases or decreases year over year.
An interactive version of this chart is available on the Tableau website.
There are many existing limitations to the data we collected. Even after identifying an ILS that has some degree of standardization in its categories, there are idiosyncrasies in the ways each library reports its acquisitions, which must be accounted for if we are to glean an accurate picture of the channels through which content is distributed from publishers to libraries. For this limited sample, we also needed to suppress certain vendors from the dashboard in order to maintain the anonymity of our pilot group, and this might also be true in a larger study.
But if, as we believe, it is possible to work with libraries and reach a degree of consistency in how they track the data, we may be able to offer leaders in the library and scholarly communications communities a more accurate perspective on their shifting marketplace. In our next iteration of this project we will work with more Alma libraries to scale the data request and expand our methods for standardizing the data. As you explore this dashboard please let us know what you find useful, what questions you have, or what you would like to see included in future analysis. You can comment below or email questions to liam.sweeney@ithaka.org.