It was just an experiment—we didn’t mean to change the way we do our work
In Fall 2017, Georgetown University fielded the Ithaka S+R local undergraduate student, graduate student, and faculty surveys. Emily Guhde, Director of Library Assessment, describes in today’s blog post how the library has analyzed – and continues to return to – the data from these surveys. – Christine Wolff-Eisenberg
Using Google Data Studio to analyze our Ithaka S+R Survey results was a risk that paid off. Now we’re using it for project reports, data presentations, and it might be the platform for our next data dashboard. This post is about how we went from risk to rewards and what we learned along the way.
Taking Risk
When I first mentioned the idea of using Google Data Studio to analyze our Ithaka S+R Survey results to my boss, I attached a number of caveats: “It’s still in beta. It would be an experiment. I’ve never used it before. I don’t know anyone who has used it before. It could be a complete waste of time.” She didn’t even flinch; she totally had my back. To great bosses everywhere (you know who you are): Thank you for letting us risk failure. Sometimes, everything just works out.
Weeks later, we received our neatly packaged results back from Ithaka S+R, with nearly 2,000 responses across three survey instruments. I started playing around with the results in Google Data Studio to see if it could do what we needed it to do. I enjoy working with Google Data Studio now, but at the time, it was brand new to me, and exploring it was a stressful process. Part of that stress was the time pressure. I knew that I only had a couple of weeks to race up the steep learning curve before I hit a point of no return. After that, it would be costly to start from scratch in a new system if Google Data Studio flopped. To control the chaos, I sliced off a smaller portion of the data set so that I could see how the system was working behind the scenes while I modified various settings and experimented with aggregating formulas. I mostly learned how to break things. Many an early graph was clobbered by my clumsy keystrokes. But eventually, and with the benefit of plenty of how-to videos and blogs, and the support of my small-but-mighty assessment team, I figured out how to fix my errors and then, most crucially, how to avoid them in the first place. The payoff for the risk we took was enormous. We ended up with a dynamic, digital report that met all of our criteria:
- Engaging layout – with consistent branding and interactive features such as filters and sortable tables,
- Balanced content – blending data visualization alongside analysis notes and contextual information about the survey questions,
- Customized options – with navigation features to encourage exploration and discovery of trends or patterns,
- Integrated systems – working well alongside other familiar tools and resources commonly used by library staff,
- Secure sharing – building within the university-provided infrastructure and using NetID-controlled, dual authentication for access.
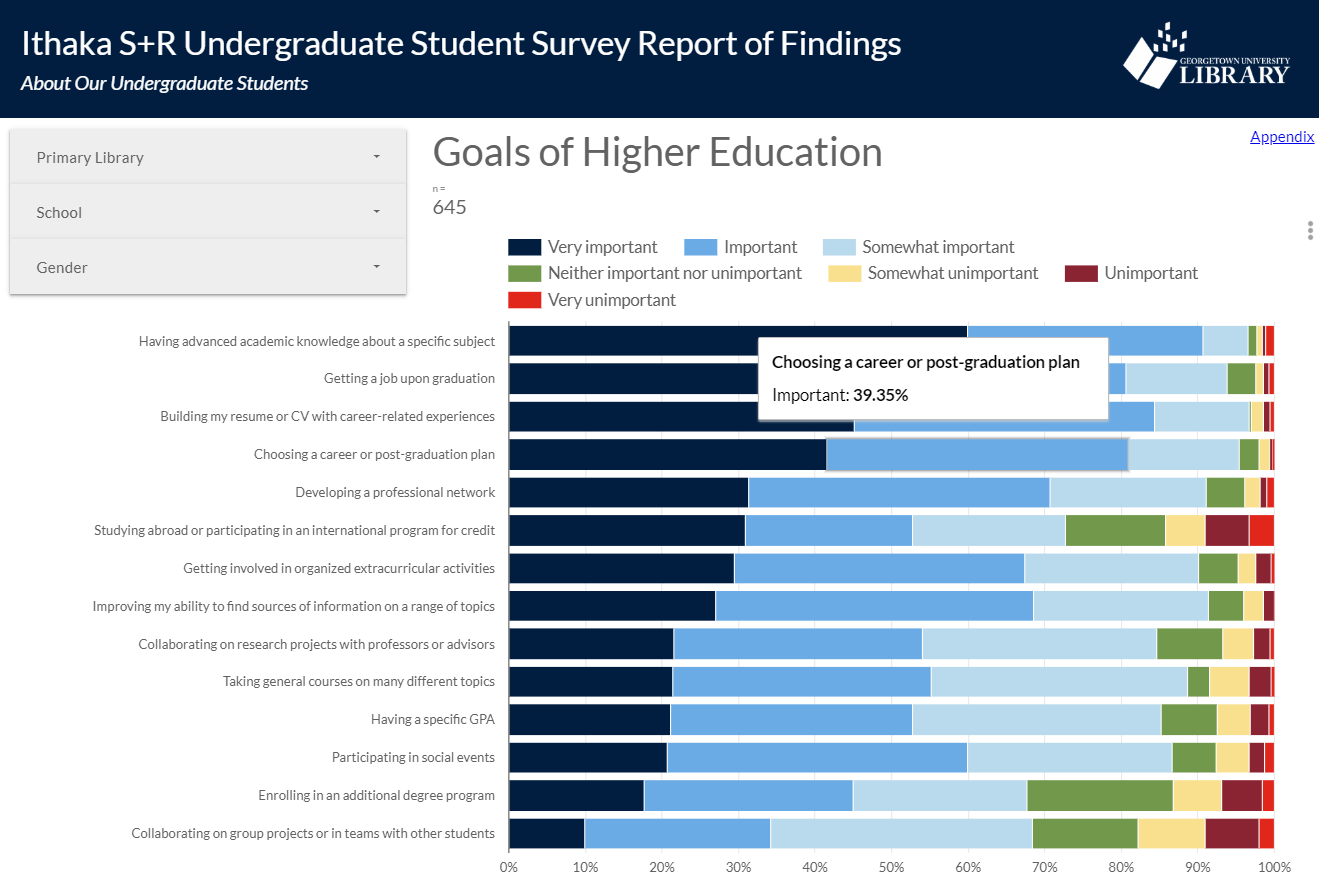
A typical page within our Google Data Studio report
Initially I saw this screen frequently, but then I learned how to structure my data set and how to use the connectors more effectively
Taking Action
Almost immediately after presenting the Ithaka S+R Survey results at an all staff meeting in spring 2018, the library headed into an extended period of major transitions, including a new Dean of the Library and a new ILS. Consequently, we let the data rest for a few months while other priorities took center stage. But by fall 2018, the library’s Assessment Steering Committee had developed a plan to systematically analyze every section of the data set in Google Data Studio, isolating results by campus, school, or primary library, as appropriate to the question. Thanks to administrative support and the dedication of the Assessment Steering Committee, we identified actionable results in three areas:
- Actions to Communicate our Findings (e.g., Leading a discussion with the library’s Digital Scholarship Committee to highlight findings regarding data management, digitized primary source materials, and publishing in digital formats.)
- Actions to Adapt our Approach (e.g., Conducting targeted outreach to graduate students who teach classes to increase their awareness of library instruction services.)
- Actions to Assess more Deeply (e.g., Conducting a research needs assessment with business school students and faculty.)
Having the data available in a flexible system allowed us revisit our findings from many angles. This flexibility was desirable during a period of transition, and we were able to focus on using the data to support new initiatives and committees that have only recently been developed. Now we are just weeks away from finalizing our list of action items, which we will present to the Library’s Leadership Council to inform goals for the next fiscal year.
Taking it Further
Google Data Studio is no longer in beta, and its recent improvements make it easier for us to justify its use for additional purposes. In particular, we have discovered that it is well-suited for user experience projects, where the ability to look dynamically at a subset of the respondents (e.g., only graduate students or only tenured faculty) is desirable not just during analysis, but during reporting as well. Because the report is digital, Google Data Studio gives us the ability to ask questions of the data and provide answers quickly even after the report is complete.
We are also considering Google Data Studio as a home for the next version of our library’s data dashboard. In our current system, we have to manually disaggregate monthly reports from various systems so that each department head can view their results at the departmental level. By using Google Data Studio, we could ingest the data once (or possibly automate this step) and department heads could examine their own data after applying a filter. It would take some effort to migrate the data dashboard to Google Data Studio, but thanks to our experience with the Ithaka S+R data set, we can worry less about the risks and focus more on the rewards.