Art Museum Director Survey 2022
Documenting Change in Museum Strategy and Operations
-
Table of Contents
- Foreword
- Introduction
- Key Findings
- About the Survey
- Leadership, Governance, and Strategy
- Diversity, Equity, Accessibility, and Inclusion
- Visitors and the Public
- Digitizing Collections
- Budgets, Revenue, and Staffing
- Climate Change
- Conclusion
- Appendix A: Participation
- Appendix B: Spotlight on Gender, Race, and Ethnicity of Respondents
- Appendix C: Full Participant Demographics
- Endnotes
Foreword
Art museum directors play a critical role in the cultural ecosystem, often serving as a bridge between trustees, staff, and the public. Directors have a pronounced influence on collections and acquisitions strategies, how museums engage the public, the financial health of the institution, and the wellbeing of museum staff. Over the last two years, museum directors have faced major challenges as their institutions have navigated a global pandemic, a reckoning for racial justice following the murder of George Floyd, continuous threats from natural disasters, as well as an inflationary period that brought precarity to many low wage workers. How have directors adapted their approach to leadership and strategy as they have navigated these various social and environmental transformations?
This second cycle of the art museum director survey, fielded in spring 2022, provides a window into how museum strategies have changed in the past two years. Notably, directors’ attention to issues of diversity, equity, accessibility, and inclusion has strengthened substantially since early 2020, but directors still see recruiting diverse applicants and reaching new audiences as challenging. Additionally, directors are facing new challenges in staff retention and recruitment, with pay equity increasing in importance. Limits to in person gathering have sparked a dramatic change in the importance of virtual engagement. These and other findings indicate directors’ views continue to evolve with public conversations and crises and will serve as an important reference point as future researchers study the impact of the past two years on the art museum field.
Through a new line of questions, this report provides data on how museums have experienced and are preparing for climate change related damage. The relationship between museums and the environment is multifaceted. On one hand, museums face threats to their ability to keep their doors open and maintain their facilities in the face of flooding, wildfires, and poor air quality; on the other hand, leaders in the field have a responsibility to measure their institutions’ impacts on the environment. Additionally, museums have the opportunity to serve as community institutions in the face of crises through public space, cultural conservation, and education. This report lays a foundation on which we can continue to study how museums continue to adapt and address climate change.
This report comes at a crucial moment for art museums. Documenting the strategies and activities of museums, measuring progress towards goals, and identifying needs are necessary to support a diverse and sustainable public cultural life. We look forward to the opportunities for growth and reflection this research provides.
We thank the Kress Foundation and the Mellon Foundation for their continued support of this research.
Introduction
In April 2022, with funding from the Kress Foundation and the Mellon Foundation, and in partnership with the Association of Art Museum Directors (AAMD) and the American Alliance of Museums (AAM), Ithaka S+R launched the second iteration of the Art Museum Director Survey.[1] One hundred and eighty-one art museum directors completed the attitudinal survey, sharing perspectives about the institution they represent, as well as the museum sector as a whole. This survey focuses on issues of governance, leadership, strategy, collections, public engagement, staffing, and budgets and revenue.
Additionally, the survey measures changes in directors’ perspectives since the early days of the COVID-19 pandemic. In March 2020, the pandemic swept across the United States, closing the doors of museums. At this moment, the first cycle of this survey had been in the field for roughly a month. Ithaka S+R closed the survey with a fifty percent response rate. We had no idea when launching the survey that it would indeed serve as a benchmark of directors’ perspectives immediately before their positions, and the roles of their institutions, would be completely transformed.
The intervening years revealed that the pandemic would be just one of the national/international crises shaping the cultural sector and public. The murder of George Floyd by police sparked a wave of racial justice protests that impacted civic and educational institutions across the country. The break in precedent of the peaceful transition of power after the 2020 presidential election has driven political and ideological polarization to new extremes. Recently, high inflation has presented new challenges, particularly to low-income workers who have seen wage stagnation for decades.[2]
How have museums responded to these intersecting crises? This report publishes the findings from the second cycle of the survey and explores the ways that directors’ perspectives have changed since early 2020.
Key Findings
Managing change is a key competency for current directors.
From public health crises that forced museums to develop virtual programming to developing strategic approaches to diversity, equity, accessibility, and inclusion (DEAI) and anti-racism work, leaders of art museums believe they must be nimble, responding rapidly to changing social and physical environments.
Pay equity is a top priority among many interrelated DEAI strategies in museums.
When asked how they prioritize different aspects of DEAI work in their museum, the strategies most frequently seen as high priorities are 1) pay equity and 2) paying a living wage to all staff. Directors see raising staff wages as a central component to creating an equitable and diverse workplace. Museum directors also see DEAI strategies related to increasing staff diversity, reaching new audiences, and ensuring accessibility for disabled visitors as high priorities. Responses indicate that directors see overlap and intersection between DEAI commitments, staff retention and recruitment, and investments in virtual programming.
The pandemic accelerated the digital transformation of museums but approaches to digitization vary.
Since 2020, museums have dramatically increased their focus on providing digital experiences for audiences. However, academic museums have prioritized digitizing collections, particularly of diverse artists, while municipal museums did not report prioritizing digitization. Gaps in this activity may reflect different approaches to digitization before the pandemic, different constituencies and governance, or availability of resources and infrastructure.
Museums have not solved the revenue/expense bind, challenging their ability to address pay equity concerns.
While paying a livable wage to staff and improving pay equity are significant concerns for directors, revenue ratios are the same as before the pandemic. At the same time, personnel costs remain the highest expense category for museums.
Retaining staff becomes increasingly challenging.
Directors are optimistic about adding employee positions in a number of areas; however they also report increased difficulty in recruiting and retaining employees. In directors’ understanding of why employees are voluntarily leaving their museum, staff satisfaction issues beyond pay, including work-life balance, are growing in importance.
A high number of museum directors are preparing for future climate crises or have already experienced them.
Even as museum leaders grapple with current crises, they prepare for the unpredictable impacts of climate change. A number of museums have already experienced damage to their buildings and collections. Many have adopted assessment tools to measure their carbon footprint.
Acknowledgements
Our advisory board helped us establish the questionnaire and provided feedback at key stages of the process. We would like to acknowledge and thank them for their help with this project:
- Teresa A. Carbone, Program Director for American Art, Henry Luce Foundation
- Jill Deupi, Director, Lowe Museum, University of Miami
- Lial Jones, Director, Crocker Museum of Art
- Franklin Sirmans, Director, Pérez Museum of Art
- Alejandra Peña Gutiérrez, Director, Weisman Museum of Art, University of Minnesota
We are grateful to our partners from AAMD on this project, Chris Anagnos, Alison Wade, and Stephanie Yao, as well as our partners from AAM, including Laura Lott, Ryan Bourke, Kyle Johnson, and Megan Lantz, who helped provide outreach during the administration period of the survey. We also thank Deborah Cullen Morales from the Mellon Foundation and Max Marmor and Lisa Schermerhorn from the Kress Foundation for their guidance and support.
Finally, we would like to thank our colleagues at Ithaka S+R whose feedback throughout this project has been important to its success: Deirdre Harkins, Kimberly Lutz, Mark McBride, and Roger Schonfeld. Thank you also to Nicole Betancourt, who administered the 2020 and 2022 cycles of this survey.
About the Survey
In the 2022 survey cycle, we received valid responses from 181 directors, each representing one museum. Ninety-eight of these museums, or 54 percent of the sample, were also represented in the 2020 survey. Eighty-seven directors, or 48 percent of the sample, also participated in the 2020 survey.
This survey was designed to include the perspectives of both academic and municipal art museums.[3] It includes responses from 81 academic museums and 100 municipal museums. In this analysis, we occasionally analyze museums according to their type, as we did in the 2020 report, and share the meaningful differences that arise.
This report is organized into thematic sections, including:
- Leadership, Strategy, and Governance
- Diversity, Equity, Accessibility, and Inclusion
- Visitors and the Public
- Collections
- Budgets, Revenue, and Staffing
- Climate Change
Leadership, Governance, and Strategy
Museum directors have many complex responsibilities, which require them to draw on a wide range of skills. At the same time, they face varied constraints on their ability to execute strategies. This section will discuss how directors responded to questions about the importance of different competencies in executing their work, constraints museums face in realizing their mission, strategies they undertake to approach these challenges, as well as their governance characteristics and dynamics. Through our comparisons of responses from the 2022 and 2020 cycles of the survey, we are also able to see how responsive directors’ perspectives on leadership and strategy are to the social and organizational changes of the past two years.
Competencies
In this cycle of the survey, a larger percentage of art museum directors in the aggregate recognized the ability to manage change as a key competency for their work. Thirty-five percent of respondents reported managing change as a key competency in 2020, but this increased to nearly 50 percent in 2022, making it the leading competency for directors in this cycle of the survey (Figure 1).
Figure 1: Which of the following knowledge, skills, abilities, and competencies have been most valuable for you in your current position? Please select up to three items or leave the question blank if none of the items apply. Percentage of directors that selected each item, 2022 and 2020.
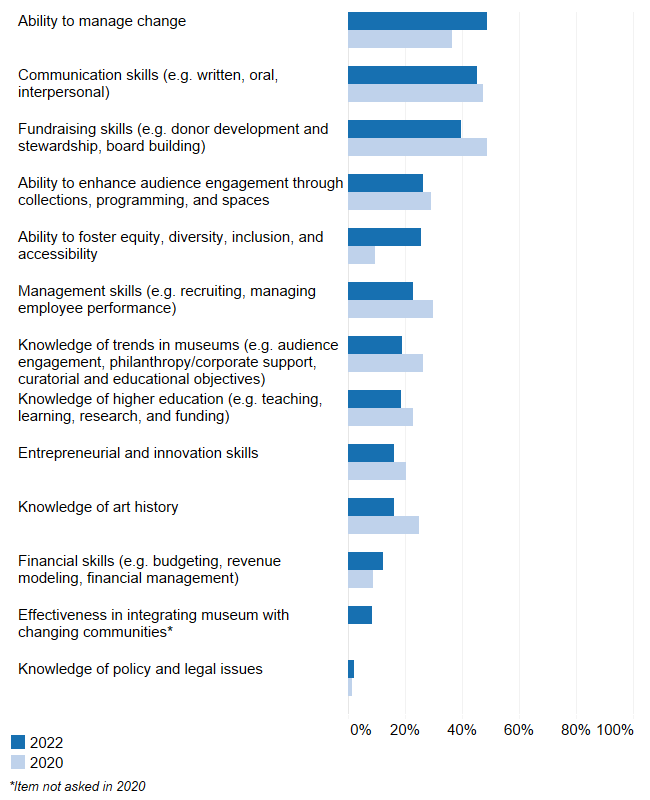
The finding that more directors reported valuing the ability to manage change is unsurprising, as museums have had to radically reinvent their work and relationship to audiences throughout the pandemic. The ability to manage change has also likely grown in importance as the needs of recruiting and retaining staff have changed, as will be explored further in the Budgets, Revenue, and Staffing section. But it does highlight the reality that the work of managing an art museum is becoming less about the art. For instance, the perceived importance of knowledge of art history has dropped by about 10 percentage points since 2020.
Fundraising was the top ranked competency in 2020 but dropped to third place in 2022, under communication skills. This may be due to the inability to gather donors in person during the pandemic. The shift is notable given the financial constraints museums face.
The most substantial shift in competencies between 2020 and 2022 can be seen in the item “Ability to foster equity, diversity, inclusion, and accessibility” (DEAI). This item was selected by 9 percent of directors in 2020, rising to 26 percent of directors in 2022. After years of conversations within the museum field and the wider societal reckoning for racial justice following Floyd’s murder and Black Lives Matter organizing, there has been a shift in how museum directors see DEAI in relation to their own work. The DEAI section of this report further explores how museum directors define their DEAI priorities.
Directors from academic and municipal museums generally value their skills and competencies similarly. For example, although more directors from municipal museums report valuing fundraising skills than directors from academic museums, the percentage of directors that most value this skill was reduced by about 9 points among both groups. There are also some notable differences. The percentage of directors that reported valuing management skills only fell among academic directors, while the percentage of directors who selected financial skills grew among academic directors and stayed stable among municipal directors. Academic directors often faced unique budget challenges and hiring freezes during the height of the pandemic, which may have lessened the perceived importance of employee management while increasing that of financial management.
Constraints
Directors were asked to report their primary constraints when executing the strategy of the museum. While a lack of financial resources remains the top ranked item, it has declined since 2020 (Figure 2). This is likely because of the introduction of a new item in the 2022 cycle of the survey, “Interruptions due to public health concerns,” which ranks as the second highest constraint in executing museum strategy.
Figure 2: What are the primary constraints on your ability to execute strategy in your museum? Please select up to three items that have the greatest impact, or leave the question blank if none of the items apply. Percentage of directors that selected each item, 2022 and 2020.
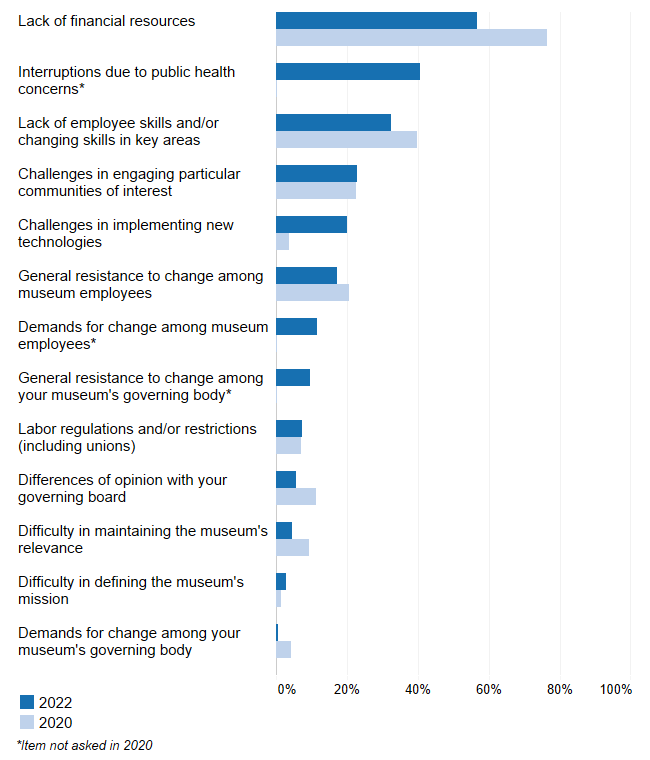
Lack of employee skills and/or changing skills in key areas was selected by over 30 percent of museum directors, down from nearly 40 percent in 2020.
While in 2020, 10 percent of museum directors reported that a primary constraint to executing museum strategy was difficulty in maintaining the museum’s relevance, roughly 5 percent selected this option in 2022. This is an encouraging sign that despite navigating multiple crises, more directors may perceive that their museum has increasing relevance to the public.
Across academic and municipal museums, directors most frequently noted that a lack of financial resources and interruptions due to public health concerns were the biggest constraints on executing their strategy. However, among the other constraints listed, there were some disparities based on museum type. For directors of municipal museums, for instance, challenges in implementing new technologies grew by eight points from 16 percent in 2020 to 23 percent in 2022, while this constraint was selected by 16 percent of academic directors in both survey cycles. This might relate to differences in approaches to digitization that will be explored later in the report.
Governance
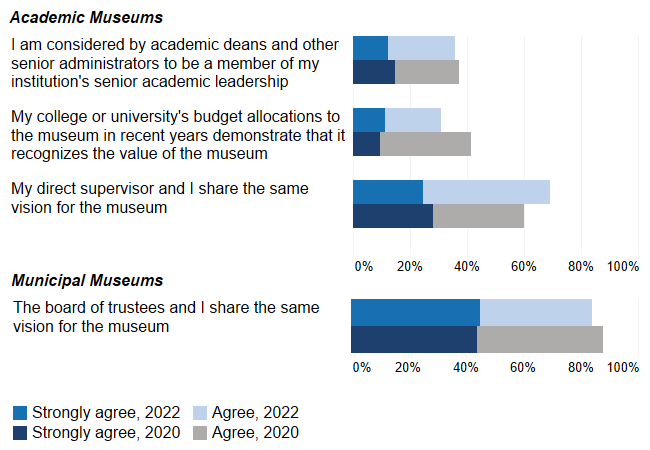
Differences in opinions with governing boards or direct supervisors are still not frequently seen as constraints by directors. However, other survey questions about directors’ relationships with leadership reveal that these are less secure among academic museums. In both survey years, more than 80 percent of municipal directors report that they strongly agree or agree that they share the same vision for the museum with their board of trustees (Figure 3). In contrast, 69 percent of academic directors feel they share the same vision for the museum with their direct supervisor, though this has increased from 60 percent in 2020.
Academic museums may be experiencing heightened uncertainty about their role in their college or university. Only 35 percent of academic directors strongly agree or agree that they are considered by academic deans and other senior administrators to be a member of their institution’s senior academic leadership, a similar percentage to 2020. Additionally, only 31 percent—down 10 percentage points from 2020—strongly agree or agree that their college or university’s budget allocations to the museum in recent years demonstrate that it recognizes the value of the museum.
Figure 3: Please read the following statement(s) and indicate the level of your agreement with each. Percentage of directors that selected “strongly agree” and “agree,” 2022 and 2020.
Strategy Changes Since 2020
While directors’ perceptions of their own work have changed in response to the intersecting forces of growing demands for racial justice, changing relationships between museums and their audiences, and the effects of the COVID-19 pandemic, we also see that museum strategies have shifted in response to these forces. In this cycle of the survey, directors were asked, “Over the last two years, how has your museum’s strategy changed?” (Figure 4). Importantly, this question asks about change, rather than overall museum strategic priorities which may have remained the same since before the pandemic. The three most frequently selected items directly relate to the changes happening outside of the museum: “Engaging in anti-racism and/or DEAI work within the museum” (selected by 78 percent of directors), “Prioritizing the expansion of virtual engagement” (77 percent), and “Maintaining staff safety and satisfaction” (76 percent).
Figure 4: Over the last two years, how has your museum’s strategy changed? Please select all that apply. Percentage of directors that selected each item, 2022.
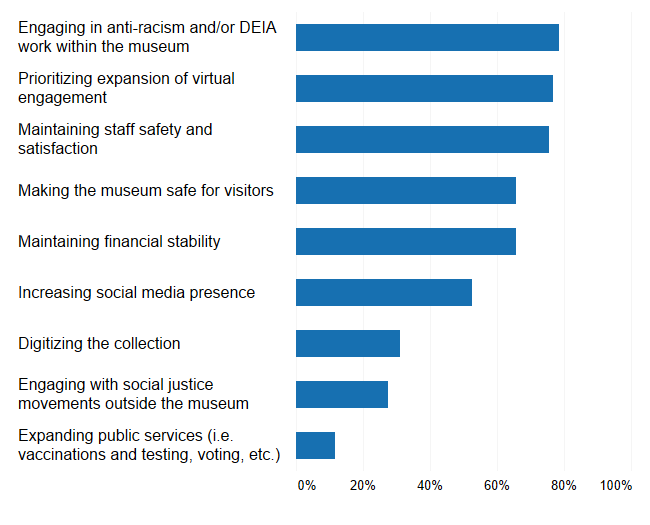
The three most frequently chosen strategy changes were selected by roughly the same percentage of directors, and there is a 10 percentage point difference between them and the fourth-most frequently selected change. This suggests directors may see these changes as intersecting rather than exclusive.
Engaging in social justice movements outside the museum was not frequently selected; fewer than 30 percent of directors reported this change in strategy. This indicates that the museum is distinguishing its internal work towards anti-racism/DEAI from engaging with external social justice movements.
Diversity, Equity, Accessibility, and Inclusion
Museum directors were asked a number of questions specifically about their approaches to diversity, equity, accessibility, and inclusion (DEAI) work. First, they were asked how high of a priority various strategies that might fall under the header of DEAI are at their museum. This allows us to measure how directors understand this work in an applied sense within their institution. Additionally, certain questions asked directors to rank the importance of a series of different items that were linked by a common theme, for instance in their collections and programming strategies. This section analyzes findings from both types of questions. Additional analysis of DEAI related findings from this survey will be published separately in the 2022 Art Museum Staff Demographic Survey, funded by the Mellon Foundation.[4]
Specifying DEAI Strategies
Nearly three times as many directors reported an increase in the importance of fostering DEAI issues in 2022 as in 2020, up to 26 percent from 9 percent (Figure 1). Coupling this with the finding that anti-racism/DEAI work is the most frequently reported strategy change at their museums (Figure 4), DEAI issues appear to be front and center for museum directors two years after the inaugural survey was launched.
How do museum directors apply these priorities within their organizations? Museum directors indicated the extent to which 15 strategies were a priority at their museum (Figure 5). Providing a livable wage for all employees and contractors is the strategy most frequently selected as a very high or high priority, followed by ensuring pay equity for employees in comparable positions. These are more frequently ranked as very high and high priorities than programming, staffing, training, governance, acquisitions, and repatriation, among other items that were available for selection.
Figure 5: How much of a priority is each of the following equity, diversity, and inclusion strategies at your museum? Percentage of directors that selected “very high priority” and “high priority,” 2022 and 2020.
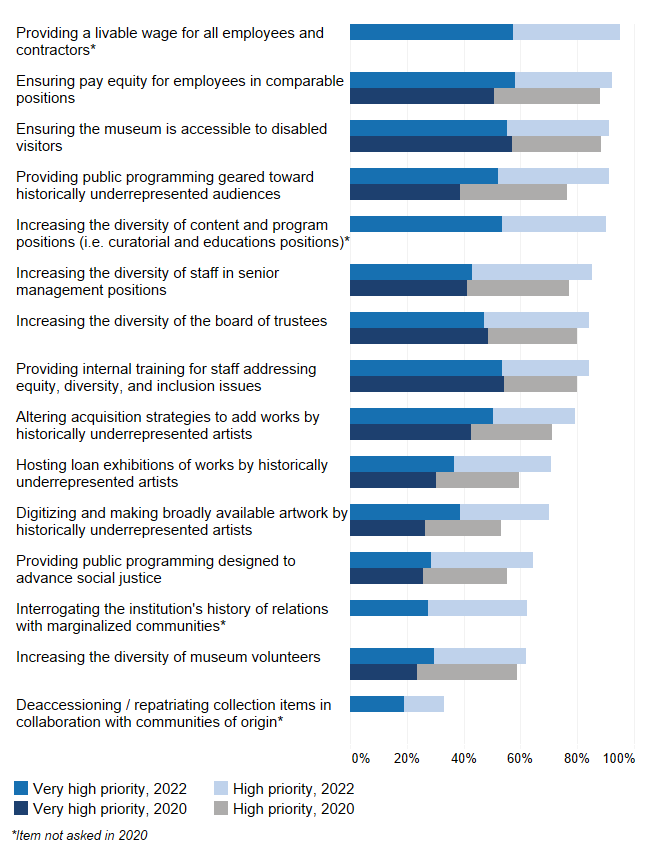
The focus on pay equity and paying staff a livable wage may seem unusual as the primary consideration for DEAI issues. However, ensuring pay equity was also one of the most commonly selected very high and high priorities in 2020. The growth in the percentage of directors that selected this item, coupled with the even slightly higher percentage of directors that see providing a livable wage as a high or very high priority at their museum, solidifies how central issues of pay are to how directors see DEAI work.
Issues around pay have direct connections to maintaining diverse and equitable workplaces. As one director shared in a Center for the Future of Museums blog post describing her museum’s efforts to meet pay equity and living wage goals, “our goals to diversify our team and achieve equity would be impossible without pay equity.”[5] However, the survey item “Ensuring pay equity for employees in comparable positions” could be interpreted in different ways by directors. For example, directors may focus on pay ranges within roles and positions while leaving large differences in pay across the organization. Coupled with the strategy of ensuring living wages, there seems to be at minimum a commitment to “raising the floor,” so that pay for the lowest paid positions meets employees’ needs. The forthcoming 2022 Art Museum Staff Demographic Survey, funded by the Mellon Foundation, will explore how pay equity issues intersect with uneven racial and ethnic representation across museum positions.
Providing public programming geared toward historically underrepresented audiences was ranked third on the list of strategies and was selected as a high or very high priority by 91 percent of directors. This is a 15 point increase from the last survey cycle, one of the largest changes over time for this question.
Several other strategies are ranked just below issues of pay, including ensuring that the museum is accessible to disabled visitors. This has consistently been one of the most frequently reported very high and high priority DEAI strategies. Increasing the diversity of content and programming staff, senior management staff, and the board of trustees, as well as providing internal training for staff, are all seen by more than 80 percent of directors as high or very high priorities.[6] Indeed, staff demographic data reveals that representation along race, ethnicity, and gender is uneven across museum positions.[7] Directors face challenges in diversifying positions as well. As documented in the report section on recruiting and retaining staff, building a diverse pool of candidates for open positions has consistently been seen by directors as one of the most difficult managing and hiring activities.
Digitization may also provide opportunities for museums to diversify their collections. Fifty-three percent of directors in 2020 said that “Digitizing and making broadly available artwork by historically underrepresented artists” was a very high priority or high priority at their museum, while 70 percent thought so in 2022; this is the largest change over time in the prioritization of any DEAI strategy. More directors at academic museums than municipal museums selected this strategy as a high or very high priority by a difference of 14 percentage points.
Over 50 percent of directors see all but one of the strategies provided in the survey as high or very high priorities at their museums (Figure 5). The existence of multiple priorities speaks to the interrelated nature of the challenges facing museum directors, including increasing the diversity of staff across positions, maintaining staff satisfaction, creating equitable pay structures, investing in digital collections and virtual engagement, and being more inclusive of new museum audiences.
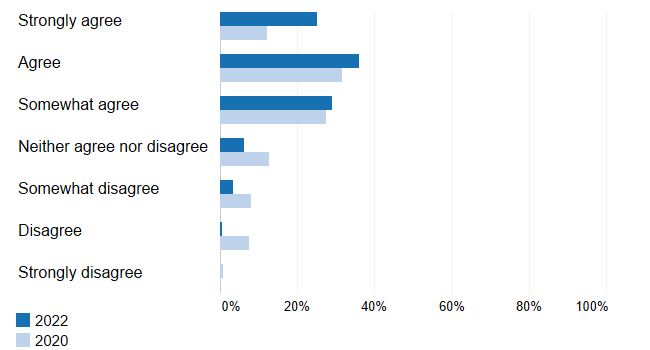
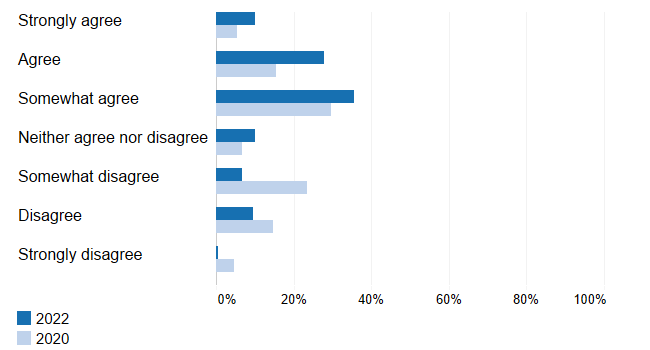
The survey does not indicate how directors’ reported prioritization of DEAI strategies relate to actual organizational policies at their museums. It does seem, however, that directors are more confident in their museum’s DEAI policies for staff in 2022 than they were in 2020. Sixty-one percent of directors in 2022 either agree or strongly agree to the prompt “my museum has well-developed strategies for improving equity, diversity, inclusion, and accessibility for its employees,” as compared to 44 percent in 2020 (Figure 6). This indicates that in addition to directors more highly valuing and prioritizing DEAI, they also feel more confident in their ability to meet these goals.
Figure 6: My museum has well-developed strategies for improving equity, diversity, inclusion, and accessibility for its employees. Percentage of directors that selected each agreement level, 2022 and 2020.
Representation in Collections
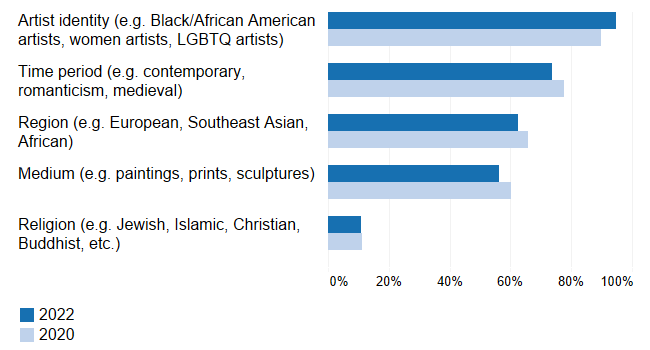
Seventy-nine percent of directors in 2022, an increase from 71 percent in 2020, selected “Altering acquisition strategies to add works by historically underrepresented artists” as a high priority or very high priority (Figure 5). Directors were also asked to prioritize a list of various items related to acquiring new art, and the most important aspect of acquisition strategy for directors in 2022 is artist identity (Figure 7). This was also the case in 2020, but the number of directors who selected this item increased from just below 80 percent in 2020 to 95 percent in 2022. This item was followed by time period, region, and medium, which were all selected by 50-75 percent of directors. Religion was seen as a much lower priority when considering acquisition strategy; below 10 percent of directors selected this option.
Figure 7: When making decisions about which artwork to acquire at your museum, which of the following do you prioritize? Please select all that apply. Percentage of directors that selected each item, 2022 and 2020.
While in 2020 46 percent of museum directors reported that they had well-developed strategies for increasing the diversity of artists and/or subjects in their collections, in 2022, 67 percent of directors strongly agreed or agreed that they have these strategies in place. Keeping in mind that this is self-reported data, it fits with a general trend of increased awareness and confidence in the museum’s ability to address DEAI across various operations within the museum. Directors at municipal museums more strongly agreed that their museums have well-developed strategies for increasing the diversity of the artists and/or subjects in their collections by a difference of 10 percentage points compared to academic museums. This may be simply because municipal museums are more likely to be actively acquiring work than academic museums, which face very different types of budget constraints.
Audiences
When rating the priority of several DEAI strategies, providing public programming geared toward historically underrepresented audiences is seen as a priority by a higher number of respondents in 2022 than in 2020, growing from 75 percent to 91 percent (Figure 5).
Museum directors were also asked to indicate the extent to which they agreed with two statements related to identifying and reaching out to audiences who are not engaged in the museum. In general, directors feel similarly towards the statement, “My museum does a good job of determining which audiences are not visiting or otherwise engaged with the museum,” in 2022 as they did in 2020, with 32 percent selecting agree or strongly agree in 2022, compared to 33 percent in 2020 (Figure 8).
Figure 8: My museum does a good job of determining which audiences are not visiting or otherwise engaged with the museum. Percentage of directors that selected each agreement level, 2022 and 2020.

At the same time, however, directors feel much more confident in 2022 in their museum’s development and implementation of strategies to reach audiences that are not engaged with the museum than they did in 2020 (Figure 9). In 2022, 32 percent of directors selected agree or strongly agree in response to the prompt “My museum has developed and implemented strategies to reach audiences that have never visited or otherwise engaged with the museum,” while only 20 percent of directors did so in 2020.
Figure 9: My museum has developed and implemented strategies to reach audiences that have never visited or otherwise engaged with the museum. Percentage of directors that selected each agreement level, 2022 and 2020.
Taken together, these responses show that museums are investing more into reaching out to audiences that have previously not been included in museum programming but that directors still see identifying who these audiences are as a challenge.
Visitors and the Public
Strategies around engaging new audiences and developing virtual engagement are being prioritized by art museum directors as part of their approach to adapting to the many changes and disruptions over the last two years. This section will explore topics including returning the museum to pre-pandemic hours, the role the museum plays in relation to the public, and descriptions of programming. Additionally, in this cycle directors were asked for the first time about partnerships their museums have with organizations that serve vulnerable populations.
Programming in 2022
The survey asked directors how important it was for their museum to serve in a variety of capacities (Figure 10). Among the ten options, the museum’s role as a trusted source for educational programming and for learning and information were most frequently selected as extremely and very important. Perhaps the most striking finding, though unsurprising, is the change in importance of providing digital experiences over time. In 2022, 76 percent of directors considered this to be an extremely or very important capacity for their museum, an almost 30 point increase from the 44 percent of directors who thought this was the case in 2020.
Figure 10: How important is it to you that your museum currently serves in the capacities listed below? Percentage of directors that selected “extremely important” or “very important,” 2022 and 2020.
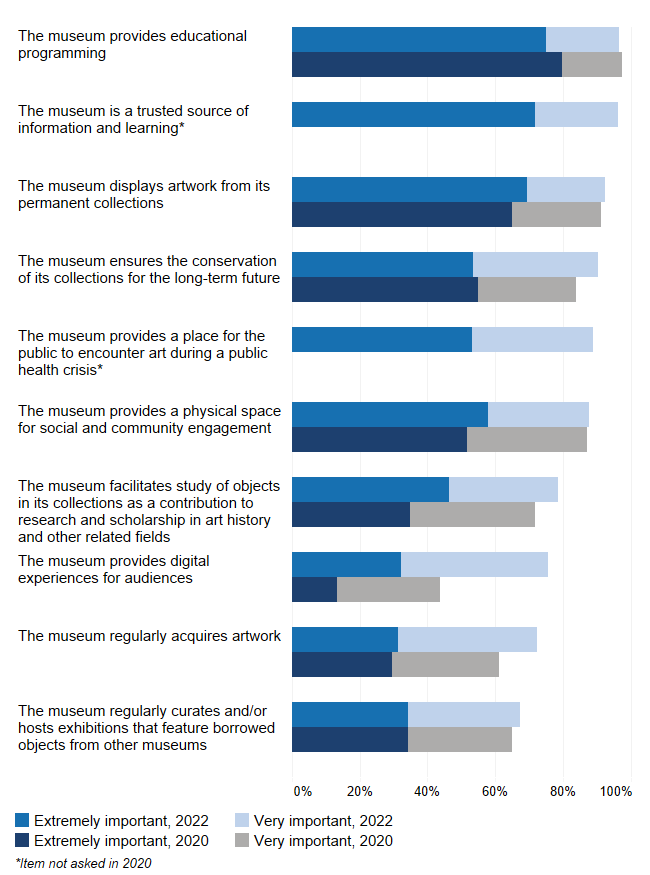
Directors also weighed in on how important they thought it would be for their museum to serve in these capacities in the next five years. Although less than half of respondents thought that providing digital experiences in 2020 was very important or extremely important at that time, 70 percent thought that it would be in the near future. Directors saw that digital experiences would grow in importance in the early days of the pandemic, before anyone knew the extent to which in person engagement would be affected. However, while the acceleration of digital and virtual engagement has unfolded, the physical public space a museum provides remains extremely or very important to almost 90 percent of directors. Ninety-five percent of directors think that providing a physical space for social and community engagement will be extremely or very important in the next five years. These findings reveal that virtual engagement is seen as a complement to, rather than a replacement for, physical engagement.
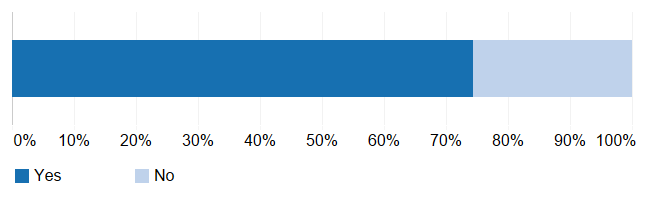
One question in the museum field at the start of the pandemic was whether temporary closures or reductions in hours would be permanent. With respect to returning to normal hours, almost 75 percent of directors report that museums have resumed their regular hours and days of operation from before the pandemic (Figure 11).
Figure 11: Has your museum resumed regular hours and days of operation from before the start of the COVID-19 pandemic? Percentage of directors that selected each option.
As museums return to normal operating hours, they are doing so with hybrid public programming. Whether working with local K12 schools, cultural organizations, colleges and universities, community centers, or religious or civic institutions, the most commonly selected programming option is hybrid format (Figure 12).
Figure 12: Does your museum currently offer any of the following off-site/virtual programming? Please select all that apply. Percentage of directors that offered each programming type in 2022 and 2020. In 2022, respondents could indicate whether programming was in person, hybrid, or virtual.
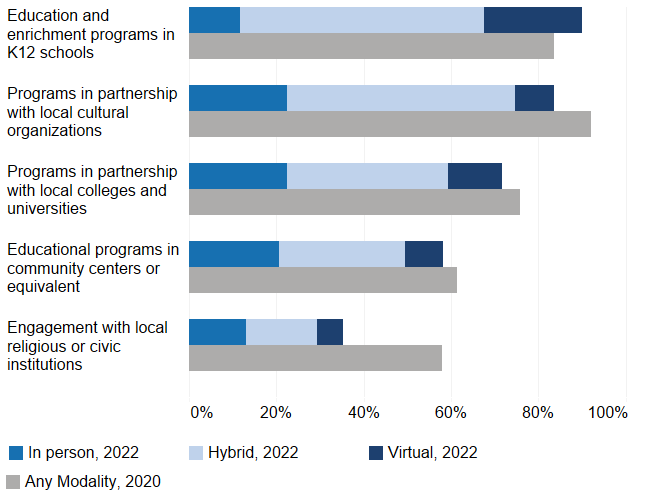
Ninety percent of directors in 2022 noted that their museums provide education and enrichment programs in K12 schools. These are now the most common partnerships, up from 84 percent in 2020. While programming for K12 schools was more common among municipal museums than among academic museums in both 2020 and 2022, K12 programming has become more common among academic museums since the last survey by 7 percentage points, while the percentage of municipal directors that chose this programming option has stayed stable.
Directors reported partnering with local cultural organizations, colleges and universities, and community centers at slightly lower frequencies in 2022 than in 2020. Engagement with local religious or civic institutions declined the most substantially between the two survey years. Fifty-eight percent of directors reported having these partnerships in 2020, while only 35 percent did in 2022. This drop was most substantial in municipal museums, where the percent of directors that selected this programming partnership fell from 71 to 37 percent.
Partnerships with Organizations that Serve Vulnerable Populations
Through reporting and discussions with advisors and leaders in the field, it became clear that art museums are expanding their views of how to serve the public.[8] Increasingly, art museums are generating creative partnerships with institutions that serve vulnerable populations in order to provide a different aspect of care to those who may have restricted access or mobility for one reason or another.
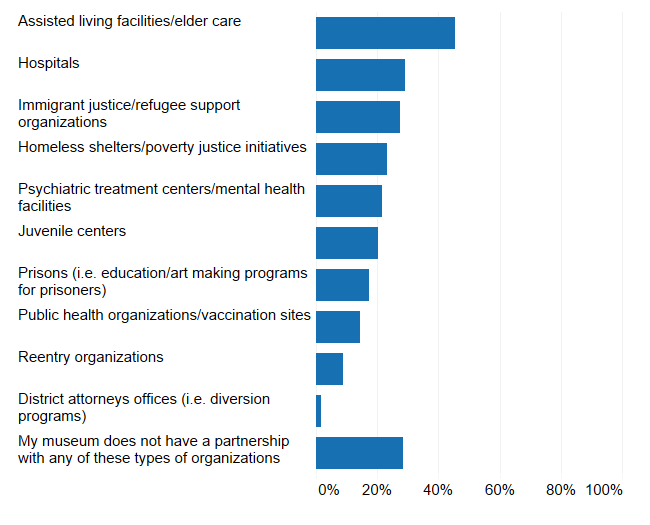
Museum directors were asked whether their museum had partnerships with a series of organizations that serve vulnerable populations. Seventy percent had some sort of partnership with (in declining order) assisted living facilities, hospitals, immigrant justice/refugee support organizations, homeless shelters/poverty justice initiatives, psychiatric treatment/mental health facilities, juvenile centers, prisons, public health organizations, reentry organizations, and district attorney offices (Figure 13).
Figure 13: “Does your museum have partnerships with any of the following organizations, which are intended to serve vulnerable populations? Please select all that apply.” Percentage of directors that selected each option.
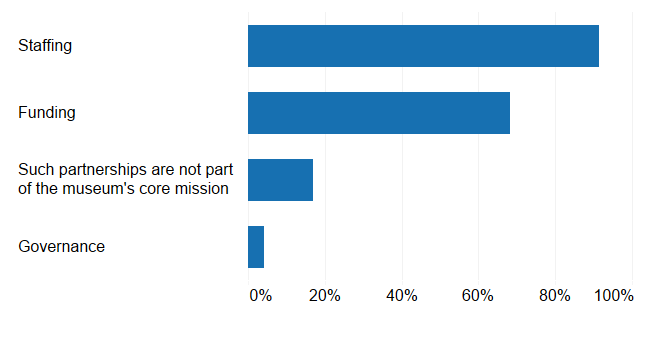
For those museums that had not established such partnerships, directors were asked about the impediments they face towards establishing them. Staffing and funding were overwhelmingly cited as reasons that the museum had not been able to develop such programs, at 91 and 68 percent respectively. Conversely, only 17 percent selected the option “Such partnerships are not part of the museum’s core mission” (Figure 14).
Figure 14: What are the impediments to having partnerships with organizations that serve vulnerable populations? Please select all that apply. Percentage of directors who indicated their museum does not partner with organizations that serve vulnerable populations that selected each option.
Across nearly all partnership types, it is more common for municipal directors than academic directors to report that their museum offers this type of programming. Impediments to partnering with organizations that serve vulnerable populations did not differ by museum type.
Digitizing Collections
The collections museums care for and display are at the heart of museums’ missions. This section discusses how directors view displaying and loaning their collections, as well as trends in digitizing collections.
Digitizing collections can be important for increasing virtual engagement in educational and other settings. Academic and municipal directors repeatedly shared that education and public programming are equally valuable to their museums but differed in their answers to questions about digitization during the pandemic. For education and programming questions, “prioritizing expansion of virtual engagement” was selected as a strategy change in the past two years by 79 percent of academic directors and 75 percent of municipal directors. “Providing public programming geared toward historically underrepresented audiences” was also seen as a very highly or highly prioritized diversity, equity, accessibility, and inclusion (DEAI) strategy by similar percentages of academic and municipal directors. “Providing educational programming” and being “a trusted source of information and learning” were seen as very important or extremely important capacities by over 95 percent of directors from both types of museums and providing “digital experiences for audiences” was seen as such by roughly 75 percent of directors regardless of museum type.
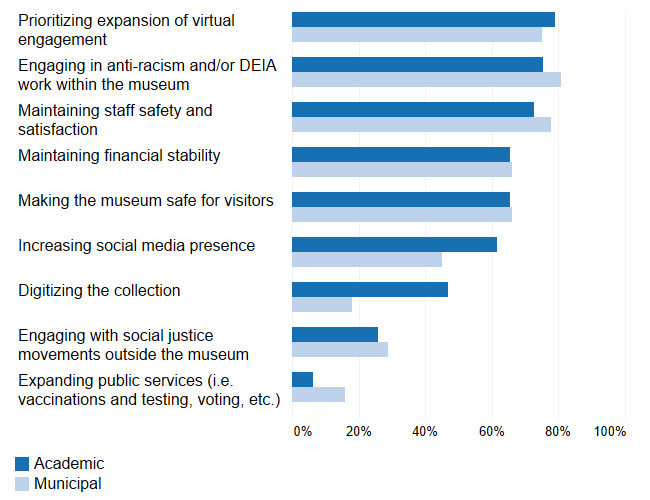
However, directors from academic museums reported digitizing their collections much more frequently than directors from municipal museums. Forty-seven percent of academic directors cited digitizing the collection as a way their museum’s strategy had changed, more than twice the 18 percent of municipal directors (Figure 15). Additionally, a larger percentage of academic directors reported that “digitizing and making broadly available artwork by historically underrepresented artists” were very high or high priorities at their museums.
Figure 15: Over the last two years, how has your museum’s strategy changed? Please select all that apply. Percentage of directors that selected each option, 2022 and 2020, Academic and Municipal Museums.
The urgency of digitizing collections was unique for academic museums when the COVID-19 pandemic moved teaching and research online suddenly and for an extended period of time. Higher education instructors, students, and researchers are the primary (though not only) constituents of academic museums. As described in Ithaka S+R’s “Teaching with Cultural Heritage Materials During the Pandemic” report, professors, instructors, and researchers whose work centered on cultural heritage materials in college and university collections relied heavily on library, archive, and museum staff to digitize and share these materials.[9] Additionally, academic museums may have benefited from the support of information and educational technology departments at their college or university campus, while municipal museums would have had to develop these resources at their own institutions or find creative partnerships with other museums. In this case, academic museums may have had a leg up in digitization at the start of the pandemic.
An alternative explanation for this divergence is the development of collection digitization before the pandemic. Some municipal museums may have already started digitizing their collections before 2020, in which case their strategy of digitization would have continued rather than changed in the past two years.
How resources, organizational structure, constituencies, and staff readiness relate to a possible digital divide in museum collections is an important area for continued research. In addition to digitizing existing collections, museums also have the dual challenge of preserving access to newly digitized and digital-first collections. Institutions that do not already have digitizing processes in place may be able to learn from the lessons academic museums gathered from rapidly digitizing, sharing, and storing collections during the pandemic.
Budgets, Revenue, and Staffing
The first two years of the pandemic caused uncertainty in the museum funding landscape. Lack of in person engagement reduced earned revenue while tightening government and university budgets also resulted in cutbacks.[10] However, there is also evidence that museums are starting to regain stability, though challenges still remain, especially related to staff recruitment and retention.
Revenue and Budgets
In both cycles of the survey, museum directors reported the percentage of their museum’s operating budget that is derived from a list of sources: government support (e.g. federal, state, county, or city government), earned revenue (e.g. admissions, exhibition fees, restaurants and catering, facility rentals, museum store), endowment income, private support (e.g. individual and family memberships, corporate memberships, individual and family contributions, corporate contributions), and college or university support (for academic museums only). The average values for each of these categories are remarkably similar from 2020 to 2022, both in the aggregate and when analyzed separately by museum type. This indicates that in spite of heightened uncertainty around museum funding, very little has changed on average in terms of shares of funding sources.
Like the relative size of revenue sources, museum budget allocations in 2022 look similar to those in 2020. As in 2020, directors estimated in 2022 that about half of their operating expenses are allocated to personnel, substantially higher than any other budget area (Figure 16). The already high financial allocations to personnel coupled with an apparently unchanging funding approach puts directors in a “revenue/expense bind” as they consider ways to achieve their goals of pay equity and staff recruitment and retention.
Figure 16. What percentage of your museum’s operating expenses is allocated to the following areas? Average values for each area, 2022 and 2020.
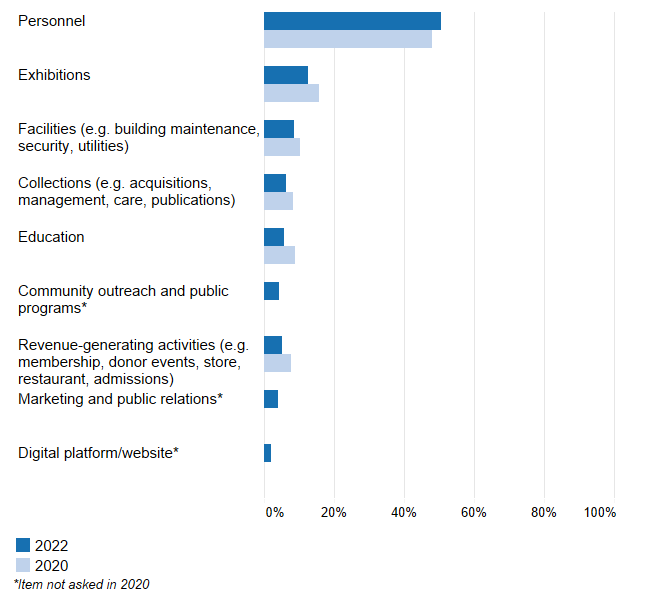
In 2022, the survey grouped the share of expenses allocated to education and community outreach and public programs as distinct categories, while in 2020 these were combined as one category. Comparing the share of expenses allocated to education in 2020 and 2022, there appears to be a reduction at first. However, when community outreach and public programs are combined with education, the share of expenses allocated to this area has remained stable from 2020 to 2022.
Directors are optimistic about adding employees to positions throughout the museum (Figure 17).[11] More than half of directors said they expect to add employee positions in six areas: education, public programming, curation, development, and technology. These areas reflect their commitment to education and programming, acquiring and exhibiting art, and digital and virtual initiatives. It was extremely rare for directors to report that they expect to reduce positions in any area.
Figure 17: To the best of your knowledge, will your museum add or reduce employee positions in any of the following areas over the next five years? Percentage of directors that anticipate adding employee positions or making no change, 2022 and 2020.
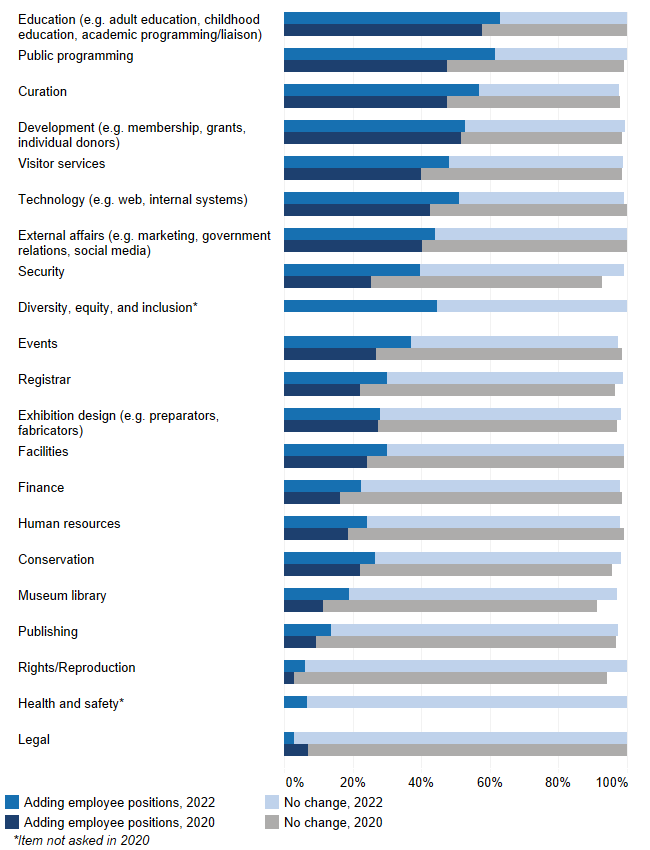
In 2022, as in 2020, roughly 60 percent of museum directors anticipated adding employee positions in education. A similar percentage expected to add positions in public programming, up from 50 percent in 2020. Forty-seven percent expected to add positions in visitor services, up from 40 percent in 2020. As museums begin to build back their workforces following pandemic closures and layoffs, retaining staff and ensuring pay equity for these positions will be an important step towards reaching many of the diversity, equity, accessibility, and inclusion (DEAI) goals that directors reported were priorities at their museums.
In 2022, for the first time, the survey asked if directors expect their museums will add DEI positions. Over one-third of all directors do expect to add positions to this area, and almost half of municipal museum directors expect to add positions in this area.
Recruiting and Retaining Staff
In contrast to the optimism directors have expressed towards adding employee positions, directors also reported increased challenges recruiting and retaining staff. Working in museums during the pandemic has not been simple for staff—over half of directors said their museums had to shift the responsibilities of positions in response to the COVID-19 pandemic. Responses to a free text question provided more information on what these pivots entailed. Most commonly, public engagement positions shifted their work entirely to digital content and programming. The switch to digital also offered many museums the opportunity to reassign front line staff whose work disappeared when the facilities and stores closed. For example, one director noted that “many front line and facilities team members were retained…and redeployed to help with digital and virtual offerings, alt text web translations, membership outreach, etc.” While creative solutions such as these were common in responses, a number of directors explained they had to consolidate several positions and reduce staff. Other challenges included hiring freezes that prevented replacing staff who voluntarily left the museum, as well as increased health and safety work across positions.
The survey also queried directors about how easy or difficult they found various activities related to managing existing staff and recruiting new employees (Figure 18). Across the board, directors found managing and recruiting staff to be less easy in 2022 than they did in 2020, and recruiting activities were considered by a lower percentage of directors to be easy than activities related to managing current staff.
Figure 18: Presently, in staffing positions in your museum, how easy or difficult are each of the following? Percentage of directors that selected “extremely easy” or “somewhat easy” and “extremely difficult” or “somewhat difficult,” 2022 and 2020.[12]
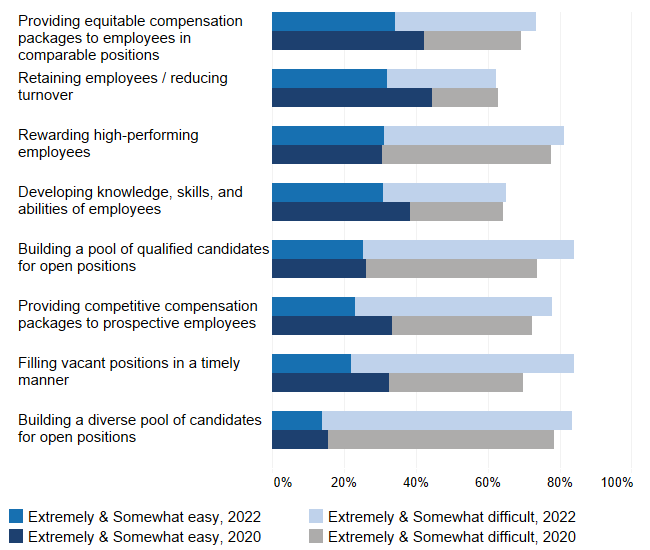
The activities seen by the largest percentage of directors as easy are all related to managing current employees. Around 30 percent of directors found providing equitable compensation packages to employees in comparable positions, retaining employees/reducing turnover, developing knowledge, skills, and abilities of employees, and rewarding high-performing employees to be either extremely easy or somewhat easy. However, a larger percentage of directors found these to be easy in 2020 than in 2022. Providing pay equity, which has become more highly prioritized by directors, fell almost 10 percentage points from 2020 to 2022, and retaining employees fell by 13 points. These two findings show that despite directors’ optimism around adding employees, maintaining staff satisfaction is seen as more challenging by directors, either because of changes in employment such as higher turnover, or because directors’ understandings of these activities have changed.
On the other hand, activities around recruitment were seen as easy by an even lower percentage of directors. Filling vacant positions in a timely manner, building a pool of qualified candidates, and providing competitive compensation packages to prospective employees were all seen as easy by less than 25 percent of directors. Building a diverse pool of candidates for open positions was the most challenging activity in 2020 and in 2022. The consistency of this challenge is surprising considering the finding that more directors feel their museum has well-developed strategies for improving DEAI among staff (see Figure 6). This challenge will need to be addressed in order for museums to meet the representational diversity goals that many directors said were high priorities at their museums and suggests the need for more research and innovation in museum recruiting processes.
As retaining employees becomes more challenging, understanding and addressing the reasons behind employee attrition becomes more important. Directors continue to perceive opportunities for career growth, opportunities for better pay, and personal reasons to be the most common reasons why employees voluntarily leave their museum (Figure 19). However, the reasons not related to pay—career advancement and other personal reasons—were selected by a lower percentage of directors in 2022 than in 2020. It is clear that pay remains central to explanations for employee turnover. However, it also seems that directors are recognizing a shift in the motivations for employees choosing to leave their museum.
Figure 19: What are the top reasons employees voluntarily leave your museum? Please select all that apply. Percentage of directors that selected each item, 2022 and 2020.
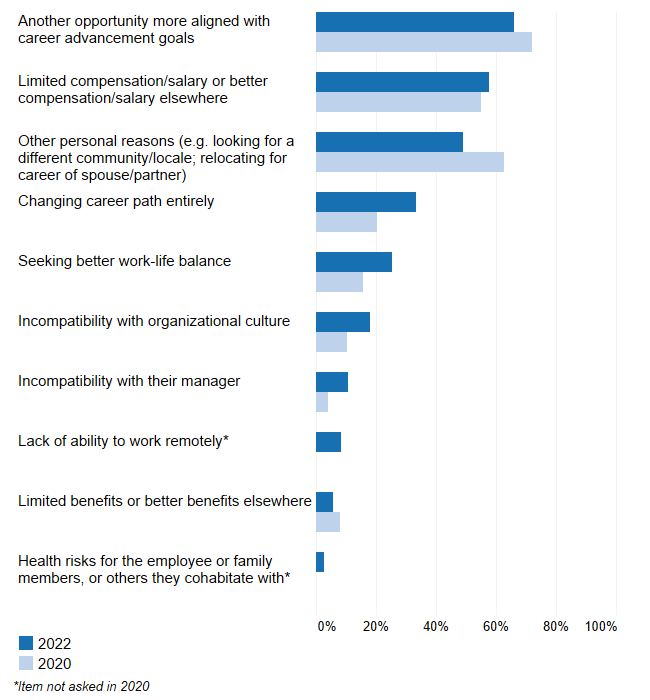
Several reasons not related to pay but rather more aligned with issues of burnout were selected by a greater percentage of directors in 2022. Changing career paths entirely was more frequently given as a reason employees leave their museum, selected by 33 percent of directors in 2022 compared to 20 percent in 2020. Twenty-five percent of directors thought employees left for work-life balance reasons, up from 17 percent in 2020. The growth in these areas suggest that in order to recruit and retain a satisfied workforce, museums will need to address organizational culture issues beyond the matter of pay.
Climate Change
This report addresses the complex responsibilities museum directors face. The issues of climate change and climate disasters, new topics in the survey, illuminate one more aspect of these complexities. In addition to responding to the urgent issues of public health, racial justice, and pay equity, museums have also begun planning for the future impacts of climate change and climate disasters. Many museums have already experienced damage related to climate change and are evaluating the climate impact of their own institution. As this survey cycle was the first to include questions about climate change, we cannot compare these findings to previous years to measure change over time. Still, these findings can be a useful benchmark to use in future research.
Planning for Climate Disasters
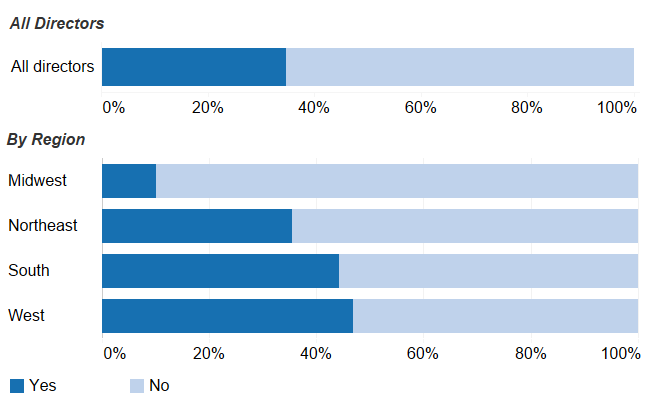
Half of the directors surveyed have started planning for climate disasters, with museums in the West, South, and Northeast outpacing those in the Midwest (Figure 20).
Figure 20: Has your museum planned for climate related disasters? Percentage of directors that selected each option, in aggregate and by region.
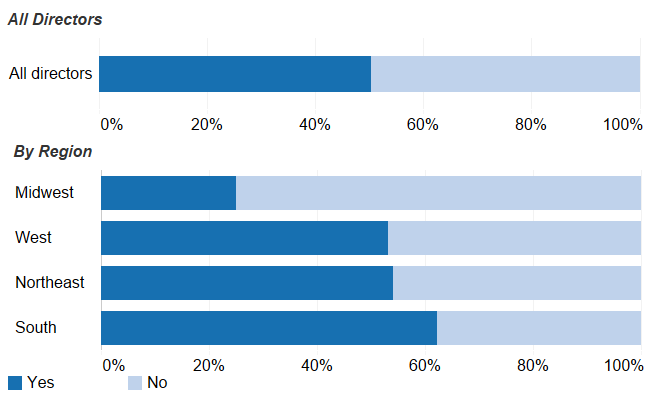
Planning for climate related disasters is slightly more common in municipal museums than in academic museums. This might be a product of organizational structure, if this type of planning is more often undertaken at the campus level, rather than in smaller units of the college or university like the museum.
Only 8 percent of directors said that their museum had identified ways to support the local community in the event of a climate disaster. This indicates that museums are preparing for how disasters will affect their facilities and collections more so than their role as a public space, or in terms of their programming and outreach. Directors whose museums are including supporting the local community in their plans shared the diverse support their organizations could provide, including shelter during evacuations, free admission to their air-conditioned spaces during high heat days, resource pooling with other museums, and supporting Indigenous artists whose craft is threatened by climate change.
A larger percentage of museums are preparing for climate change than have experienced climate change related damage. Thirty-five percent of directors say their museum has experienced damage related to climate change.
It is important to note that the effects of climate change will not be experienced evenly across geography. We already see this in survey responses disaggregated by region. As Figure 21 shows below, climate change related damage was most commonly reported in the West, followed by the South and the Northeast. Climate change related damage was least reported in the Midwest. Comparing Figure 21 to Figure 20, there appears to be an unsurprising connection between regions where directors reported that climate change related damage has affected museums, and regions where museums have started planning for these challenges.
Figure 21. Has your museum experienced challenges or damage related to climate change? Percentage of directors that selected each option, in aggregate and by region.
We also included a free text response question to find out what specific challenges museums had faced. Answers indicated that climate change posed threats to facilities, grounds, collections, staff safety, and public access. In their responses, directors most commonly named flooding as a threat, but directors also cited the increasing frequency of hurricanes and wildfires. One respondent described experiencing multiple challenges: “The biggest challenges have been related to wildfires and extreme weather incidents. We’ve had extremely poor air quality for weeks for the past several years when staff and visitor safety has been challenged. We also had extreme rain conditions that caused flooding.” Additionally, many museums reported struggling to keep up with extreme and fluctuating temperatures. As another director shared, “While not catastrophic, our historic buildings and their infrastructure have been severely challenged by the change in climate (warming and cooling), which has led to environmental issues in our galleries. The need to maintain and replace our aging systems (boilers) and infrastructure not only saps money away from programs but endangers the objects AND the staff who work in the museum.”
Evaluating Climate Impacts
Finally, directors responded to a question about whether their museums had processes in place to evaluate their own climate impact. The majority of museums are taking some measures to evaluate their climate impact, most frequently with respect to their building operations (Figure 22).
Figure 22: Has your museum evaluated its climate impact with respect to the following? Please select all that apply. Percentage of directors that selected each item.
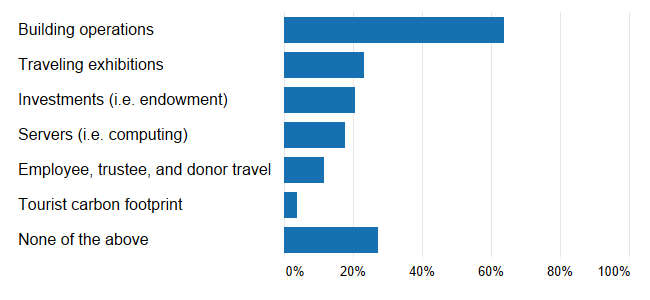
While only 17 percent of directors said their museum had evaluated its climate impact with respect to its computing, this may become more important as digitization and virtual engagement become more common.
We asked directors who said their museum had not evaluated its climate impact what the primary barriers were to doing so. The responses show that most directors feel other priorities and a lack of resources have prevented their museum from conducting a climate impact evaluation (Figure 23).
Figure 23: What are the primary barriers to evaluating climate impact? Please select all that apply. Percentage of directors who indicated their museum had not evaluated its climate impact that selected each item.
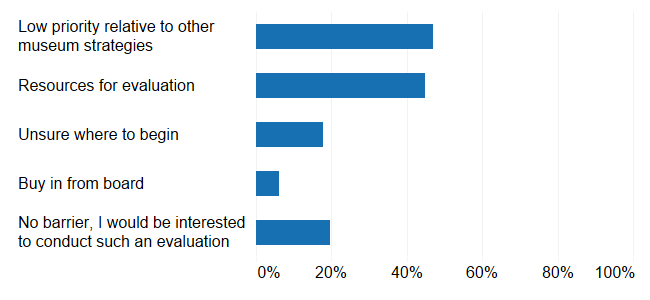
Others either feel unsure of where to begin or do not see a barrier and are interested in conducting a climate impact evaluation at their museum. Only 5 percent cite a lack of buy in from their board.
Conclusion
The 2022 Art Museum Director Survey captures the perspectives of art museum leaders in the United States on matters important to the field, including leadership, strategy, public engagement, collections, budgets, and staffing. The two years since the first cycle of this survey have presented art museums with unprecedented challenges as they face public health dangers and related financial uncertainties. The second cycle of this survey allows a comparison of directors’ views from right before the pandemic took hold in the US to now, as they return to in-person programming.
Looking at how survey responses have changed over time, it is clear directors are responding not only to the health and safety concerns of the COVID-19 pandemic but also to calls for increased representational diversity among staff, the potential to reach new audiences, and issues of pay in the field. Each of these come with their own challenges, evident in survey responses. While a higher percentage of directors see representational diversity among staff as priority at their museum, directors continue to see recruiting diverse applicants as difficult. Similarly, investments in new forms of engagement are challenged by difficulties in identifying audiences that are not yet engaging with the museum. Addressing pay equity and livable wages will continue to be difficult if revenue does not match the increased investment in personnel.
The trends of digitization and virtual engagement, clearly accelerated by the inability to gather in person, present new opportunities for museums to engage with the public. At the same time, these trends reveal the difficulties museums face in developing and maintaining necessary staff and infrastructure. Developing employee skills, recruiting qualified staff, and reducing turnover are all seen as more challenging by directors in 2022 than they were before the pandemic.
Additionally, digitizing collections was not prioritized evenly across museums. Academic museums, which are more closely integrated with teaching at colleges and universities, more frequently prioritized digitization than municipal museums. Whether this gap is the result of different digitization strategies before the pandemic or different constituent needs and available infrastructure, it seems academic museums experienced a transformation in their digitization strategies that municipal museums did not. In order to fully realize their goals of being learning and collecting organizations, museums that have yet to develop collection digitization strategies may be able to glean lessons from their academic counterparts.
The findings from the 2022 Art Museum Director Survey present a snapshot of rapid change in the field. While directors seem attuned to important challenges their organizations face, whether museums are effectively addressing these challenges remains to be seen. Future research on the perspectives of museum leadership as well as the experiences of staff members will help illuminate how museums can best act on their increased attention to DEAI, pay, virtual engagement, and employee retention. This is especially true for the impacts of climate change, which the survey has just begun documenting but museums have already experienced and started planning for. We hope museum directors and other stakeholders in the field will continue to find ways to use this information in their work and contribute to new research directions.
Appendix A: Participation
We sent invitations to 409 museum directors to participate in the survey on April 5, 2022. When we closed the survey on May 13, 2022, we received completed responses from 181 directors. Invitations to participate in the survey were sent through Qualtrics and were signed by either Christine Anagnos, executive director of the Association of Art Museum Directors (AAMD), if the museums were AAMD members, or Laura Lott, president and CEO of the American Alliance of Museums (AAM) if the museums were AAM members only. All directors were sent three reminder messages, signed by: 1) Max Marmor, president of the Kress foundation and Deborah Cullen-Morales, program officer at the Mellon Foundation, 2) Liam Sweeney, senior analyst at Ithaka S+R, and 3) Lial A. Jones, Mort and Marcy Friedman Director & CEO of the Crocker Art Museum and Jill Deupi, Beaux Arts director and chief curator of the Lowe Art Museum at the University of Miami.
Table 1 – Comparison of the two cycles
| Year | Survey Population | Number of Completed Responses | Response Rate |
| Cycle 1- 2020 | 303 | 149 | 49% |
| Cycle 2- 2022 | 409 | 181 | 44% |
The survey is scoped to include additional academic museums from AAM in order to allow for robust comparison between museum types. We included all AAM academic museums with four or more staff. The determination to exclude very small museums with fewer than four staff was made because large parts of the survey instrument would not be relevant to that population.
Appendix B: Spotlight on Gender, Race, and Ethnicity of Respondents
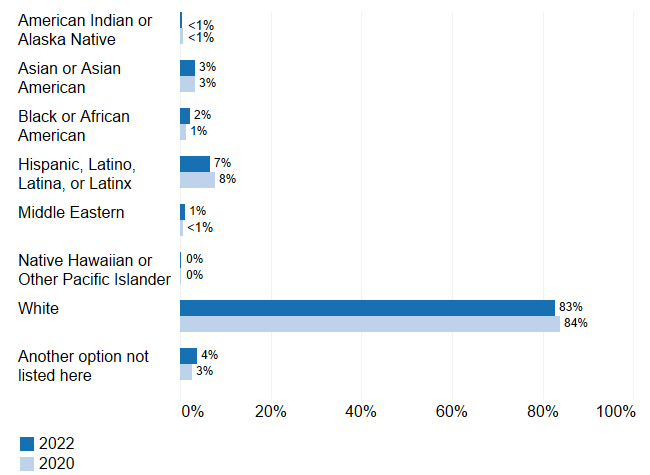
As in 2020, more than 80 percent of directors identify as White (Figure 24). Directors that identify as Hispanic are the next most represented, making up 7 percent of the sample. The racial and ethnic composition of museum directors is similar at academic museums and municipal museums.[13]
Figure 24: Directors’ Race and Ethnicity, 2020 and 2022.
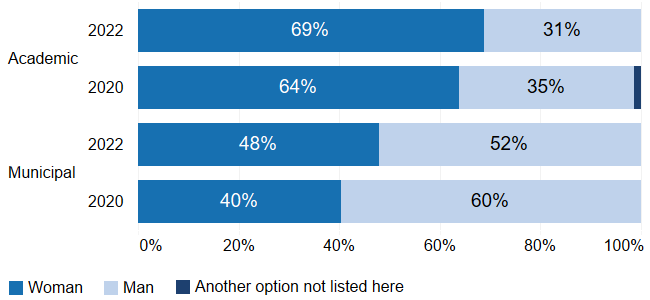
While racial/ ethnic representation has remained consistent, the gender composition of museum directors has changed over time. In both survey cycles, directors could select their gender identity as man, woman, non-binary, or another option not listed. In 2020, 52 percent of respondents identified as women, 47 percent identified as men, less than 1 percent identified as another option not listed, and no directors identified as non-binary. Two years later, women’s representation has increased, so that women make up 57 percent of the sample (Figure 25). No directors identified as non-binary or another option in 2022. This shift in women’s representation has been driven by changes in municipal museums (Figure 26). Women made up 69 percent of academic museum directors in 2022, a small increase from 65 percent in 2020. In municipal museums, women’s representation increased by 8 percentage points from 40 percent to 48 percent—twice the size of the increase in academic museums.
Figure 25: Directors’ Gender, 2020 and 2022.
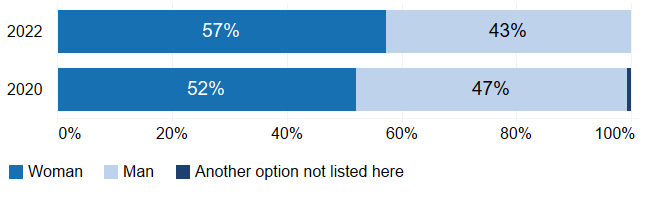
Figure 26: Gender Representation by Museum Type, 2020 and 2022.
Appendix C: Full Participant Demographics
| Population Demographic | 2022
Academic Percentage |
2020
Academic Percentage |
2022
Municipal Percentage |
2020 Municipal Percentage | 2022
Aggregate Percentage |
2020
Aggregate Percentage |
|
| Museum type | |||||||
| Academic | 100% | 100% | 0% | 0% | 45% | 50% | |
| Municipal | 0% | 0% | 100% | 100% | 55% | 50% | |
| Source | |||||||
| AAMD | 38% | 47% | 100% | 100% | 72% | 73% | |
| AAM | 62% | 53% | 0% | 0% | 28% | 27% | |
| Staff size | |||||||
| 4-10 | 38% | 46% | 0% | 0% | 17% | 23% | |
| 11-25 | 29% | 27% | 7% | 13% | 17% | 20% | |
| 26-50 | 24% | 19% | 20% | 25% | 22% | 22% | |
| 51-100 | 3% | 4% | 31% | 28% | 19% | 16% | |
| 101+ | 6% | 4% | 41% | 34% | 26% | 19% | |
| Entrance fee | |||||||
| Yes, there is a set fee | 25% | 23% | 63% | 68% | 46% | 45% | |
| There is a suggested donation, but visitors can decide how much they would like to pay to enter | 7% | 15% | 4% | 4% | 6% | 9% | |
| No, there is no set fee or suggested donation. | 68% | 63% | 33% | 28% | 49% | 46% | |
| Years as director at current institution | |||||||
| Less than 5 years | 42% | 28% | 29% | 39% | 35% | 34% | |
| 5-10 years | 35% | 41% | 37% | 36% | 36% | 39% | |
| 11-15 years | 12% | 13% | 22% | 16% | 18% | 15% | |
| 16+ years | 11% | 17% | 11% | 8% | 11% | 13% | |
| Years working in museum sector | |||||||
| Less than 10 years | 5% | 0% | 5% | 5% | 5% | 3% | |
| 10-20 years | 32% | 31% | 22% | 22% | 27% | 26% | |
| 21-30 years | 37% | 41% | 36% | 38% | 36% | 40% | |
| 31-40 years | 22% | 21% | 28% | 31% | 25% | 26% | |
| 41+ years | 4% | 7% | 9% | 4% | 7% | 5% | |
| Highest degree earned | |||||||
| Bachelor’s degree (e.g. BA, BS) | 9% | 5% | 14% | 9% | 12% | 7% | |
| Master’s degree (e.g. MA, MS, Med, MSW, MBA) | 51% | 48% | 45% | 53% | 48% | 50% | |
| Professional degree beyond a bachelor’s degree (e.g. MD, DDS, DVM, LLB, JD) | 0% | 0% | 1% | 3% | 1% | 1% | |
| Doctorate degree (e.g. PhD, EdD) | 40% | 47% | 40% | 35% | 40% | 41% | |
| Position prior to current position | |||||||
| Director at another institution | 35% | 43% | 51% | 50% | 44% | 46% | |
| Chief curator (or equivalent) at a museum | 15% | 25% | 18% | 11% | 17% | 18% | |
| Deputy or assistant director | 20% | 13% | 12% | 21% | 16% | 17% | |
| Other | 30% | 19% | 18% | 17% | 23% | 18% | |
| Gender | |||||||
| Woman | 69% | 64% | 48% | 40% | 57% | 52% | |
| Man | 31% | 35% | 52% | 60% | 43% | 47% | |
| Another option not listed | 0% | 1% | 0% | 0% | 0% | 1% | |
| Transgender identity | |||||||
| Transgender | 0% | 0% | 0% | 0% | 0% | 0% | |
| Cisgender | 100% | 100% | 100% | 100% | 100% | 100% | |
| Race-ethnicity | |||||||
| American Indian or Alaska Native | 1% | 0% | 0% | 1% | <1% | <1% | |
| Asian or Asian American | 2% | 5% | 4% | 1% | 3% | 3% | |
| Black or African American | 4% | 0% | 1% | 1% | 2% | 1% | |
| Hispanic, Latino, Latina, Latinx | 6% | 5% | 7% | 10% | 7% | 8% | |
| Middle Eastern | 0% | 0% | 2% | 1% | 1% | <1% | |
| Native Hawaiian or Other Pacific Islander | 0% | 0% | 0% | 0% | 0% | 0% | |
| White | 85% | 87% | 81% | 83% | 83% | 84% | |
| Another option not listed | 2% | 3% | 5% | 3% | 4% | 3% | |
| Region | |||||||
| Midwest | 26% | 27% | 19% | 20% | 22% | 23% | |
| Northeast | 28% | 28% | 25% | 31% | 27% | 30% | |
| South | 30% | 29% | 37% | 32% | 34% | 31% | |
| West | 16% | 16% | 19% | 16% | 18% | 16% | |
Endnotes
- The survey population included museums across the United States that are part of the AAMD membership, as well as an additional set of academic museums who were members of AAM. Scoping criteria can be found in Appendix A. ↑
- Jeanna Smialek and Ben Casselman, “In an Unequal Economy, the Poor Face Inflation Now and Job Loss Later,” New York Times, 8 August 2022, https://www.nytimes.com/2022/08/08/business/economy/inflation-jobs-economy.html. ↑
- In this report and in the 2020 report, we use the term “municipal” to refer to all museums that are not academic museums, including government, private, and non-profit museums. ↑
- Liam Sweeney, Deirdre Harkins, and Joanna Dressel, “Art Museum Staff Demographic Survey 2022,” Ithaka S+R, Forthcoming. ↑
- Kara Newport, “Museums and the Living Wage: How Filoli Developed a Bold Pay Equity Initiative,” Center For The Future Of Museums Blog, 17 August, 2022, https://www.aam-us.org/2022/08/17/museums-and-the-living-wage-how-filoli-developed-a-bold-pay-equity-initiative/. ↑
- For a detailed look at the perspectives of Black Trustees, see Liam Sweeney, Deirdre Harkins, Celeste Watkins-Hayes, and Dominique Adams-Santos, “The BTA 2022 Art Museum Trustee Survey: The Characteristics, Roles and Experiences of Black Trustees,” Ithaka S+R, Forthcoming. ↑
-
Mariët Westermann, Liam Sweeney, and Roger C. Schonfeld, “Art Museum Staff Demographic Survey 2018,” Ithaka S+R, 28 January 2019. https://doi.org/10.18665/sr.310935.
- Liam Sweeney, “How Will Museums Live Up to their Solidarity Commitments?,” Ithaka S+R, 12 June 2020, https://sr.ithaka.org/blog/how-will-museums-live-up-to-their-solidarity-commitments/. ↑
- Liam Sweeney and Kurtis Tanaka, “Teaching with Cultural Heritage Materials During the Pandemic,” Ithaka S+R, 1 March 2022, https://sr.ithaka.org/publications/teaching-with-cultural-heritage-materials-during-the-pandemic/. ↑
- American Alliance of Museums, “National Snapshot Of COVID‐19 Impact On United States Museums (October 2020),” 17 November 2020, https://www.aam-us.org/2020/11/17/national-snapshot-of-covid-19/. ↑
-
In Figure 17, directors could also indicate that they planned to reduce employee positions in an area. This option is included in the percentage calculation but is omitted from the graph.
- Directors could also indicate that the activity was neither easy nor difficult. This option is included in the percentage calculation but is omitted from the graph. ↑
-
When completing the survey, participants could select any combination of eight race/ethnicity options. We count each time a race/ethnicity option was selected, meaning that respondents are counted more than once if they selected more than one option. The percentage calculation of 2020 data in this report is different from the 2020 report. In 2020, we divided the counts for each race/ethnicity by the total number of respondents who provided a response to the race/ethnicity question; percentages did not add up to 100. In this report, we divided the counts for each race/ethnicity by the total number of provided race/ethnicity responses; percentages do add up to 100.