Exploring Online Enrollment Trends in the Era of State Authorization Reciprocity
Executive summary
Online education has grown rapidly over the past decade. By 2020, one in four undergraduates were enrolled in exclusively online programs, double the number enrolled in 2012. The policy landscape concerning online education changed markedly with the establishment of the State Authorization Reciprocity Agreement (SARA) in 2014. This regulatory change made it easier for institutions to offer online programs to students who reside out of state while completing the program. As of the time of writing, all US states except California participate in SARA. While most of the increase in online enrollment between 2012 and 2020 has been driven by students enrolling in online programs offered by in-state institutions, there has also been a steady increase in out-of-state online enrollment.
The policy landscape concerning online education changed markedly with the establishment of the State Authorization Reciprocity Agreement (SARA) in 2014.
Using nationally representative survey data from the National Postsecondary Student Aid Study (NPSAS), this report documents who is enrolling in different program modalities, and how those enrollment patterns shifted both before and after SARA. We focus on online programs that enroll students residing out-of-state, some of which began enrolling across state lines prior to SARA and others after its implementation. Several findings stand out:
- Growth in online programs. Among students in the nationally representative NPSAS sample, exclusively online enrollment doubled while overall undergraduate enrollment declined.
- Institutional shifts. Out-of-state online program enrollment was once dominated by for-profit institutions (70 percent of enrollment in 2012) but now a growing number of students are enrolling in programs provided by private not-for-profits and public universities (23 percent in 2012 to 52 percent in 2020).
- Student demographics. Out-of-state online students in the sample skew older and are more likely to be women and Black. These students also receive Pell Grants at a higher rate. Hispanic and Asian students are underrepresented among out-of-state online students, potentially due to California’s non-participation in SARA.
- Fields of study. Business and management are the most common fields of study for sampled students in out-of-state online programs, but they have become less popular relative to other fields over time.
While the results are suggestive, they imply that SARA may have played a role in weakening the for-profit sector’s dominance of out-of-state online enrollment, while increasing the mix of fields of study that out-of-state online students pursue.
Introduction
An increasing share of postsecondary students are opting into online education. In 2012, fewer than 10 percent of undergraduates were enrolled in exclusively online programs. By 2020, that share had more than doubled to 24 percent.[1] Students who enroll in online programs tend to be older, are more likely to have children, and often work more hours than students who only take courses on campus.[2] Exclusively online programs can provide students with the flexibility they need to pursue their degrees.
While this flexibility can reduce barriers related to geography, work, and caregiving, some evidence suggests that online education can sometimes lead to worse academic outcomes. For example, some quasi-experimental studies have found that degree completion rates can be lower for students who enroll in exclusively online programs relative to comparable students who take at least some in-person classes.[3] However, online programs may still increase overall educational attainment by serving students who might not have otherwise pursued a college degree.[4]
Concerns about the effectiveness and quality of online programs highlight the importance of regulation and oversight in the online education market. The regulatory landscape for postsecondary education consists of three components: the federal Department of Education, accreditation agencies recognized by the federal government, and state regulatory bodies that authorize institutions to operate. Here, we focus on the role of state governments in regulation. Prior to 2014, institutions that wished to enroll out-of-state students in online programs were required to secure individual authorization from each state in which those students resided. The wide array of state-specific policies, processes, and fees posed a barrier to the growth of online programs, ultimately stymying access to online higher education. In response to this state regulatory context, higher education leaders established the State Authorization Reciprocity Agreement (SARA).
SARA is a multistate initiative that aims to expand access to online learning opportunities by streamlining the process by which institutions are authorized to enroll out-of-state students in online programs and creating a more consistent regulatory environment for students and institutions. Once a state joins SARA, all approved institutions within that state are automatically authorized to enroll students from other SARA member states. As of 2025, all US states and the District of Columbia, with the exception of California, have joined SARA.[5] The implementation of SARA is coordinated by the National Council for State Authorization Reciprocity Agreements (NC-SARA), a private nonprofit organization.
Prior work by Ithaka S+R found that the introduction of SARA expanded online enrollment, especially among institutions that were early adopters.[6] However, less is known about how SARA has influenced the composition of enrollment, particularly for students enrolled in out-of-state, exclusively online programs, the type of program most likely influenced by SARA’s implementation. This report examines how enrollment composition across various program modalities has changed in the years immediately before and after SARA was established.
Understanding these changes is critical for several reasons. If certain types of students are more likely to enroll in online programs, the expansion of online education through SARA may unintentionally exacerbate inequities in academic outcomes, to the extent that academic performance is lower in online programs compared to in-person ones. It is also important to understand how educational pathways differ across modalities. For example, knowing whether online students tend to enroll in particular fields of study can help institutions make strategic decisions about how and where to invest in online offerings. Additionally, understanding the makeup of those who enroll in out-of-state online programs can help states and institutions position themselves to attract students from across the country.
The findings from this report will also inform the second phase of this research project: an experimental design that explores how labor market outcomes vary based on the type of institution and program that awarded the applicant’s credential, including out-of-state online programs, given NC-SARA’s goal to increase enrollment in this category. This report and the second phase of the project are supported by the Joyce Foundation and Strada Education Foundation.
Data and methodology
This analysis draws on publicly available data from the National Postsecondary Student Aid Study (NPSAS) for the years 2012, 2016, and 2020. Fielded by the National Center on Education Statistics (NCES), NPSAS is a nationally representative survey of undergraduate and graduate students enrolled in Title IV-eligible postsecondary institutions in the United States. The survey collects detailed information on student demographics, financial aid, and institutional characteristics. NPSAS is well suited for studying national trends in student enrollment by program modality because it includes variables on whether a student is enrolled in an exclusively online program and whether their institution is located in or out of state. These features allow us to distinguish between students enrolled in exclusively online programs versus those enrolled in at least some in-person coursework, and between those enrolled in an in-state versus out-of-state institution. Because students’ state of legal residence is unavailable for international students, they are excluded from the analysis. We further restrict the sample to undergraduate students, including those enrolled part-time and those in non-degree programs.
We accessed NPSAS data through PowerStats, a NCES web-based data analysis tool that allows users to interactively generate custom tabulations, statistics, and regression models using NCES’ underlying, restricted-use survey data. We pulled weighted sample counts for students in our three program modalities, out-of-state online, in-state online, and hybrid/in-person, as well as weighted counts for various subgroups within each modality, such as demographic groups and fields of study. From these counts, we computed the share of weighted student counts that belonged to each subgroup for each modality type.
To better understand whether SARA has influenced who enrolls in online programs, we examine changes in enrollment composition before and after the policy was introduced, and compare out-of-state online students, the group most directly affected by SARA, to in-state online students. Because students who choose to study online differ in important ways from those who pursue in-person programs, comparing out-of-state online learners to in-state online learners can provide a useful reference point.
To better understand whether SARA has influenced who enrolls in online programs, we examine changes in enrollment composition before and after the policy was introduced, and compare out-of-state online students, the group most directly affected by SARA, to in-state online students.
It is important to note the limitations of this approach. First, our analysis relies on aggregate data rather than student-by-institution level records. Because SARA participation is an institution-level decision, an ideal analysis would include comparing changes in enrollment composition at participating institutions to enrollment changes at non-participating institutions. Unfortunately, the data available through PowerStats do not allow for this type of comparison. We initially sought access to restricted-use, student-level NPSAS data that would have enabled more precise analyses, but our data request was paused due to changes in staffing and contract cancellations in IES.
Second, while in-state online learners provide a useful benchmark for understanding out-of-state enrollment patterns, they are not a perfect reference group. SARA could plausibly influence not just out-of-state online enrollment, but also in-state enrollment, such as by shifting some students from one category to the other, or by increasing institutions’ overall online program capacity. Consequently, this analysis can not completely disentangle the impact of SARA from other factors that may have influenced out-of-state online enrollment between 2012 and 2020.
Although these findings are descriptive rather than causal, presenting suggestive evidence for SARA’s impact is valuable for identifying where policy effects are most likely to emerge and for framing questions that future research can test more rigorously.
Findings
In this section, we highlight enrollment trends in exclusively online programs from 2012 to 2020, with specific focus on out-of-state enrollees given the influence of SARA.
Enrollment in exclusively online programs roughly doubled from 2012 to 2020. As total enrollment doubled, so too did the share of undergraduates enrolled in out-of-state online programs.
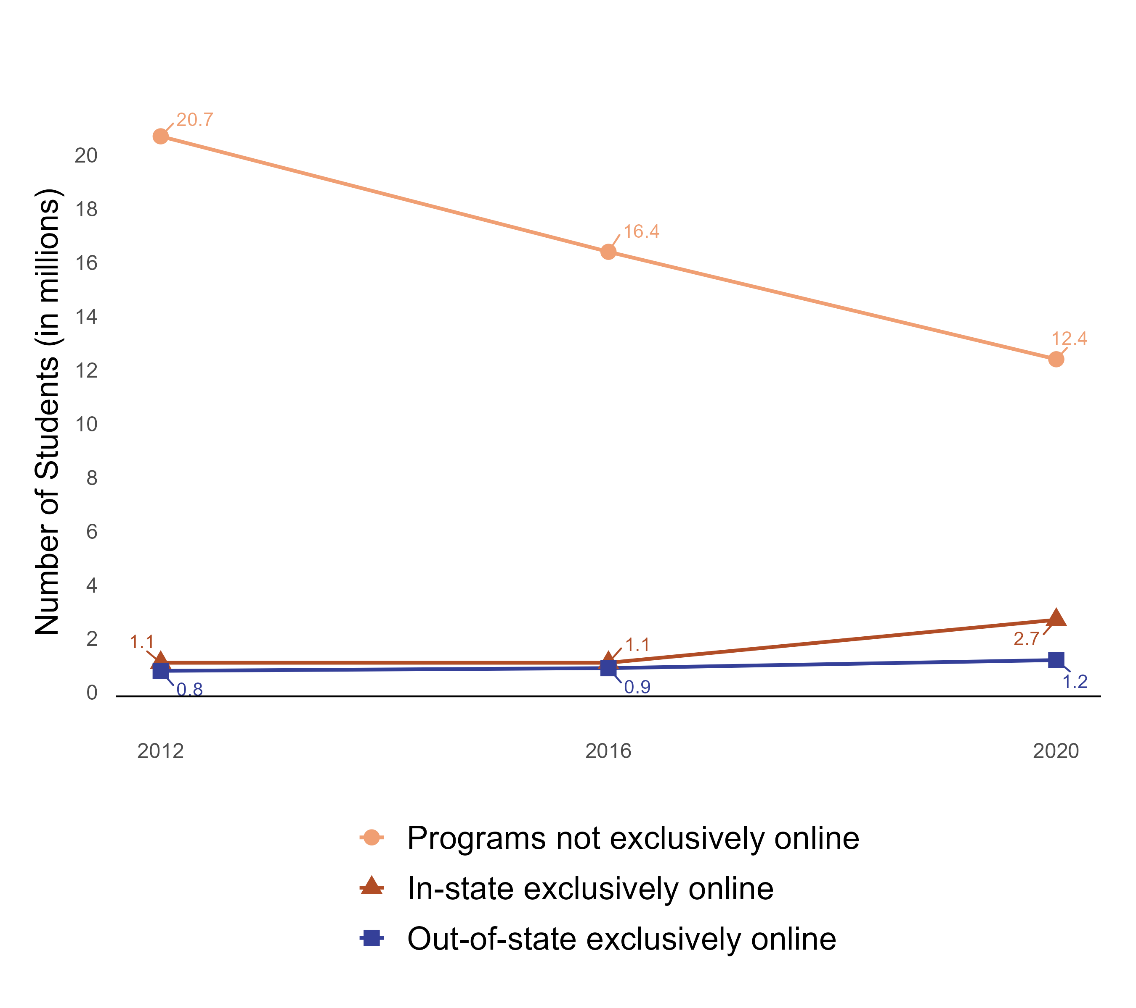
Figure 1 displays trends in the number of students enrolled by program modality from 2012 to 2020. Overall enrollment declined steadily over the period, from 22.6 million students in 2012 to 16.3 million in 2020. However, the number of students enrolled in exclusively online programs roughly doubled during this timeframe, from 1.9 million in 2012 to 3.9 million in 2020. Between 2012 and 2016, enrollment ticked upward for out-of-state online programs while holding steady for in-state online programs. Online enrollment grew most rapidly between 2016 and 2020. While the 2020 NPSAS survey was fielded in March 2020, it covers the entire 2019-20 academic year, so the jump in online enrollment between 2016 and 2020 is not necessarily driven entirely by the onset of the COVID-19 pandemic. The first 18 states joined SARA in 2014, one year before the 2015-16 academic year captured in the 2016 NPSAS wave.[7] The fact that online enrollment growth was concentrated between 2016 and 2020, when additional states joined the agreement and early adopters had more time to adjust, is consistent with the timing of SARA’s expansion.
At the same time, 84 percent of students who took the 2020 NPSAS survey reported that some or all of their classes had moved fully online due to the pandemic.[8] This raises the possibility that some respondents may have mistakenly identified their programs as exclusively online because of temporary disruptions. However, more recent data suggest that this reporting error is unlikely to account for the full increase in online enrollment observed in 2019-20. According to our calculations using 2023-24 data from the Integrated Postsecondary Education Data System (IPEDS), 27 percent of undergraduate students were enrolled in exclusively online programs during the 2023-24 academic year, indicating that elevated levels of online enrollment have persisted well beyond the height of the pandemic. Taken together, these patterns suggest that the rise in online enrollment captured in the 2020 NPSAS data reflects a broader, sustained shift toward online education.
Taken together, these patterns suggest that the rise in online enrollment captured in the 2020 NPSAS data reflects a broader, sustained shift toward online education.
We also use institution-level data from IPEDS to supplement our analysis of national trends in out-of-state online enrollment. IPEDS figures show substantial increases in online enrollment between fall 2012 and fall 2019, a period preceding the onset of the COVID-19 pandemic. During this time, approximately 1,200 institutions expanded their out-of-state online enrollment, with the average institution among these adding about 260 students. The institutions with the largest increases were Southern New Hampshire University (+76,563 students), Western Governors University (+63,244), and Colorado Technical University-Colorado Springs (+20,814). Twenty-seven other institutions added at least 1,000 out-of-state online students.
Figure 1: Total Enrollment by Program Type Over Time
The share of students in exclusively online programs grew significantly, from 11 to 25 percent, with that growth concentrated between 2016 and 2020 (Figure 2). While most of the growth in online enrollment was from students enrolling in in-state institutions, the share of students enrolled in out-of-state online programs doubled between 2012 and 2020.
The share of students enrolled in out-of-state online programs doubled between 2012 and 2020.
Figure 2: Enrollment Composition by Program Type Over Time 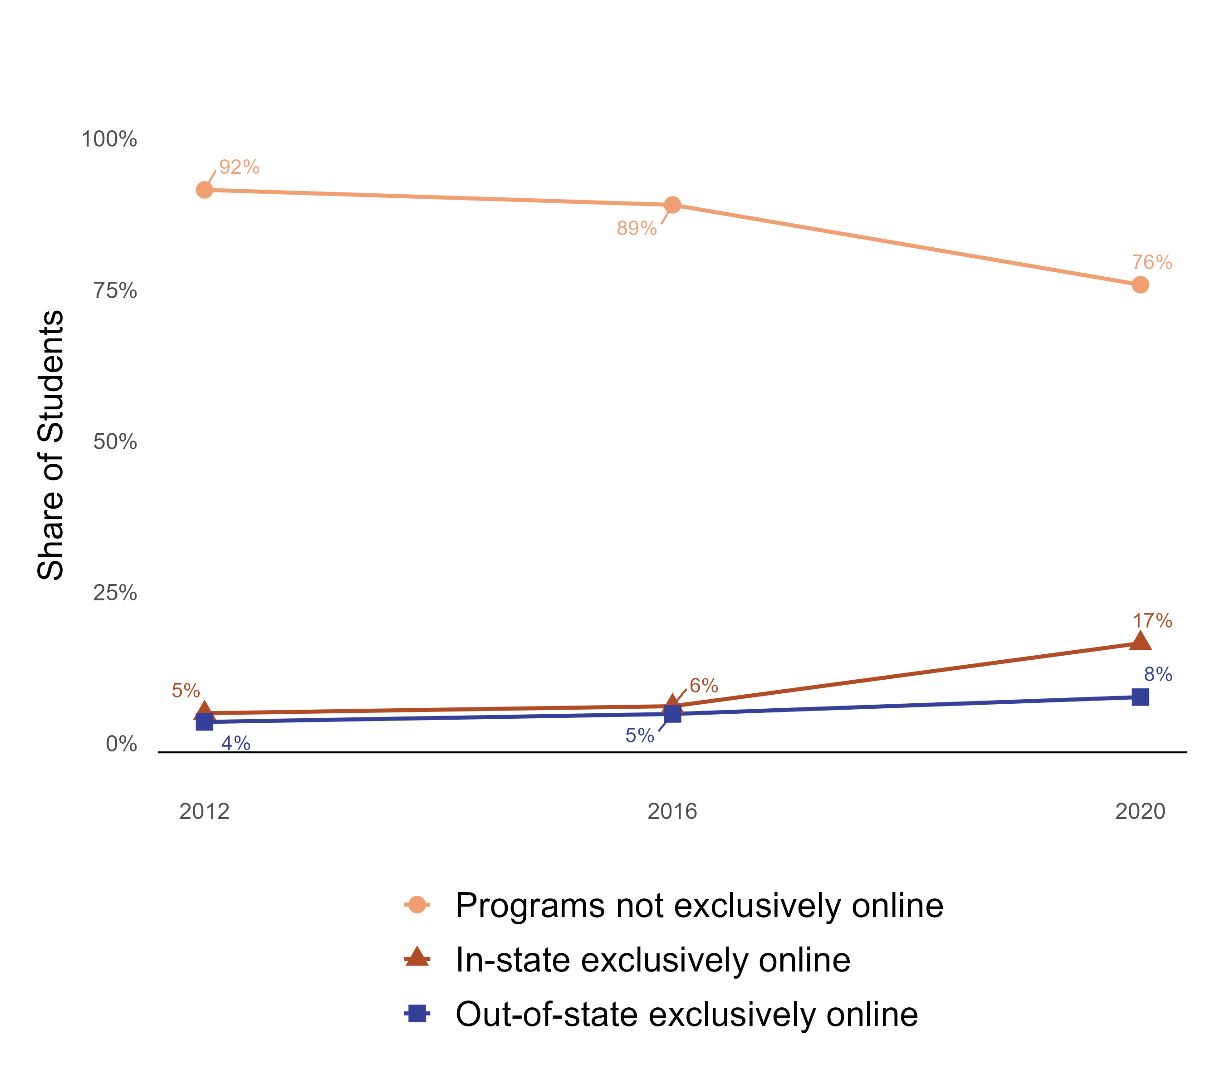
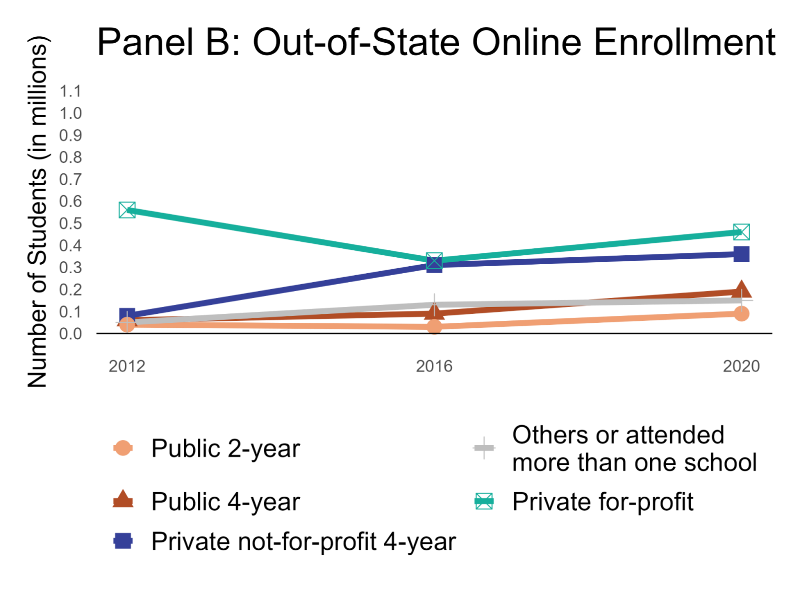
Out-of-state online learners were nine times more likely to enroll in private for-profit institutions than their peers, although the for-profit share has declined significantly over time.
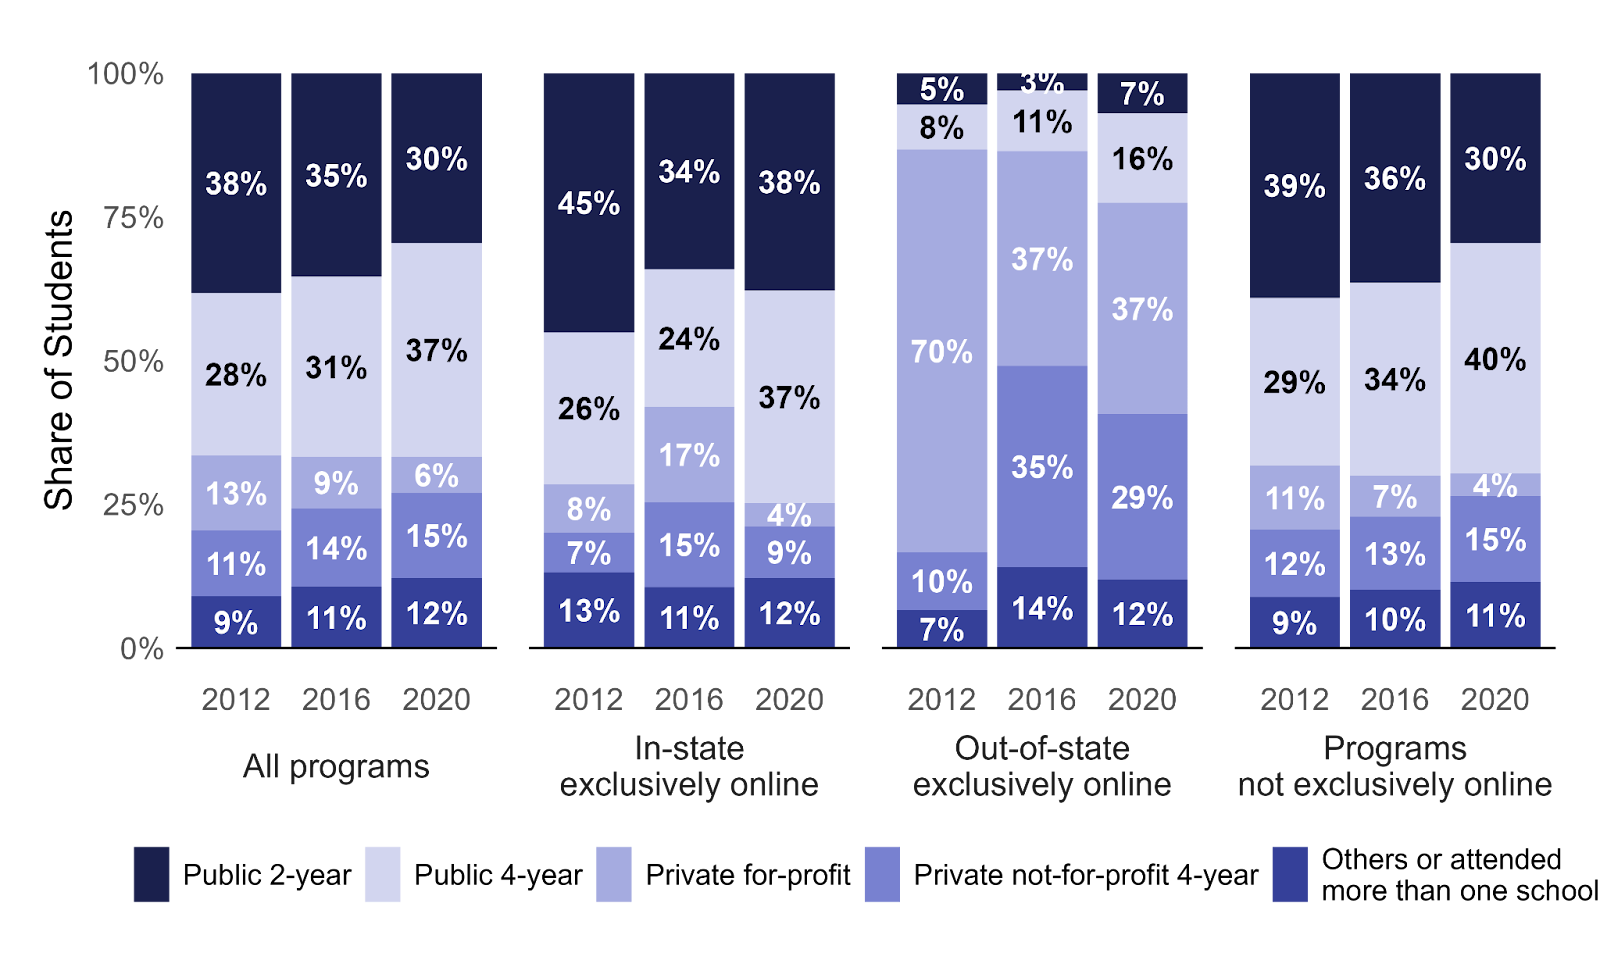
To assess where NC‑SARA may have influenced enrollment composition in out-of-state online programs, we first examine shifts in sector. Before SARA, out-of-state online enrollment was heavily concentrated in the for‑profit sector: in 2012, roughly 70 percent of out-of-state online students were enrolled at for‑profit institutions (Figure 3). Comparatively, the for-profit share of the in-state online market was 8 percent in 2012.
Between 2012 and 2016, as SARA began to expand and out-of-state online enrollment grew by roughly 100,000 students, the market underwent substantial reorganization. The for-profit share of out-of-state online enrollment dropped from 70 percent to 37 percent, while private not-for-profit and to a lesser extent, public four-year institutions gained a larger portion of the market. Over the same period, the in-state online market moved in the opposite direction, with the for-profit share rising to 17 percent by 2016. These patterns suggest that the decline in for-profit dominance of the out-of-state online market was not completely driven by a broader trend in online education. The data point to a redistribution of who serves out-of-state online students, consistent with SARA lowering cross-state recruitment barriers for public and not-for-profit providers and enabling them to capture market share from the for-profit sector.
As previously discussed, the most prominent private not-for-profit institutions are Southern New Hampshire University (SNHU) and Western Governors University (WGU). Based on IPEDS data, in fall 2012 SNHU accounted for 1 percent and WGU 6 percent of the out-of-state online market. By fall 2023, those shares had grown to 14 percent and 12 percent, respectively.
Figure 3: Institution Sector by Program Type Over Time (Enrollment Share)
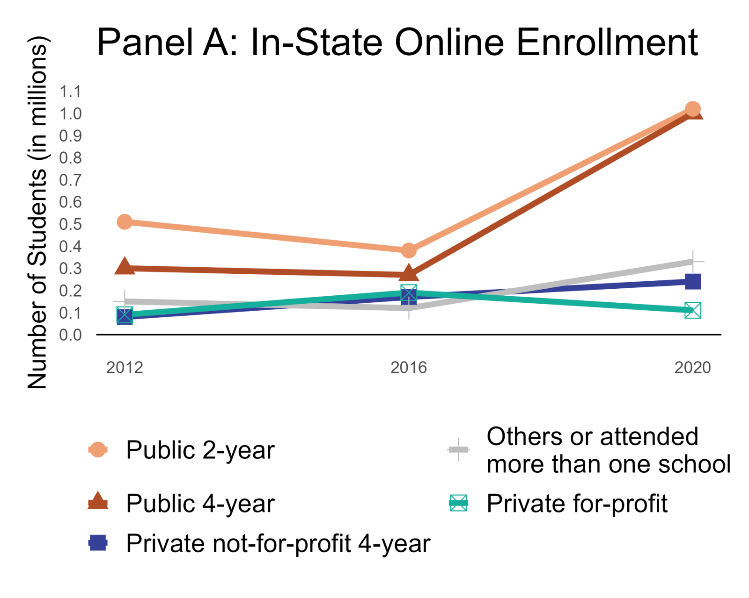
Examining total enrollment rather than enrollment shares confirms that these compositional changes were driven in part by absolute declines in for-profit participation, not just faster growth in other sectors (Figure 4). For-profit out-of-state online enrollment fell from about 550,000 students in 2012 to 330,000 in 2016, while private not-for-profit enrollment rose from roughly 80,000 to 310,000, offsetting the for-profit decline and signaling a major reshuffling of the market.
Figure 4: Institution Sector by Program Type Over Time (Total Enrollment)
Interestingly, between 2016 and 2020, for-profit out-of-state online enrollment rebounded to approximately 460,000 students. If SARA played a role in the reorganization of the out-of-state online market, we would expect its impact to continue in the same direction rather than reverse. The drop in for-profit enrollment between 2012 and 2016 and the subsequent rebound from 2016 to 2020 suggest that additional factors were influencing the sector composition of out-of-state online enrollment.
One potential factor is federal oversight of the for-profit sector, which was intense during this period. For example, Corinthian Colleges, one of the largest for-profit chains, closed all campuses in early 2015 following multiple regulatory actions, including a $30 million fine for misrepresenting job placement rates.[9] Interestingly, while out-of-state for-profit enrollment declined sharply, for-profit enrollment in in-state online programs increased between 2012 and 2016. An explanation that could reconcile these differing trends is that federal scrutiny may have disproportionately affected large, national for-profit institutions that were more active in out-of-state markets, rather than smaller or more regionally focused providers.
While these findings are suggestive rather than definitive, they point to the possibility that SARA reshaped the composition of the out-of-state online market by facilitating growth among private not-for-profit institutions and intensifying competition for for-profit providers. This could be a positive development, as prior research indicates that students attending for-profit colleges tend to experience weaker employment and earnings outcomes, particularly at for-profits operating primarily online.[10]
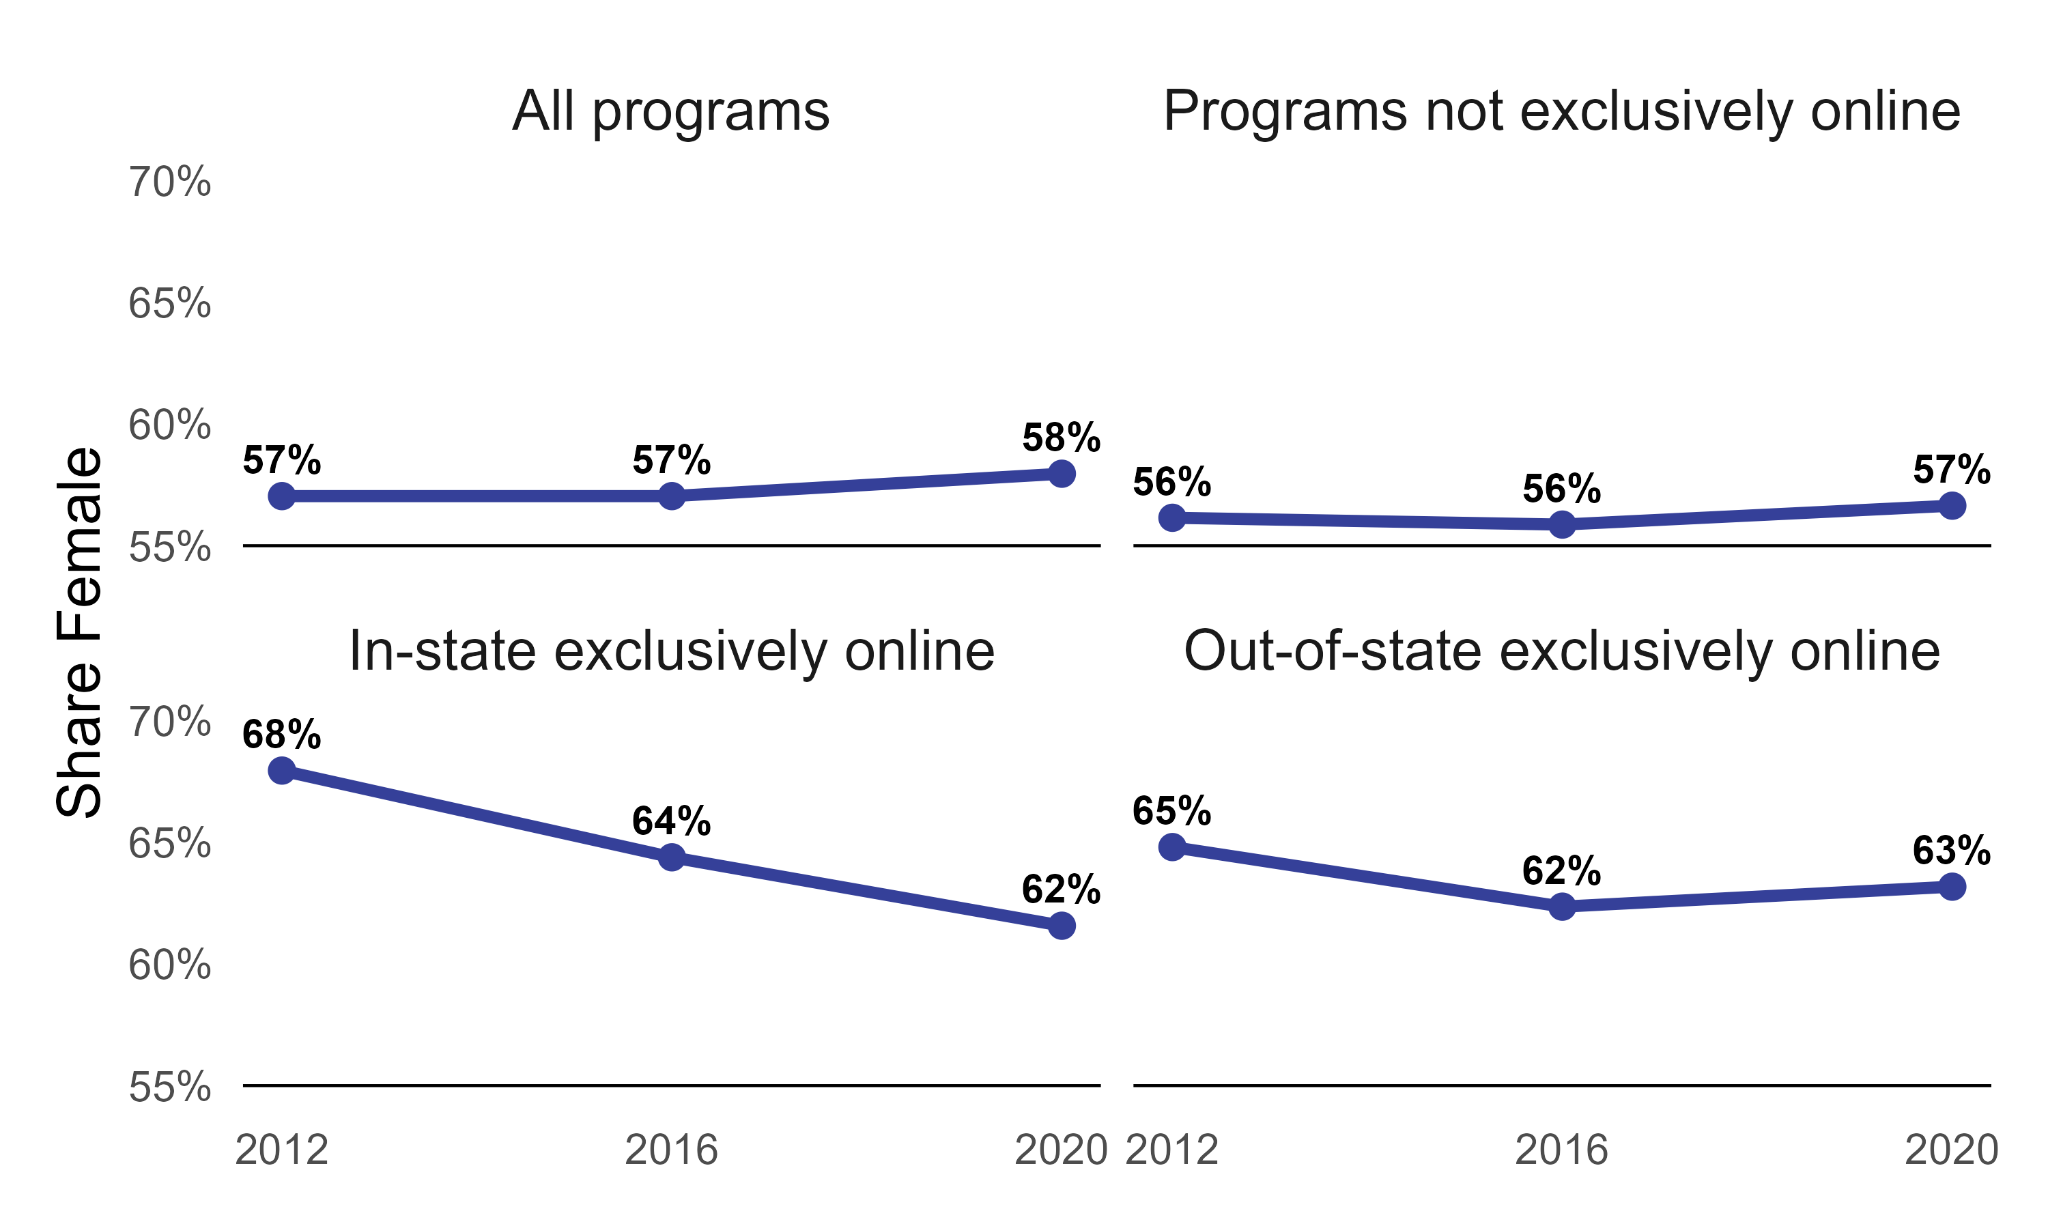
Women are overrepresented in online programs generally, though there is not a significant difference in the gender gap between out-of-state and in-state online cohorts.
Before SARA, women made up a clear majority of students enrolled exclusively in online programs. In 2012, women accounted for 68 percent of in-state online students and 65 percent of out-of-state online students, both well above women’s share of overall undergraduate enrollment (Figure 5). Women are disproportionately likely to serve as primary caregivers in their households, and the ability to access education asynchronously or without commuting can reduce some of the barriers to enrollment. Indeed, according to a survey of online learners, women were almost twice as likely to cite family obligations as a driver of the choice to study online.[11]
After SARA’s implementation, the share of women in out-of-state online programs declined slightly. However, a similar, and somewhat larger, decline occurred among in-state online students, while the share of women in programs not offered exclusively online ticked upward. These patterns suggest that the changes in women’s representation among out-of-state online students may reflect broader shifts in online education rather than a direct effect of SARA alone.
Considering enrollment counts rather than shares reinforces this interpretation. The number of both men and women in online programs increased during this period, but men’s enrollment grew more rapidly, resulting in a modest decline in women’s overall share. Taken together, these trends make it difficult to attribute any change in the gender composition of the out-of-state online market directly to SARA.
Figure 5: Share Female by Program Type Over Time
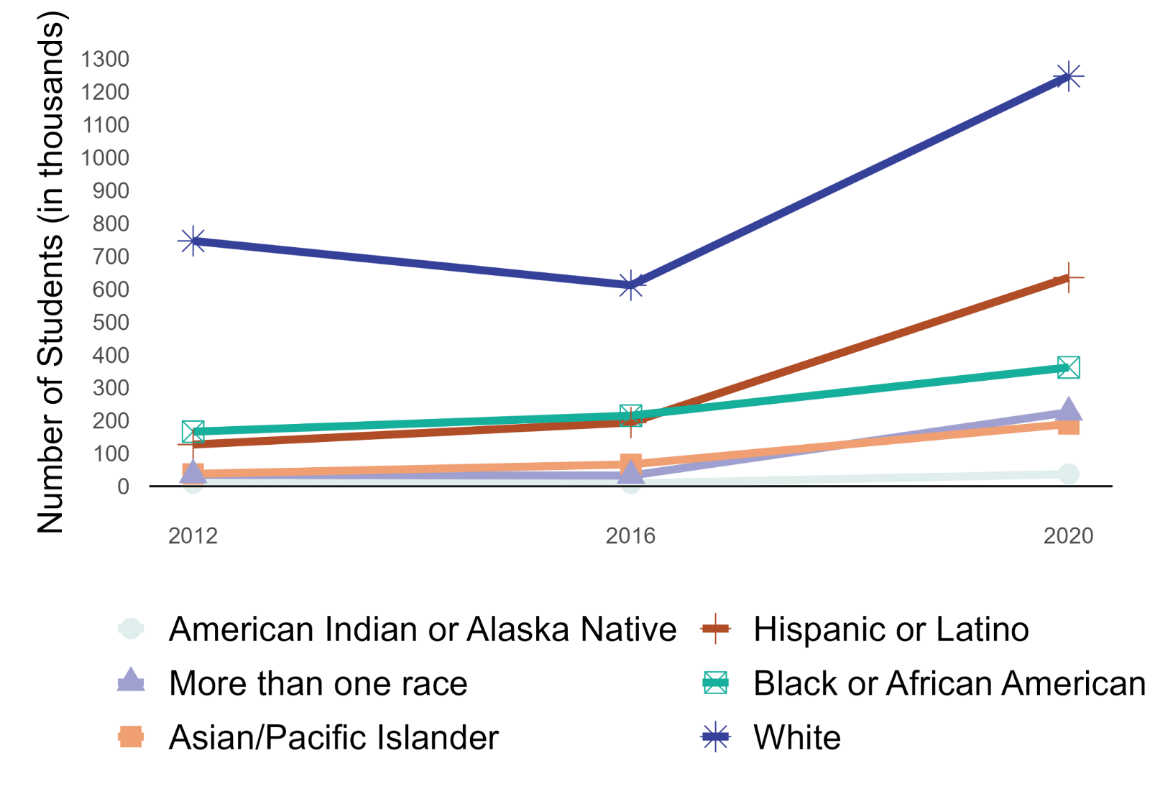
Out-of-state online enrollees are disproportionately Black, while Hispanic and Asian students are underrepresented.
In 2012, out-of-state online enrollment had a higher share of Black or African American students (29 percent) compared to 16 percent of the overall undergraduate population (Figure 6). One potential explanation for the overrepresentation of Black students in out-of-state online enrollment is the role of for-profit institutions. As previously noted, for-profit institutions accounted for a disproportionately large share of the out-of-state online market compared to their presence in the broader undergraduate sector between 2012 and 2020. Research suggests that for-profit institutions have historically targeted underrepresented students, particularly Black students, through concentrated marketing efforts and recruitment strategies.[12] White students made up a majority of out-of-state online enrollment in 2012 (57 percent), roughly mirroring their share across all programs (59 percent). Notably, in-state online enrollment was 66 percent White in 2012.
The racial and ethnic composition of out-of-state online enrollment shifted between 2012 and 2020. The share of Black students declined by 10 percentage points, White students’ share decreased slightly, and the representation of Hispanic, Asian/Pacific Islander, and students identifying as more than one race increased. However, relatively similar patterns appeared in in-state online enrollment, though with a larger decline in the White share, a more pronounced increase in Hispanic student share, and a rise but ultimate fall in Black representation. As a result of these changes, by 2020 the racial and ethnic composition of in-state online enrollment more closely mirrored that of the overall undergraduate population. In contrast, out-of-state online programs continued to show underrepresentation of Hispanic and Asian/Pacific Islander students and overrepresentation of Black and White students.
By 2020 the racial and ethnic composition of in-state online enrollment more closely mirrored that of the overall undergraduate population.
Figure 6: Racial/Ethnic Composition by Program Type Over Time (Enrollment Shares)
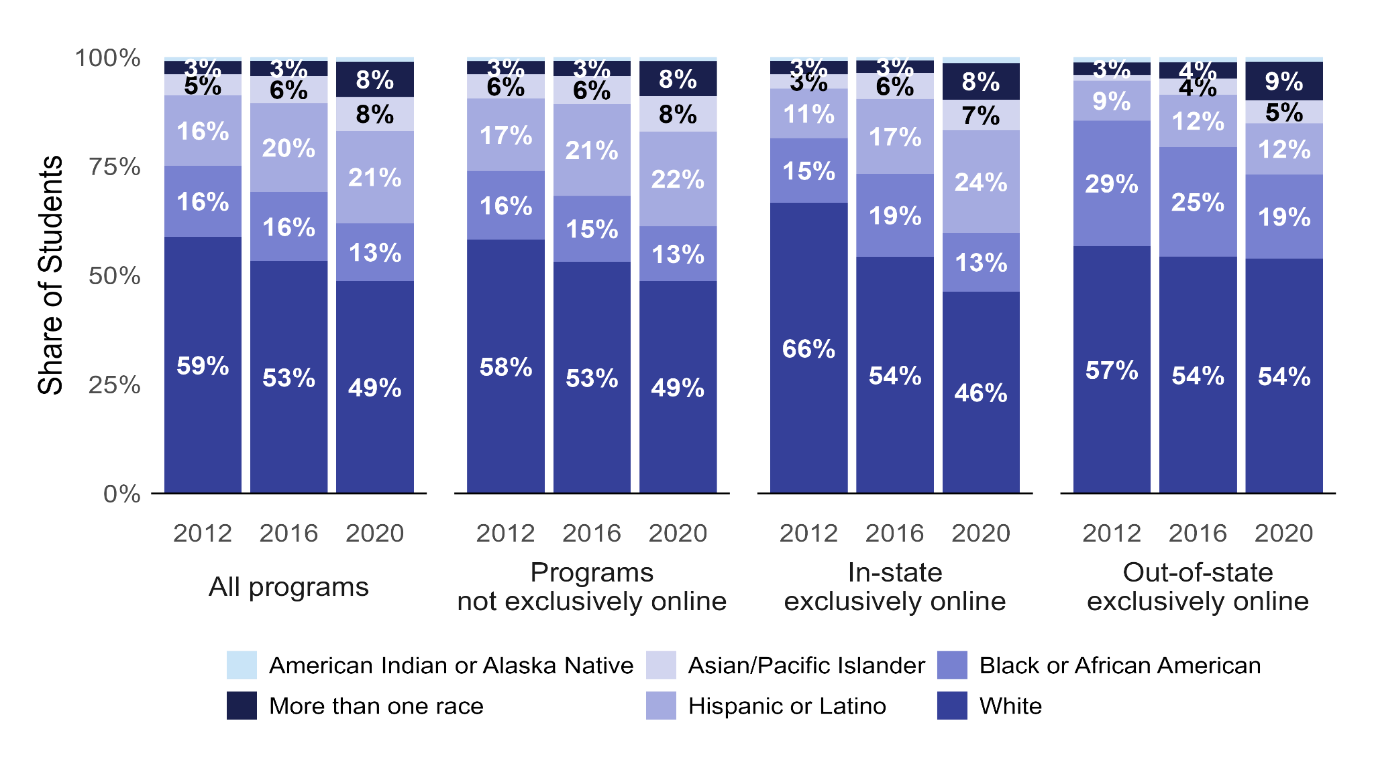 Figure note: The enrollment share of American Indian or Alaska Native students is one percent across all years and program modalities.
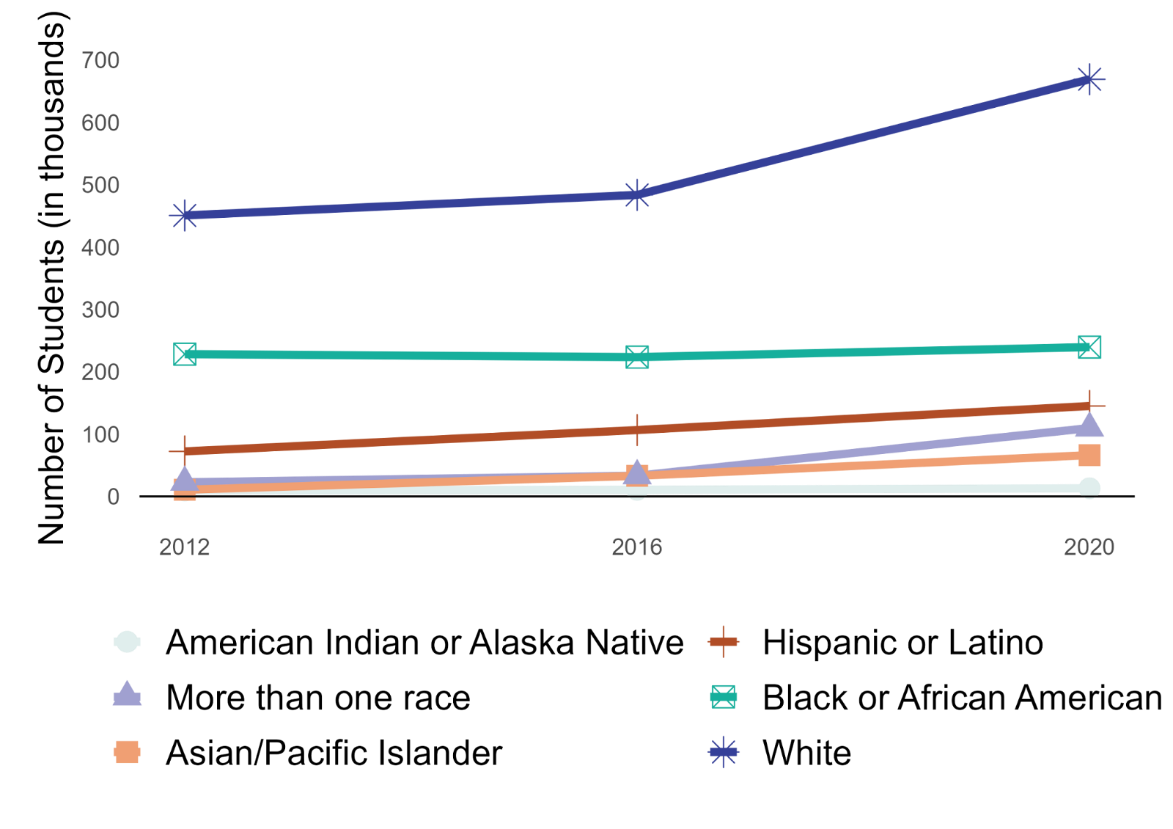
Interesting patterns emerge when looking at trends in total enrollment (Figure 7). While the share of out-of-state online students who were Black or African American declined from 29 percent to 19 percent between 2012 and 2020, the absolute number of Black students remained relatively steady, between roughly 220,000 and 240,000. The decline in share reflects steady increases in the number of Hispanic and Asian/Pacific Islander students and a sharp rise in the number of White students and students identifying as more than one race between 2016 and 2020.
Figure 7: Racial/Ethnic Composition by Program Type Over Time (Out-of-State Online, Total Enrollment)
Enrollment trends for in-state online students were broadly similar, with one notable difference: Hispanic student enrollment grew much more sharply between 2016 and 2020 in contrast to the more gradual increase in out-of-state online programs (Figure 8). This divergence, along with the continuing underrepresentation of Asian/Pacific Islander students in out-of-state online programs, may reflect the geographic concentration of these populations, particularly in California. Our analysis of 2020 NPSAS data shows that 27 percent of all Hispanic undergraduates and 31 percent of all Asian undergraduates lived in California in 2020. As of 2025, California remains the only state not participating in SARA, which limits students residing there from enrolling in online programs offered by out-of-state institutions covered under the agreement.
Figure 8: Racial/Ethnic Composition by Program Type Over Time (In-State Online, Total Enrollment)
Moreover, California’s extensive network of in-state public institutions that are part of the University of California (UC) system, the California State University System (CSU), and California Community Colleges (CCC), including many with online offerings, may further reduce the demand for out-of-state online programs among students in the state. The sharp increase in Hispanic enrollment in in-state online programs mirrors the rise in the number of students enrolling in in-state online programs offered by public four-year and two-year institutions between 2016 and 2020, suggesting that many of these students entered the online market through in-state public institutions rather than through out-of-state providers.
These patterns suggest that the lack of California participation in SARA may have led to slower growth in out-of-state online enrollment of Hispanic and Asian/Pacific Islander students.
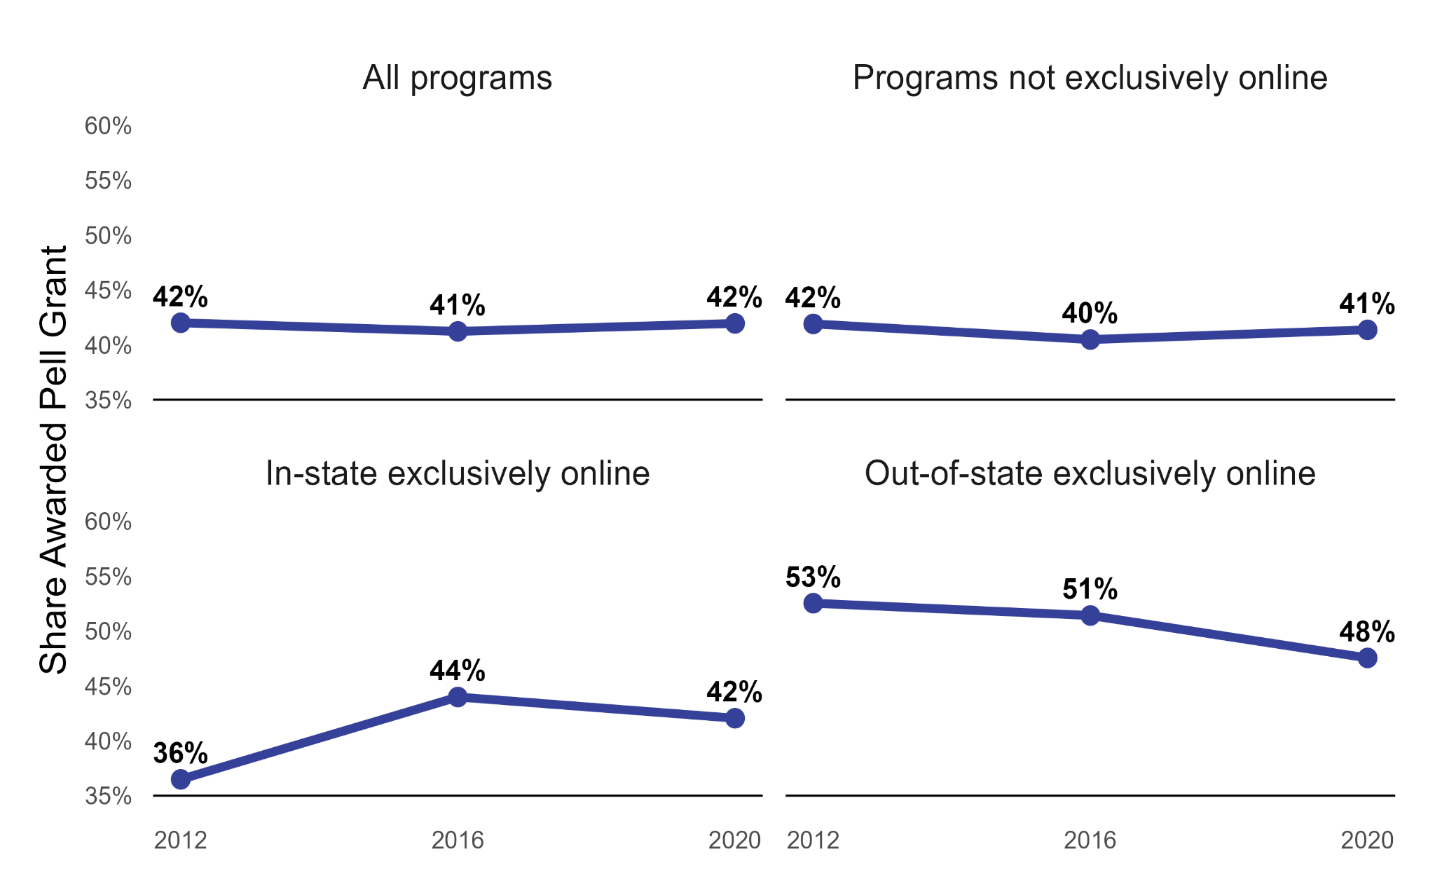
Out-of-state online learners are more likely to receive Pell Grants than their peers, but their Pell share has declined over time.
As shown in Figure 9, Pell Grant receipt in 2012 was notably higher among students in out-of-state online programs (53 percent) than among those in in-state online programs (36 percent). Following the launch and expansion of SARA, Pell receipt among out-of-state online students declined gradually, reaching 48 percent by 2020. In contrast, in-state online programs showed a steady rise, with Pell receipt increasing from 36 percent to roughly 42-44 percent over the same period.
For out-of-state online students, both Pell recipients and nonrecipients increased in number between 2012 and 2020, but enrollment grew faster among nonrecipients, leading to the gradual decline in Pell receipt share.
Figure 9: Pell Grant Share by Program Type Over Time (Enrollment Shares)
In-state online programs followed a different pattern. Between 2012 and 2016, the number of Pell recipients rose as the number of nonrecipients fell. From 2016 to 2020, both groups expanded, but enrollment among nonrecipients grew slightly faster. If in-state enrollment reflects what would have happened in the out-of-state market without SARA, these results suggest that SARA may have accelerated growth among non-Pell students in out-of-state online programs. This may point to new online offerings that appeal to students from higher socioeconomic backgrounds.
An alternative explanation could be the declining role of the for-profit sector. Pell Grant receipt is most common among students enrolled in for-profit institutions, with the Pell enrollment share ranging from 50 percent to 60 percent between 2012 and 2020.[13] The gradual decline in Pell receipt in the out-of-state online sector may partly reflect lower enrollment of students who are particularly likely to be Pell recipients. Consequently, while SARA may have played a role in the downward trend of Pell receipt share among out-of-state online students, it is difficult to disentangle it from other factors that may have been in play.
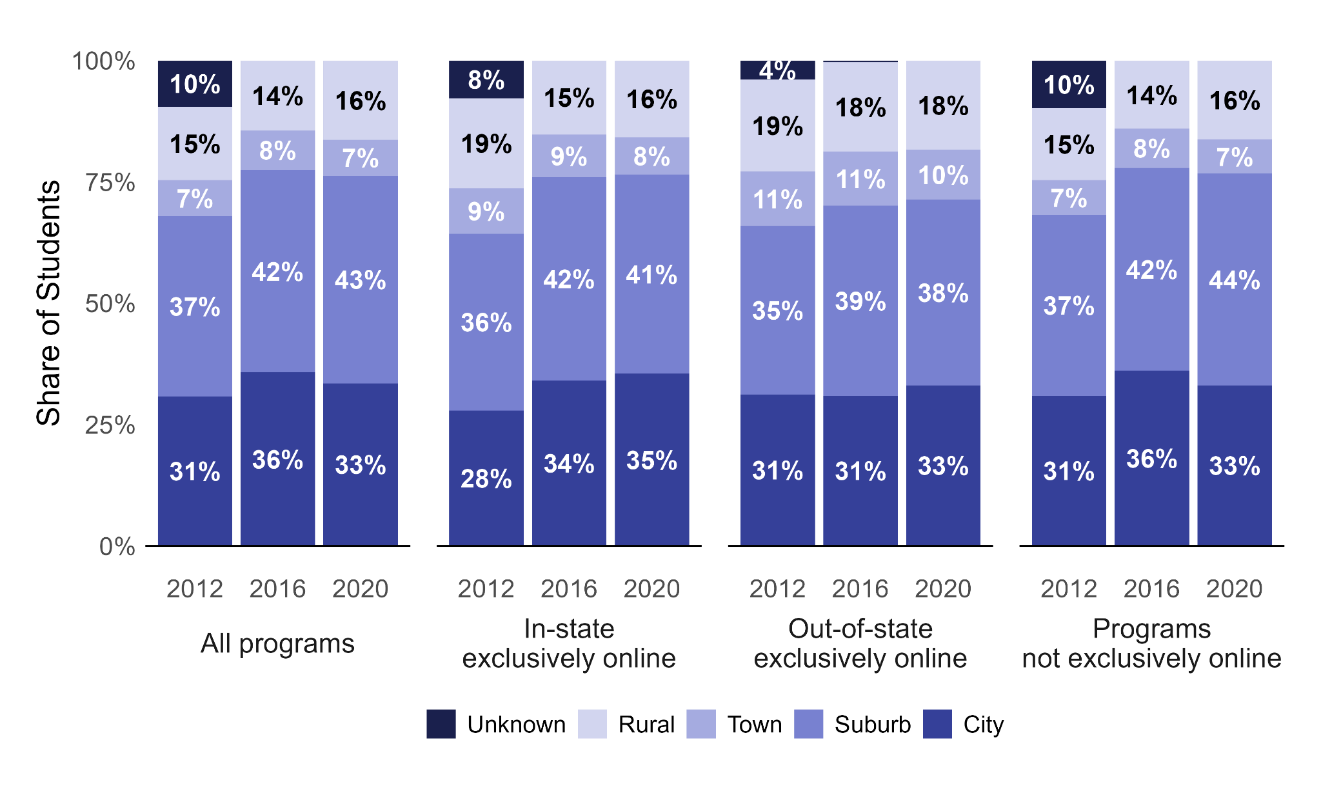
Rural students are not more likely to enroll in online programs than non-rural students.
Figure 10 analyzes students’ residential urbanicity. Because urbanicity data were missing for a substantial share of students in 2012, 2016 provides a more reliable baseline. By 2016, 17 states had yet to join SARA, so comparing trends between 2016 and 2020 still offers an opportunity to observe any potential effects of the expansion of SARA on the urbanicity of the out-of-state online market.
In 2016, 39 percent of out-of-state online students lived in suburban areas, 21 percent in cities, and 18 percent in rural areas. In-state online programs were slightly less rural at 15 percent, similar to the 14 percent rural share among all undergraduates. Thus, out-of-state online programs enrolled a somewhat higher proportion of rural students than other program types in 2016.
By 2020, the rural share of out-of-state online enrollment remained at 18 percent, suggesting that rural and non-rural participation grew at similar rates. The rural share in in-state online programs increased slightly to 16 percent, mirroring the pattern across all undergraduate programs. Overall, rural students were not much more likely to be enrolled in an exclusively online program compared to students in other program types.
On one hand, rural students may have greater geographic motivations to enroll online relative to their urban peers, as they tend to have fewer nearby colleges.[14] On the other hand, they face greater barriers to pursuing online education given the digital divide. In 2021, 72 percent of rural adults had home broadband compared to 77 percent of urban adults and 79 percent of those in suburban areas. Rural adults also lag in computer ownership; 72 percent owned a desktop or laptop in 2021, compared to 78 and 80 percent of urban and suburban adults, respectively.[15]
Figure 10: Urbanicity of Student Residence by Program Type Over Time (Enrollment Shares)
While the rural share of online enrollment was relatively stable between 2016 and 2020, these proportional measures obscure important differences in population trends. Throughout the 2010s, nonmetropolitan counties experienced population decline, particularly among young adults, while metropolitan populations continued to grow.[16] Despite this demographic contraction, overall undergraduate enrollment among rural students held steady between 2016 and 2020, implying an increase in participation rates. This enrollment stability also reflects a modal shift: declines in in-person and hybrid enrollment were offset by increases in exclusively online programs. These patterns suggest a growing importance of online education in sustaining higher education participation among rural populations.
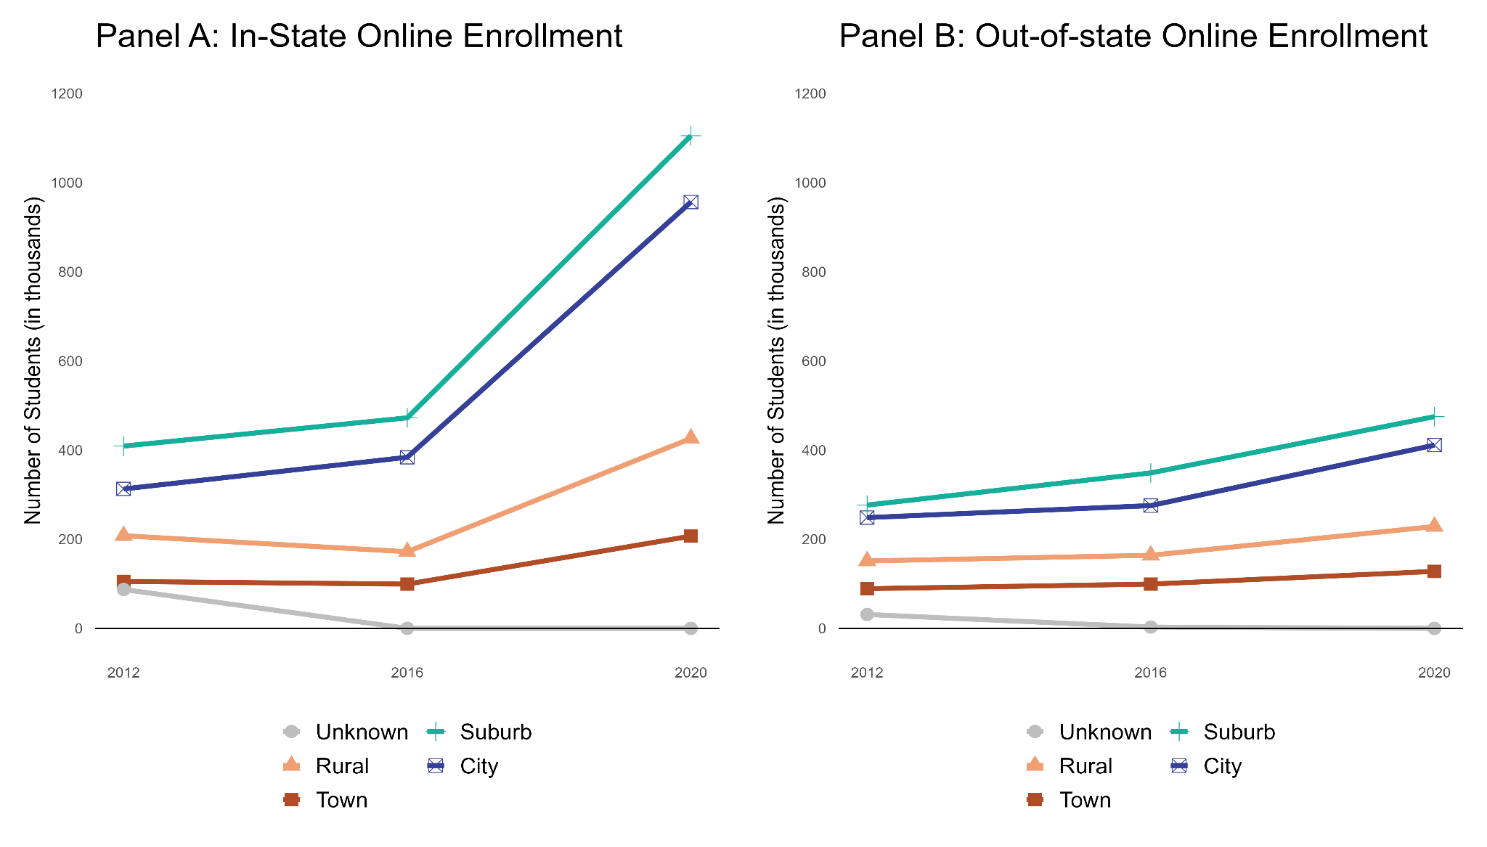
Because SARA specifically governs cross-state online enrollment, we examine how these online enrollment trends differ between out-of-state and in-state programs (Figure 11). Enrollment increased for both rural and non-rural students across in-state and out-of-state online programs. The rural share rose slightly in in-state online programs because rural enrollment grew a bit faster than non-rural enrollment, while in out-of-state online programs both groups expanded at similar rates.
Overall, changes in urbanicity among out-of-state online students are largely mirrored by the in-state online market. To the extent that in-state online serves as a counterfactual, these patterns do not provide clear evidence that SARA had a meaningful impact on the urbanicity composition of out-of-state online enrollment.
Figure 11: Urbanicity of Student Residence by Program Type Over Time (Total Enrollment)
The median age of out-of-state online students is higher than that of enrollees in other programs.
In the baseline year of 2012, out-of-state online students were notably older, with a median age of 31, compared to 27 for in-state online students. Students in non-online programs were much younger, with a median age of 21-22. In the 2012 NPSAS, 42 percent of both in-state and out-of-state online students had already earned a postsecondary degree, compared with 26 percent among students in programs not offered exclusively online. This suggests that the older age profile of online learners is largely explained by their higher likelihood of being degree holders, many of whom may be returning to school after time in the workforce to change careers or advance professionally. Online learning likely appeals to these students because it offers the flexibility needed to balance coursework with employment and other responsibilities.
Figure 12: Median Age of Enrolled Students by Program Type Over Time 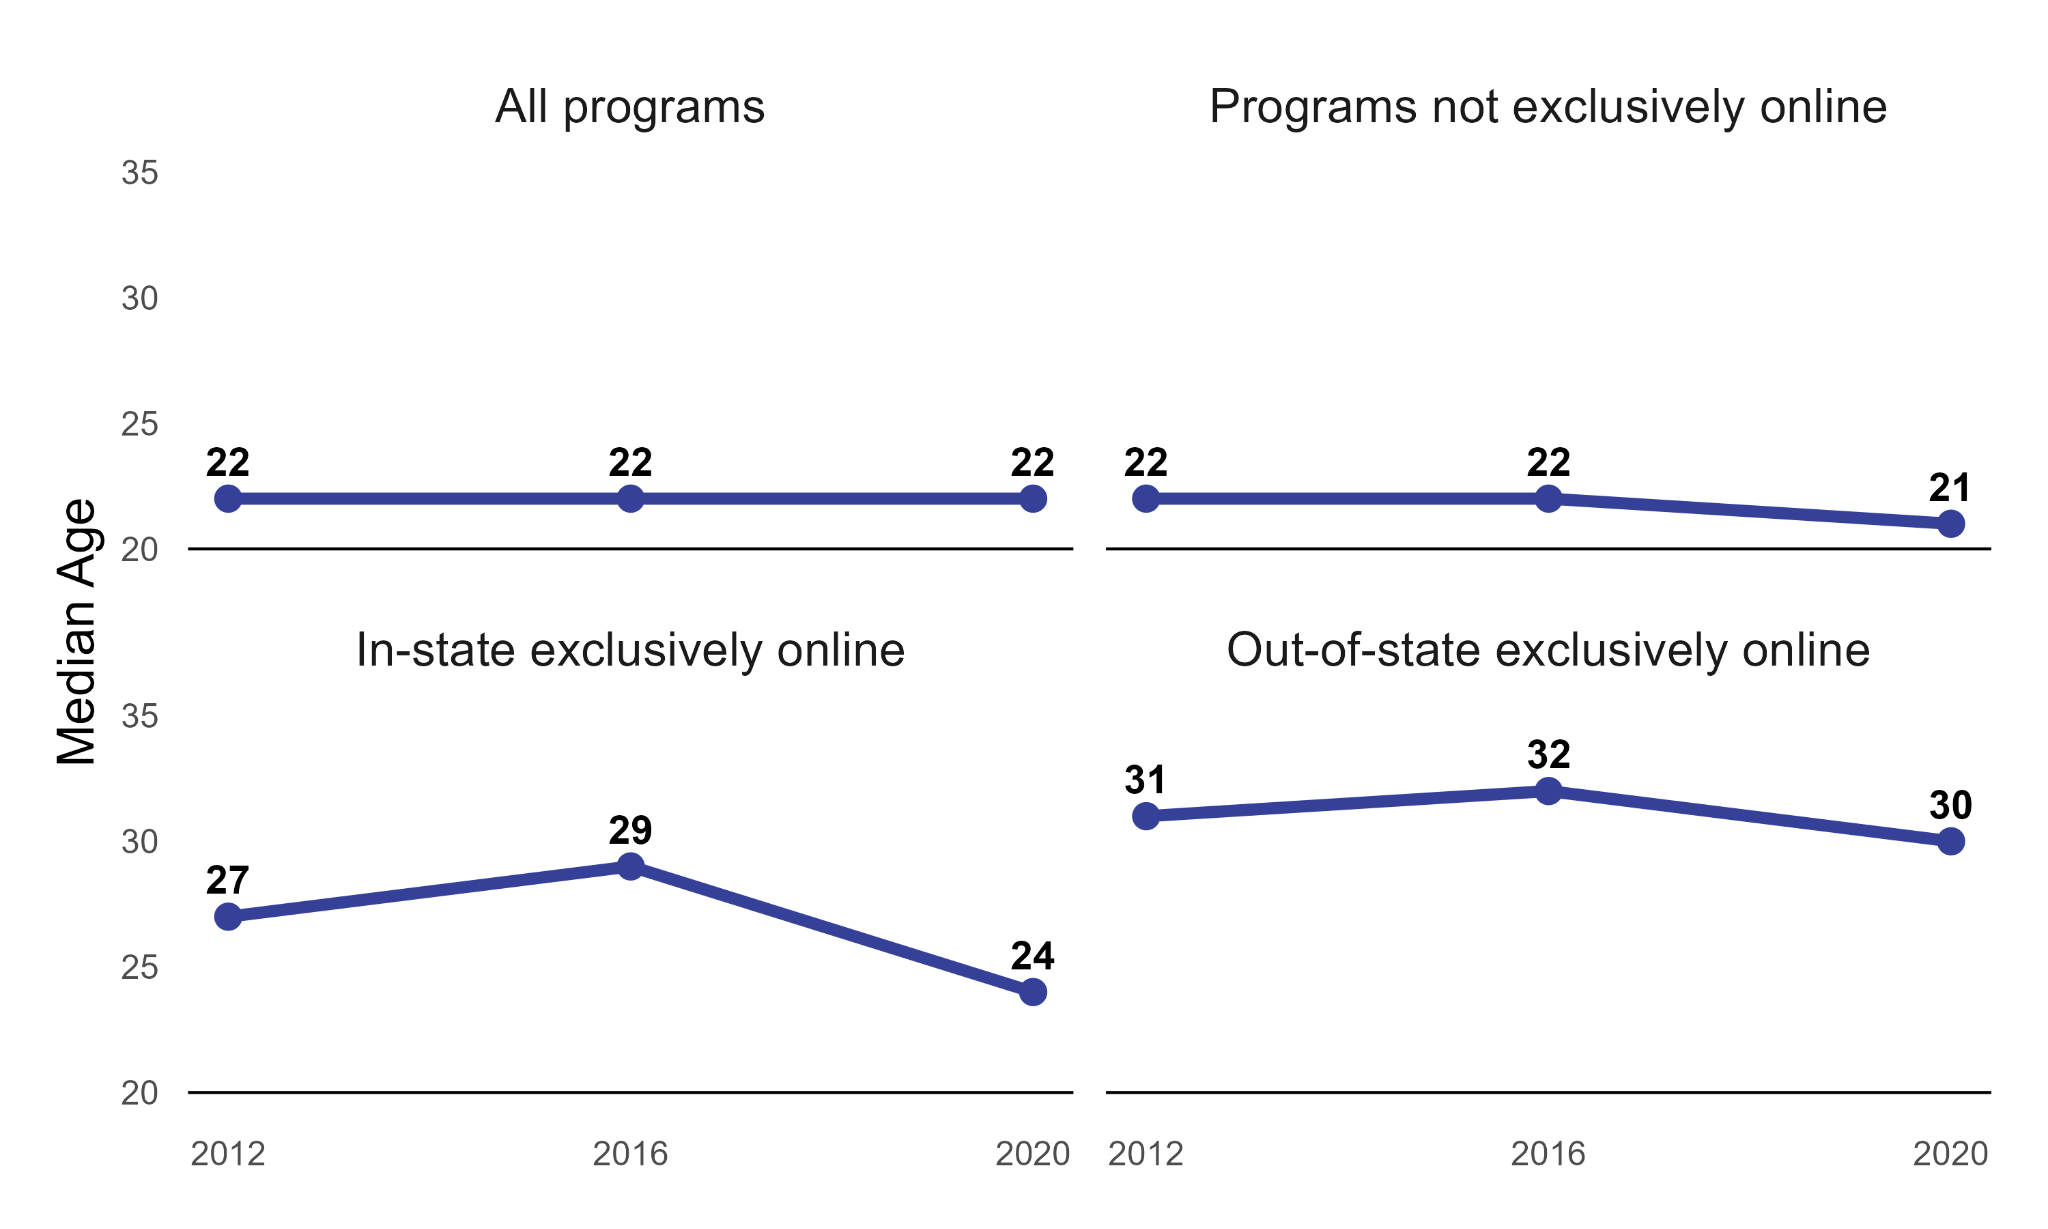
By 2020, there was a 10-percentage point drop in the likelihood that a student enrolled in an in-state online program had already earned a degree since high school, while there was a 3-percentage point drop among out-of-state online students. This shift toward students being more willing to enroll in an exclusively online program for their first degree likely explains at least in part the decrease in age of online learners between 2016 and 2020.
If SARA had a measurable effect on median student age, we would expect it to operate in a consistent direction over time. Instead, median age increased for both in-state and out-of-state online students between 2012 and 2016, then declined between 2016 and 2020. This reversal suggests that the forces shaping student age are broader than SARA’s influence. The shift could also reflect changes in who chooses online education or institutional recruitment strategies.
Overall, while the data show clear movement toward a younger online student population after 2016, it is not possible to pin down the extent to which these patterns may have been influenced by SARA.
Business and management are the most common majors for out-of-state online students.
In 2012, out-of-state online students were distinctly focused on business-related programs (Figure 13). Roughly 31 percent of out-of-state online students were enrolled in business or management programs, compared to 19 percent among in-state online students. Online learners overall were more likely to pursue business-related programs than students in other modalities. That, coupled with the higher age of the median online student, suggests that a significant proportion of online learners are driven by career advancement and upskilling.
Figure 13: Field of Study Composition by Program Type Over Time (Enrollment Shares)
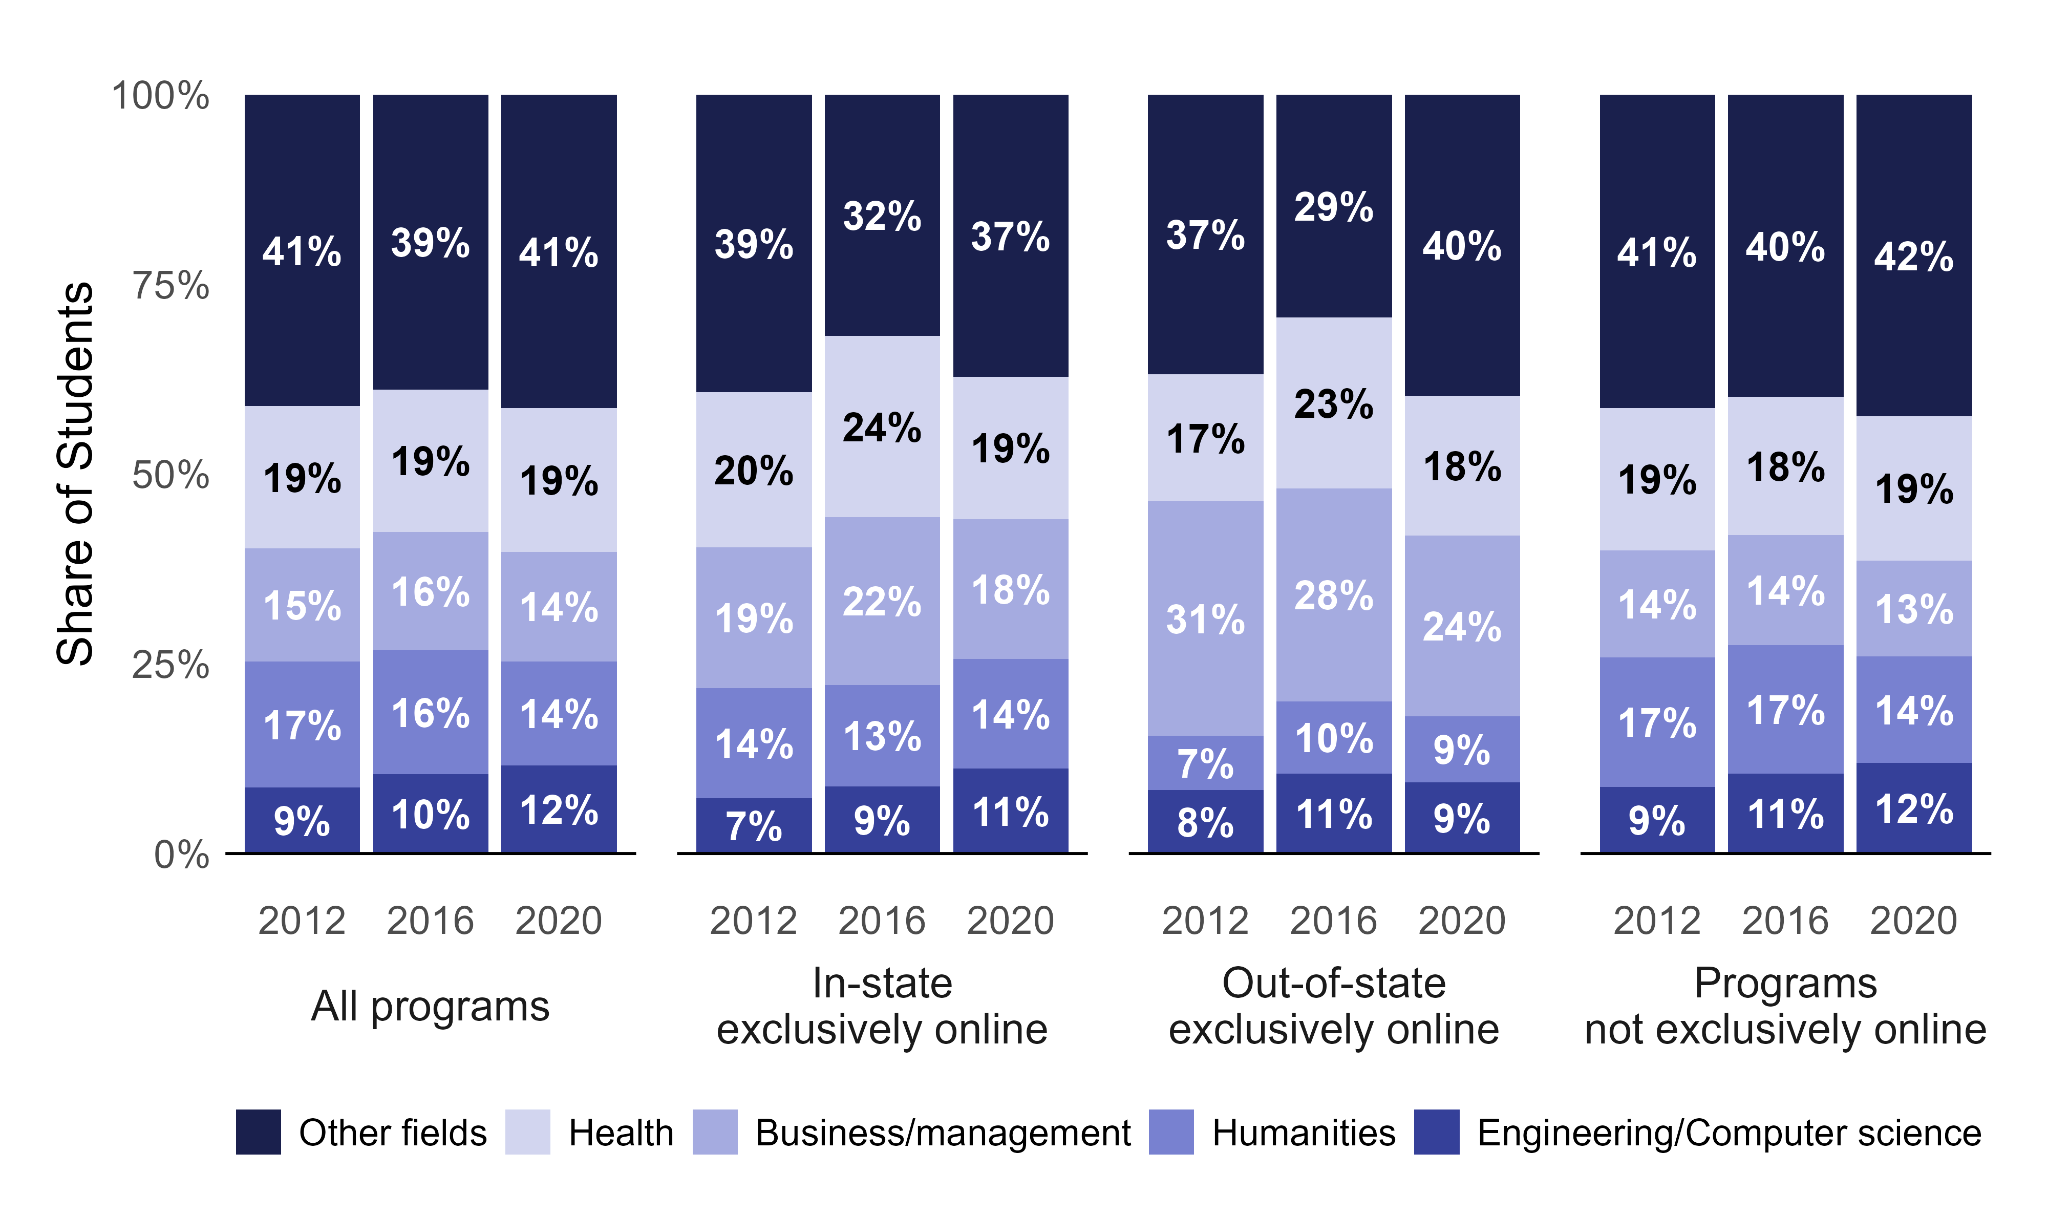
Figure notes: The “Other fields” category shown in this figure combines several lower-frequency fields of study: Life sciences, Social/behavioral sciences, Other, Other technical/professional, and Unknown. Additionally, Engineering and Computer/information science were combined into a single category labeled Engineering/Computer science.
After 2012, the share of out-of-state online students in business programs declined steadily. Notably, the number of out-of-state online students in business programs increased. However, growth in other fields of study was faster (Figure 14).
Figure 14: Field of Study Composition by Program Type Over Time (Out-of-State Online, Total Enrollment)
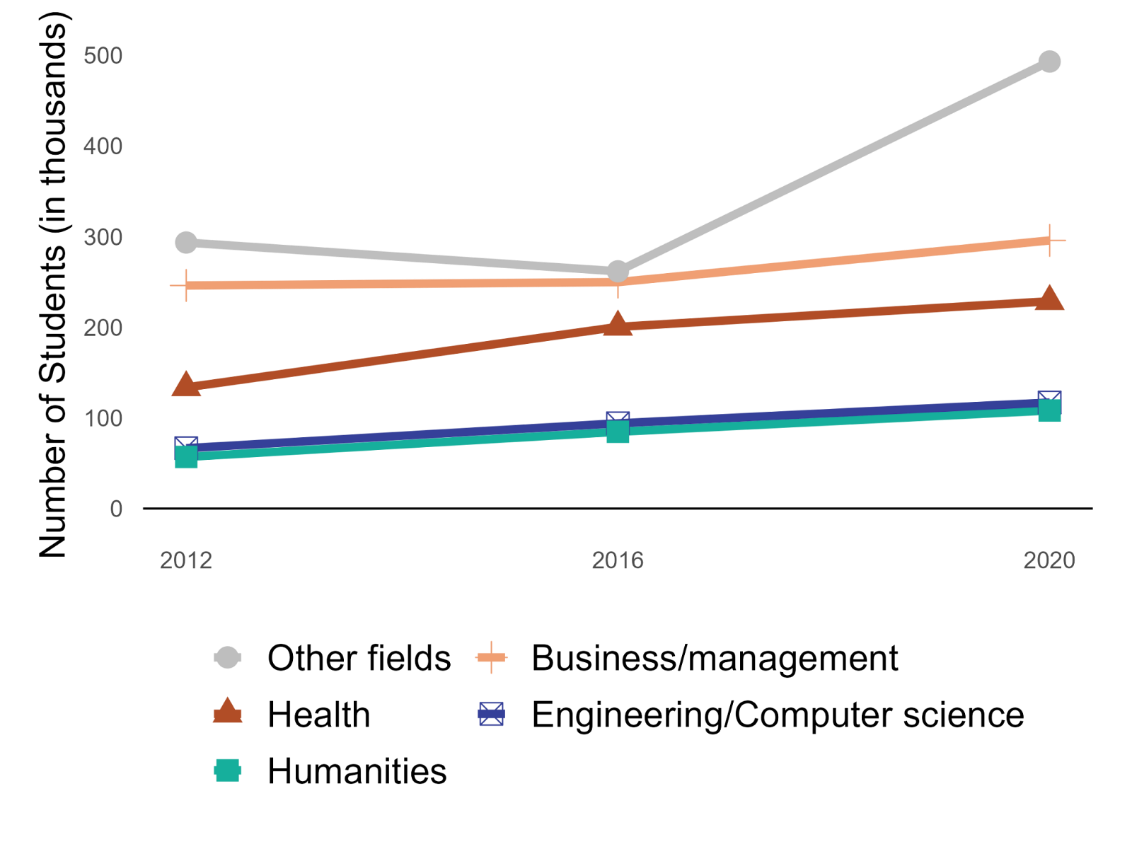
Figure notes: The “Other fields” category shown in this figure combines several lower-frequency fields of study: Life sciences, Social/behavioral sciences, Other, Other technical/professional, and Unknown. Additionally, Engineering and Computer/information science were combined into a single category labeled Engineering/Computer science.
More specifically, much of the growth in out-of-state online enrollment between 2016 and 2020 can be attributed to students interested in fields outside the most popular (business, health, humanities, and engineering/computer science). In-state online programs saw only modest changes in field composition. The share of students majoring in business increased from 19 percent in 2012 to 22 percent in 2016, then declined to about 18 percent in 2020, essentially returning to its earlier level (Figure 15). For both out-of-state and in-state online, growth in the less common fields was particularly strong between 2016 and 2020. However, the share of students in “other fields” rose by 5 percentage points for in-state online programs, compared with an 11-percentage-point increase for out-of-state online programs. These patterns suggest that SARA may have had an impact on expanding the kinds of programs that out-of-state online students have access to.
If so, this may relate to the earlier observation that the role of private not-for-profit and public institutions in the out-of-state online market has grown significantly. As these institutions entered the out-of-state online market, they may have expanded the mix of available programs beyond the career-focused portfolio typical of for-profit institutions.
Figure 15: Field of Study Composition by Program Type Over Time (In-State Online, Total Enrollment)
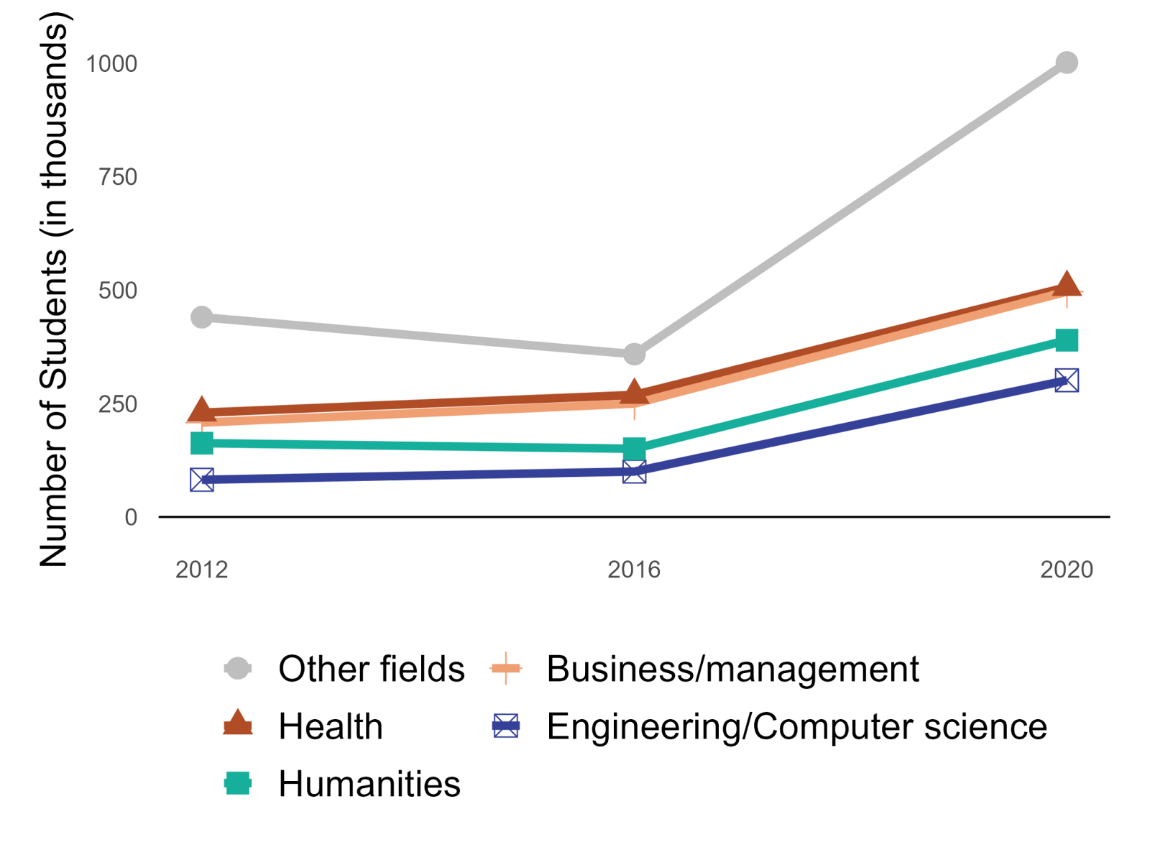
Figure notes: The “Other fields” category shown in this figure combines several lower-frequency fields of study: Life sciences, Social/behavioral sciences, Other, Other technical/professional, and Unknown. Additionally, Engineering and Computer/information science were combined into a single category labeled Engineering/Computer science.
Policy and practice considerations
The patterns presented in this report indicate that out-of-state online programs have attracted a population of students who may face greater structural barriers to traditional higher education than their peers. A notable exception is students in rural areas, who are only slightly overrepresented among students who enroll in out-of-state online programs. The prevalence of older students and business majors points to an orientation toward career advancement, while the higher share of students from historically underserved racial and socioeconomic groups raises questions about whether out-of-state online education is filling access gaps, or potentially reinforcing inequities by making lower-return programs more accessible.
Because of data limitations, we are not able to provide causal estimates about how SARA may have changed the composition of out-of-state online enrollment, but we are able to make progress on answering the question by analyzing national trends in enrollment composition before and after the expansion of SARA.
Overall, we are not able to determine how SARA may have influenced the gender or socioeconomic composition (as measured by Pell Grant receipt) of the out-of-state online market. However, there is suggestive evidence that California’s lack of participation in SARA may have limited the growth of Hispanic and Asian/Pacific Islander enrollment in out-of-state online programs.
Additionally, SARA may have contributed to a diversification of the out-of-state online program landscape. A large decline in the for-profit sector’s market share and a corresponding decrease in the dominance of business-related degrees point toward a broader mix of programs becoming available across state lines. To the extent that SARA facilitated this expansion by easing authorization for public and private not-for-profit institutions, the policy may have improved access to programs with stronger student outcomes.
During the second phase of the project, which aims to answer whether and to what extent online learners are earning credentials that are valued by the labor market, we will conduct a discrete choice experiment via an online survey of recruiters and hiring managers. In this experiment, participants will be asked to review a series of hypothetical job applicants and select those they would be more inclined to invite to a job interview. This experiment will allow us to examine the stated preferences of employers regarding online credentials and the extent to which these preferences may vary by whether the credential was earned from an in-state or out-of-state institution.
Endnotes
- 2012 and 2020 National Postsecondary Student Aid Study (NPSAS), https://nces.ed.gov/surveys/npsas ↑
- Claire Wladis, Alyse C. Hachey, and Katherine Conway, “Time Poverty: A Hidden Factor Connecting Online Enrollment and College Outcomes?” The Journal of Higher Education 94, no. 5 (2023): 609–637, https://doi.org/10.1080/00221546.2022.2138385. ↑
- Justin C. Ortagus, Rodney Hughes, and Hannah Allchin, “The Role and Influence of Exclusively Online Degree Programs in Higher Education,” American Educational Research Journal 61, no. 2 (2024): 404–434, https://doi.org/10.3102/00028312231222264; Eric P. Bettinger, Lindsay Fox, Susanna Loeb, and Eric S. Taylor, “Virtual Classrooms: How Online College Courses Affect Student Success,” American Economic Review 107, no. 9 (2017): 2855–2875, https://doi.org/10.1257/aer.20151193. ↑
- Joshua Goodman, Julia Melkers, and Amanda Pallais, “Can Online Delivery Increase Access to Education?” Journal of Labor Economics 37, no. 1 (2019): 1–34, https://doi.org/10.1086/698895;
Christian Fischer, Rachel Baker, Qiujie Li, Gabeo A. Orona, and Mark Warschauer, “Increasing Success in Higher Education: The Relationships of Online Course Taking with College Completion and Time-to-Degree,” Educational Evaluation and Policy Analysis 44, no. 3 (2021): 355–379, https://doi.org/10.3102/01623737211055768. ↑ - The Virgin Islands joined in 2017, and Puerto Rico joined in 2018. States are approved to join SARA by their regional, interstate higher education compact, and institutions are then approved by their state. At the time of writing, 2,418 institutions have signed on to SARA. ↑
- James D. Ward, Heidi Booth, Elizabeth D. Pisacreta, and Benjamin Weintraut, Breaking Down Barriers: The Impact of State Authorization Reciprocity on Online Enrollment, report commissioned by the State Higher Education Executive Officers Association (SHEEO), https://sr.ithaka.org/wp-content/uploads/2021/05/SR-Report-Breaking-Down-Barriers-082021.pdf. See also: Dustin D. Weeden, Jason C. Lee, David A. Tandberg, and Ellie M. Bruecker, “Exploring the Relationship Between Community Colleges’ Participation in SARA and Enrollment in Distance Education,” New Directions for Community Colleges 2021, no. 196 (2021): 107–115, https://doi.org/10.1002/cc.20487 https://doi.org/10.1002/cc.20487. ↑
- “State Actions Regarding SARA,” https://nc-sara.org/state-actions-regarding-sara/ ↑
- Margaux Cameron, T. Austin Lacy, Peter Siegel, Joanna Wu, Ashley Wilson, Ruby Johnson, Rachel Burns, Jennifer Wine, and Tracy Hunt-White, First Look at the Impact of the Coronavirus (COVID-19) Pandemic on Undergraduate Student Enrollment, Housing, and Finances (Preliminary Data), publication of the National Center for Education Statistics at IES, https://nces.ed.gov/pubs2021/2021456.pdf ↑
- “Corinthian Closes for Good,” Inside Higher Ed, April 26, 2015, https://www.insidehighered.com/news/2015/04/27/corinthian-ends-operations-remaining-campuses-affecting-16000-students ↑
- Stephanie Riegg Cellini and Nicholas Turner, “Gainfully Employed?: Assessing the Employment and Earnings of For-Profit College Students Using Administrative Data,” The Journal of Human Resources, 54, no. 2 (2019): 342–370, https://www.jstor.org/stable/26627855 ↑
- Women and Online Learning in Emerging Markets, International Finance Corporation, https://www.ifc.org/content/dam/ifc/doc/mgrt/report-women-and-online-learning-in-emerging-markets.pdf. ↑
- Stephanie Riegg Cellini and Nicholas Turner, “Gainfully Employed?: Assessing the Employment and Earnings of For-Profit College Students Using Administrative Data,” The Journal of Human Resources, 54, no. 2 (2019): 342–370, https://www.jstor.org/stable/26627855; Caleb E. Dawson, “Precarity and the Predatory Inclusion of Black Women by For-Profit Colleges,” Critical Sociology 50, nos. 4-5 (2024): 883-905, https://doi.org/10.1177/08969205231223164; David J. Deming,, Claudia Goldin, and Lawrence F. Katz, “The For-Profit Postsecondary School Sector: Nimble Critters or Agile Predators?” Journal of Economic Perspectives 26, no. 1 (2012): 139–64. ↑
- Nick Hillman, “Part III: For-Profit Colleges and Universities,” Pell Access and Completion Series, August 2022. ↑
- Riley Acton, Kalena E. Cortes, and Camila Morales, “Distance to Opportunity: Higher Education Deserts and College Enrollment Choices,” EdWorkingPaper, 2024, https://doi.org/10.26300/d0sg-0680 ↑
- Emily A. Vogels, “Some Digital Divides Persist Between Rural, Urban, and Suburban America,” Pew Research Center, August 19, 2021, https://www.pewresearch.org/short-reads/2021/08/19/some-digital-divides-persist-between-rural-urban-and-suburban-america/. ↑
- Justin B. Winikoff, “Population and Migration,” Economic Research Service, U.S. Department of Agriculture, last revised June 12, 2025, https://www.ers.usda.gov/topics/rural-economy-population/population-migration. ↑