Print Revenue and Open Access Monographs
A University Press Study
Introduction
Monographs are central to university press publishing, and to the scholarly ecosystem. As Alison Muddit, recent director of University of California Press commented, “Monographs are the heart of university press publishing; our fundamental role is to serve as a channel for scholarship that does not have an immediate commercial return. The monograph remains a vital vehicle for scholarly communication in many fields, not to mention the gold standard for promotion and tenure.”[1] It is estimated that more than 4,000 monographs are issued by US-based university presses each year,[2] and that has remained constant for some time. What has changed over time is the unit sales of these monographs, which declined from a high in the 1980s to far lower distribution over the past two decades.
What has also changed more recently is the growth of the open access movement. Journals were the primary original focus of the OA transition, but many university presses are at least experimenting with open models in their book publishing programs, led by several cross-press pilots, as well as OA monograph initiatives within individual university presses. According to an AUPresses survey in 2021, 70 percent of responding member presses reported the publication of OA books, using a variety of models.[3]
Still, with all of this activity, open access book publishing remains on the fringe of most university press book programs. While a few presses such as MIT and University of Michigan have made a significant commitment to publish the monographs on their list in open access editions, and there are a number of newer presses founded to be all-OA such as Athabasca and Amherst, on the whole, OA titles make up less than five percent of the total new monographic output of university presses.[4] Why is this the case? For one thing, there are still pockets of cultural resistance among humanists who worry that OA publication will be viewed less favorably than a traditional print monograph in the tenure and promotion process. Beyond these cultural barriers, there are financial concerns. At the highest level, the level of funding available for research in the humanities lags well behind what we have seen for STEM. As a result, it has been challenging to develop open access business models for books similar to the grant-supported APCs and transformative agreements that journal publishers have adopted. Moreover, smaller and even mid-sized university presses often lack the capital to experiment with new models. Perhaps more daunting still, with the decline in monograph sales over the last couple of decades, margins on academic books are so thin that publishers may fear that anything that threatens to cannibalize anticipated print sales of a scholarly title, such as a freely available open edition, is a threat to its viability.
But how big is that threat? What really happens to print sales when a title is also available in an OA version? After all, a growing body of research suggests that scholars in the humanities and social sciences continue to prefer to read print editions for teaching and research even as they value the greater discoverability and ease of exploring references afforded by digital versions.[5] The many pilots underway within and across presses give us a body of OA monographs to study, and thanks to the generous support of the NEH Office of Digital Humanities, and the participation of approximately 16 percent of members of the Association of University Presses, we now have been able to create a dataset with which to explore the question:
What happens to print sales when an OA edition of a scholarly monograph is also available on publication?
This is the central focus of this report, which is authored by members and representatives from the Association of University Presses and Ithaka S+R. We originally hoped to be able to compare OA titles against non-OA titles, but most of the presses we spoke with were unable to identify comparable titles. Nevertheless, we believe the aggregated data set of nearly 1,000 titles can be used by individual publishers to measure against their own historical data of sales for traditional, fully-paywalled monographs.
Beyond exploring the question of the role of print sales in OA monograph publishing, we will also touch briefly on how print sales fit into the overall financial equation of a sustainable OA book model. Previous studies of the cost of monographs as well as anecdotal feedback from our participating presses about sales expectations, costs for typical monographs, and the general picture of how print sales and outside funding work together, give us a window into that question, which we examine. Still, a full analysis of OA book publishing business models or the comparative viability of different funded pilots is beyond the scope of this study.
It is also beyond our scope to take up the issue of usage, although it would make a fascinating study to correlate print sales of OA titles with the usage impact of an openly available edition. After all, the goal of OA is to increase the impact of scholarship by making it more accessible while also ensuring its viability over the long run. We leave that question for another project.
Key Insights
- OA titles can generate significant print revenue. While there may be some tradeoff between OA editions and print sales, publishers can produce print sales revenue from their OA lists. Publishers may wish to take such revenue into account in considering business models for OA publication today.
- OA titles can generate meaningful digital revenue. When made available through consumer channels such as Kindle, ebooks that are available openly on other platforms can in parallel generate meaningful consumer sales. Publishers may benefit from giving focused consideration specific to OA monographs to their pricing and windowing tactics for such channels.
- Outliers are essential. A small number of OA titles sell particularly well, just as is historically the case in traditional monograph sales models. Publishers bearing this in mind will be thinking in terms of the sustainability and growth of their lists overall rather than each title individually.
- Titles with both hard and soft cover formats generate the most revenue. This may be the result of format choices publishers based on market forecasting, so from our data we cannot be sure that there is a causal relationship. Still, publishers may wish to give additional attention to their format strategy for OA books.
- Sales vary widely by field. History, arts, and humanities saw lower unit sales while social sciences saw higher unit sales and STEM fields saw the greatest. Publishers may need to pursue different sustainability models for OA books based on their field.
- An opportunity to increase print sales? There is currently significant friction for users in navigating from digital to print editions. Publishers and digital distribution platforms should work together to create a more seamless reader experience from digital discoverability of and engagement with the OA version to potential print sales.
Methodology
The Association of University Presses, in collaboration with Ithaka S+R, reached out to all AUPresses members about their publishing of OA monographs. We conducted a survey about their overall publishing of OA books and then requested that they compile administrative data for us about each book that they had published as OA.
Twenty-six publishers, or 16 percent of the university press community, responded to the survey. Together they represent all four membership tiers (small, medium, large, very large). Well over 90 percent of the participants are based in the US.
For each OA book, we requested the following administrative data:
- Type of OA book, e.g. a specialized monograph or a scholarly designated title with the potential for sales beyond the purely academic market of libraries and individual scholars
- Formats – print cloth, print paper, OA digital, priced digital
- Publication dates for each format
- Pricing for each format
- Net sales revenue for each format
- Units sold for each format
- Disciplines
- Outside funding sources
The dataset features 976 titles published between 2005-2022. Results have been anonymized: authors, titles, ISBNs, and names of presses have all been removed, enabling us to make the dataset publicly available for further analysis.[6]
A few definitions and caveats.
While the designation of “monograph” is useful in theory, in practice presses have different nuances of what constitutes a monograph. Some look at discount categories, with academic titles carrying a short discount. Others, at market: will this title appeal primarily to a highly specialized and limited academic audience? Of course it isn’t always easy to predict what a title will do from the outset. Some titles that look like specialized monographs may turn out to have adoption potential, or appeal to a professional market, or catch the imagination of the broader public once published. You will see that some titles in our dataset fit that profile. But for the most part, we have tried to collect information on monographs of the type that carry a short discount and are meant to appeal to a specialized academic audience. Our specific request to publishers was to include “scholarly books: books by scholars for other scholars or for other academic purposes. That can include course books, although not pure textbooks. It should include both monographs and edited collections, but not scholarly editions of primary texts.” Some publishers left the monograph designation column blank, perhaps an indication of how difficult it can be to agree on a definition!
Open access is another area to flag. Open Access has many definitions, but for this survey we defined it broadly as titles that were “free to read,” and asked for “born OA titles,” e.g. titles that offered a free to read edition within the first 12 months of initial publication, whether hardcover, paperback, or simultaneous. Our results feature mostly titles that were OA in the first month of publication, but there are exceptions—56 titles, or six percent—where the open version was delayed more than a month. (We didn’t see a significant impact on sales of delaying OA publication.) Further, there are different versions of what constitutes openness. Some titles are widely available on many different platforms; others only on a publisher’s or author’s site. We did not look at the distribution platforms for each title, but it’s worth noting that this could affect the sales results.
Bear in mind also that this is a picture in time. We haven’t been able, for instance, to determine the impact of the COVID pandemic on sales patterns for OA monographs since the time span covered doesn’t allow us to see that longer pattern. Also just looking at the long arc of the OA journals transition, it takes time for digital versions to become the preferred edition and for publishers to wind down print. This may never happen with books given the stated preference of many readers for a print version and the different nature of monographic vs. serial production and distribution, but reading habits change, and we are just at the beginning of the digital transition for scholarly books.
Findings
Revenue[7]
Sales of open access books are the core of this study. Our key finding is that almost all of the OA monographs we reviewed generated at least some revenue from print + ebook sales, and a healthy percentage—close to 30 percent—enjoyed sales of $10,000 or greater.
On average, OA monographs produced $16,909 in revenue. This revenue derives primarily from print sales, although we also saw modest electronic sales for some titles due to the availability of priced digital editions on platforms such as Kindle. (More on electronic sales in a subsequent section.)
It is important to note that there were a few outliers with exceptional sales that skewed the results. When we remove these titles, the average drops to $8,799 and the median to $6,237. This is perhaps a more useful average for presses to consider. But while it makes sense to exclude the 13 top-selling titles with revenues of over $100,000 so that we can get a more realistic picture of the average print sales to expect from OA titles, still, it is often a few big titles that carry the full list. We will look into these OA outliers in another section, but it is worth noting that OA titles follow the same pattern as the rest of a list in having breakout successes, as well as really low-selling titles. And it is also worth noting that at least some OA titles can generate significant print income, despite the preconception that there is an inevitable tradeoff between OA editions and print sales.
Aggregates Sales, All Editions
| Scope | Mean Print Sales per Title | Median Print Sales per Title | Mean Print + Ebook Sales per Title | Median Print + Ebook Sales per Title |
| All titles* | $15,238 | $5,769 | $16,909 | $6,361 |
| Titles excluding 13 bestsellers* | $7,954 | $5,618 | $8,799 | $6,237 |
* Excluding incomplete data entries
Sales Patterns Based on Press Size
We were curious if press size had an impact on these print sales results. Larger presses, for instance, tend to have more marketing and publicity resources while smaller presses are often stretched to get attention for their titles even if they are openly available. Would this make a difference?
While we have no evidence to indicate that marketing and publicity resources were a factor, we did see differences in the results based on press size that confirmed, in part, the expectations for large and small presses. The smallest presses in our sample had the lowest average and median print sales; the largest presses had the most sales—almost double that of the small presses even when we removed the outliers which almost all tended to be in the Group 4 (revenue over $6 million) tier. The results in the middle tiers, however, were more surprising. Group 2 (revenue between $1.5-3 million) had average print revenues of $9,549 which was double that of Group 1 (revenue up to $1.5 million), while the larger presses in Group 3 (revenue between $3-6 million) looked quite similar to the small Group 1 presses. It’s possible that title/discipline mix played a part in the stronger sales in Group 2. We saw, for instance, that Group 2 had eleven STEM titles, six of them in computer science, compared to only two or three in Groups 1 and 3.
Titles and Revenue by Press Size[8]
| Press Size
Revenues |
Number of titles | Average revenue per title | Median revenue pet title |
| 1 (up to $1.5m) | 184 | $ 4,750 | $ 4,124 |
| 2 ($1.5 – 3m) | 154 | $ 9,549 | $ 6,053 |
| 3 ($3 – 6m) | 80 | $ 5,335 | $ 4,444 |
| 4 (over $6m) | 544 | $ 24,808 | $ 7,987 |
| 4 (exl. outliers) | 532 | $ 10,977 | $ 7,714 |
Title Distribution by Print Sales
Title sales cluster for OA monographs just as they do for non-OA monographs. While the sales distribution curve for OA monographs is wide, almost 80 percent of the titles in our study generated sales between $2,000 and $20,000. More than 60 percent sold over $5,000, and almost 30 percent sold over $10,000.
Title Distribution by Print Sales
| Print Sales | Number of Titles |
| $1<1k | 50 |
| $1k<2k | 78 |
| $2k<5k | 238 |
| $5k<10k | 321 |
| $10<20k | 197 |
| $20<100k | 65 |
| 100k+ | 13 |
Average Units Sold
For the largest group of titles—those generating between $2,000 and $20,000—the average units sold across all print sales for the entire period covered in our dataset ranges from 142-459.[9] This compares to the anecdotal feedback we received from a few of our participating publishers that, on average, their non-OA monographs sell in the range of 400 copies in the first three years. Below is a more granular look at units sold according to our title distribution of sales generated.
Average Print Units Sold by Print Sales
| Print Sales | Average Print Units |
| $1<1k | 36 |
| $1k<2k | 84 |
| $2k<5k | 153 |
| $5k<10k | 255 |
| $10<20k | 518 |
| $20<100k | 2,095 |
| 100k+ | 17,644 |
Sales Patterns Over Time
The average age of the titles in our dataset was three years and eight months (as of October 2022, the close of our data collection period) so we have some window into how OA monographs perform over time. These OA monographs averaged print sales of around $2,973 in the first year ($2,860 without outliers),[10] and $15,238 total sales (excluding outliers it was $7,954). Excluding outliers, 20 percent of the total sales curve happens in the first year.
How do these sales figures compare to the average sales trajectory of non-OA monographs? While we did not collect data to make such a comparison, a few of our participating presses shared with us that their non-OA monographs tended to generate revenue in the range of $4,500-$12,000 in the first year, and $6,000-$18,000 after three years. To the extent that these estimates bear out, the greater discoverability and accessibility of an open access edition does not seem to drive a greater proportion of sales in its first years when compared to a similar non-OA title. It is quite possible, however, that OA and non-OA monographs are not really comparable; presses choose which titles to make OA and that choice involves many factors that could affect sales results. Then too, most monographs stay in print for decades, so there may well be a different pattern of sales to compare over a much longer period of time.
Formats
Beyond the aggregate picture of sales, we found some interesting patterns in the way presses chose to issue different formats.
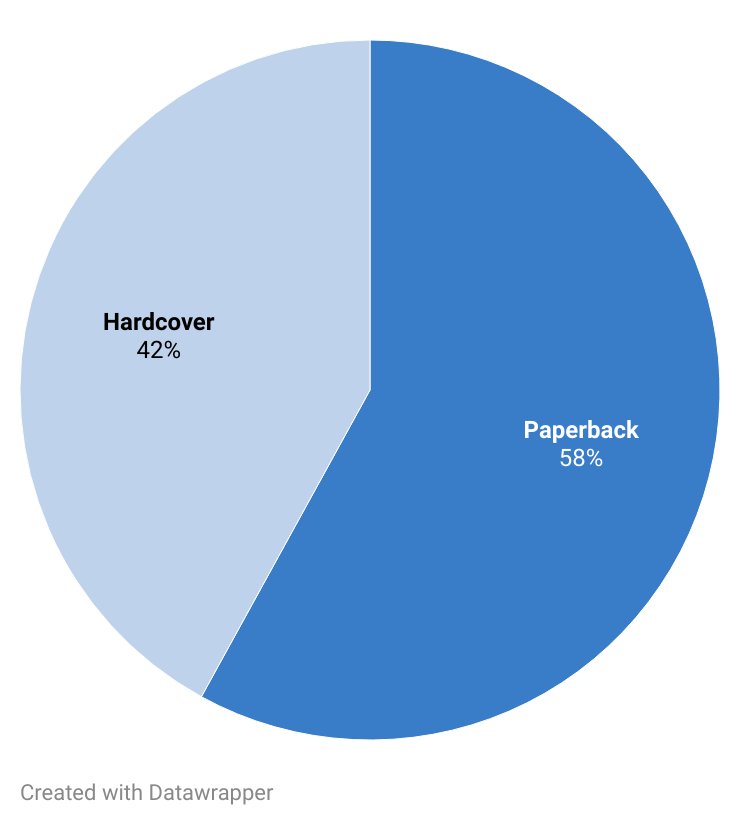
Overall, nearly 60 percent of our titles were published in hardcover, and the vast majority with revenues over $2000 had a hardcover edition.
Hardcover Patterns
| Print Sales | Number of Hardcover | Total Titles | % Hardcover |
| $0 | 0 | 2 | 0% |
| $1<1k | 6 | 52 | 12% |
| $1k<2k | 14 | 85 | 16% |
| $2k<5k | 138 | 276 | 50% |
| $5k<10k | 211 | 317 | 67% |
| $10<20k | 135 | 170 | 79% |
| $20<100k | 49 | 57 | 86% |
| 100k+ | 9 | 13 | 75% |
| Total | 562 | 971 | 58% |
An even greater percentage had a paperback edition, especially those that generated some of the lower revenues between $0-$2,000.
Paperback Patterns
| Print Sales | Number of Paperback | Total Titles | % Paperback |
| $0 | 0 | 2 | 0% |
| $1<1k | 50 | 52 | 96% |
| $1k<2k | 82 | 85 | 96% |
| $2k<5k | 234 | 276 | 85% |
| $5k<10k | 223 | 317 | 70% |
| $10<20k | 111 | 170 | 65% |
| $20<100k | 45 | 57 | 79% |
| 100k+ | 8 | 13 | 67% |
| Total | 753 | 971 | 78% |
What can we make of these format publishing decisions? Perhaps the most useful analysis is to look at hardcover only titles versus paperback only and dual editions.
Print Formats
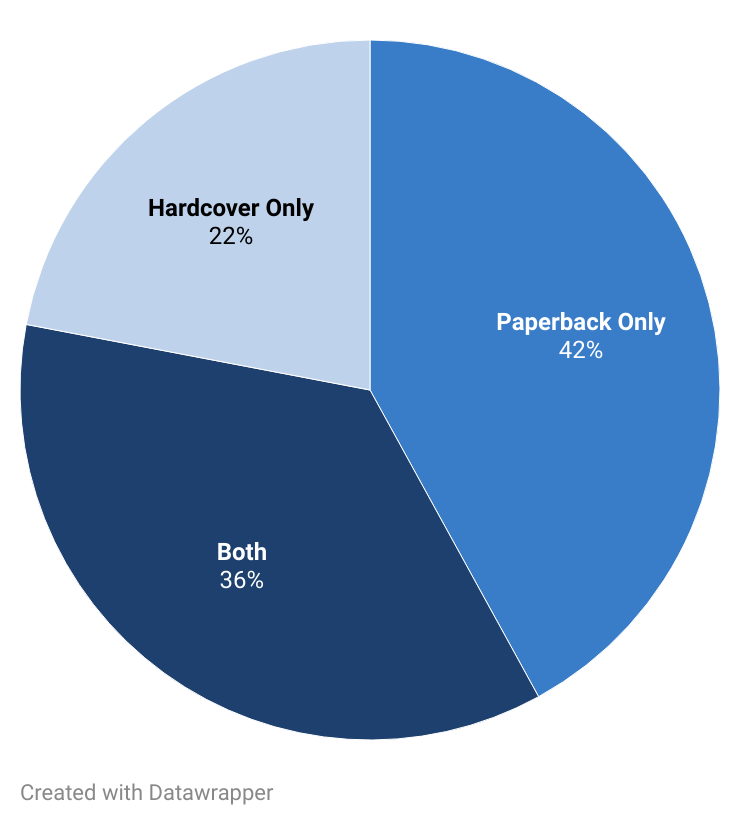
Of our 971 title base with hardcover and paperback sales data available, 216 titles, or 22 percent, were published in hardcover only and averaged print sales of $9,446 ($35,270 including outliers). That compares favorably to the 407 (42 percent) paperback-only titles with average print sales of $5,137 ($6,511 including outliers). What stands out in our sample are the 346 titles, or 36 percent of the total, issued in dual edition. Here the average revenue was $10,410 ($13,088 including outliers).
Net Revenue by Format
| Format | Average Net Print Revenue | Average Net Print Revenue excl. Outliers |
|---|---|---|
| Hardcover Only | $ 35,270 | $ 9,446 |
| Paperback Only | $ 6,511 | $ 5,137 |
| Both | $ 13,088 | $ 10,410 |
We don’t have a window into why publishers chose not to release a paperback, or to publish in paperback only. The economics of creating dual editions depends on a lot of factors such as the ability to do cost effective short run printing or print on demand. We also don’t know the direction of causality here (if any); in other words, it’s possible that publishers issue hardcovers for OA monographs based on a fairly effective evaluation of market preferences
That said, some publishers may want to take a more careful look at issuing hardcovers for titles for which they might otherwise neglect doing so. And, it’s worth considering the potential for a dual edition strategy, especially as publishing both a hardcover and paperback edition of a title shows the best print sales result, with the hardcover contributing more than 40 percent of the total.
Net Revenue of Titles Published in Both Formats
A Word on E-Consumer Sales
While modest in comparison to print sales, digital sales have come to represent a meaningful revenue stream even for OA monographs. Here, we are focusing on e-consumer sales, for example through Kindle. Looking across our dataset, 53 percent of these titles had at least some digital revenue. At first, this could generate surprise. Many would not expect to see any digital sales given that all of these titles are available in open access editions. But clearly, this is something worth paying attention to. Almost 20 percent of the titles had digital sales of over $2,000, and in some cases, especially in the lower title distribution brackets, digital sales played a larger role.
Title Distribution by E-Consumer Sales
| E-Consumer Sales | Number of Titles |
| 0 | 454 |
| $1<1k | 235 |
| $1k<2k | 97 |
| $2k<5k | 138 |
| $5k<10k | 28 |
| $10<20k | 6 |
| $20<100k | 5 |
| 100k+ | 1 |
Some observers have questioned the ethics of offering a priced digital version of an OA publication. Whatever the ethical implications, it seems that consumers see value from these materials, perhaps in some cases because they did not realize there was a free option but probably in other cases because the format and distribution model added value for them.
We’re curious if publishers have a strategy for these e-commerce sales. For instance, how do they decide which titles make sense to push into the e-consumer channel in a priced version? Are there some titles that benefit more from the value-add of formats such as Kindle even if they are also available open access? Might it be worth pushing all titles into the e-commerce channel? How should prices be assigned to these materials and is there a different formulation as compared with non-OA monographs? Should publishers ensure that ebook buyers know that an OA edition is available? Given the sales results, these questions are worth further exploration.
Outliers
As mentioned previously, we have called out the 13 titles in our dataset that have extraordinarily high revenues compared to the rest. We have been careful to do our analysis with and without these titles since they have a decided impact on the results, boosting the average sales from $8,799 to $16,909. Still, it’s worth digging into this a bit to see what is behind these outliers.
Of the 13 titles that had sales exceeding $100,000, the project team was able to look a little more closely at the individual title data and pull out some interesting intelligence. Twelve of these titles were published by presses in Group 4 (within the Association of University Presses statistical program, Group 4 includes those presses whose annual net book sales exceed $6 million.) Eight titles appear to be scholarly monographs with crossover potential to markets such as course adoption, professional audiences, and even trade. At least three appeared to be STEM textbooks, somewhat outside of the strict scope of our study. And over 50 percent of these “bestsellers” have publication dates a decade or more ago. Some of the OA editions of these titles are downloads from an author website or informal file sharing platform, which may have hampered either discoverability or usability for readers, and a number became OA through programs where an OA edition may not have been available (nor certain) immediately upon publication. Many titles were in the social sciences or professional areas such as law. A sampling of topics included economics, education, law and politics, medical history, information studies, engineering, and feminist theory.
A final thought. While we treat these outliers as just that, it bears repeating that presses build their list profiles on a mix of titles, and it is often the breakout title that carries the whole season, or the backlist. This is true for non-OA publishing, and it certainly seems to be true for OA publishing, at least if this dataset is typical. Finding the right mix is always a publishing challenge, and no less so when open access publishing is part of that mix.
Disciplines
Our dataset captures the main subject area for each title included, but for the purposes of this analysis, we have tried to take a broad look at publishing trends in the disciplines, breaking them into humanities/arts, social sciences, history, and STEM. We featured history as a separate category because some see it as belonging within the humanities while others place it in the social sciences.
Title revenue and unit sales by discipline
| Discipline | Number of titles | Average revenue | Median Revenue | Average print units sold | Average hardcover price | Average paperback price |
| Arts & Humanities | 272 | $ 7,980 | $5,132 | 340 | $ 45 | $ 30 |
| Social Sciences | 465 | $ 12,363 | $7,214 | 524 | $ 43 | $ 24 |
| History | 138 | $ 6,523 | $5,297 | 239 | $ 53 | $ 22 |
| STEM | 84 | $ 88,349 | $8,545 | 2,056 | $ 29 | $ 27 |
| STEM excl. Computer Science | 63 | $ 20,230 | $ 7,990 | 881 | $ 25 | $ 29 |
| Computer Science | 21 | $ 292,709 | $ 12,427 | 5,580 | $ 42 | $ 21 |
Nearly half of the monographs in our dataset fell within the social science disciplines. With the exception of STEM, these titles generated the highest average revenues. Pricing of titles in the social sciences and humanities was roughly comparable for hardcovers, and higher for paperbacks in the humanities, but the biggest factor driving the average revenue per title of $12,363 in the social sciences was the greater number of units sold. History hardcovers were priced 15-19 percent higher than titles in the social sciences or humanities, and slightly lower in paperback, but sold far fewer copies.
While there were fewer STEM titles included, they outperformed, by far, all other categories. This was true even when we stripped out the discipline of computer science. Without the 21 titles in computer science, there were 63 STEM titles priced comparably to the humanities and social sciences (lower in hardcover; higher than all but humanities in paperback) which sold an average of 854 units and generated an average of $20,230. The 21 computer science titles were much higher priced in hardcover but slightly lower in paperback and averaged sales of $292,709.[11]
Reflections on the Sustainability of Open Access Monographs
Finally, we mentioned that we would try to touch on how print sales fit into the equation of a sustainable OA monograph model. How much do these print (and digital priced) editions contribute to sustainable OA publishing of specialized monographs, and how should presses take print sales into account when building their OA publishing models?
There are a number of open access monograph models that are operational now, and we were able to get a rough portrait of that landscape through our study. Many OA monographs are funded in whole or in part by publisher specific programs. Of the 976 titles in our program, 309 or 32 percent fall into this category. Other titles generate revenues through participating libraries fees which contribute enough, in aggregate, to open titles at publication. In our dataset, 192 titles, or 20 percent, recovered costs through library revenues from the Knowledge Unlatched program and a further 13 were part of a Subscribe to Open initiative. Still other OA programs are partially subsidized by grant-funded initiatives such as TOME (Toward an Open Monograph Ecosystem)[12] and SHMP (The Sustainable History Monograph Pilot).[13] These grant-funded pilots contributed 123/13 percent of our titles. Institutional subventions also support OA publishing and 94/10 percent of our titles fall into this category. We do not argue here for one or another of these approaches. In the end, some sort of blended model will probably be necessary to put OA monographs on a sustainable footing.
How much does a typical specialized monograph cost to publish? The short answer is: it’s complicated. Ithaka S+R published a detailed study in 2016 that benchmarked the “basic” cost of a monograph at $28,747 and the “full” cost including overheads at $39,892.[14] In 2022, Project TOME published a retrospective analysis, using a modified version of the methodology developed for the 2016 study, benchmarking the average cost of a monograph in the program at $19,954.[15] The SHMP project experienced lower costs still, in the range of $10,000-$12,000 per book (excluding general and administrative costs),[16] as a result of its standardization and economies of scale.
A very small share of the titles in our dataset have enough print sales to recover costs according to Ithaka S+R’s $28,747 model; fewer still recouped the higher estimate of $40,000 that includes a contribution to general and administrative costs. If we assume, however, a cost base closer to TOME’s $20,000 per title, then our average print sales contributed $9,356 (excluding outliers) or almost half of that total, and about one third in the case of the median sales of $6,501. While the long-term prospects for print revenues cannot be forecast with the methods used in this project, we do see that this print contribution as part of a blended program of subsidies and or library support begins to approach a modestly sustainable model.
Conclusion
We are still at an early stage in the evolution of open access scholarly book publishing, but while established models begin to consolidate we can say that, at least for now, print and ecommerce sales play an important role in the cost recovery and effective dissemination of OA monographs. In our study, almost all titles generated print revenue, and in some cases, it was significant; the average sales per title was $8,799 (or $16,909 including the 13 top-selling outliers). Blended with other sources of revenue from grants, library fees, press subsidies, and institutional support, these print and ecommerce sales can help to build sustainable OA monograph programs. There is also evidence that publishing strategy makes a difference, including decisions about which formats to issue and whether and how to price an e-commerce version. One clear conclusion is that more attention can be given to opportunities to drive greater print sales (perhaps digital sales also) even for open access monographs.
It is important to reiterate, however, that these results are a snapshot in time, and strategy, as well as business models, can be upended by factors we can’t foresee, such as government mandates, or new types of monographs that can’t render in print, or changes in the reading habits of the academic community that make print consumption obsolete. But for now, in this early stage of the OA transition, print sales play an important role.
Suggestions for Further Research
- What is the average print sale of a non-OA specialized monograph? Fewer than half of the participating presses in our study gave us feedback on the average sales of their non-OA scholarly books. If we had a comparable dataset for these titles we would be able to take a more balanced look at the sales delta between OA and non-OA monographs, and drive future discussions about OA subsidies based on the amount of revenue risk a publisher faces in making a book OA.
- What are the true costs of publishing an accessible OA scholarly monograph? Creating an up-to-date assessment of the costs could help to develop an evidence-based model for OA funding support.
- How do print sales of OA titles correlate with usage of their openly available editions? This could help us to understand the tradeoffs between impact and revenue generation.
- Is there a long-tail advantage or disadvantage in sales of OA titles? The titles in our dataset averaged seven years of sales, but a longer time-horizon longitudinal study could help us assess whether the greater discovery of open access titles leads to more long-tail sales.
- Do new delayed-OA publication models, such as JSTOR’s Path to Open,[17] lead to stronger print sales before the open version is released?
- As publishers consider making backlist books OA, what is the impact on continuing sales of flipping to OA, looking at books that were flipped vs. comparable books that remain paid-access?
- Have the print sales market segments for OA titles (retail, library, course, specialty accounts) been impacted more or less by OA editions? Are general bookstore sales steady and course adoption or library print sales in decline, for example.
- What are the long-term reader preferences in the higher education community for print formats and what are the long-term prospects of print sales?
Appendix
Invitation to University Press Directors
Dear [Press Director First Name],
You may recall that AUPresses recently received an NEH grant to study the impact Open Access (OA) editions have on the print sales of monographs. To support this study, we are asking presses to supply sales data for OA book via the spreadsheet downloadable at this link [link].
We ask that you forward this invitation with linked instruments to the staff member at your press most equipped to provide book sales data, if that is not yourself. Once your press has completed the spreadsheet, the saved file should be submitted via this online form [link] where we are also soliciting some press-level information.
Our deadline for the receipt of data is Friday, October 7.
During our beta testing of the spreadsheet, it took most presses between 5-10 minutes to locate and fill out data for the first title submitted. Most presses reported that subsequent titles then took less, sometimes far less, time.
Title Selection Criteria:
In this spreadsheet, we are only requesting data for books that are “born OA” (e.g., the digital edition was always free to read, or it was known that an OA edition would be available within the first year of publication.) We will accept books where, because of the nature of the OA program (e.g., Knowledge Unlatched), the digital edition might briefly be paywalled, but we would not accept books from, for example, the NEH Fellows Open Book Program, where books have been made OA usually after three years.
We only want scholarly books: books by scholars for other scholars or for other academic purposes. That can include course books, although not pure textbooks. It should include both monographs and edited collections, but not scholarly editions of primary texts.
We request only books where the OA version is a verbatim edition of the print. In other words, no works where there are enhanced ebooks or other digital humanities apparatus.
A Note on Data Confidentiality
We commit to preserving the anonymity of submitted data. Only AUPresses staff will have access to both the press information submitted via Formstack and the title-identifying information in the spreadsheet. The published report will include a list of presses that contributed data to the project, but all identifying details (press, contact, title, author, ISBNs) will be removed by Association staff before sharing data for analysis by the project team and from all published reports and open data sets.
Please submit data for this study by Friday, October 7, 2022. If you have any questions about the spreadsheet [download link], the submission form [link], or the study project in general, please do not hesitate to contact John, Erich, or Brenna, as listed below.
Thank you,
John Sherer, co-PI (UNC Press)
Erich Van Rijn, co-PI (University of California Press)
Brenna McLaughlin (AUPresses)
Laura Brown (Ithaka S+R)
Roger Schonfeld (Ithaka S+R)
Data Request Template
The blank data request template is available to download as an Excel file at this link: https://sr.ithaka.org/wp-content/uploads/2023/09/OA_Book_Data_Collection_Tool_20220912.xlsx.
Endnotes
- Alison Mudditt, “The Past, Present, and Future of American University Presses: A View from the Left Coast,” Learned Publishing 29 (2016): 330-334, https://onlinelibrary.wiley.com/doi/full/10.1002/leap.1047. ↑
- Joseph J. Esposito and Karen Barch, “Monograph Output of University Presses,” SCRIBD, 10 February 2017, https://www.scribd.com/document/338898529/Monograph-Output-of-University-Presses. ↑
- Annette Windorn and Peter Berkery, “Guest Post – A Decade of Resilience for University Presses,” The Scholarly Kitchen, 18 April 2023, https://scholarlykitchen.sspnet.org/2023/04/18/a-decade-of-resilience-for-university-presses/. ↑
- This is more anecdotal than a precise measurement. ↑
- Melissa Blankstein, “Ithaka S+R US Faculty Survey 2021,” Ithaka S+R, 14 July 2022, https://doi.org/10.18665/sr.316896. ↑
- The dataset has been deposited through Humanities Commons and is available at https://up.hcommons.org/deposits/item/hc:59547/. ↑
- Our analysis of revenue is limited to print (and electronic) sales. It does not include other possible sources of revenue such as subsidiary rights. For the purposes of this study we used the following conversion rates for sales and revenue figures: 1 GBP = 1.29 USD; 1 EUR = 1.09 USD. ↑
- Based on AUPresses tiers. ↑
- Note that we did not have access to ebook unit sales data. ↑
- Includes both paperback and hardcover sales if both versions are released within six months, otherwise only the sales in the first format released. ↑
- It’s likely that many of these titles were not monographs in the traditional sense but were nevertheless included by publishers in the study. ↑
-
Toward an Open Monograph Ecosystem, https://www.openmonographs.org. ↑
-
John Sherer, “The Sustainable History Monograph Pilot Blog,” Longleaf Services, 30 April 2023, https://longleafservices.org/blog/the-sustainable-history-monograph-pilot/. ↑
-
Nancy L Maron, Christine Mulhern, Daniel Rossman, and Kimberly Schmelzinger, “The Costs of Publishing Monographs: Toward a Transparent Methodology,” Ithaka S+R, 5 February 2016, https://doi.org/10.18665/sr.276785. ↑
-
Nancy Maron and Kimberly Schmelzinger, “The Cost to Publish TOME Monographs: A Preliminary Report,” Association of University Presses, 2022, https://hcommons.org/deposits/item/hc:47235. ↑
-
John Sherer, “Open Access for Monographs is Here. But Are we Ready for It?” Longleaf Services, 8 May 2023, https://longleafservices.org/blog/open-access-for-monographs-is-here-but-are-we-ready-for-it/. ↑
- “Path to Open: High-quality Titles with a High Impact,” About JSTOR, https://about.jstor.org/path-to-open/. Ithaka S+R is part of the ITHAKA not-for-profit organization, which also includes JSTOR. ↑