Raising the Bar
What States Need to Do to Hit Their Ambitious Higher Education Attainment Goals
Introduction
Over the past decade, there has been considerable attention placed on the role that state higher education systems play in preparing residents for a rapidly changing labor market. Given the increasing importance of a postsecondary degree in this market—both due to disproportionate growth in high skilled jobs and an influx of credentialization—educational attainment has become a focal point in discussions amongst researchers, policy advocates, and institutional actors. The attainment rate, calculated as the share of adults possessing a postsecondary credential, provides one indication of how well-equipped a population’s workforce is to compete for high-skilled, high-paying jobs.
Roughly a decade ago, two initiatives helped generate increased focus on educational attainment in the United States. In February 2009, Lumina Foundation published the first of its annual “Stronger Nation” reports. This report detailed trends in attainment at both the national and state levels and established a nationwide target of 60 percent attainment by 2025.[1] A few months later, newly inaugurated President Barack Obama announced the “American Graduation Initiative,” which set a goal of producing five million additional college graduates by 2020 in an effort to achieve “the highest college graduation rate of any nation in the world.”[2] Driven to action by these and similar efforts, many states began advancing their own postsecondary attainment initiatives. As of 2019, all but five states had publicized a state-specific goal for postsecondary attainment.[3]
As part of a larger effort to understand the role of state policy in improving access and attainment, Ithaka S+R developed a projection tool that forecasts long-run changes in attainment levels. This tool serves as the foundation for the findings presented in this report. Additionally, we believe the tool can be useful in evaluating state attainment goals and strategies used to achieve them. The accompanying tool enables policymakers to change a range of inputs, which are described in this report, to assess how state policies may impact attainment in the long run. For states seeking to set a goal, or reconfigure their current goal, the tool also lets the user see how changes in the goal characteristics (e.g., target year, age group, or attainment level) impact the likelihood of meeting it.
The State Attainment Projection Tool can be downloaded at https://sr.ithaka.org/our-work/state-attainment-rate-projection-tool.
In this report, we assess how states are doing against their attainment goals. To do this, we project the attainment rate in each state and compare our projection in the state’s target year to the state’s goal. Our baseline projection assumes that past trends continue, in terms of both levers that affect traditional pathway students—like the high school graduation rate, college going rate, and college graduation rate—and adult learning gains. We also account for changes in attainment as the current population ages. We project the population in each state and estimate the degree to which states’ attainment rates will improve as younger residents, who are more educated in most states, age and replace older cohorts in the target population.
Overall, we project that attainment is likely to increase in the coming years. In our baseline scenario, we project attainment increases in all 50 states over the next decade, with 45 states forecast to increase attainment by at least five percentage points. However, despite these projected gains, we forecast that only three states are likely to achieve their attainment goal by their target year. Absent additional improvements, the U.S. is not on track to achieve 60 percent attainment until the year 2032. Our projections suggest incremental improvements for traditional pathway students—beyond those already incorporated into our baseline scenario—will not be enough to meet the national target or most state targets. To achieve most state’s attainment goals, adult learners must earn credentials at a faster rate than they have in the past. Closing attainment gaps by race and other characteristics must also be part of the solution in many states.
Fortunately, a number of states have embarked on aggressive efforts to improve attainment that can provide a model for others to follow. We review the strategies used by states in conjunction with their attainment goals. Through targeted policies, we believe states can move the needle on their attainment rates and come closer to ambitious goals. As discussed in our earlier policy brief, setting an ambitious attainment goal can serve as a catalyst for improvement and result in lasting coalitions that can sustain momentum towards attainment growth long after the goal is reached.[4] We believe the accompanying projections tool can help state leaders plan their attainment goals, evaluate their progress towards the goal, and project the impact of specific policies and strategies on this progress.
Attainment Goals
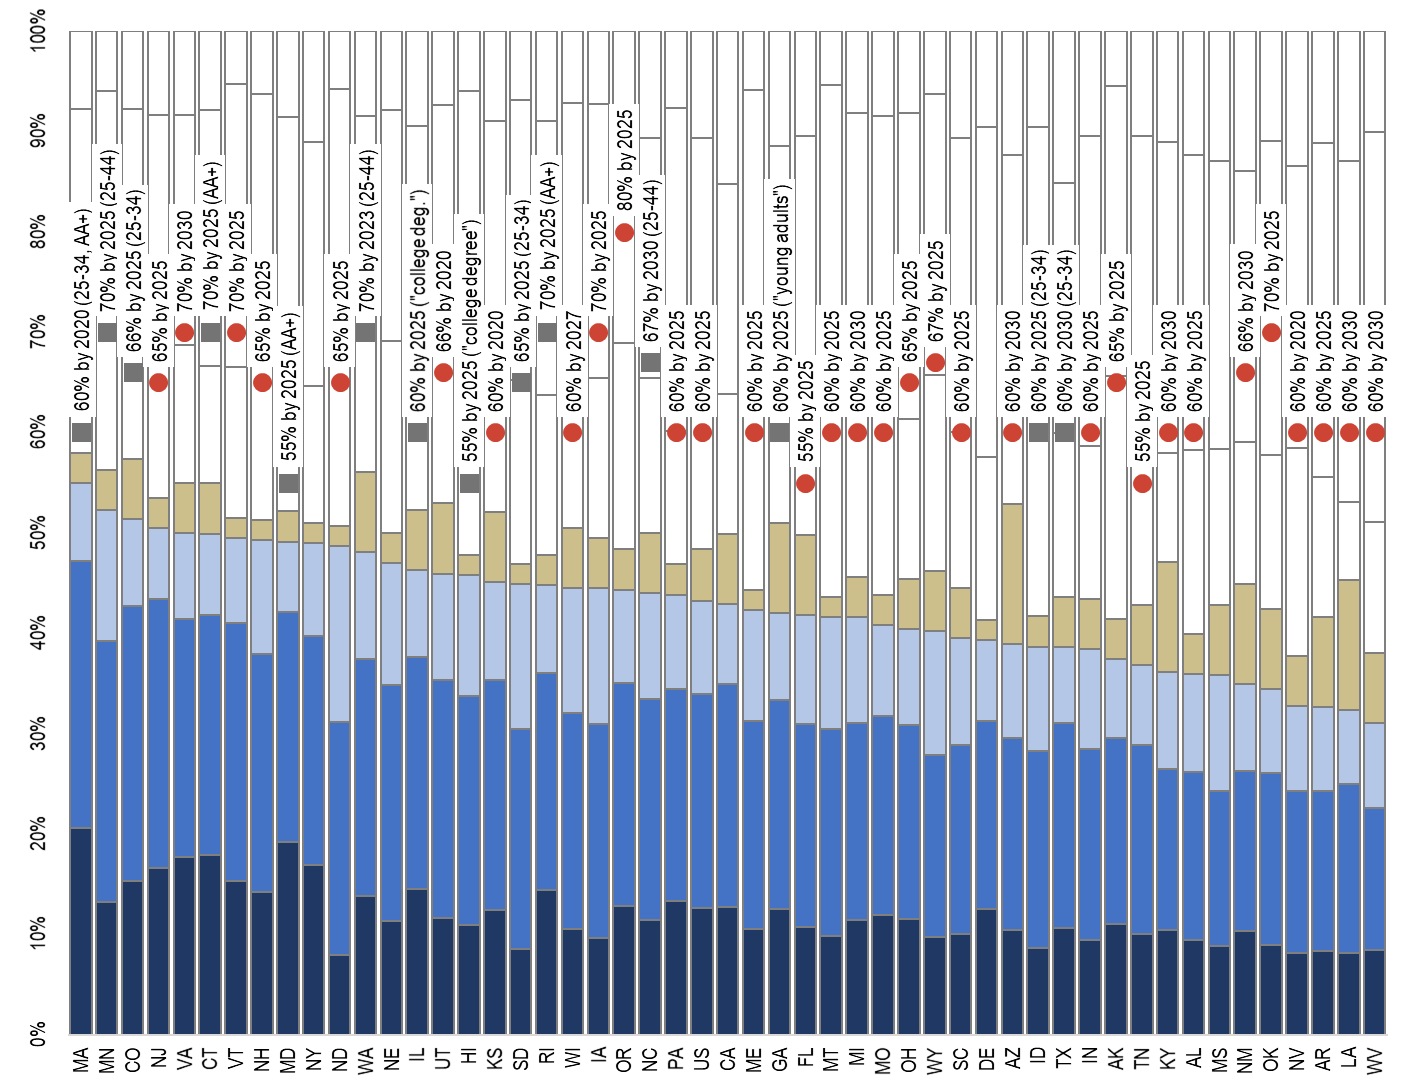
As Figure 1 illustrates, there is considerable variation across states both in terms of their current postsecondary attainment levels and the goals they have set. Some states appear to have adopted Lumina’s national goal of 60 percent attainment by 2025 as their own, while others have chosen goals that differ in terms of the target attainment level and year as well as the age range and credentials considered. Of the 45 states with attainment goals, four have set a goal below 60 percent, 21 have targeted exactly 60 percent, and 20 have targeted above 60 percent. Most states have set goals for the 25-to-64-year-old target population—sometimes referred to as the “adult population” or “working age adults” in states’ goal-setting documents—but nine are targeting a younger age group. While 40 states count at least some certificates towards their attainment goal, five states count only an associate’s or higher degree.[5] State goals also vary in their target year, with targets ranging from 2020 to 2030.[6]
There are also noticeable differences in states’ ambitions in establishing their goals. As of 2013, the year its goal was set, Maryland was nine percentage points below its 2025 goal. As of 2016, the year its goal was set, Oklahoma was 28 percentage points below its 2025 goal. As shown in Figure 1, there appears to be little relationship between states’ goals and their current attainment. While attainment varies significantly across states, many states have set the same, or very similar, attainment goals. For a number of states, it appears that their current attainment rate has been, at best, a secondary consideration in setting their attainment goal.
Figure 1. States vary both in their current attainment rates and their goals
Source: Attainment from the 2018 American Community Survey. Goals from Lumina Foundation and Ithaka S+R research.
Using past data to predict future trends for each state and the nation as a whole, we developed a baseline attainment projection that represents the likely trajectory in the state (or the nation) should past trends in key drivers of attainment continue into the future. This section describes the state-level drivers of attainment we identified, our assumptions about those drivers, and the methodology we used to predict states’ future attainment trends. Figure 2 summarizes the main drivers in our baseline projection methodology.
Figure 2. The baseline attainment projection model assumes past trends in key attainment drivers continue into the future.
| Driver | Description |
|---|---|
| Population | We project the number of adults by age cohort (e.g., 25-29-year-olds) in each state based on the population in 2018 and historical changes in population in the state—due to migration and mortality—as people age. |
| Aging | We project the impact on attainment as cohorts of younger people, who typically have higher levels of education, replace cohorts of older people in the target population (e.g.,25-to-64-year-olds). |
| Adult learning | We use past changes in adult attainment to project how the attainment rate of a particular age cohort (e.g., 40-to-44-year-olds) will change though degree acquisition, mobility, or other causes, as that cohort gets older. |
| Traditional pathway students | We incorporate recent gains in the high school graduation rate, college going rate, and college graduation rate into the attainment rate as cohorts affected by these gains enter the target population; we also assume recent improvements in these high school and college rates continue into the future. |
| Certificates | We assume the certificate rate remains constant in the baseline scenario. |
| Source: Ithaka S+R attainment projection model. | |
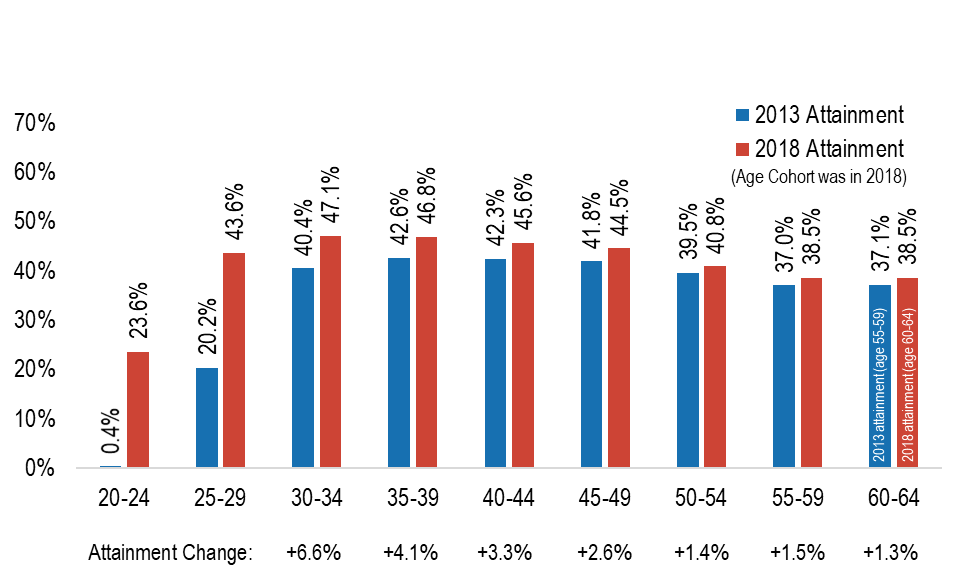
The key drivers of aging and adult learning are closely related. Both are illustrated in Figure 3, which shows the attainment rate by five-year age cohort in the United States. For each age cohort, the right-most bar shows the 2018 attainment rate for that cohort. As shown in the figure, the national attainment rate tends to be higher for younger cohorts than for older cohorts. This phenomenon leads to the “aging” driver, as described in Figure 2. As less-educated, older cohorts exit the 25-to-64-year-old target population and are replaced by more educated, younger cohorts, overall attainment is projected to increase.
Figure 3. Adult learning: younger Americans are more educated than older Americans, and attainment tends to increase as cohorts age.
Source: 2018 American Community Survey (ACS). Note: attainment rate in this figure includes associate’s degrees and higher, since certificate completion is not captured by the ACS.
Figure 3 also illustrates the adult learning assumptions built into our baseline scenario. While the right bar for each age cohort shows 2018 attainment, the left bar shows 2013 attainment for the same cohort when they were five years younger. As we see on the far right of the graph, in 2013, the attainment rate of 55-to-59-year-olds in the U.S. was 37.1 percent. By 2018, the attainment rate of 60-to-64-year-olds—the same cohort of people, five years later—was 38.5 percent. This cohort increased attainment by 1.3 percentage points over five years, a phenomenon we refer to as “adult learning.” In our baseline model, we average the adult learning gains for all age bands from 2013 to 2018 with those of the two prior cohorts—2012 to 2017 and 2011 to 2016—and assume these gains continue into the future.
Because adult learning gains are based on gains in a five-year cohort, the youngest cohort for which we have estimates is 30-to-34-year-olds. Gains for 25-to-29-year-olds would be based on changes from when these individuals were 20-to-24-year-olds, which are captured in our traditional pathway projection drivers. Specifically, we start with the 2018 attainment rate for 25-to-29-year-olds and adjust this attainment rate based on recent (or forecast) changes in the high school graduation rate, college going rate, or college graduation rate.
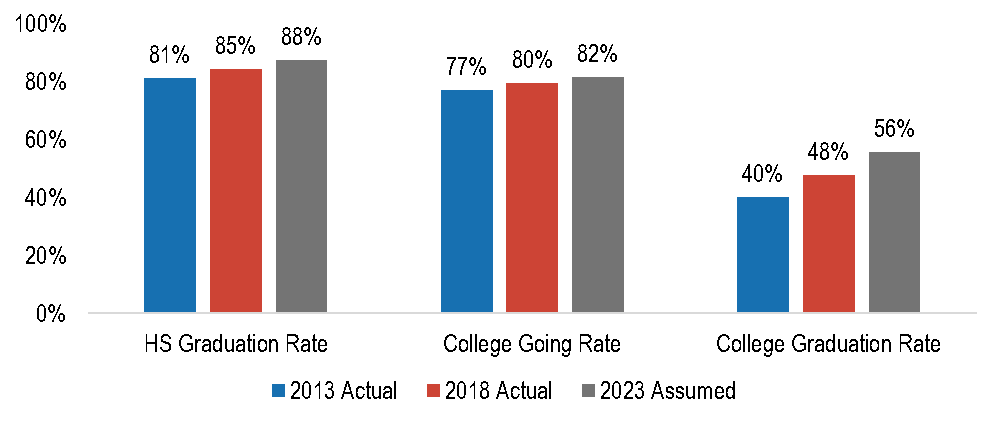
Figure 4. Traditional pathway students: the baseline scenario projects that past gains in the high school graduation rate, college going rate, and college graduation rate will continue into the future.
Source: National Center for Education Statistics (NCES). National Student Clearinghouse. IPEDS. Ithaka S+R attainment projection model. Note: the 2018 high school graduation rate is not available as of publication, so the 2017 high school graduation rate is used instead.
The traditional pathway student drivers have important impacts for the long-term projections. Nationally, the high school graduation rate, college enrollment rate, and college graduation rate have all increased in recent years. These increases are built into our baseline scenario in two ways. First, for increases that have already happened, we project the impact of those increases on attainment as traditional pathway students age into the target population (e.g., 25-to-64-year-olds). Second, our baseline scenario assumes that going forward (i.e., in 2019 and beyond), the high school graduation rate, college going rate, and college graduation rate continue to increase at the same rate they have over the immediately preceding five years (i.e., from 2013 to 2018).[7]
Figure 4 shows the recent gains in each traditional pathway lever and the projection built into our baseline model. Over the past five years, the national high school graduation rate has increased by 3.2 percentage points, from 81.4 to 84.6 percent. For the purpose of generating our baseline scenario, we project these gains will continue into the future, such that by 2023, the U.S. will have an 87.8 percent graduation rate. We project similar increases for the college going rate and college graduation rate.[8]
The final piece of the projection is the expected change in certificate attainment rates. We assume the certificate rate remains constant for several reasons. First, in the most recent estimates available, the national certificate attainment rate has been close to constant (growing at 0.1 percentage points per year, estimated by Lumina Foundation).[9] Second, the baseline scenario projects a substantial growth in associate’s and higher degrees, and we expect some of these degrees will be earned by current certificate holders (lowering the proportion of people for whom a certificate is their highest degree). Third, the certificate rate is estimated less precisely than many other elements of the model, since it is not captured in the American Community Survey, and we think it is preferable to avoid small changes in the certificate rate assumption driving results in the baseline scenario. Fourth, although the number of certificates awarded by Title-IV institutions increased dramatically from 2000 until 2010, this number has remained fairly static between 2010 and 2017.[10]
One point to emphasize is that our projection methodology is not a top-line forecast that only projects future gains in attainment based on past trends in attainment. Rather, we build our projections from multiple underlying drivers that impact the overall attainment and potential for growth (see Figure 2). We do this for two reasons. First, we believe the underlying drivers provide a more nuanced projection of potential changes in state attainment rates by accounting for multiple aspects of population changes. Second, we believe deconstructing the model into underlying drivers makes the tool more useful as state policymakers take proactive steps to improve their state’s attainment rate as they can understand how each driver contributes to the overall and future attainment. Such a projection allows us to say something about why we are projecting attainment to change in each state and thus guide policymakers in designing strategies.[11] Additionally, using this methodology, the projection tool can be used as a dynamic model to estimate the impact on attainment of further improvement in any one of our drivers, above and beyond the assumptions in our baseline scenario. The accompanying tool will allow policymakers to adjust assumptions based on their own state-level data and insights into local trends and projected changes. This can also help state leaders forecast the effect of specific policy initiatives on overall attainment in the future.
Exploring the National and State-by-State Results
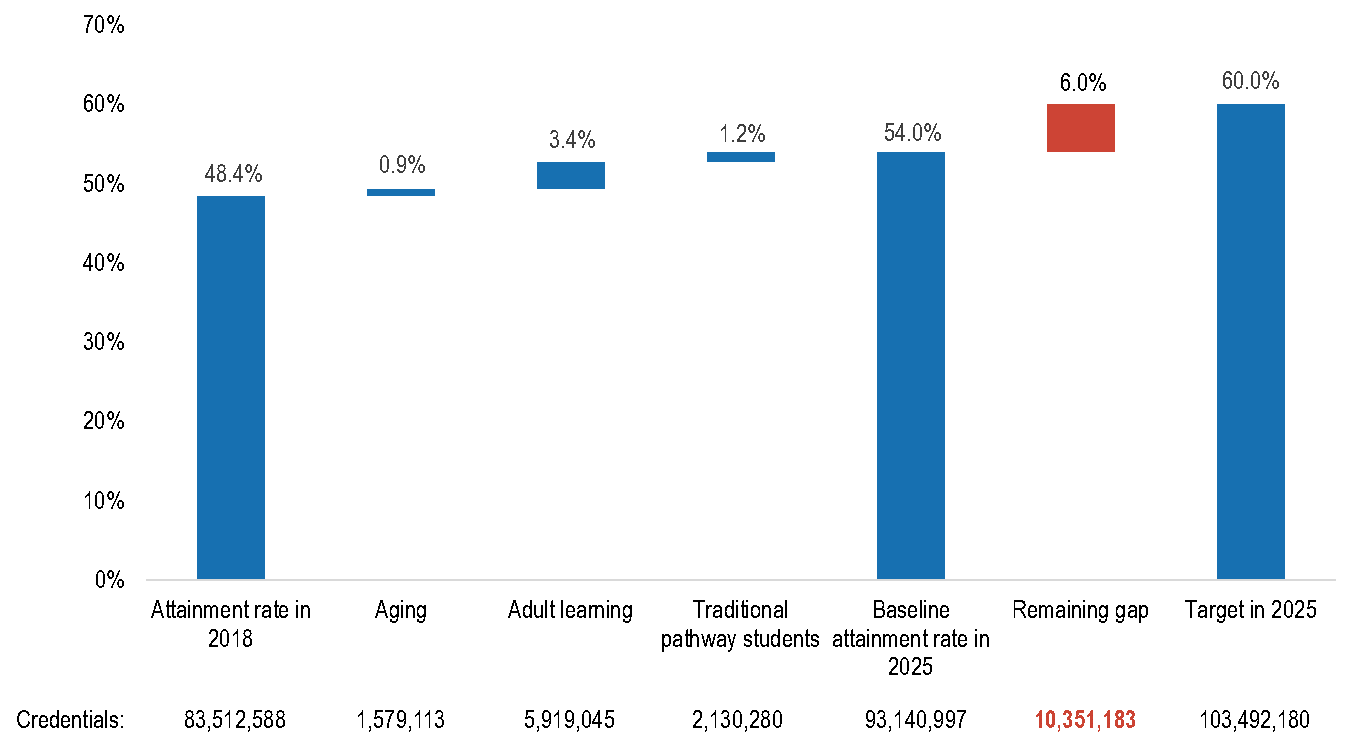
In our baseline scenario, we project the U.S. attainment rate among 25-to-64-year-olds will increase from 48.4 percent in 2018 to 54.0 percent in 2025, as shown in Figure 5.[12] Absent additional gains, however, the U.S. is still likely to fall well short of 60 percent attainment by 2025. In our baseline scenario, we project that in 2025, the nation will be six percentage points below the Lumina goal, corresponding to a shortfall of approximately 10.4 million credentials. If current trends continue, the U.S. is on track to achieve 60 percent attainment by 2032. To achieve the national goal by 2025, the U.S. will need to see greater gains than those assumed in our baseline scenario. We believe these projections serve as a call to policymakers to design and implement targeted strategies to quicken the pace of attainment rate increases.
Of the total attainment increase of 5.8 percentage points, about 0.9 percentage points will be due to the aging effect, whereby over time, more educated younger adults replace less educated older adults in the target population. An additional 3.4 percentage points will be due to adult learning, as adults already in the 25-to-64-year-old target population increase attainment as they age in line with past trends. Finally, the high school and college graduation rates have increased in recent years. As the traditional pathway students affected by these gains age into the target population, we project attainment will increase by an additional 1.2 percentage points by 2025.
Figure 5. The U.S. is projected to increase attainment by over five percentage points by 2025, yet fall more than 10 million credentials short of a 60 percent attainment rate.
Source: 2018 American Community Survey. Lumina Foundation. Ithaka S+R attainment projection model. Note: attainment rate includes certificates.
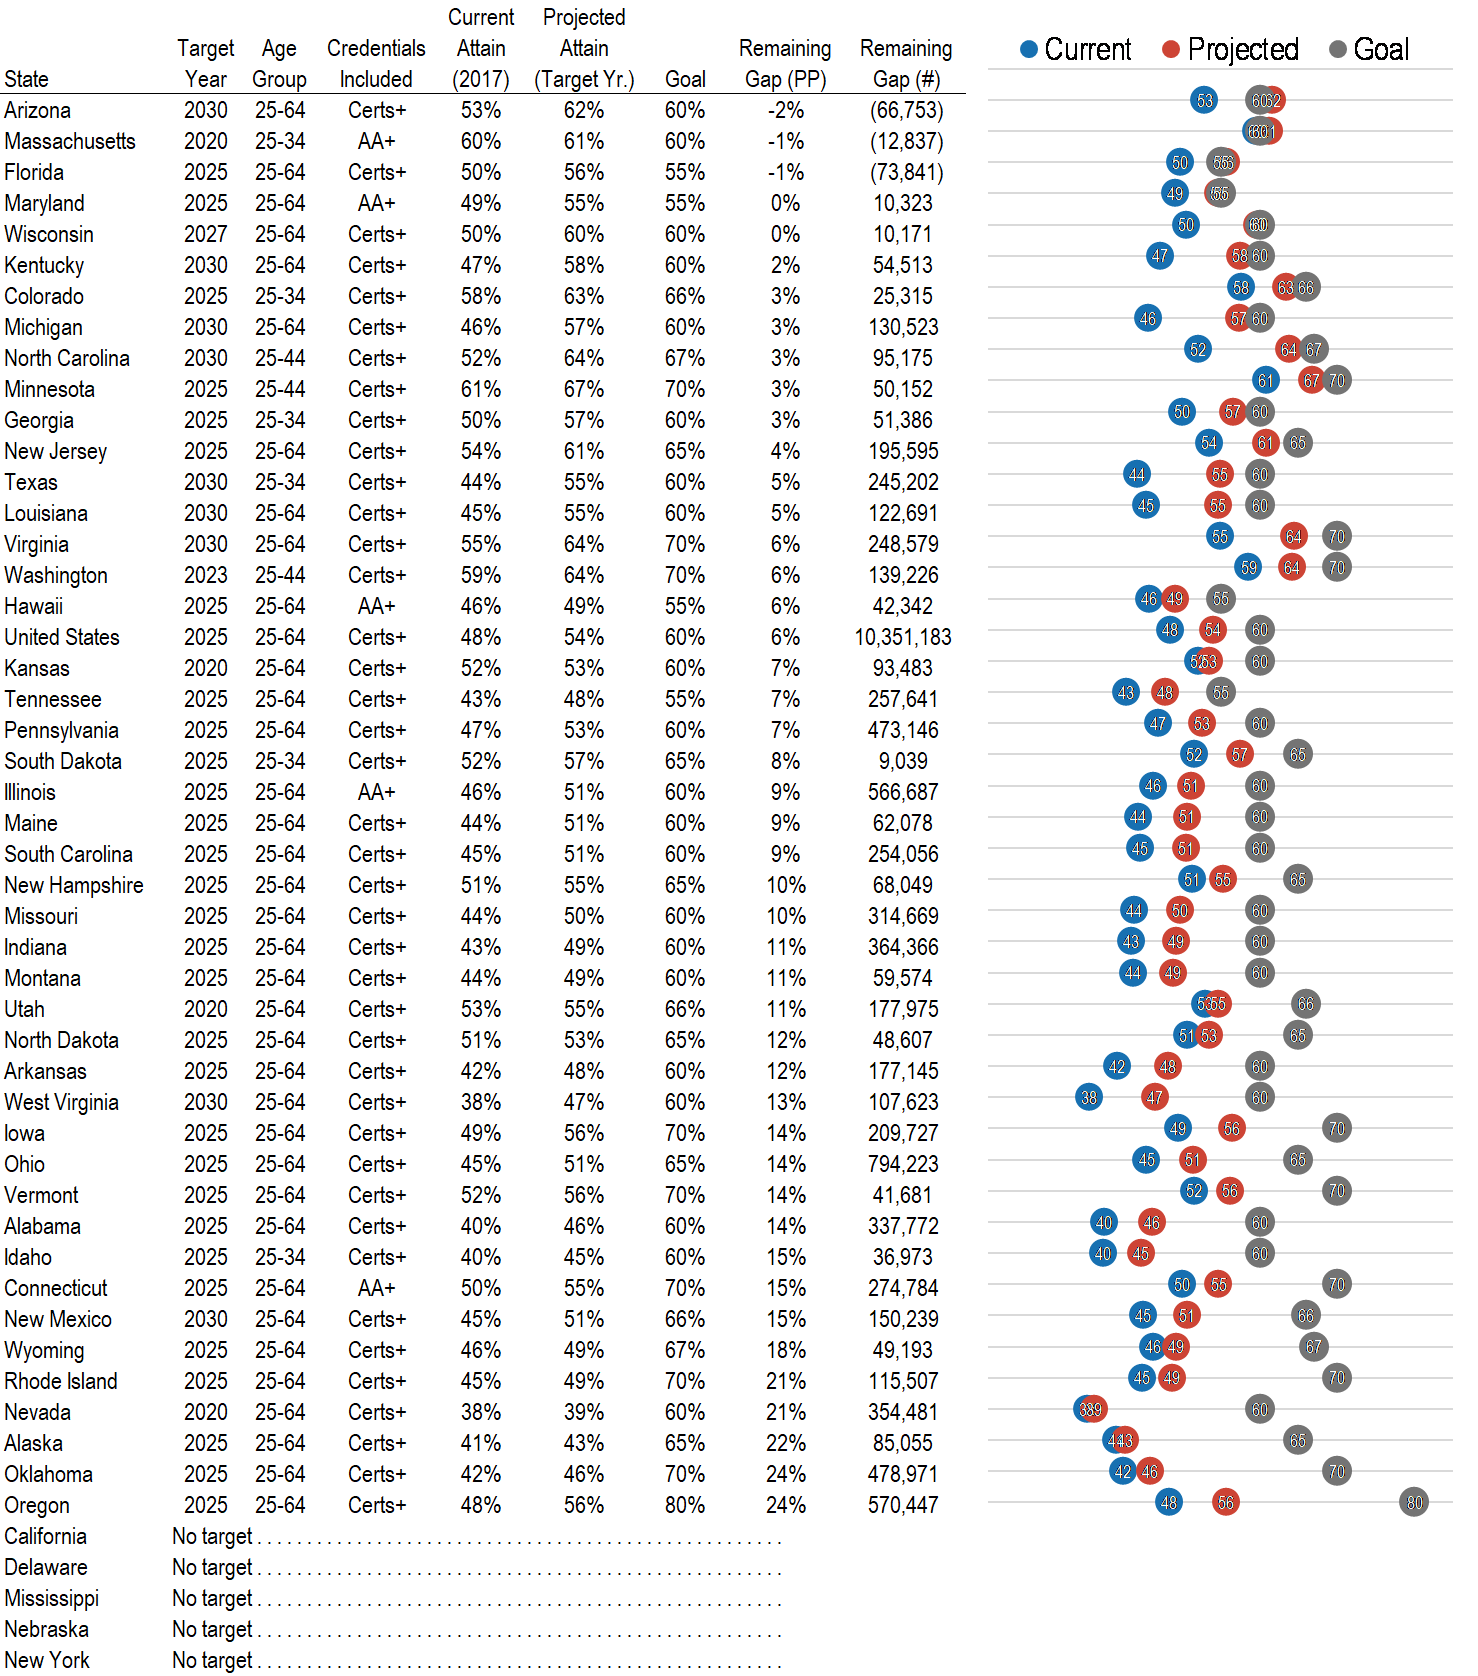
When looking state-by-state, we see a broadly similar picture. All states are projected to increase attainment over the next decade, with 45 states projected to increase attainment by five percentage points or more. However, as shown in Figure 6, few states are projected to hit their attainment goal. Of the 45 states with attainment goals, only four—Arizona, Massachusetts, and Florida—are projected to achieve their goal by their target year. Maryland and Wisconsin are projected to come close to their attainment goals, missing in our baseline scenario by less than half a percentage point. The remaining 40 states are projected to miss their attainment goal by between two and 24 percentage points. Five states—Rhode Island, Nevada, Alaska, Oklahoma, and Oregon—are all projected to miss their attainment goals by 20 percentage points or more, absent improvement above-and-beyond past trends.
Figure 6. Only three states are projected to achieve their attainment goal by their target year.
Source: 2018 American Community Survey. Lumina Foundation. Ithaka S+R attainment projection model. Note: current and projected attainment are based on the age group and credentials included in the state’s target.
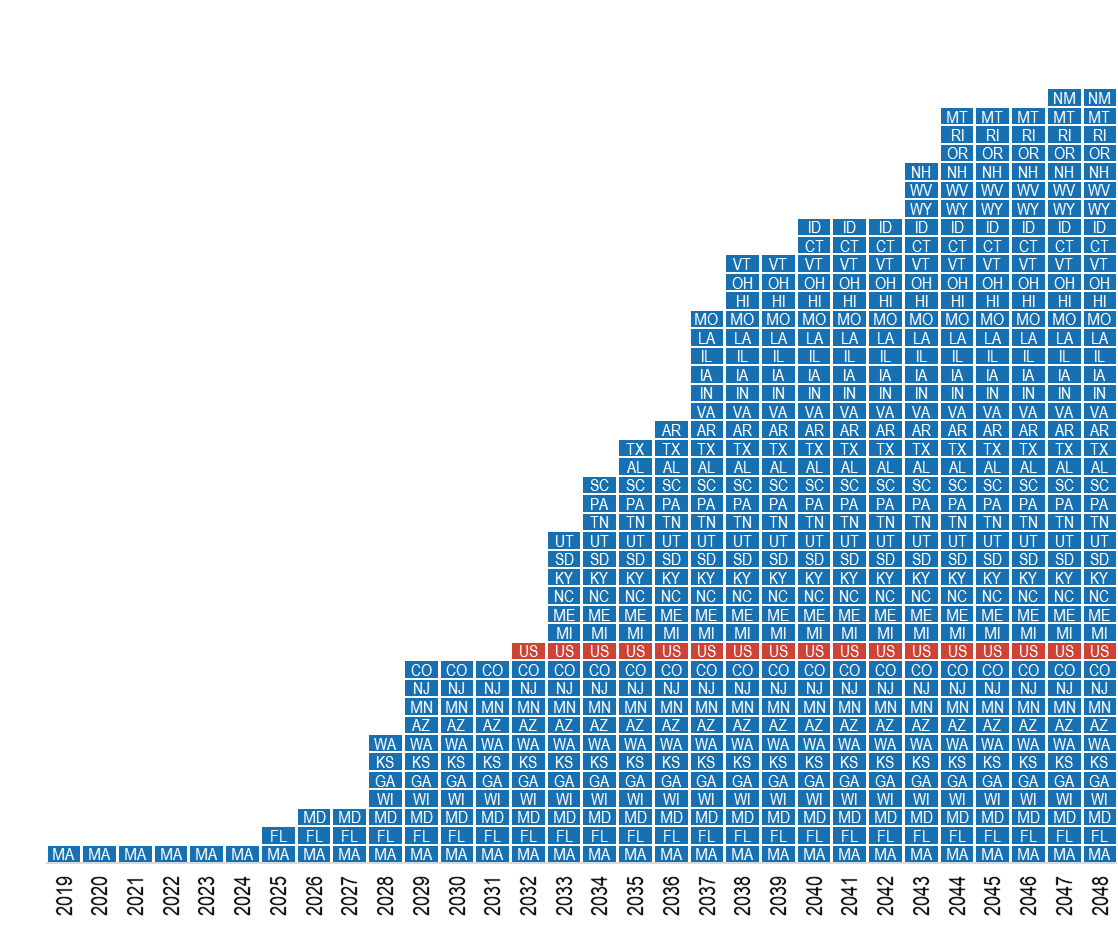
Figure 7. Over the next 30 years, most states are projected to achieve their attainment goal.
Source: Ithaka S+R attainment projection model.
Over time, additional states are forecast to achieve their goals. As shown in Figure 7, 41 states are projected to hit their attainment goals over the next 30 years, though often well after the target date they’ve established. New Mexico, for example, is not forecast to achieve its goal of 66 percent attainment until 2047, 17 years after its 2030 target date.[13] Four states are not forecast to achieve their goals until sometime after 2048, beyond the scope of our 30-year model. While projecting attainment 30 years out is clearly highly speculative, it gives a sense of where state attainment is headed if past trends continue into the future.
These projections and the accompanying tool show policymakers the baseline scenario which does not include the potential impact of policies and programs that influence the model’s inputs, outside of the effects already detected by the trend data. That is, the effects of new and planned policies on attainment are not reflected in the baseline scenario. The tool allows users to adjust the inputs and estimate the effects targeted policies may have. For example, if a state is implementing an adult promise program, the user can adjust the growth of adult learning to reflect the anticipated impact on long-run attainment rates.
Similarly, the tool does not account for the potential for future economic downturns that may result in widespread decreases in higher education spending. It also does not reflect planned changes in funding (e.g., Alaska’s impending budget cuts). Just as policies designed to improve access and attainment may take years to have positive impacts, the impacts of recent budget changes, positive or negative, may not be fully felt immediately and thus not fully reflected in past trends. Research shows us that increases in state postsecondary funding improve access and completion rates, and can thus have large impacts on a state’s attainment rate.[14] The flexibility of the tool allows users to adjust the input assumptions in order to reflect such planned or unplanned changes in funding.
The baseline scenario suggests most states have work to do and it highlights a stark reality: if most states are to achieve their goals by their target dates, they will need to make concerted efforts to improve attainment at a rate faster than they have in the past. We now turn to a discussion of potential ways for states to increase their attainment rates.
Closing the Gap
In this section, we discuss three high-level mechanisms through which states can close the gap between their projected attainment rate and their goal. First, states can increase the number and success rate of traditional pathway students through improving the high school graduation rate, increasing the share of high school graduates who enroll in college, and increasing the college graduation rate. Second, states can raise the attainment rate among adults already in their target population by helping residents in their 30s and older earn credentials. Third, states can work to narrow and close the racial and economic attainment gaps that exist throughout the country. These mechanisms are interconnected, and states need not emphasize only one, though the impact of each mechanism on attainment will depend on the characteristics of the state and the timeframe under consideration.
Traditional Pathway Students
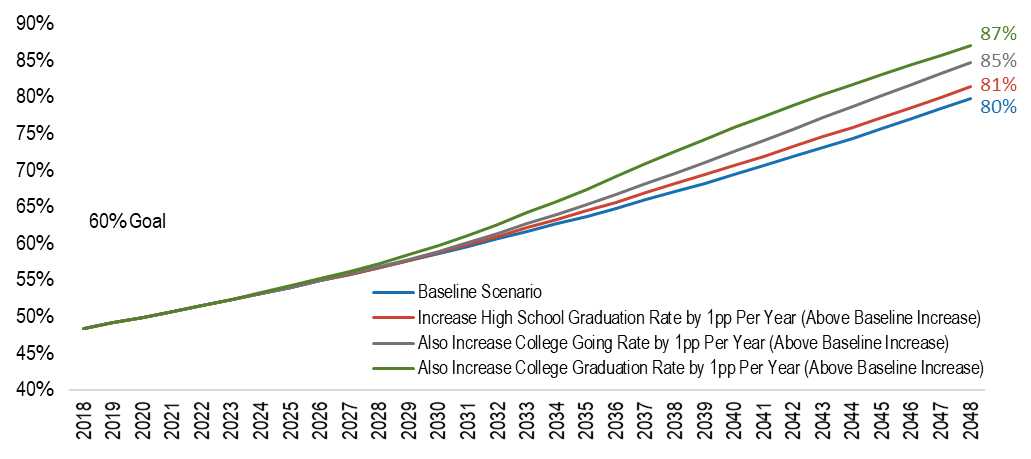
As shown earlier in Figure 4, the baseline scenario assumes a continuation of the fairly robust growth the nation (and most states) have seen in the high school graduation rate, the college going rate, and the college graduation rate. Of course, states can and should work to increase the success rates of traditional pathway students at a faster pace than they have in the past. However, as demonstrated in Figure 8, such efforts are more likely to pay off in the long run than the short run.
Figure 8 projects the national impact of improving the high school graduation rate, college going rate, and college graduation rate by one percentage point per year faster than the increase already built into the baseline model, which we call Scenario 2. As shown in the figure, over the long run, such increases are likely to lead to substantial gains in the attainment rate compared to the baseline scenario. Cumulatively, these increases would lead to an attainment rate seven points higher than the already impressive 80 percent attainment forecast by our baseline scenario in 2048. However, such increases in traditional pathway drivers are likely to have little impact on the attainment rate in 2025, with a combined projected impact of only 0.2 percentage points. Rather than an attainment rate of 54.0 percent, as projected in our baseline scenario, increasing the traditional pathway drivers by one percentage point per year would lead to an attainment rate of approximately 54.2 percent in 2025. This still leaves the U.S. 5.8 percentage points and approximately 10.1 million credentials short of 60 percent attainment.
Figure 8. Scenario 2: Improvements in traditional pathway levers are likely to have little impact on attainment in the short run, though a potentially large impact in the long run.
Source: Ithaka S+R attainment projection model. Note: Projected attainment rate for 25-to-64-year-olds.
Scenario 2 shows an annual increase of one percentage point in each of the traditional student levers, however, each lever has a different potential for gains. In 2019, the national high school graduation rate was 85 percent, college-going rate was 80 percent, and college graduation rate was 48 percent. As a whole, there is much more room to improve college graduation rates and thus policymakers may consider focusing attention on this lever. State leaders should consider the specific rates at which students are moving through the traditional pipeline in order to develop a sound strategy for improving attainment. The flexibility of the attainment tool enables the user to develop multiple scenarios that project the impact of targeting policies and interventions on specific levers.
Adult Learners
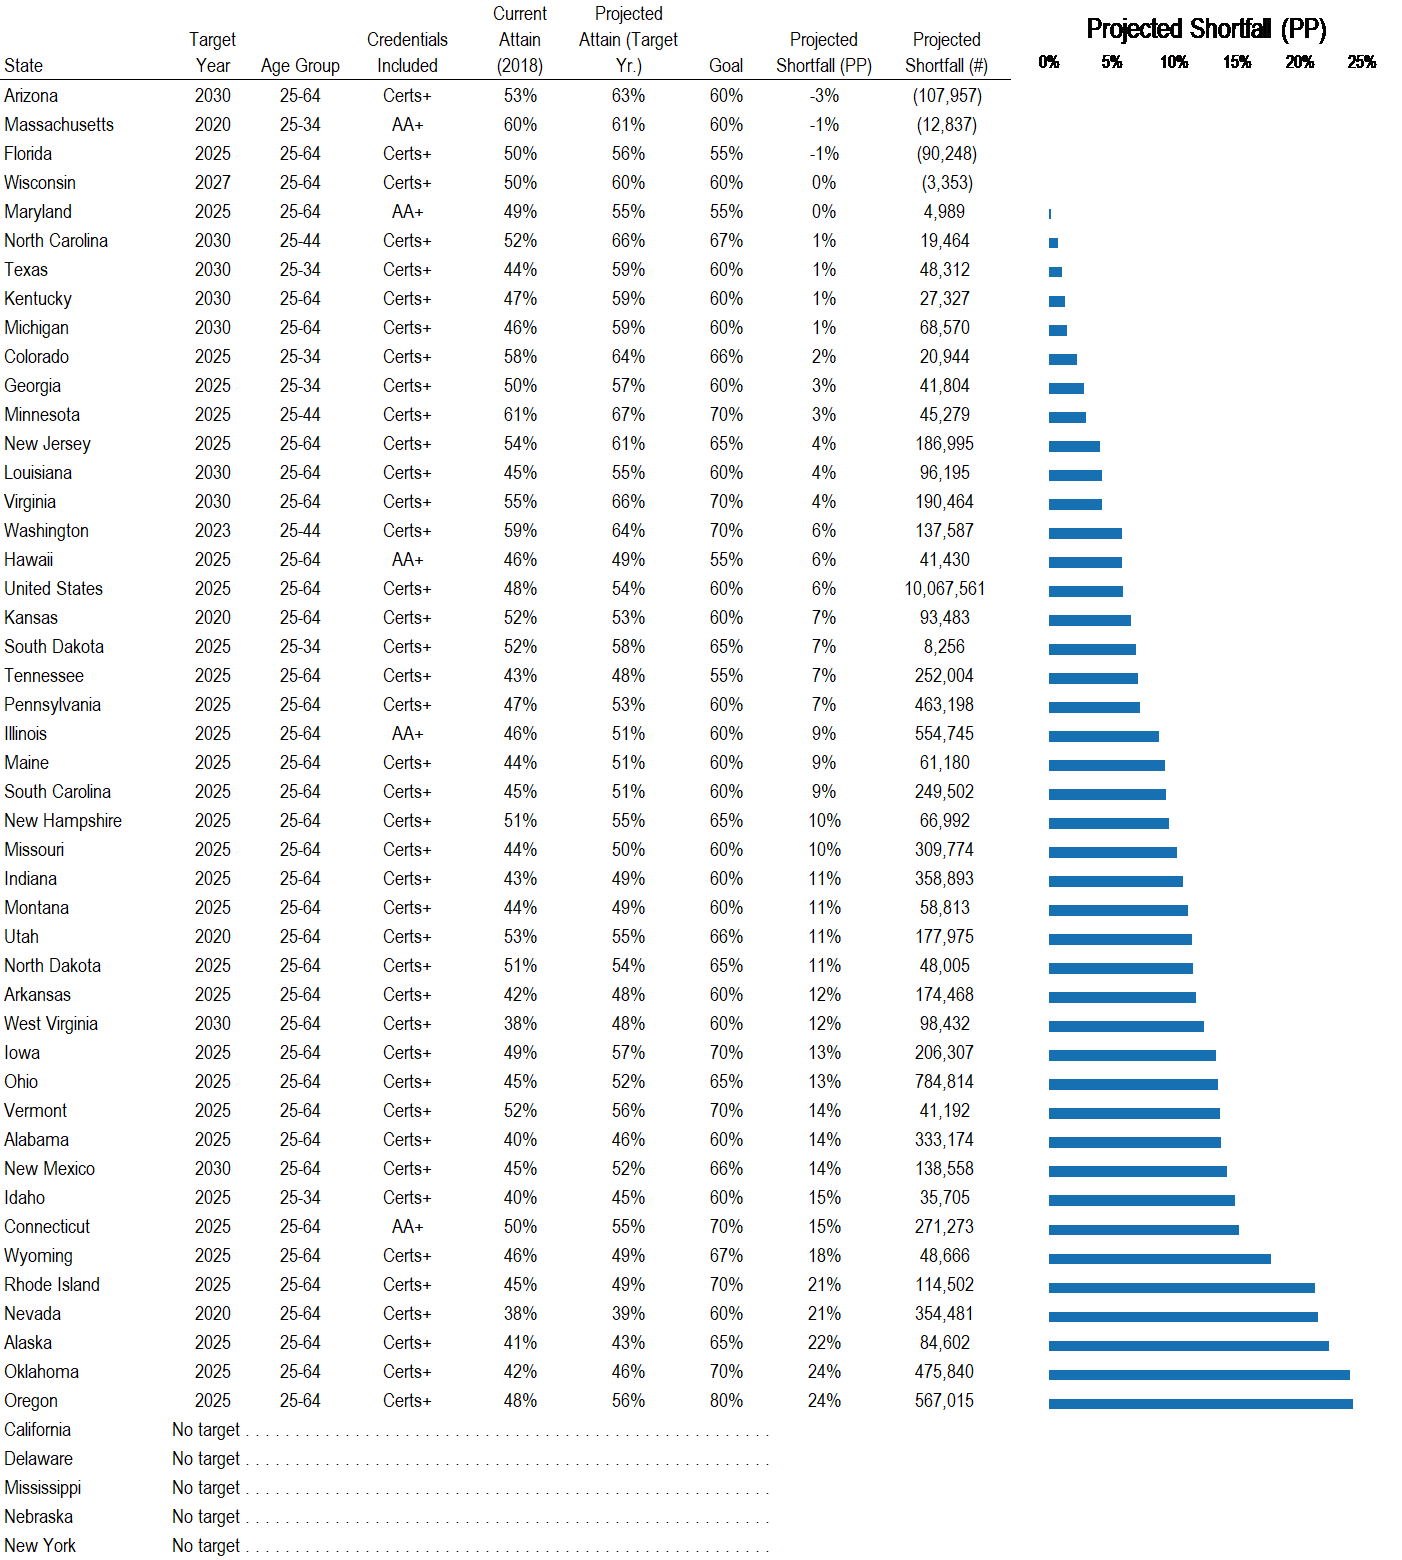
Figure 9 projects the remaining credential shortfall in each state, and the nation, if traditional pathway levers increase one percentage point per year faster than in the baseline scenario. Texas, for example, is projected to be approximately one percentage point, or 48,312 credentials, short of its 2030 attainment goal of 60 percent attainment. This is a substantial improvement over the five-percentage point (or 245,202 credential) gap remaining in our baseline scenario (see Figure 6). To achieve its goal by 2030, Texas can make up this one percentage point gap through incremental gains in adult learning. Given Texas’s relatively youthful age target of 25-to-34-year-olds, there is less room for adult learning to impact attainment than in many other states. Historically, as the 25-to-29-year-old cohort in Texas ages into the 30-to-34-year-old cohort, the attainment rate increases by 6.5 percentage points over five years. To achieve its stated 2030 target, Texas needs to increase this five-year “adult learning” gain by two percentage points, to 8.5 percentage points. Combined with an incremental one percentage point increase in the high school graduation rate, college going rate, and college graduation rate—beyond recent historical increases—such an improvement would put Texas on track to achieve its goal by 2030.
Colorado and Georgia also use a target age group of 25-to-34-year-olds. Although their shortfall is slightly larger than Texas’ —two and three percentage points, respectively—and their target year is 2025, both states are well within striking distance of meeting their goals and stand to benefit more from policies focused on traditional-aged colleges students. Massachusetts also used a younger cohort and is on track to surpass its 2020 attainment goal this year. As described in the technical report in Appendix B, the Ithaka S+R attainment tool includes a feature for users to adjust the age range for the attainment goal as well as the objective year. This enables state leaders to plan future expansions of the attainment goal in order to sustain momentum in improving access and attainment, including the possibility of expanding the target age group.
In many other states, the remaining gap is much larger, even after the incremental traditional pathway improvements assumed in Scenario 2. In Oklahoma, for example, even with these improvements, the state is projected to fall short of its 2025 goal of 70 percent attainment by 24 percentage points, or 475,840 credentials. In a state with approximately two million residents in the 25-to-64-year-old age group, of whom over 800,000 already have a degree or certificate, helping over 475,000 of the remaining 1.2 million residents earn a credential by 2025 is a tall order. However, Oklahoma can hit its goal of 70 percent attainment eventually, and under Scenario 2, which assumes incremental gains in traditional pathway levers that continue into the future, we project Oklahoma will reach 70 percent attainment by 2045. Although 2045 is far off, under the baseline scenario, Oklahoma is not projected to meet its goal in our 30-year projections. Policies targeting adult learners can help to bring this projected year closer to the present. Additionally, such a lofty goal can be helpful for building coalitions among multiple stakeholders and generating momentum towards improving attainment.[15] The accompanying attainment tool can serve as a resource for state leaders to project the effects of new policies and interventions, as well as planning future goals beyond 2025.
Figure 9. Scenario 2: Even with gains in traditional pathway drivers, most states will continue to have a large gap in credentials that must be filled by adult learners.
Source: 2018 American Community Survey. Lumina Foundation. Ithaka S+R attainment projection model. Note: current and projected attainment are based on the age group and credentials included in the state’s target.
Closing the Racial Attainment Gap
The United States has a large racial attainment gap, as shown in Figure 10. Among 25-to-64-year-old residents, whites are 16 percentage points more likely than Blacks and twice as likely as Latinos to have an associate’s degree or higher. Were Blacks, Latinos, and residents of other underrepresented racial and ethnic groups to have the same attainment rate as whites, 11 million additional people would have a degree who currently lack one. In other words, closing the racial attainment gap would be more than sufficient to close the remaining attainment shortfall (10.4 million credentials) we project in our baseline scenario.[16] Over time, as the number of Latino residents is projected to grow, closing the racial attainment gap is likely to have an even bigger impact. However, given the shifting demographics, if policymakers do not make a concerted effort towards closing such gaps, overall attainment rates may be hindered.
Figure 10. The national racial attainment gap represents a shortfall of nearly 11 million degrees for residents of underrepresented racial and ethnic groups.
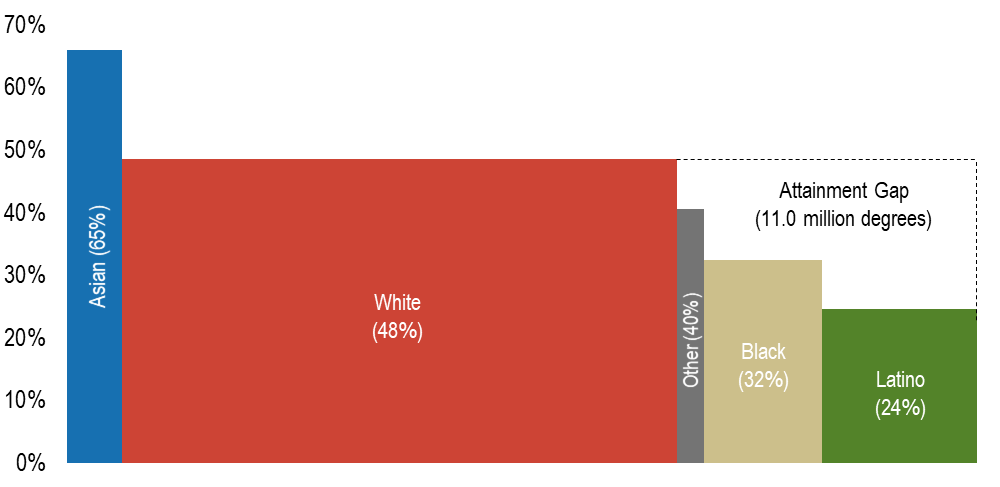
Source: 2018 American Community Survey. Ithaka S+R Attainment Projection Model. Note: width of the bar is proportional to the number of 25-to-64-year-old residents. Figure excludes certificates because this data is not available by race.
Closing the racial attainment gap would have a substantial impact in states that have large populations of historically underrepresented students, as shown in Figure 11. For each state, the left (red) bar shows the percentage point increase in attainment the state would see if the racial attainment gap were closed.[17] The right (blue) bar in the figure shows the percentage point gap between the state’s projected attainment and its goal in its target year, according to our baseline projection.
Figure 11. Closing the racial achievement gap would help most states achieve or come substantially closer to their attainment goal.
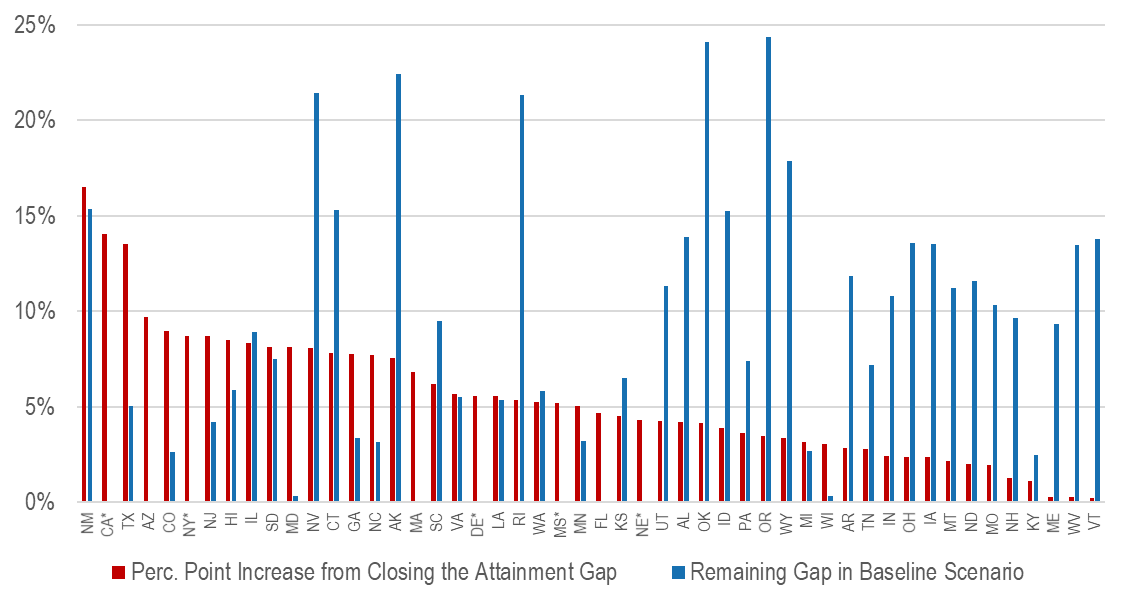
Source: 2018 American Community Survey. Ithaka S+R Attainment projection model. Note: the bar on the left shows the percentage point increase in statewide attainment if any racial/ethnic groups in the state that have an attainment rate lower than whites—potentially including Asians, Blacks, Latinos, and/or Other Races—increased their attainment rate to the attainment rate of whites. The age group and credentials considered are those for which the state goal is set, with certificates excluded. An asterisk (*) indicates that the state does not have a formal attainment goal. For these states, we project the impact of closing the attainment gap for associate’s degrees or higher for 25-to-64-year-old residents.
The impact of closing the racial attainment gap varies dramatically by state. In some states—like New Mexico and Texas—closing the racial attainment gap would lead to a roughly 15 percentage point increase in statewide attainment. These states have large non-white populations and a large racial attainment gap. We estimate that the increase in attainment from closing the racial attainment gap in New Mexico, Texas, and 12 other states would be larger than the remaining gap between the state’s projected attainment rate and its goal in our baseline scenario (not including the three states we already project to hit their goal).
For other states—like Vermont, Maine, and West Virginia—closing the racial achievement gap would have almost no impact on the state’s attainment. As can be seen in Figure A1 in Appendix A, this is for two reasons. First, with whites making up at least 93 percent of the target population in each state, these states have few non-white residents. Second, non-white residents tend to have an attainment rate that is equal or higher to that of white residents in these states. Nonetheless, despite their relative racial homogeneity, these states—like most others—likely have large attainment gaps by income and other characteristics than can be a focus of improvement efforts.
Most states are somewhere in between these two extremes. In Virginia, for example, whites make up 62 percent of the 25-to-64-year-old population and have a 54 percent attainment rate. As shown in Figure A1 Appendix A, Blacks make up 19 percent of the population in Virginia and have a 36 percent attainment rate, while Latinos make up nine percent of the population and have a 32 percent attainment rate. Eliminating the racial attainment gap in Virginia would increase overall attainment by 5.7 percentage points, enough to close the 5.5 percent percentage point gap we project in our baseline scenario between Virginia’s attainment in 2030 and its goal. For states like Virginia, and many others, closing the racial attainment gap—and gaps by income and other factors—will be an important strategy to help them achieve their attainment goal.
What Are States Doing to Meet Their Goals?
In order to meet their attainment goals, states have devised a number of explicit strategies. Just as each state’s context is unique, so are the plans to meet state attainment goals. To better understand state strategies, we have gathered all of the state “plans” for achieving attainment goals we could identify. As of October 1, 2019, there were 39 plans among the 45 states with attainment goals. The plans take the form of state websites, executive orders, and public higher education system planning documents. We limited our search to include only documents explicitly tied to the attainment goal. That is, while a state may have general higher education strategy documents, we focused our analysis on those explicitly strategizing to meet the stated attainment goal.
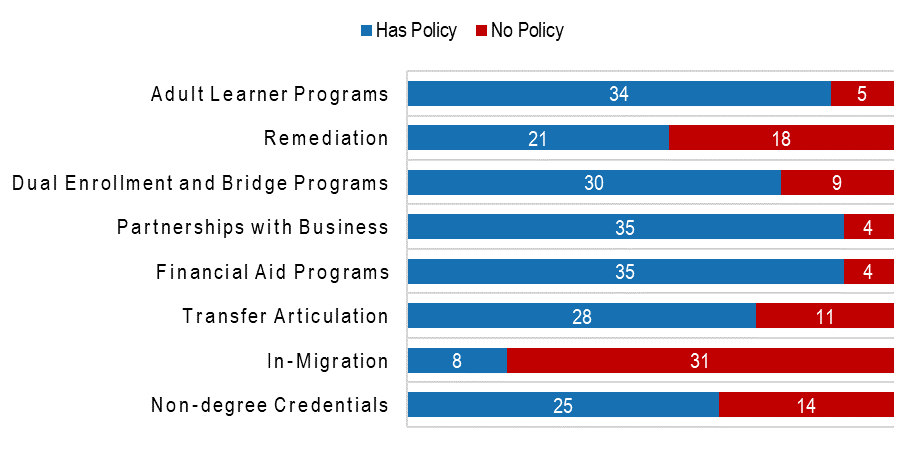
Figure 12. Many states are focusing on financial aid programs, business partnerships, and adult learners to hit their attainment goals.
Using content analysis methods, we evaluated the strategies to provide a national overview of states’ approaches. The categories of policies are derived from our review of the extant literature on higher education policy. This review culminated in multiple policy briefs that summarize established and burgeoning policy topics that seek to improve access and attainment.[18] Understanding, broadly, the tactics states are using to improve attainment and reach their goals is important for determining the strategies around which state leaders have coalesced and which have been prioritized. This provides contextual information for the evaluation of particular strategies and an individual state’s progress towards its goal.
As Figure 12 shows, some strategies are more prevalent than others. Although 45 states have set attainment goals, we identified only 39 states with explicit plans for meeting those goals. The most common approaches are to partner with the business community and increase financial aid programs to improve access to workforce-related credentials. Additionally, 34 states have explicitly identified adult learners as a priority for reaching attainment goals. As shown earlier in this report, it is unlikely that most states will meet their attainment goals without engaging adult learners and enrolling these students in postsecondary programs. In fact, we believe that targeted strategies will help states outperform our baseline projections. The flexibility of the attainment tool allows for specific estimates of such policies to be factored into long-term projections.
Our analysis also uncovered eight states with explicit strategies to increase in-migration of credentialed adults. That is, in order to meet attainment goals, some state leaders have endorsed the strategy of luring educated adults from other states. While such a strategy may benefit individual states, it will fail to move the country as a whole towards the collective goal of 60 percent attainment by 2025. Such policies may reflect unintended consequences of setting individual state goals. Although state goals are not binding policies or mandates, it is important to consider the incentives for less desirable strategies that may undermine the broader attainment goals.
Figure 13 shows the most common combinations of strategies employed by states. One-third (13 of 39) of states use one of the three most common combinations of the nine specific strategies examined. Unsurprisingly, all three combinations include the five most common strategies: partnerships with business industries, increases in state financial aid, engaging adult learners, dual enrollment programs, and transfer articulation policies. These combinations suggest that a notable proportion of states with explicit strategies are thinking about ways to both increase attainment of older learners as well as improve the traditional pipeline to ensure attainment gains persist into the future. By engaging both high school students and adults, states can make important short-term gains in attainment to help reach goals while simultaneously promoting the long-term prosperity that is associated with a more highly educated workforce.
Figure 13. Some combinations of strategies are more common than others.

Source: Ithaka S+R review of state plans.
Below we highlight strategies specific states have developed to improve attainment rates of traditional pathway students and adult learners, and to increase the number of certificates awarded and close racial gaps. We focus on examples of states making concerted efforts to improve each group using promising practices. We believe these examples can serve as examples for other states seeking to improve attainment rates, although specific approaches must reflect the unique context of each state.
Strategies Targeting Traditional Pathway Students
One strategy states are using to increase attainment is to strengthen the pipeline between high school and college. By increasing college readiness, high school students’ intent to enroll in a postsecondary program, and limiting barriers that arise during the transition, states have explicitly included strategies focusing on the traditional pathway to college. As noted above, these strategies are helpful for the longevity of improving attainment as young people who are college-educated will raise the adult attainment rate over time as they age.
Colorado is one example of a state with an attainment strategy that focuses on strengthening the traditional pathway to college. The state’s deliberate push toward dual enrollment has resulted in the number of high school students taking college courses growing from 15,000 to 38,000 between 2010 and 2016. The dual enrollment options have been coupled with Colorado Early College programs that enable high school students to earn an associate’s degree for free while still enrolled in high school. Additionally, the state has adopted a six-year program, Pathways in Technology Early College High Schools (P-TECH), that lets students earn a high school diploma, an associate’s degree, and gain valuable work experience with partner businesses.[19] Dual enrollment, accelerated degrees, and six-year diploma-degree programs help high school students envision themselves as college students, promote postsecondary credentials as the default next step, and reduce barriers in the pathway from high school to college.
Engaging Adult Learners
From our analyses of projected attainment rate growth, it is clear that most states will be unable to meet their attainment goals without increasing the attainment rate of working adults. As Figure 9 shows, improving the attainment of traditional pathway students alone is unlikely to result in significant attainment gains in the near-term. Although improving attainment rates for younger generations is important for maintaining high long-term attainment rates, the current and impending shortfall of college-educated workers will persist without an explicit strategy to retrain adult workers.
In Maine, for example, the state is expected to fall short of its attainment goal by nearly 45,000 college-educated adults even if traditional pathway levers increase at rates higher than they have in the past (see Figure 9). The state is aware of this challenge and has prioritized retraining adult workers in response. The issue, however, is further exacerbated in Maine due to an aging population. The state’s government, education system, and business community have come together to develop MaineSpark to ensure the state’s workforce remains competitive. A hallmark of the state’s attainment strategy is its Adult Promise which connects adult Mainers to financial aid programs, including the Adult Degree Completion Scholarship to be used at University of Maine System campuses, as well as providing outreach to adult students in order to connect them with cost-effective and flexible program options that meet their lifestyle needs. The program also provides guidance through partner organization to advise adult learners on education and career pathways and connects adult students to wrap-around public services. The Adult Promise program in Maine is an example of a comprehensive approach to reengaging adult students in order to make returning for a postsecondary credential more feasible and bring the attainment goal within closer reach.
The Role of Certificates
For many states, increasing the number of adults with a non-degree credential, such as a postsecondary certificate, is a key strategy for addressing the need for more college educated workers. In Lumina’s national goal, and for many states, the attainment rate includes high-quality workforce certificates. Only 25 states, however, have explicit strategies focused on certificates, and these strategies range in terms of their robustness. States that focus on certificates must be cognizant of ensuring these short-term programs are of high quality. Evidence suggests there is significant heterogeneity in labor market returns for certificates across field of specialization, and that certificates holders are more likely to be employed or may use certificates to switch occupations.[20] Ensuring students enter quality programs will make certificate growth beneficial to students and the state alike.
One strong example is South Carolina’s “New Front Door” to higher education which prioritizes certificate programs for working adults who may have limited time and resources but need a postsecondary credential. The program also hopes to reduce the hesitance to enroll for adults who may be many years out of school. The certificates will focus on career and technical topics and use a competency-based model to facilitate moving through the programs.
South Carolina, like many other states, have planned for certificates to be stackable and be able to be counted towards future degree programs. This feature will help students use certificate programs to springboard to future postsecondary credentials. While this may benefit students who are seeking to advance their education, states must also consider that when certificate earners complete additional credentials, the overall attainment rate remains the same. This underscores the importance for states to maintain a comprehensive suite of strategies to continue engaging non-credentialed residents.
Addressing Racial and Ethnic Gaps
Closing persistent gaps in attainment by race and ethnicity is both a moral and an economic imperative for state policymakers. Not only is providing equitable opportunities to all residents important, an inability to close race/ethnicity gaps in attainment will leave many states ill-prepared to meet the labor market demands from their business communities and will stifle economic growth. Figure 14 provides an overview of states’ inclusion of racial gaps in their strategies for meeting attainment goals. Of the 39 states with defined strategies, 15 do not mention racial gaps, while 24 note the importance of closing such gaps. Of those that note this importance, only seven states have explicit goals for closing the gap.
In Alabama, setting an attainment goal was accompanied by the creation of the Alabama Workforce Council’s State Educational Attainment Committee. The Committee released a set of recommendations and strategies for meeting the attainment goal, some of which recognize the importance of closing attainment gaps by race/ethnicity. One strategy aimed at decreasing attainment gaps is to grow Alabama’s Jobs for America’s Graduates (JAG) program which seeks to improve pathways for high school students from historically underserved groups, including racial and ethnic minorities. The Committee also recommended a comprehensive approach to online marketing of programs that would improve attainment rates for historically underserved groups.
Figure 14. Relatively few states set explicit goals around closing racial attainment gaps.
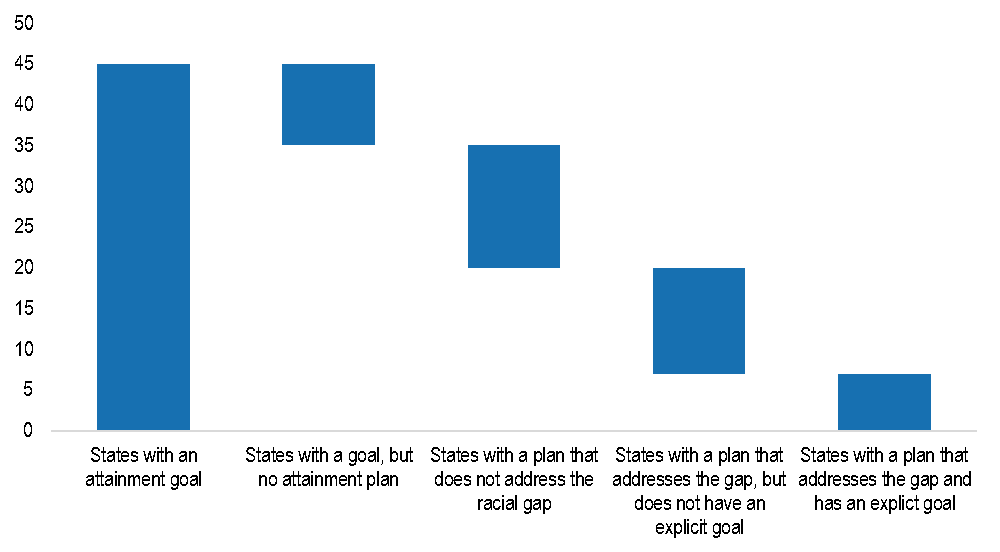
Source: Ithaka S+R review of state plans.
Connecticut, faced with one of the nation’s largest race/ethnicity attainment rate gaps, has included an explicit goal around decreasing the gap. The state’s strategic plan sets a target of reducing the gap between white and minority residents by half, from 29 percentage points to 15 percentage points, by 2025. The state plans to target interventions toward its urban cores, where many of its minority residents live.
Conclusion
Our analysis of state attainment goals has a few important takeaways. First, in the near future, the attainment rate, both nationally and in most states, is likely to increase. In our baseline scenario—which assumes past improvement trends for traditional pathway students and adult learners continue into the future—the national attainment rate is projected to increase from 48.4 percent in 2018 to 54.0 percent in 2025. Over the coming decade, all states are projected to see their attainment rate rise in our baseline scenario, with 45 states forecast to see gains of at least five percentage points.
However, despite these gains, the U.S. is unlikely to meet the 60 percent attainment goal by 2025 at its current pace. Moreover, only a handful of states are projected to meet their goals, even under more generous projections that include marked improvements over recent trends in high school graduation, college going, and college completion rates. Although many states may not meet their goals based on recent trends, there is the potential to come significantly closer to these goals through targeted policies and programs. For example, in 14 states, closing the existing racial attainment gap would likely be sufficient to meet attainment goals, when combined with the continued improvements assumed in our baseline scenario. Other states have the opportunity to enroll adult learners at higher rates to more quickly increase attainment rates.
The accompanying attainment tool allows users to adjust projected trends in sub-groups of students and thus examine the potential effects of policies and interventions on long-run attainment rates and the projected year of meeting state goals. Our baseline scenario presented above projects that most states and the nation will fall short of meeting their goals by the target years if trends from recent years continue. However, the projections do not reflect future changes from new policies and interventions. In the attainment tool, users can modify trends and expected future growth based on planned interventions and state context. Additionally, users can change the details of the goal. We designed the tool to help policymakers plan new interventions and policies and develop updated goals in the future.
Finally, many states have begun to develop strategies to address the issues laid out in this report. Given the diversity of state’s populations and economies, these strategies are necessarily context dependent. Nonetheless, they can serve as a resource for states looking for policies that may boost their attainment and help them come closer to their goal.
The analyses presented here suggest states, and the nation as a whole, have significant work to do in order to increase attainment rates and meet workforce needs. We recommend policymakers take a multipronged approach to improving attainment rates. Closing racial gaps and getting adults back to college are important steps to take to improve workforce readiness. However, coupling these strategies with those aimed at improving outcomes for younger students in the traditional pipeline can help ensure attainment rates remain on an upward trajectory over time and workforce needs are met in the long run.
Appendix A: Racial Attainment Gap by State
Figure A1 – Racial attainment gap by state
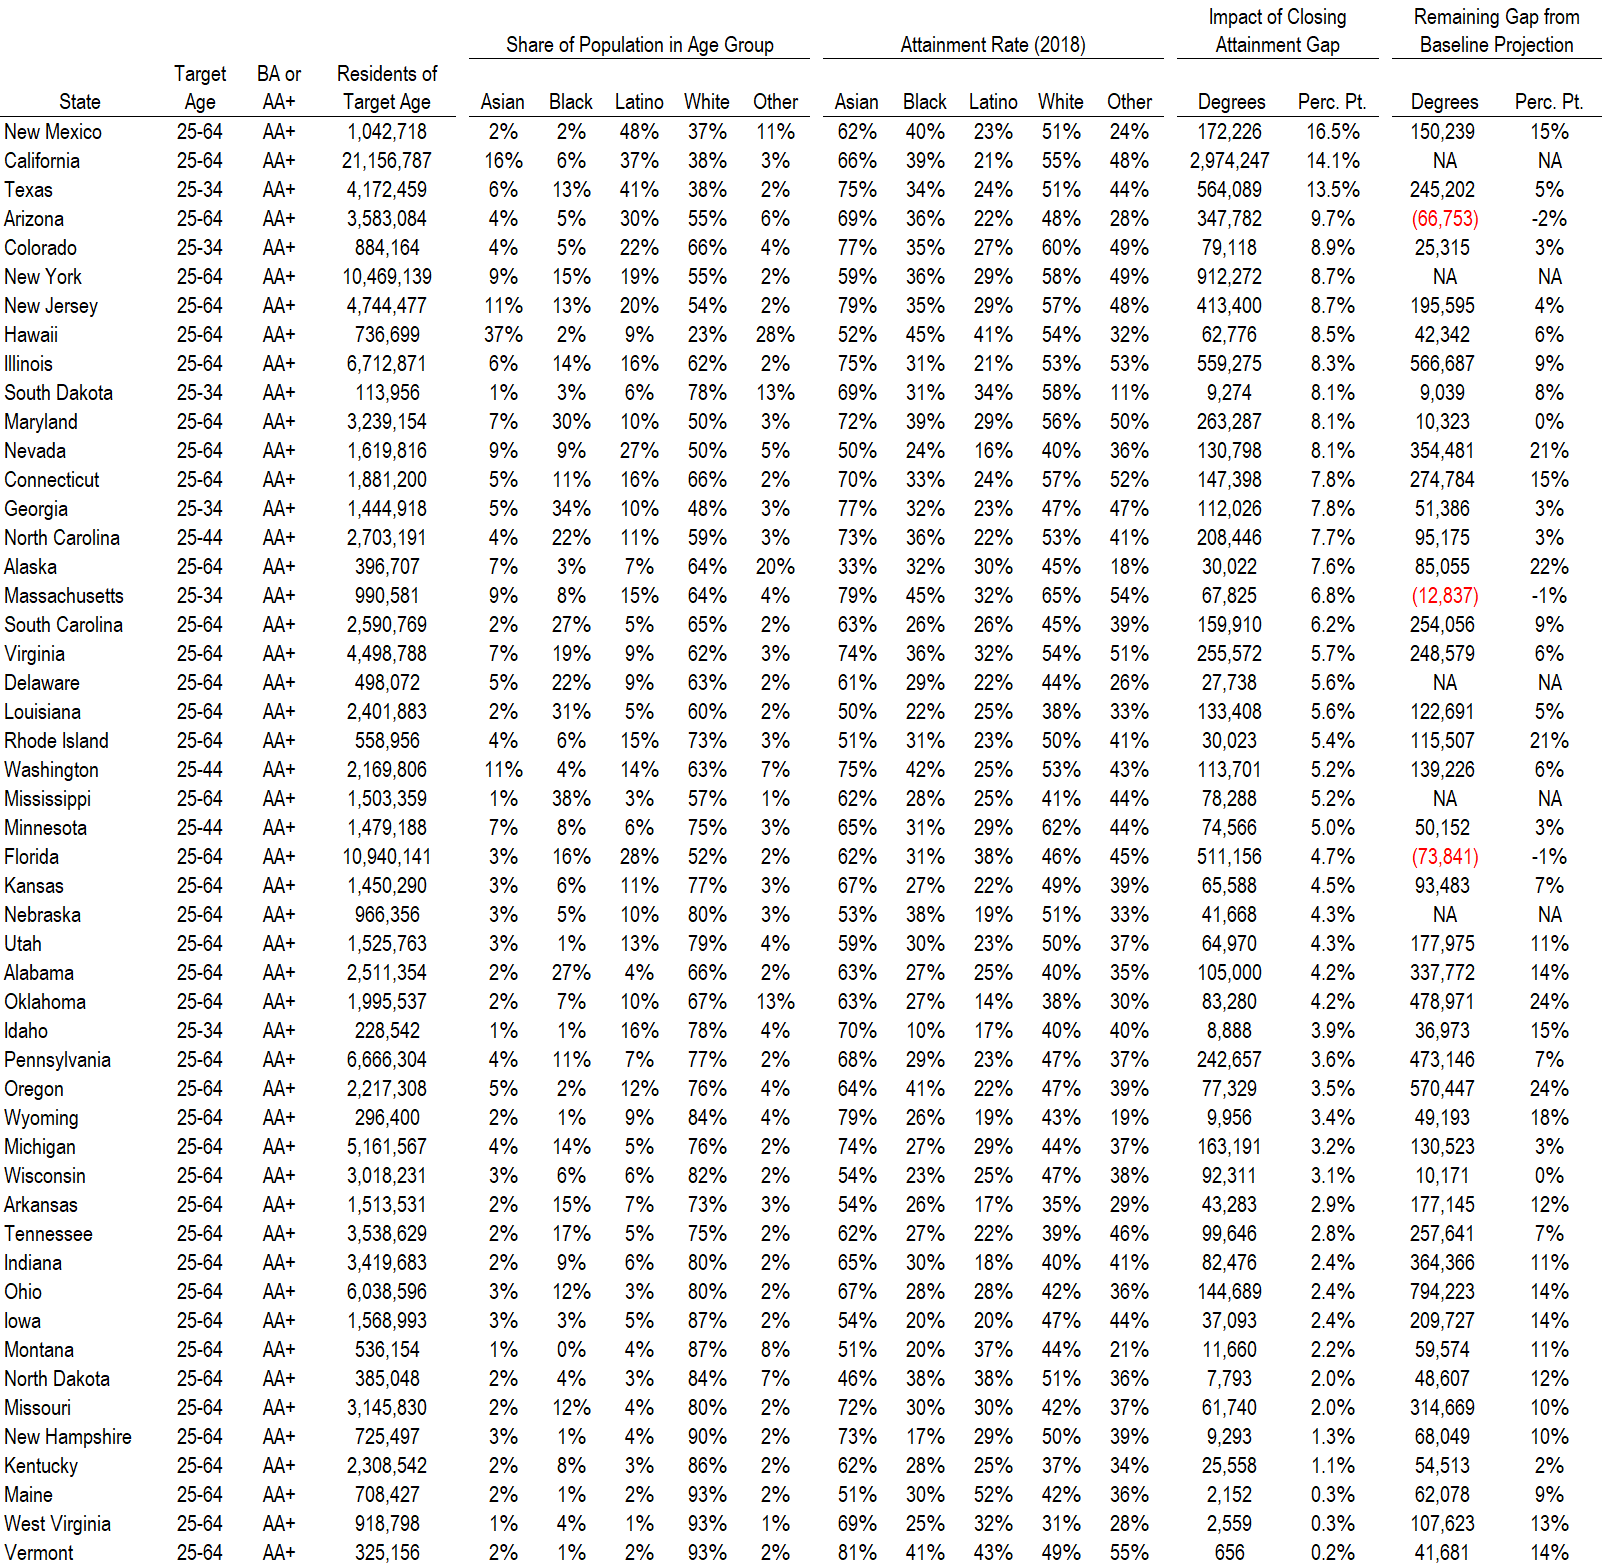
Source: 2018 American Community Survey. Ithaka S+R Attainment projection model. Note: the “Impact of Closing Attainment Gap” shows the increase in statewide attainment if any of the following racial groups in the state that have an attainment rate lower than Whites—Asians, Blacks, Latinos, and Other Race —increase their attainment rate to the attainment rate of Whites. The age group and credentials considered are those for which the state goal is set, with certificates excluded. NA in the “Remaining Gap from Baseline Projection” indicates that the state does not have a formal attainment goal. For these states, we project the impact of closing the attainment gap for associate’s degrees or higher for 25-to-64-year-old residents.
Appendix B: Ithaka S+R State Attainment Rate Projection Tool Technical Guide
This technical guide is intended to aid in the use of the tool for projecting attainment rates under various scenarios. The attainment tool was created to help policymakers, policy advocates, and those interested in increasing educational attainment evaluate each state’s progress toward its attainment goal, project the effects of new policies on future attainment, and reset or design new attainment goals and strategies. As discussed in the report, the majority of states are not projected to reach their attainment goals if past trends continue forward. However, the vast majority of states have devised explicit strategies to improve opportunity for a broad range of students We believe there are three primary ways to use the tool: monitor progress towards a goal, estimate how new initiatives and policies may impact the attainment trajectory and likelihood of meeting the goal, and reset or set new attainment goals.
First, the tool allows the user to examine the progress a given state is making towards the attainment goal. A year-by-year graph and table show the projected attainment rate in relation to the goal, showing both the percentage point shortfall and the estimated number of additional adults who would need a credential to meet the goal. It also indicates the expected year of meeting the goal. The projection is also broken down by the source of growth in attainment, as described in Figure 2 (e.g., adult learning or increased college-going rate). The default projection is to carry recent trends forward, however, the user can modify these estimates. This can be particularly useful if the user has access to more refined state data that indicate a particular growth in one area (e.g., certificates). As modifications are made, the projections are updated continuously.
Second, the flexibility of the tool allows users to incorporate projected policy and intervention effects. Because the tool is built on trends in factors that contribute to attainment rates, the baseline estimates do not incorporate changes beyond the trends. For example, if a state recently passed or is planning to implement an adult promise program that is expected to increase the number of residents over the age of 40 returning to college, these additional adult learning gains would not be reflected in historical trends. By allowing for the adjustment of contributing factors, users can increase the future growth of adult learning in the tool. The tool will automatically adjust for this new growth and provide new projections. This is useful for estimating the effects of new policies as well as providing insight into potential policies. Policymakers can use this feature to estimate the effects of various policies on long-term attainment in order to help in the decision-making process of which to pursue. Moreover, the user can adjust various contributing factors to the point that the goal is met by the target year, and then devise policy solutions to meet the new growth levels of input factors.
Third, the tool can help policymakers set new goals or reset current attainment goals. As discussed in our report, some states are on track to meet their attainment goals in 2020. If state policymakers expect continued economic growth and a continued need for credentialed workers, the tool’s projections can help state leaders set new goals. While some states may meet their goals, we project many states will not meet their targets. However, these states are still projected to increase attainment. We believe it is prudent for higher education advocates and policymakers to build on the momentum and continue progress even if the goal is not met. One way to do this is by resetting and creating a new goal. Finally, some states do not currently have an attainment goal. This tool, and the findings from the accompanying report, can be helpful for these states to set initial attainment goals. The details of the goal—target age, degrees included, and the goal year—can be adjusted to facilitate the planning process.
In order to facilitate the use of the tool, we have created a step-by-step guide. Below, we provide an explanation of each component of the tool and how to use the projections. For a methodological overview of the projection tool, we advise users to reference the body of the report, “Raising the Bar: What States Need to Do to Hit Their Ambitious Higher Education Attainment Goals.” This report explains our methodological approach to building the projections from a series of underlying trends. In addition to serving as the basis for the projections, these underlying data elements are what enable the tool to be fully customizable for the user.
Step-by-Step Guide to Using the Attainment Tool
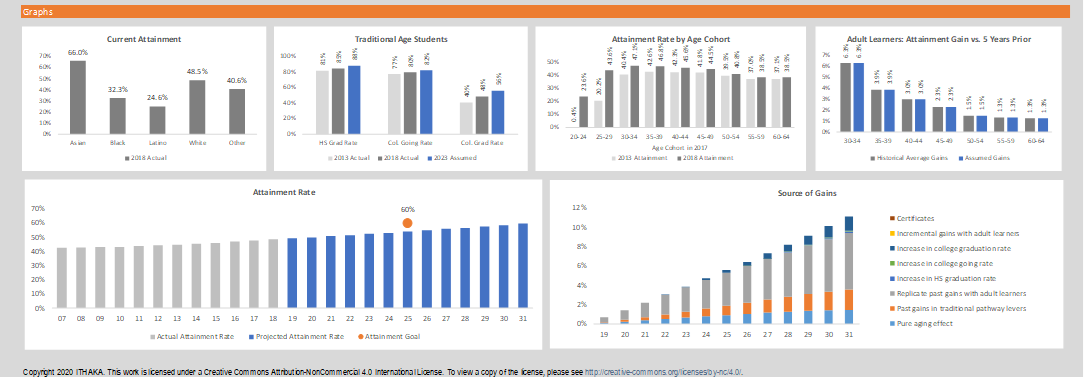
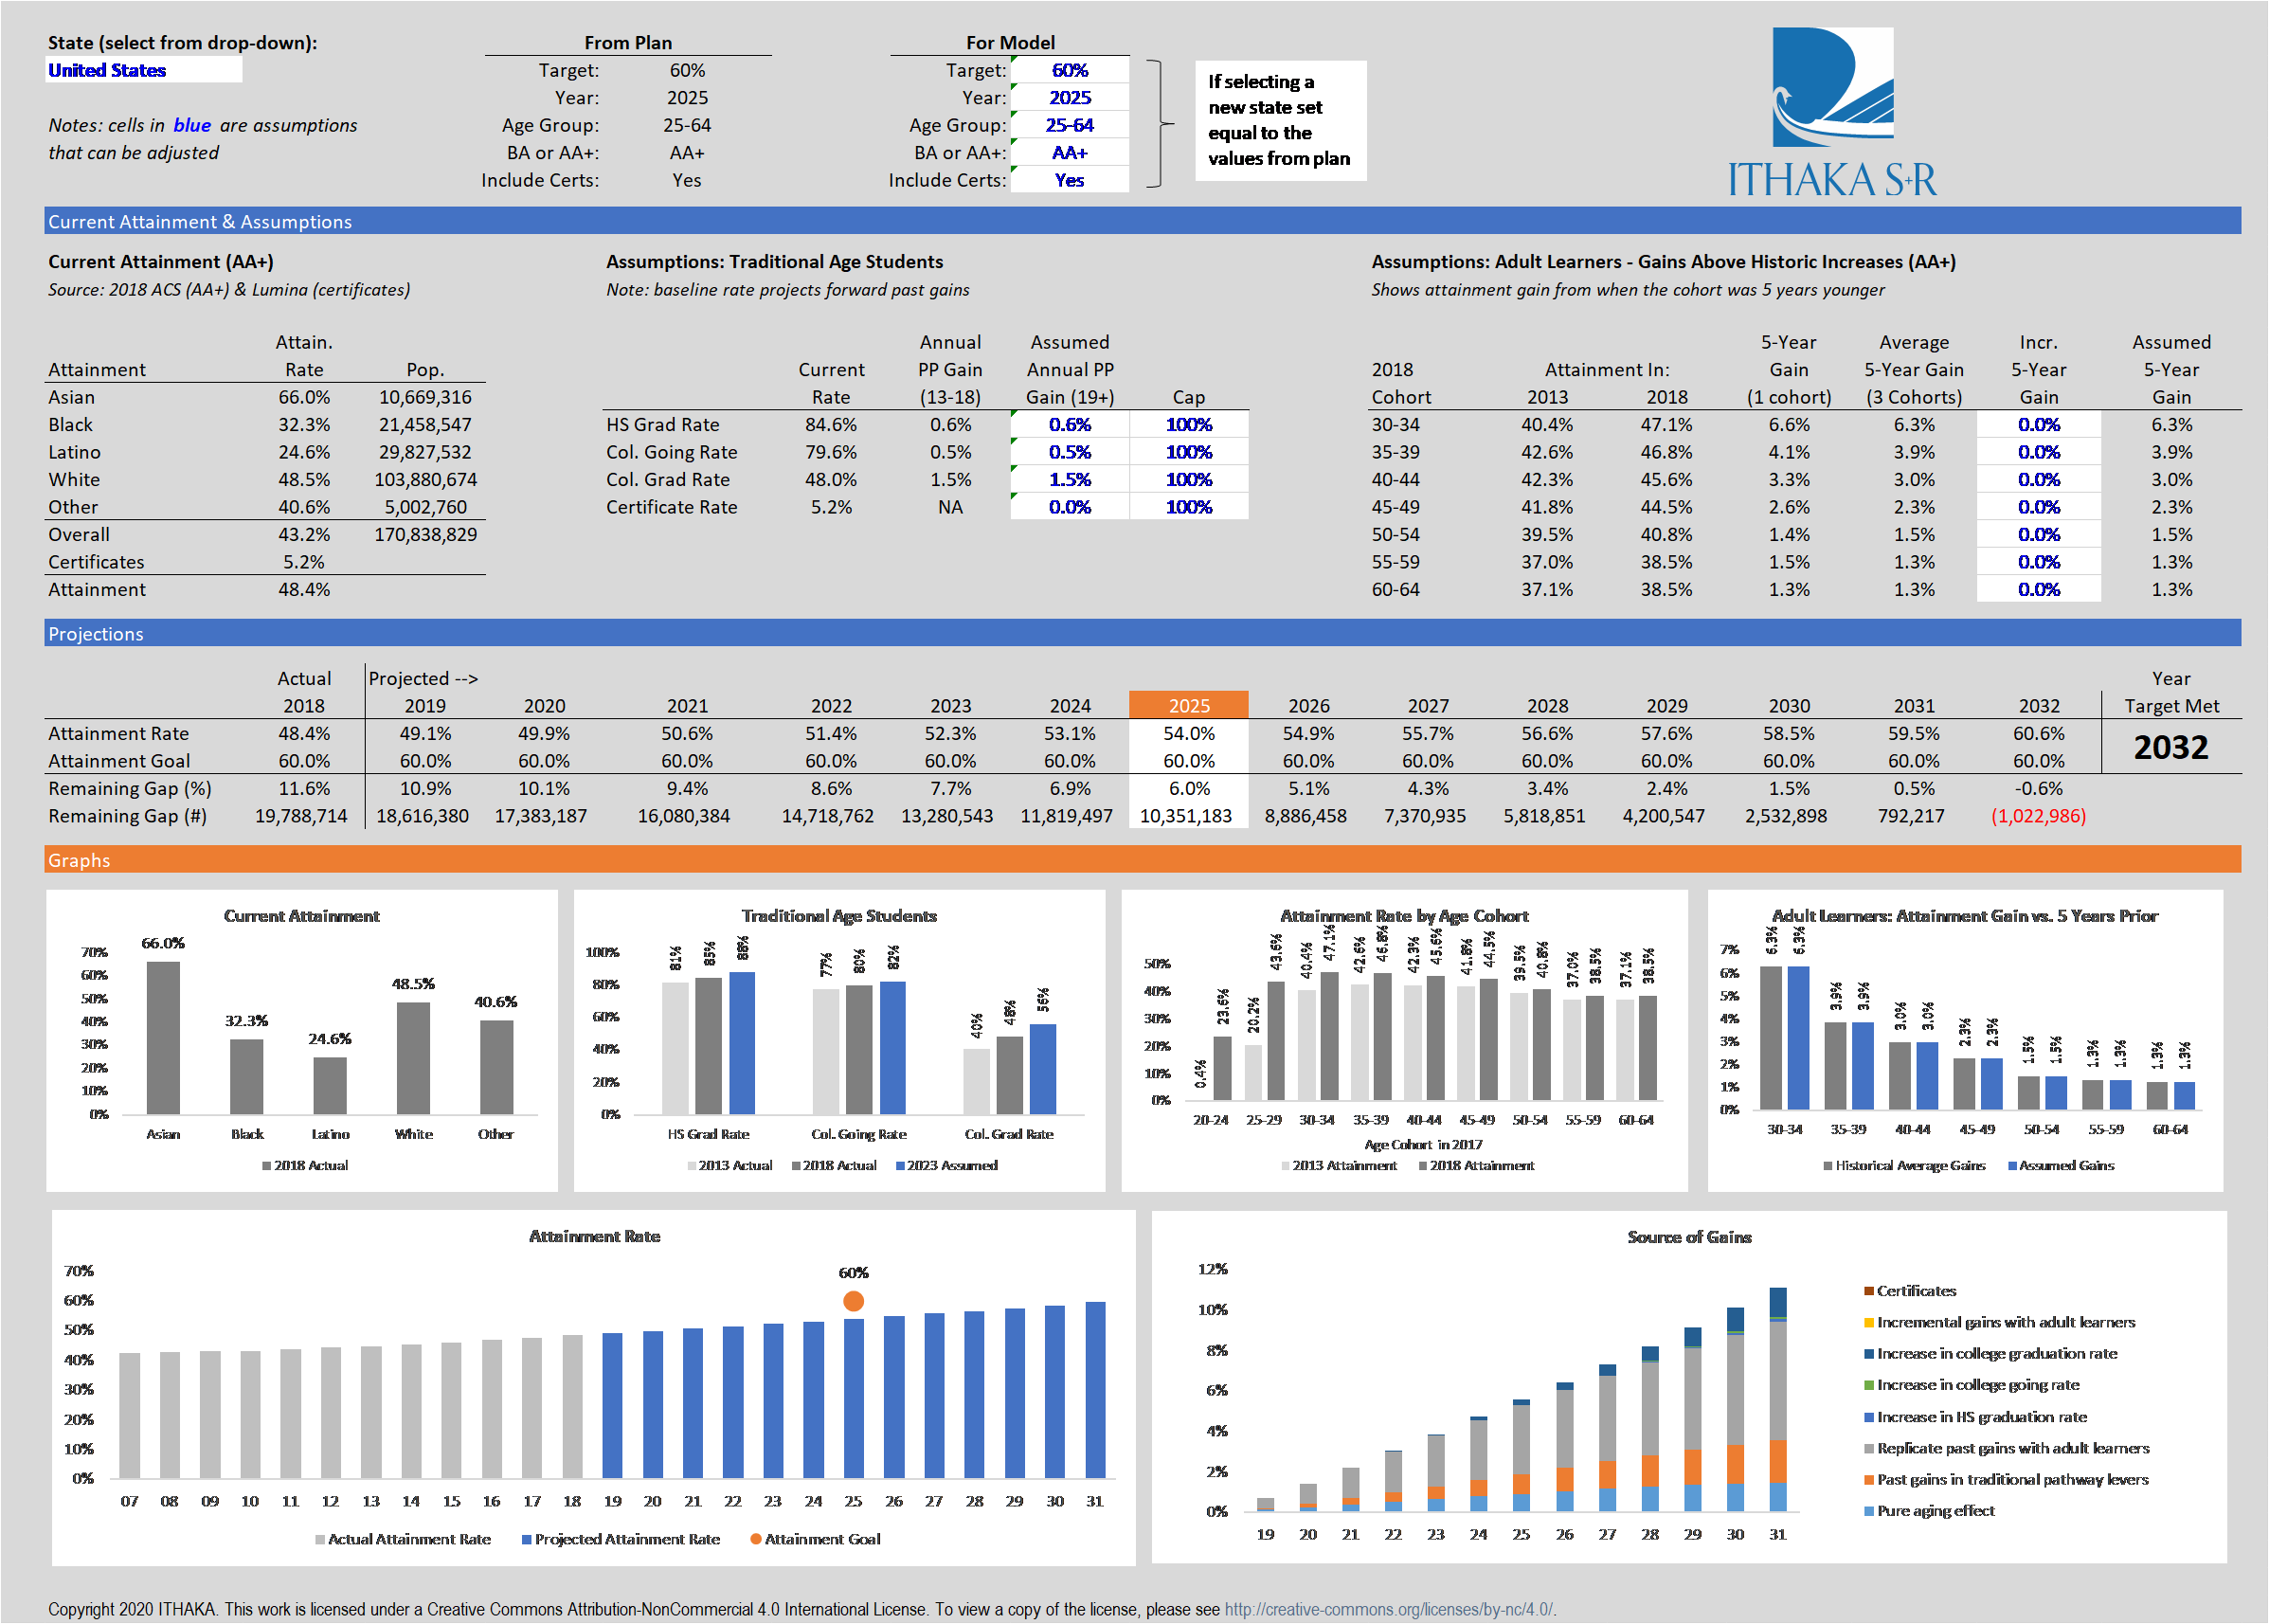
Figure B1 shows a summary of the attainment tool. The tool contains four sections: the goal description, current attainment and assumptions, projections, and graphical representations of the projections. Each item in blue font is customizable by the user. When these items are changed, the graphs and projections automatically update. The tool is based in Excel and utilizes macros to call underlying data gathered from Census, the Department of Education, Lumina Foundation, and state policy documents. If prompted, the user must click “enable macros” at the top of the screen for the tool to automatically update when the user makes adjustments.
Figure B1: Attainment Tool
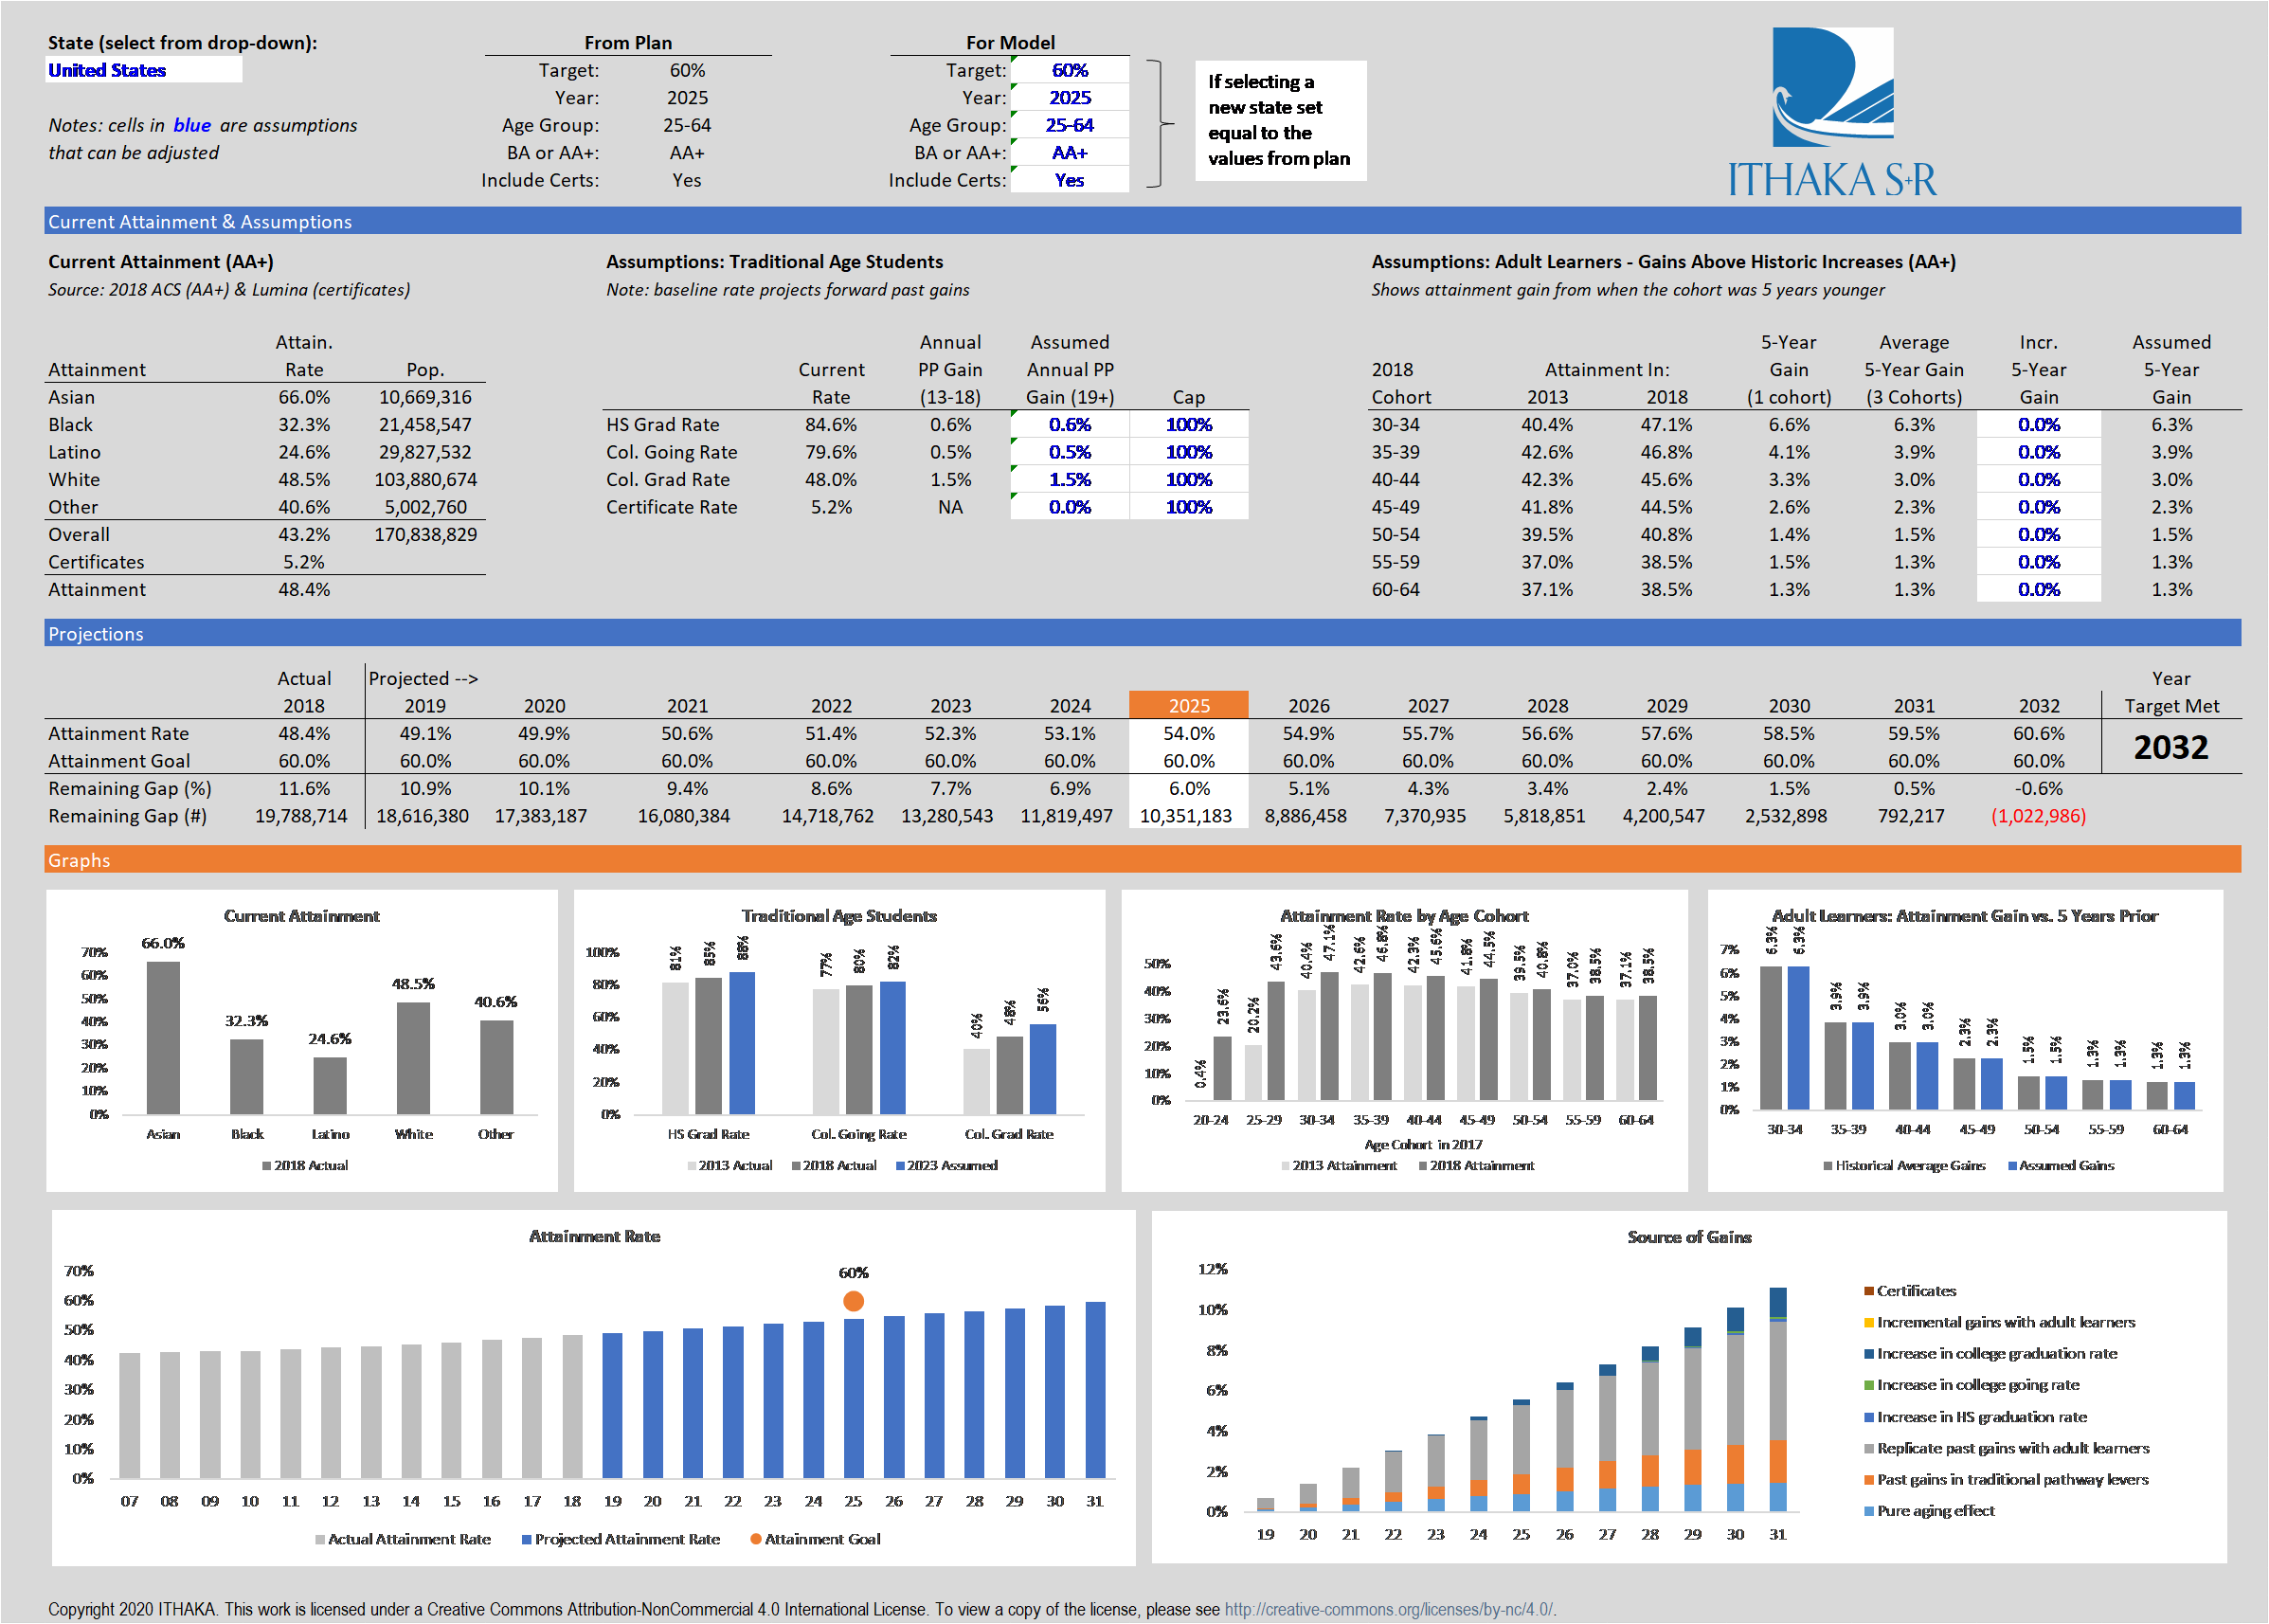 The goal description sections allow the user to select any state, or the United States as a whole, in Box 1 in Figure B2. The tool then automatically loads the recorded goal information in Box 2. As shown below, these data include the target attainment rate, goal year, age group, if the goal is for associate’s or bachelor’s degrees and higher, and if the goal includes certificates. The goal information is derived from Lumina Foundation’s attainment goal data which has been augmented by Ithaka S+R to include recently declared goals.[21] Box 3 allows the user to adjust the pre-loaded goals. For example, the user may want to extend the year of the goal, the target attainment rate, or the age group. This can aid policymakers seeking to adjust current goals or set new goals.
Figure B2: Goal Description Section
The current attainment and assumptions sections provides detailed information on the attainment of sub-groups as well as shows the data for each of the underlying levers on which the projections are built. Figure B3 shows the data elements included. The current attainment by race/ethnicity, collected from the American Community Survey, and the current certificate attainment rate, collected from Lumina Foundation, are shown in Box 4. These data are provided for descriptive context.
Box 5 provides the current high school and college graduation rates (collected from the Department of Education), the college-going rate (collected from National Student Clearinghouse), and the attainment rate for certificate holders (collected from Lumina Foundation). The current rates are provided as well as the average annual gain from 2013 through 2018 for the graduation and college going rates. The model assumes these five-year averages persist moving forward and autofill the average into “Assumed Annual PP Gain” column. As explained in the methodological overview in the report, we assume no growth in certificate attainment. Each of these projected rate changes can be adjusted by the user to see the impacted on attainment growth.[22] For example, if a state recently enacted a program to streamline the college application and enrollment process for graduating high school seniors, the user can increase the projected change in the college-going rate to reflect the expected policy impacts. The final column in Box 5 is a maximum allowed rate for each data element. The default is set to a maximum of 100 percent so that as the rates grow over the 30-year projection period, they reach an upper bound. The projections in the report use a 100 percent maximum; however, this value may be unrealistic and is likely a generous assumption. The tool allows the user to lower this maximum if, for example, they think a 100 percent high school graduation rate is an unrealistic assumption.
Box 6 captures adult learning. For each five-year age band, from 30 to 64, the cohort’s change in attainment from 2013 through 2018 is calculated. For example, 30-to-34-year-old residents in 2018, and thus 25-to-29-year-old residents in 2013, had a growth in attainment from 40.4 percent in 2013 to 47.1 percent in 2018. The five-year increase is shown for the single cohort, as well as a three-year rolling average to reduce noisiness of the data. The model uses this rolling average in the baseline assumption. For example, each cohort of 25-to-29-year-olds is expected to increase attainment by 6.3 percentage points as it ages into the 30-to-34-year-old age band over the next 30 years. The user is able to adjust the rate, up or down, and project the impacts on overall attainment. For instance, a state may implement a comprehensive adult promise program that explicitly targets residents aged 40 and older and expects the attainment growth of these individuals to increase. This estimated policy effects can be incorporated into the model to project the impacts on long-run attainment rates by adjusting the figures in blue. While 40-to-44-year-olds have an annual attainment growth rate of three percentage points, the user can adjust the blue value to increase this by an additional one percentage point for a total annual growth of four percentage points. The sum of the baseline average and the user-adjusted rate is automatically updated and shown in the right-most column of Box 6. The user can also input a negative value to decrease the projected change in adult attainment.
Figure B3: Current Attainment and Assumptions Section
Figure B4 presents the third section of the attainment tool, the attainment projections. This section includes the projected attainment rate, the goal, and the remaining gaps between the current rate and the goal rate as well as the gap represented in the number of individuals needing a credential. This projection displays years 2019 through 2032, with the target year highlighted in white. The final column shows the year when the goal is projected to be met.
Figure B4: Projections Section
Figure B5 includes graphical representations of the projections and underlying data. The first row of graphs shows the current attainment and assumptions data shown in Figure B3. The first two graphs correspond to Boxes 4 and 5, respectively. The last two graphs represent the changes in adult attainment by cohort and the comparison between the historical gains and any user adjustments. In the second row of graphs, the first is a visualization of the projected attainment rate over time, and the second is a breakdown of the sources of gains in the attainment rate. As described in the methodological summary in the report, the gains can come from changes in traditional-aged and adult learners. The chart shows how these growth rates are broken down between these two groups as well as the changes aligned with past growth and any adjustments the user has made to the assumptions.
Figure B5: Projection Graphs
Endnotes
- Lumina Foundation, “A Stronger Nation: Learning Beyond High School Builds American Talent,” accessed September 3, 2019, http://strongernation.luminafoundation.org/report/2019/#nation. ↑
- Barack Obama, “Investing in Education: The American Graduation Initiative” (speech, Warren, MI, July 14, 2009), White House Archives, https://obamawhitehouse.archives.gov/blog/2009/07/14/investing-education-american-graduation-initiative. ↑
- As of September 2019, the five states without publicized attainment goals are California, Delaware, Mississippi, Nebraska, and New York. ↑
- For more information about states’ postsecondary attainment goals, see Cindy Le, Elizabeth Davidson Pisacreta, James Dean Ward, and Jesse Margolis, “Setting a North Star: Motivations, Implications, and Approaches to State Postsecondary Attainment Goals,” Ithaka S+R, 2019, https://doi.org/10.18665/sr.311539. ↑
- Since 2014, Lumina has included “workforce-relevant” certificates as credentials that count towards the national attainment goal. ↑
- Cindy Le, Elizabeth Davidson Pisacreta, James Dean Ward, and Jesse Margolis, “Setting a North Star: Motivations, Implications, and Approaches to State Postsecondary Attainment Goals,” Ithaka S+R, 2019, https://doi.org/10.18665/sr.311539. ↑
- For any states that saw the high school graduation rate, college going rate, or college graduation rate decline between 2012 and 2017, we assumed the rate stayed steady in 2018 and beyond. In other words, our baseline scenario does not assume decreases in these rates for any state. The values are capped at 100 percent, but the attainment tool allows the user to adjust the maximum value. ↑
- Values are rounded to the nearest percentage point in Figure 4. ↑
- Authors’ email correspondence with Lumina Foundation. ↑
- Authors’ calculations using IPEDS completions data. ↑
- Future phases of this work will engage policymakers to understand the strategizing of developing a cohesive policy mix that seeks to improve attainment rates. ↑
- The attainment rate cited here includes certificates, using data from Lumina Foundation. While we include certificates in the attainment rate, our baseline projection assumes no change in the certificate rate because efforts to measure the number of workforce relevant certificates nationally and by state are still in flux. ↑
- It should be reminded that the projection tool is based on recent trends and does not reflect the potential impact of new policies. New Mexico recently announced a promise program that may have large impacts on enrollments and attainment. The flexibility of the tool, detailed in the accompanying technical report, allows users to adjust the assumptions to include expected growth from such a policy. ↑
- Rajashri Chakrabarti, Nicole Gorton, and Michael F. Lovenheim, The Effect of State Funding for Postsecondary Education on Long-Run Student Outcomes, Cambridge: National Bureau of Economic Research, 2017, http://conference.iza.org/conference_files/WoLabConf_2018/chakrabarti_r26265.pdf ; and David J. Deming and Christopher R. Walters, The Impact of Price Caps and Spending Cuts on US Postsecondary Attainment, Cambridge: National Bureau of Economic Research, 2017, https://doi.org/10.3386/w23736. ↑
- Cindy Le, Elizabeth Davidson Pisacreta, James Dean Ward, and Jesse Margolis, “Setting a North Star: Motivations, Implications, and Approaches to State Postsecondary Attainment Goals,” Ithaka S+R, 2019, https://doi.org/10.18665/sr.311539. ↑
- Our baseline projection includes certificates in the attainment rate, which are not included in Figure 10 because we do not have a reliable estimate of how the certificate rate varies by race. ↑
- Specifically, the bar on the left shows the percentage point increase in statewide attainment if any racial/ethnic groups in the state that have an attainment rate lower than whites—potentially including Asians, Blacks, Latinos, and/or other races—increased their attainment rate to the attainment rate of whites. ↑
- Cindy Le, Elizabeth Davidson Pisacreta, James Dean Ward, and Jesse Margolis, “Setting a North Star: Motivations, Implications, and Approaches to State Postsecondary Attainment Goals,” Ithaka S+R, 2019, https://doi.org/10.18665/sr.311539;James Dean Ward, Cindy Le, Elizabeth Davidson Pisacreta, and Jesse Margolis, “The Strategic Alignment of State Appropriations, Tuition, and Financial Aid Policies,” Ithaka S+R, 2019, https://doi.org/10.18665/sr.311966;Cindy Le, Elizabeth Davidson Pisacreta, James Dean Ward, and Jesse Margolis, “Expanding Pathways to College Enrollment and Degree Attainment: Policies and Reforms for a Diverse Population,” Ithaka S+R, 2019, https://doi.org/10.18665/sr.312296. ↑
- P-TECH in Colorado is based on an earlier P-TECH model in New York City that is a partnership between IBM, the City University of New York, and the New York City Department of Education. ↑
- Christopher Jepsen, Kenneth Troske, and Paul Coomes, “The Labor-Market Returns to Community College Degrees, Diplomas, and Certificates,” Journal of Labor Economics 32, no. 1 (2014): 95-121; and Di Xu and Madeline Trimble, “What About Certificates? Evidence on The Labor Market Returns to Nondegree Community College Awards in Two States,” Educational Evaluation and Policy Analysis 38, no. 2 (2016): 272-292. ↑
- Lumina Foundation has explicit criteria to be considered an official attainment goal, which includes a mention of equity in the goal. Ithaka S+R has included goals that may not have an explicit focus on equity in the goal and thus has a larger number of state goals. As the purpose of the tool is to assist policymakers in improving attainment, we believe this broader definition of an attainment goal is most appropriate in this context. ↑
- The user should note that increasing the certificate attainment rate applies to the full 25-to-64-year-old age group while the high school graduation, college-going, and college graduation rates apply to “traditional” aged students. ↑
Attribution/NonCommercial 4.0 International License. To view a copy of the license, please see http://creativecommons.org/licenses/by-nc/4.0/.
