Aligning State Investments with Workforce Opportunity
A Framework for Targeted Higher Education Funding
Introduction
States play a pivotal role in financing higher education, particularly in an era of federal uncertainty and shifting policy priorities. Over the past several decades, state higher education investment has evolved in both magnitude and form. Despite an increase in state appropriations for higher education nationally, 22 states are spending less per student than before the 2008 Great Recession.[1] The risk of more states decreasing spending in 2026 is real, as federal funding disruptions, state tax revenue stagnation, and rising costs and inflation are increasingly straining state budgets.[2] At the same time, many states have shifted toward outcomes-based funding models and emphasized the production of “credentials of value,” a trend reinforced by new federal regulations to hold institutions accountable for their graduates’ earnings.[3]
Despite an increase in state appropriations for higher education nationally, 22 states are spending less per student than before the 2008 Great Recession.
State and local spending on higher education represents a significant public investment, and states have a responsibility to deploy these dollars in ways that maximize their social and economic returns. In fiscal year 2024, state and local higher education expenditures exceeded $139 billion—about 8.7 percent of states’ total budgets and the third-largest spending category after K-12 education and Medicaid.[4] The returns on these investments are substantial. At the individual level, postsecondary credentials lead to higher earnings, better employment outcomes, and greater economic stability. These individual benefits accumulate, boosting state tax revenues and economic growth. Higher education also yields essential non-economic benefits, including a more informed citizenry, a stronger civic culture, and healthier, more resilient communities.
Policy discussions about how states can ensure their investments maximize these economic and social returns, however, have largely centered on states’ direct appropriations to public institutions and, more recently, on how those dollars can be tied to credentials of value. Far less attention has been paid to state financial aid investments, even though they, too, can be targeted toward specific credentials, sectors, and occupations. Recent initiatives in states such as New York and North Carolina illustrate how states can use financial aid to incentivize enrollment in programs that are in high demand and have relatively high wages.[5] Many states’ financial aid programs also focus on credentials that have social value, like early childhood education, even if they have lower economic returns. Unlike direct appropriations, financial aid programs drive students’ choice of major at the outset rather than reward institutions for degree production after-the-fact, which may be more effective at boosting the number of credentials in specific fields.
This broader lens is increasingly important as states expand and refine programs that steer students into programs that offer credentials of value. States differ widely in how much they spend on financial aid, how that aid compares to their overall higher education spending, and the extent to which both direct support and aid are targeted to specific industries or occupations. To achieve their policy and workforce goals, states must optimize these investments and consider targeted financial aid alongside direct institutional support, rather than treating them as separate or competing priorities.
To achieve their policy and workforce goals, states must optimize these investments and consider targeted financial aid alongside direct institutional support, rather than treating them as separate or competing priorities.
The purpose of this paper is to bring these pieces together. We develop a framework for classifying and analyzing state investments that are directed toward industry- or occupation-specific credentials, across both direct institutional support and state financial aid. We then apply this framework to national data and to selected state examples to examine how states are currently investing in targeted financial aid and supporting institutions, how well those investments align with high-opportunity occupations, and what tradeoffs and opportunities emerge. In the sections that follow, we first provide an overview of state funding streams for higher education, then describe our framework and data sources, present findings on patterns and alignment, and conclude with recommendations for how states can more strategically deploy both direct support and financial aid to advance their educational and workforce objectives.
Overview of state funding
States have two primary levers to influence postsecondary enrollment, completion, and labor market outcomes: direct support to institutions and state-provided financial aid to students. While students and institutions may receive financial support from other sources, these two streams form the backbone of states’ efforts to boost postsecondary credentials that are aligned with high-demand, high-wage occupations. However, states vary widely in how much they invest in higher education, how they distribute those dollars across institutions and aid programs, and the degree to which that funding is targeted toward specific industries or occupational pathways.
To understand these differences, we introduce a framework in Table 1 that explains how various state funding streams can be classified based on whether they are targeted to industry- or occupation-specific credentials. Of the three types of direct support—incremental, formula-based, and performance-based (PBF) models[6]—two are typically not targeted to specific credentials: incremental approaches are based on prior year funding amounts, with adjustments for inflation and evolving political priorities, and formula-based approaches allocate dollars according to the scale of the work done at institutions, as measured by enrollment size, program costs, or other related factors.
Performance-based funding models, by contrast, tie a share of funding to student outcomes, such as retention or graduation rates, labor market outcomes, or increasingly, the number of degrees awarded in priority fields.[7] States that aim to increase production of industry-aligned credentials typically do so via their performance-based funding formulas, rewarding institutions for completions in high-value fields. States pursuing the same goal through financial aid provide targeted grants or loans to students who enroll and persist in high-value degrees.
Table 1: A Framework for Classifying State Postsecondary Investments that Are Targeted towards Specific Industry-Aligned Programs
| Direct Institutional Support | Financial Aid for Students | ||||||
| Incremental | Formula- based | Performance-based | Grants | Loans | |||
| Non-
targeted |
Non-
targeted |
Targeted | Non-
targeted |
Targeted | Non-
targeted |
Targeted | Non-
targeted |
This framework provides a foundation for examining how states allocate higher education dollars, how aligned those allocations are to state priorities and economic needs, and how those decisions shape the pipeline of students entering high-opportunity fields. In the sections that follow, we describe states’ approaches to targeted funding, both through direct support and student financial aid. Where possible, we estimate the amount that states are spending in these areas and provide concrete state examples, highlighting substantial variation across states in both the level and structure of support.
Direct institutional support
In every state, direct institutional support—through state and local appropriations to public colleges and universities—represents a substantially larger investment by states than their financial aid programs. This direct support is the financial foundation on which a state’s higher education institutions operate, shaping how affordable they are, which academic programs they can offer, how many faculty and staff they can employ, and the extent of support they can offer to help students graduate and begin their careers. Because of this central role, states’ decisions about how much to invest, and how to allocate those dollars, directly affect not only enrollment and completion rates, but also the degree to which states’ public colleges and universities contribute to their economic and social priorities.
Direct support is foundational to institutional stability and to states’ ability to meet broad postsecondary attainment goals.
A substantial body of research underscores the importance of adequate direct support. When appropriations decline, institutions respond by raising tuition,[8] cutting student services,[9] recruiting more out-of-state students,[10] and reducing investment in more expensive programs—particularly at two-year colleges and in graduate education.[11] Empirical studies consistently show that increases in state appropriations lead to higher enrollment and completion, while decreases correlate with declines in bachelor’s, master’s, and PhD production.[12] In this sense, direct support is foundational to institutional stability and to states’ ability to meet broad postsecondary attainment goals.
Despite this evidence, states differ dramatically in both the level of direct support they provide and their fiscal capacity to provide it. Figure 1 illustrates this variation: some states invest more than twice the national median per student, while others invest far below it. At the upper end are Alaska, Hawaii, and Illinois, clustered at around $25,000 per FTE student. At the lower end are New Hampshire, Vermont, and Arizona, clustered around $6,000 to $7,000 per FTE student. High and low levels of spending appear across states with varying fiscal capacity, suggesting that appropriations are not solely driven by economic conditions. Instead, state political priorities play a central role in determining per-student investment.
Figure 1. Total State and Local Support per Gross FTE Enrollment
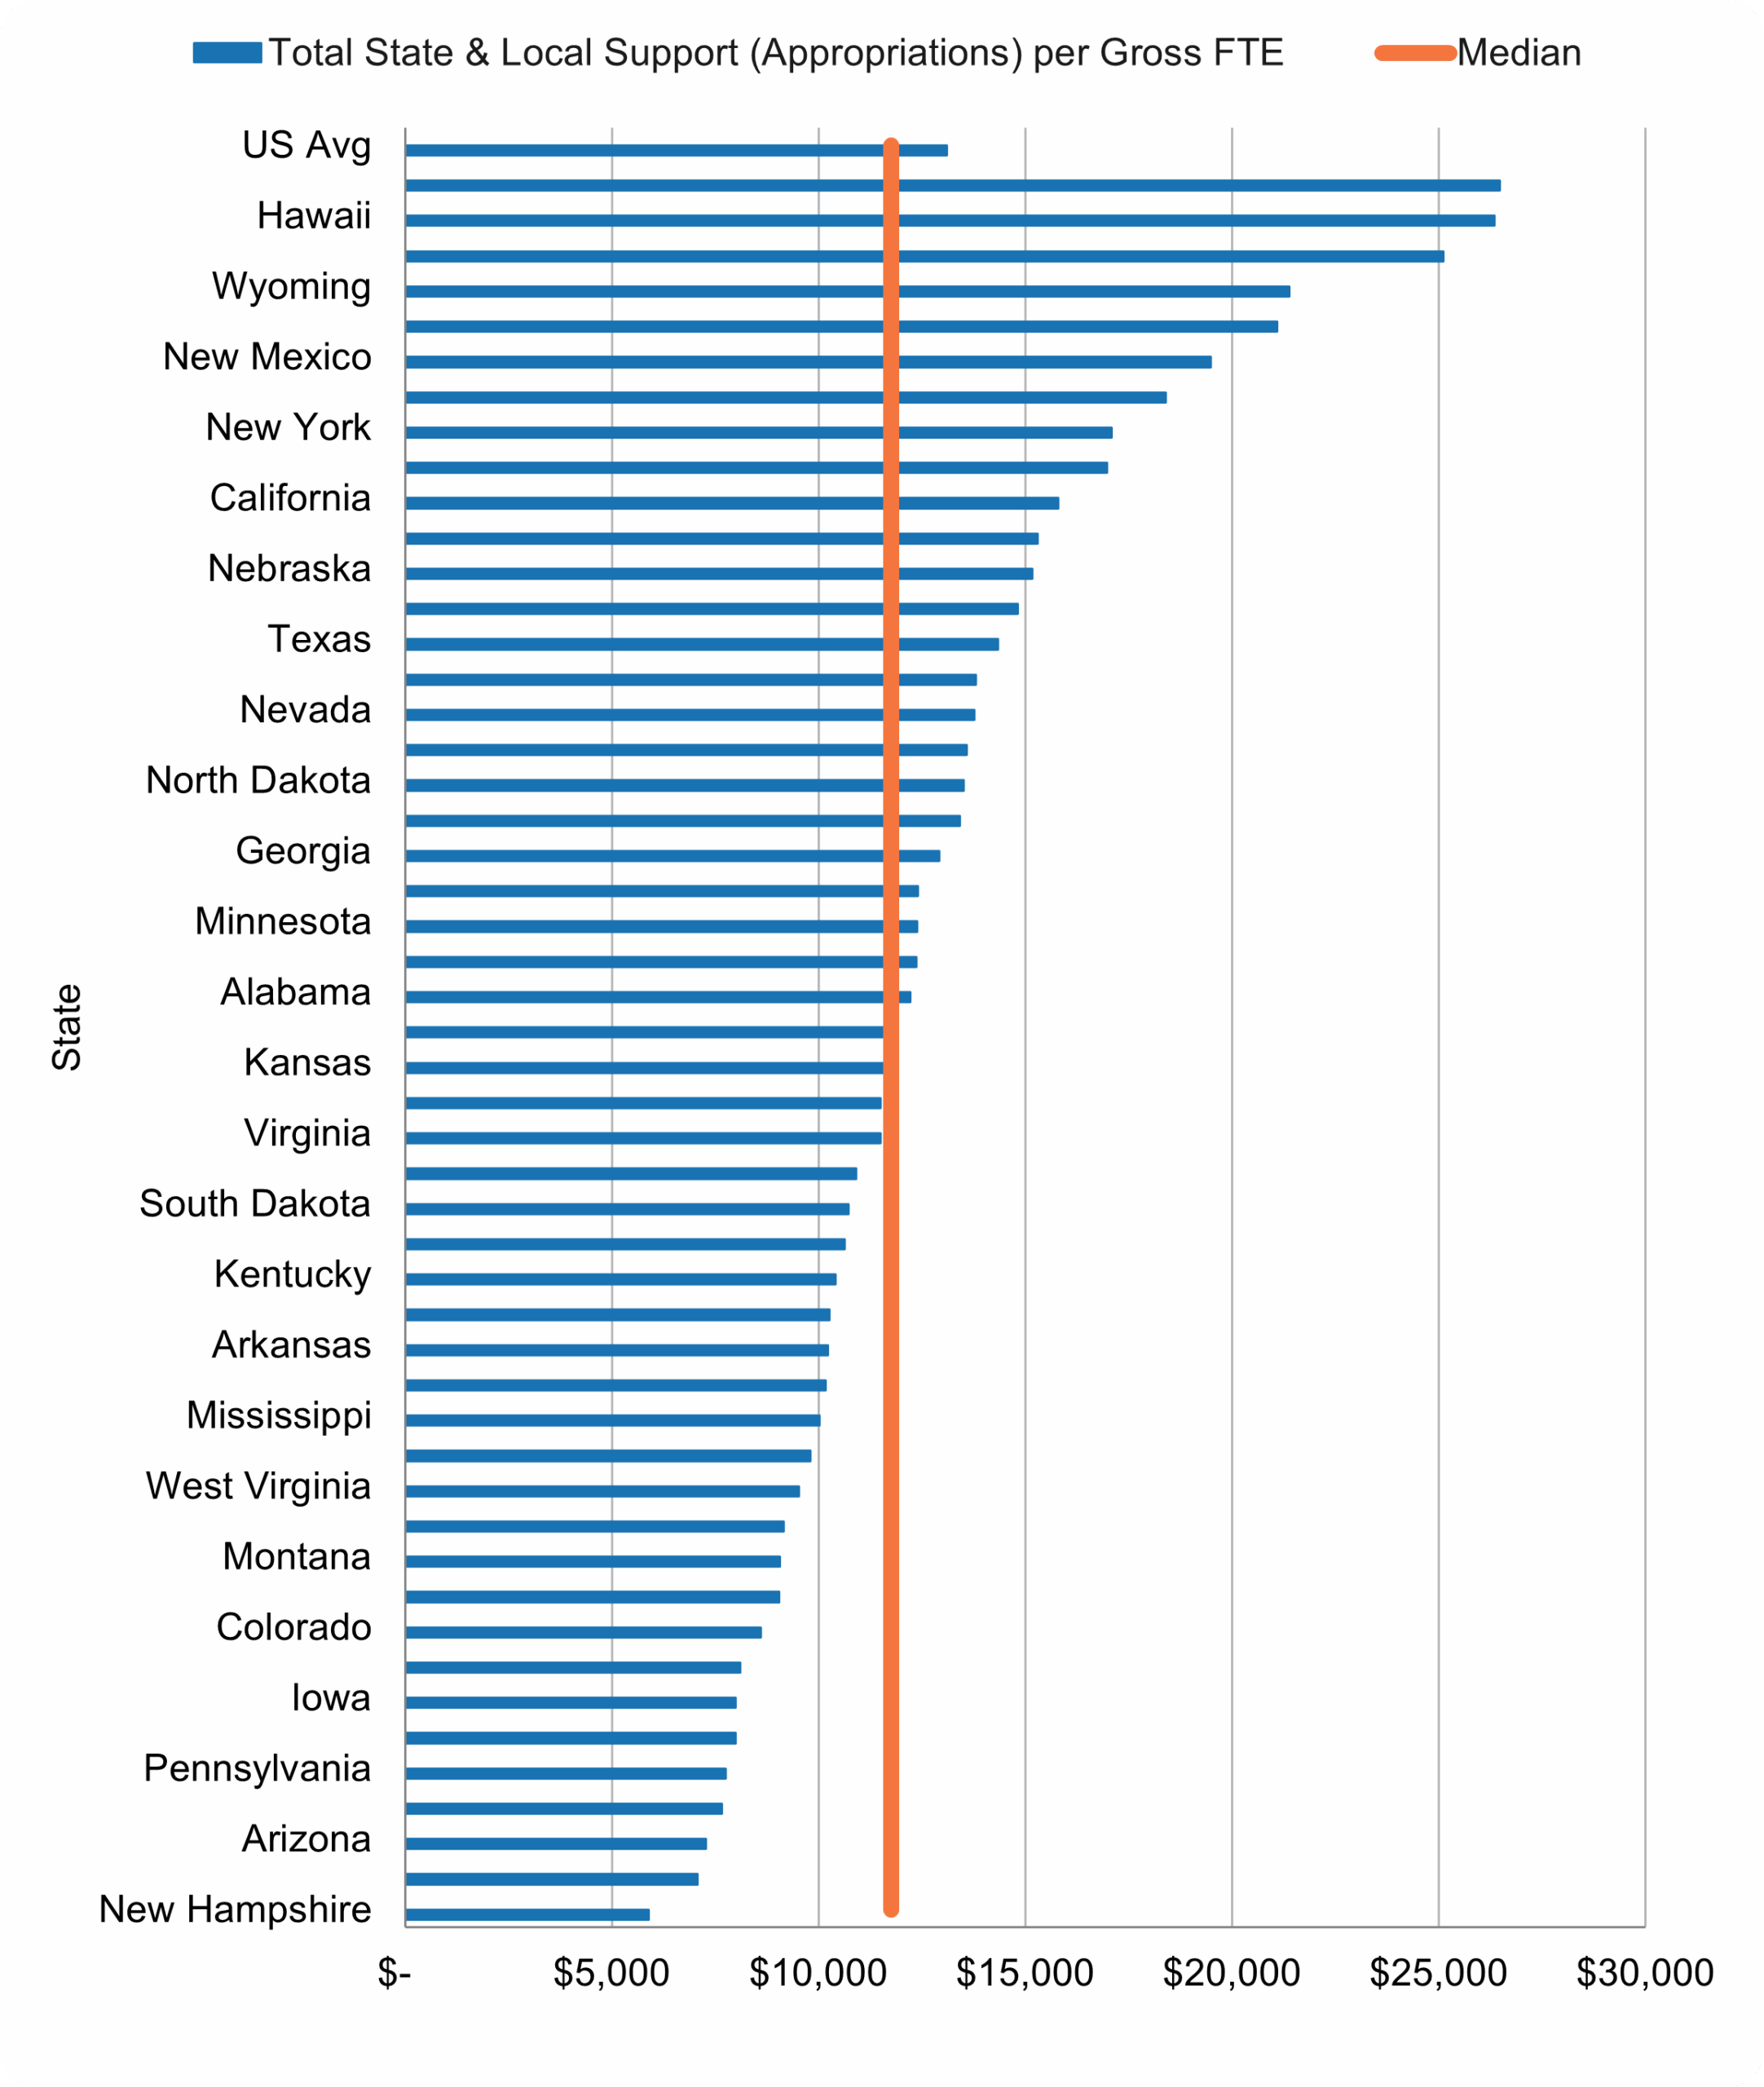
Source: FY 2024 SHEF data on state expenditures for higher education
These differences persist when a state’s financial support is measured relative to its residents’ personal incomes. In Figure 2, we depict states’ direct institutional support measured as a share of $1,000 in personal income. The range is again quite wide, with New Mexico providing the highest amount (approximately $12 per $1,000 in income), which is more than twice the average and six times more than that of New Hampshire. Of the 10 states investing the most in appropriations per FTE, only three recur in the top 10 for direct support as a share of personal income. Some states with the highest GDP per capita (e.g., Massachusetts, New York, and California) do not feature in the top 10 states for this latter measure, whereas states with lower fiscal capacity (e.g., Alabama, Mississippi, and New Mexico) do. This distribution further portrays states’ varying strategies and political priorities for funding higher education beyond simply their fiscal capacity. In addition, the level of these investments reveals the baseline conditions under which institutions are expected to operate as well as the state’s capacity for optimizing its higher education funding to address its economic needs.
This distribution further portrays states’ varying strategies and political priorities for funding higher education beyond simply their fiscal capacity.
Figure 2. Direct Support as a Share of $1,000 in Personal Income
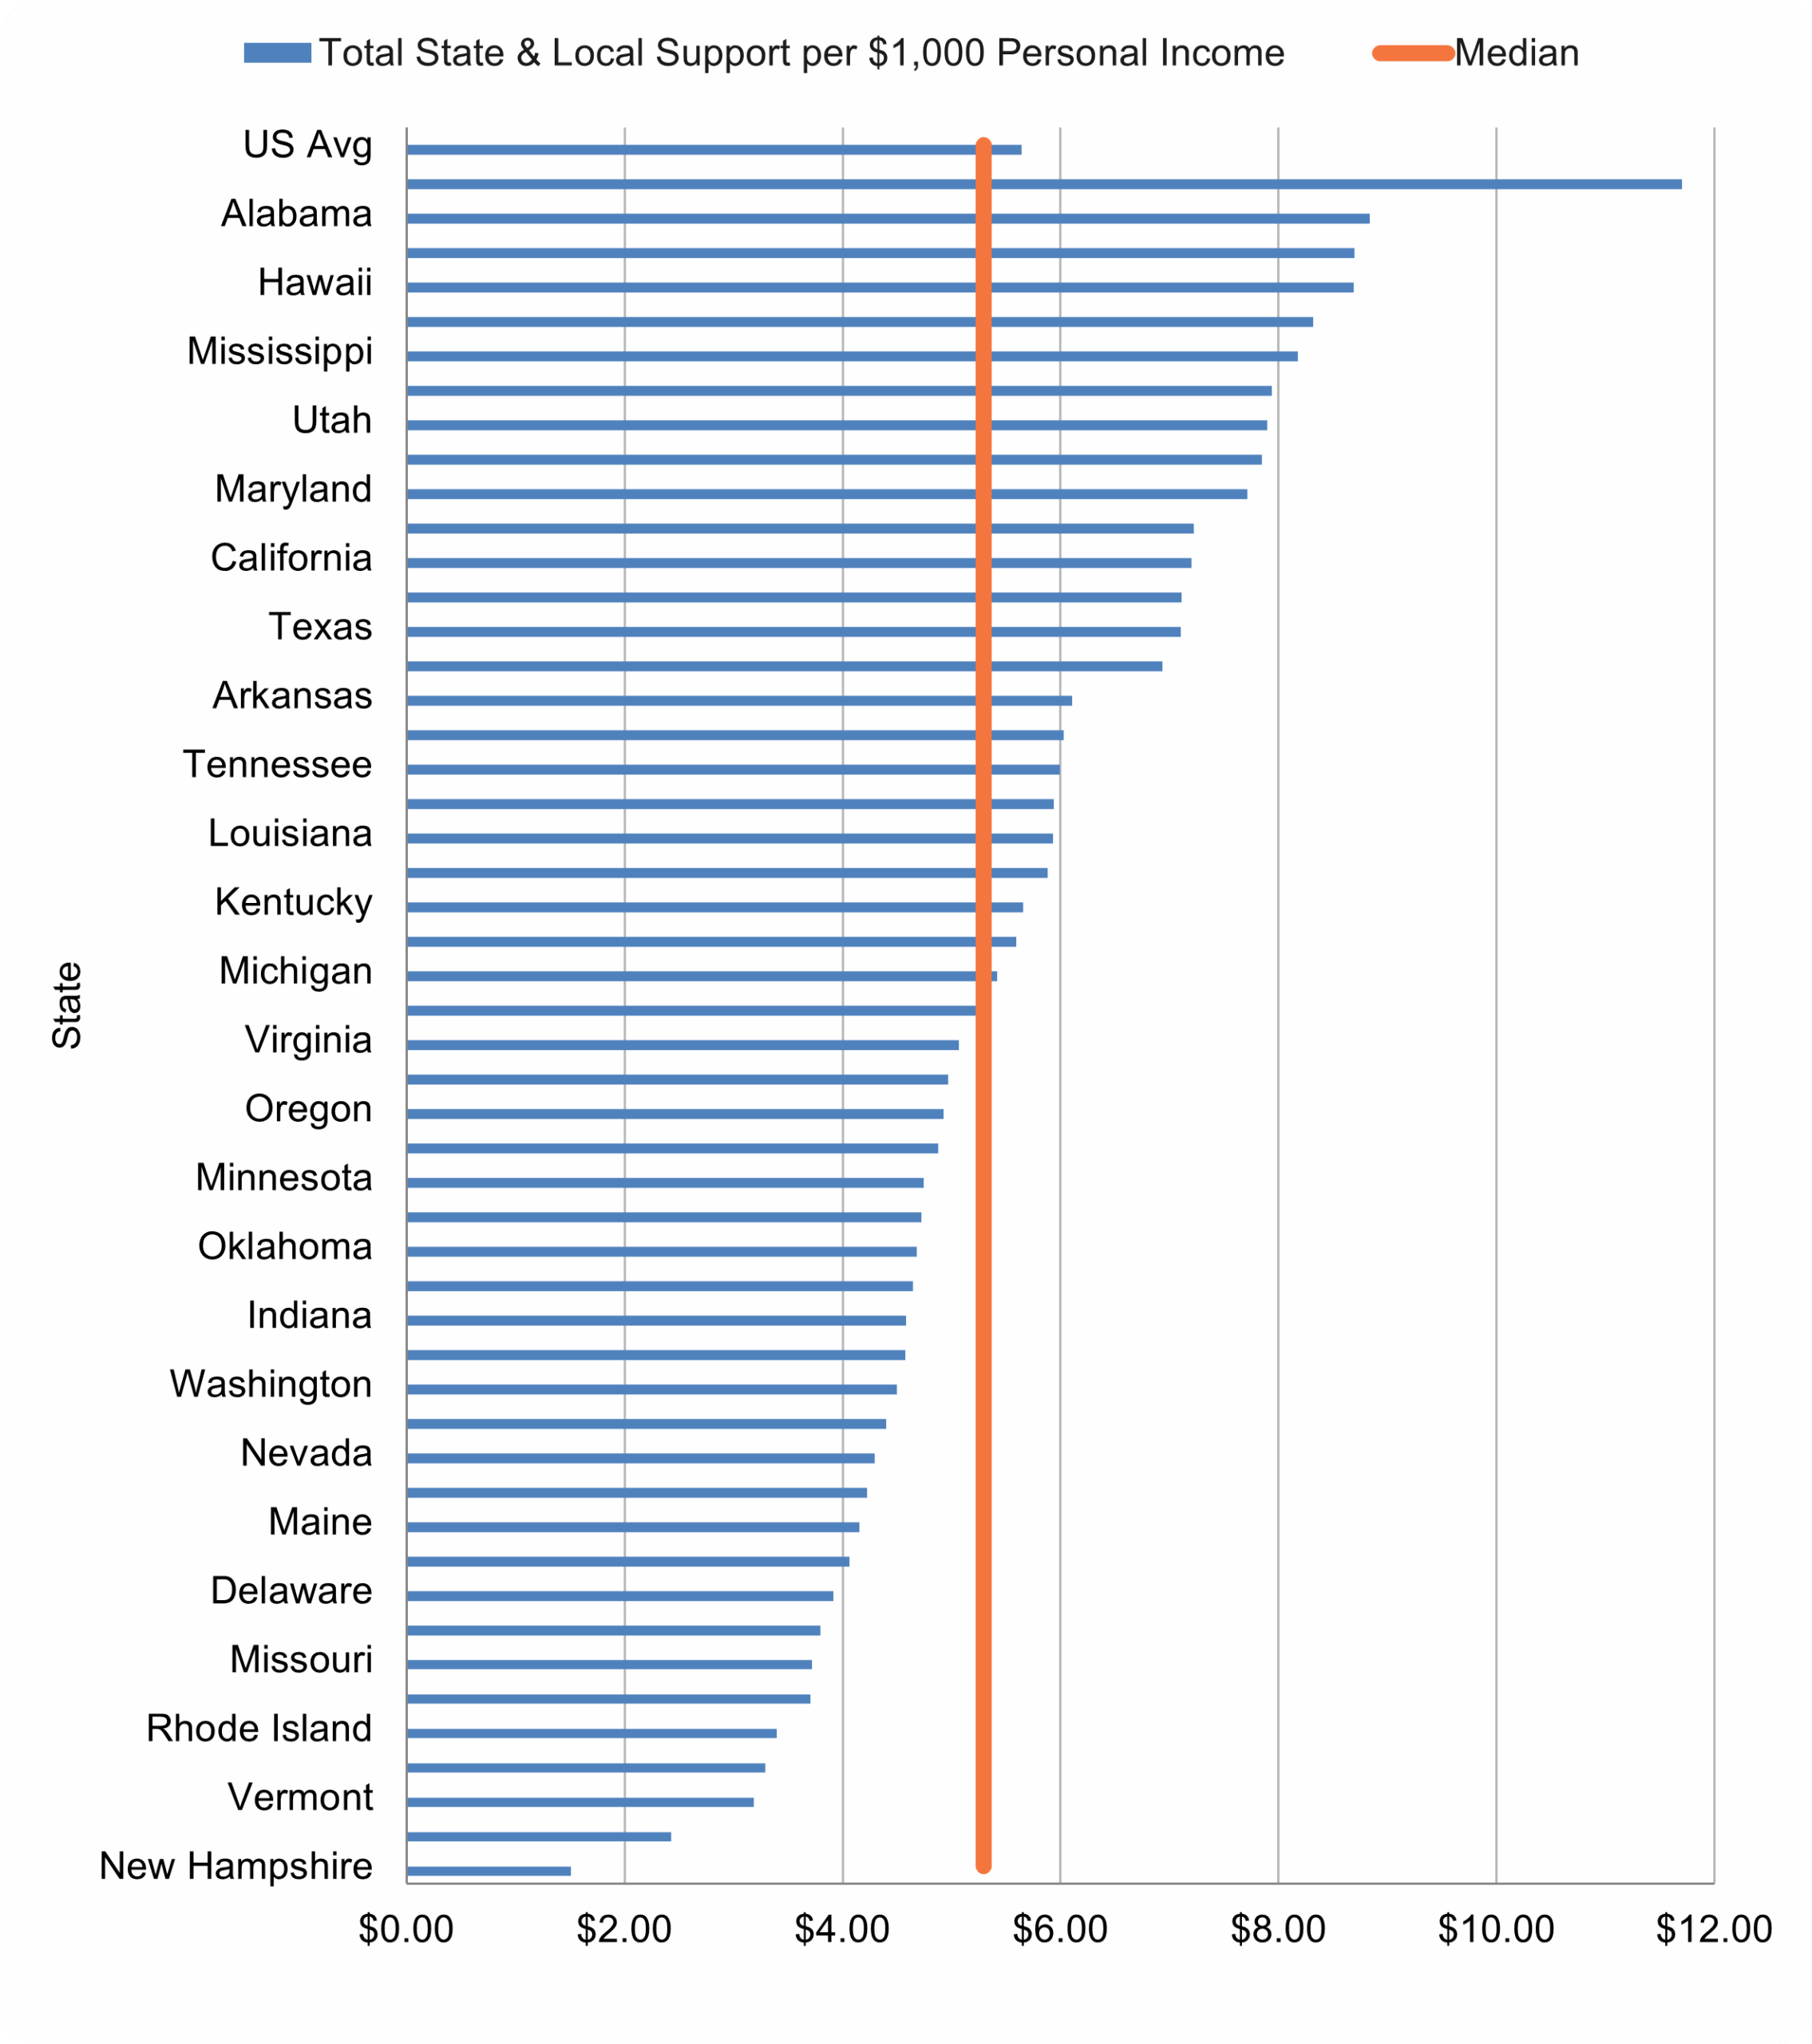
Sources: FY 2024 SHEF data on state expenditures for higher education and the 2024 data on personal income from the US Bureau of Economic Analysis
Among the three funding mechanisms, PBF is the only one that enables states to explicitly reward institutions for producing degrees in high-demand or high-value fields. Although PBF systems differ in design and in the weight they assign to specific outcomes, they share the goal of shifting funding from enrollment-driven allocations to results-driven incentives. Figure 3 shows in absolute dollars the amount states committed to performance-based funding in FY2024. In the case of Ohio, which at $1.96 billion dedicates the highest amount, that funding represented 85.6 percent of their total public operating expenses. Meanwhile, Texas’ $1.67 billion represented only 14.5 percent of total public operating expenses.
Figure 3. Total Funding from PBF Model
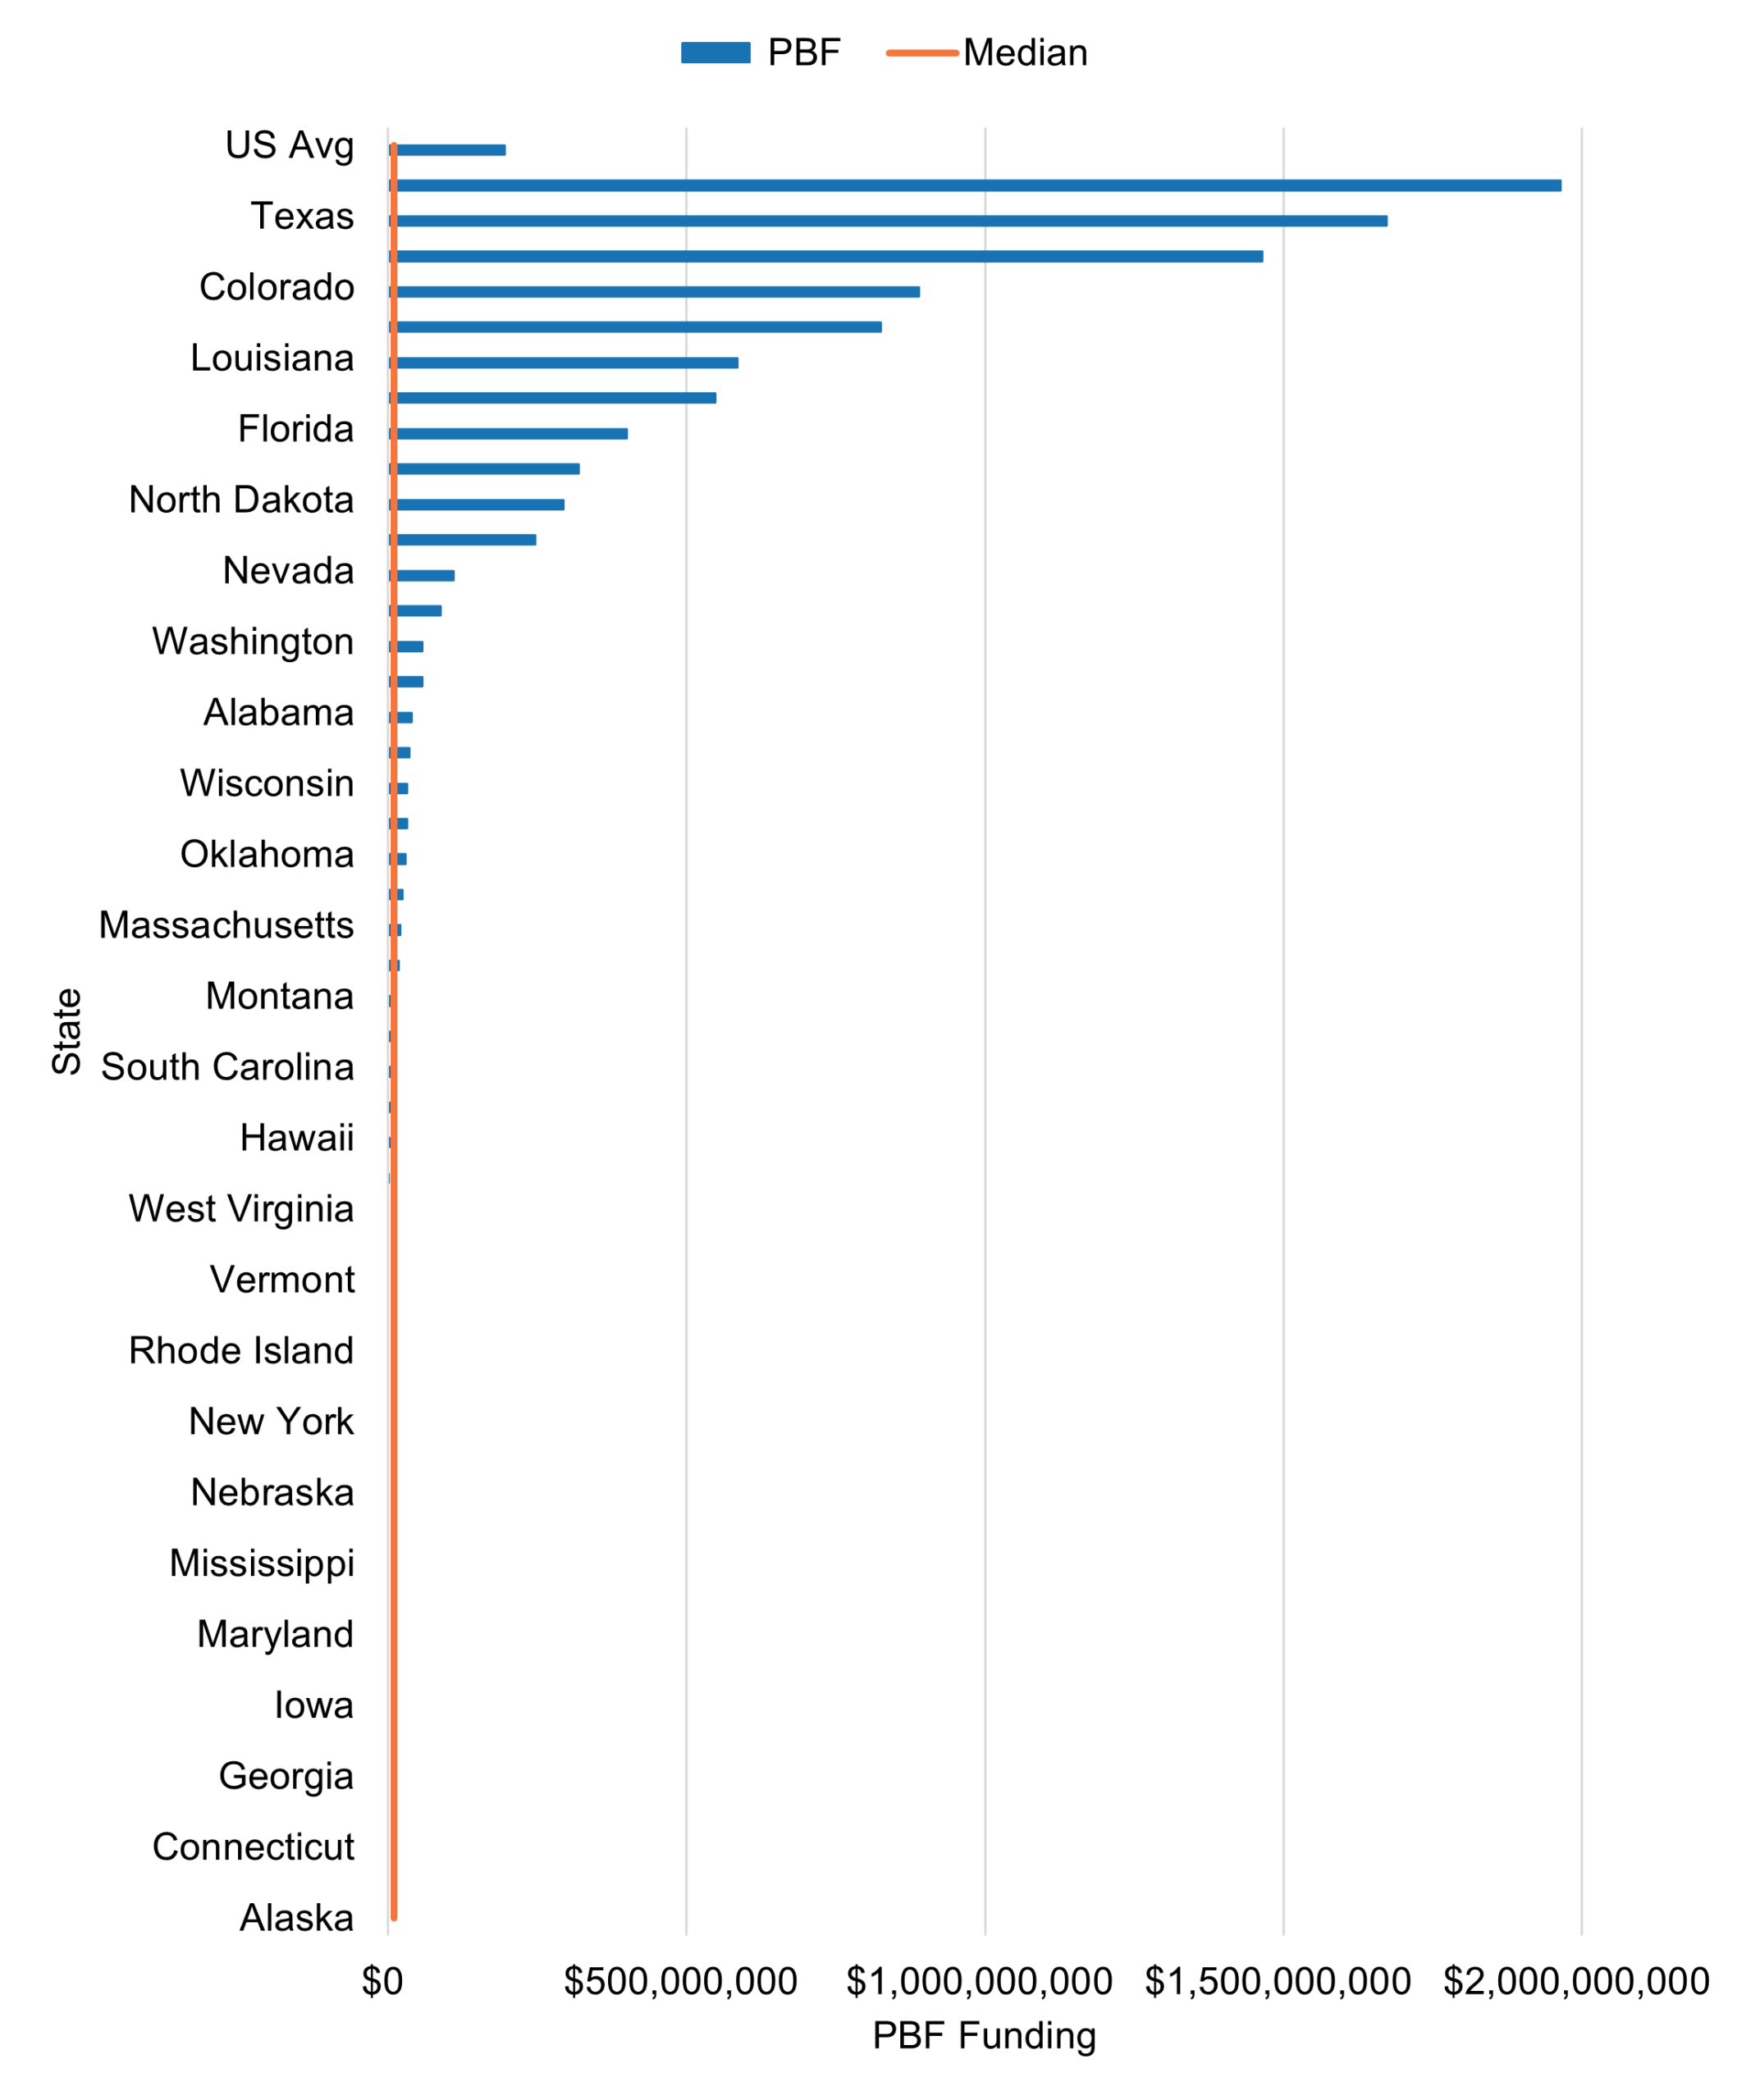
Source: SHEF’s FY2024 data on performance-based funding
In Figure 4, we see the extent to which states rely on PBF: while 29 states use some form of PBF, only 10 allocate more than 10 percent of operating funds through these formulas. For most states that adopt PBF, allocations are clustered near the bottom of the distribution, with a small number of outliers. In most cases, institutions face limited budgetary exposure to performance metrics, whereas a small subset of states ties a sizable portion of funding to outcomes. This wide variation reflects differing state philosophies about the role of incentives and the degree to which financial levers can be expected to drive institutional behavior.
Figure 4. PBF as a Share of Total Public Operating Funds
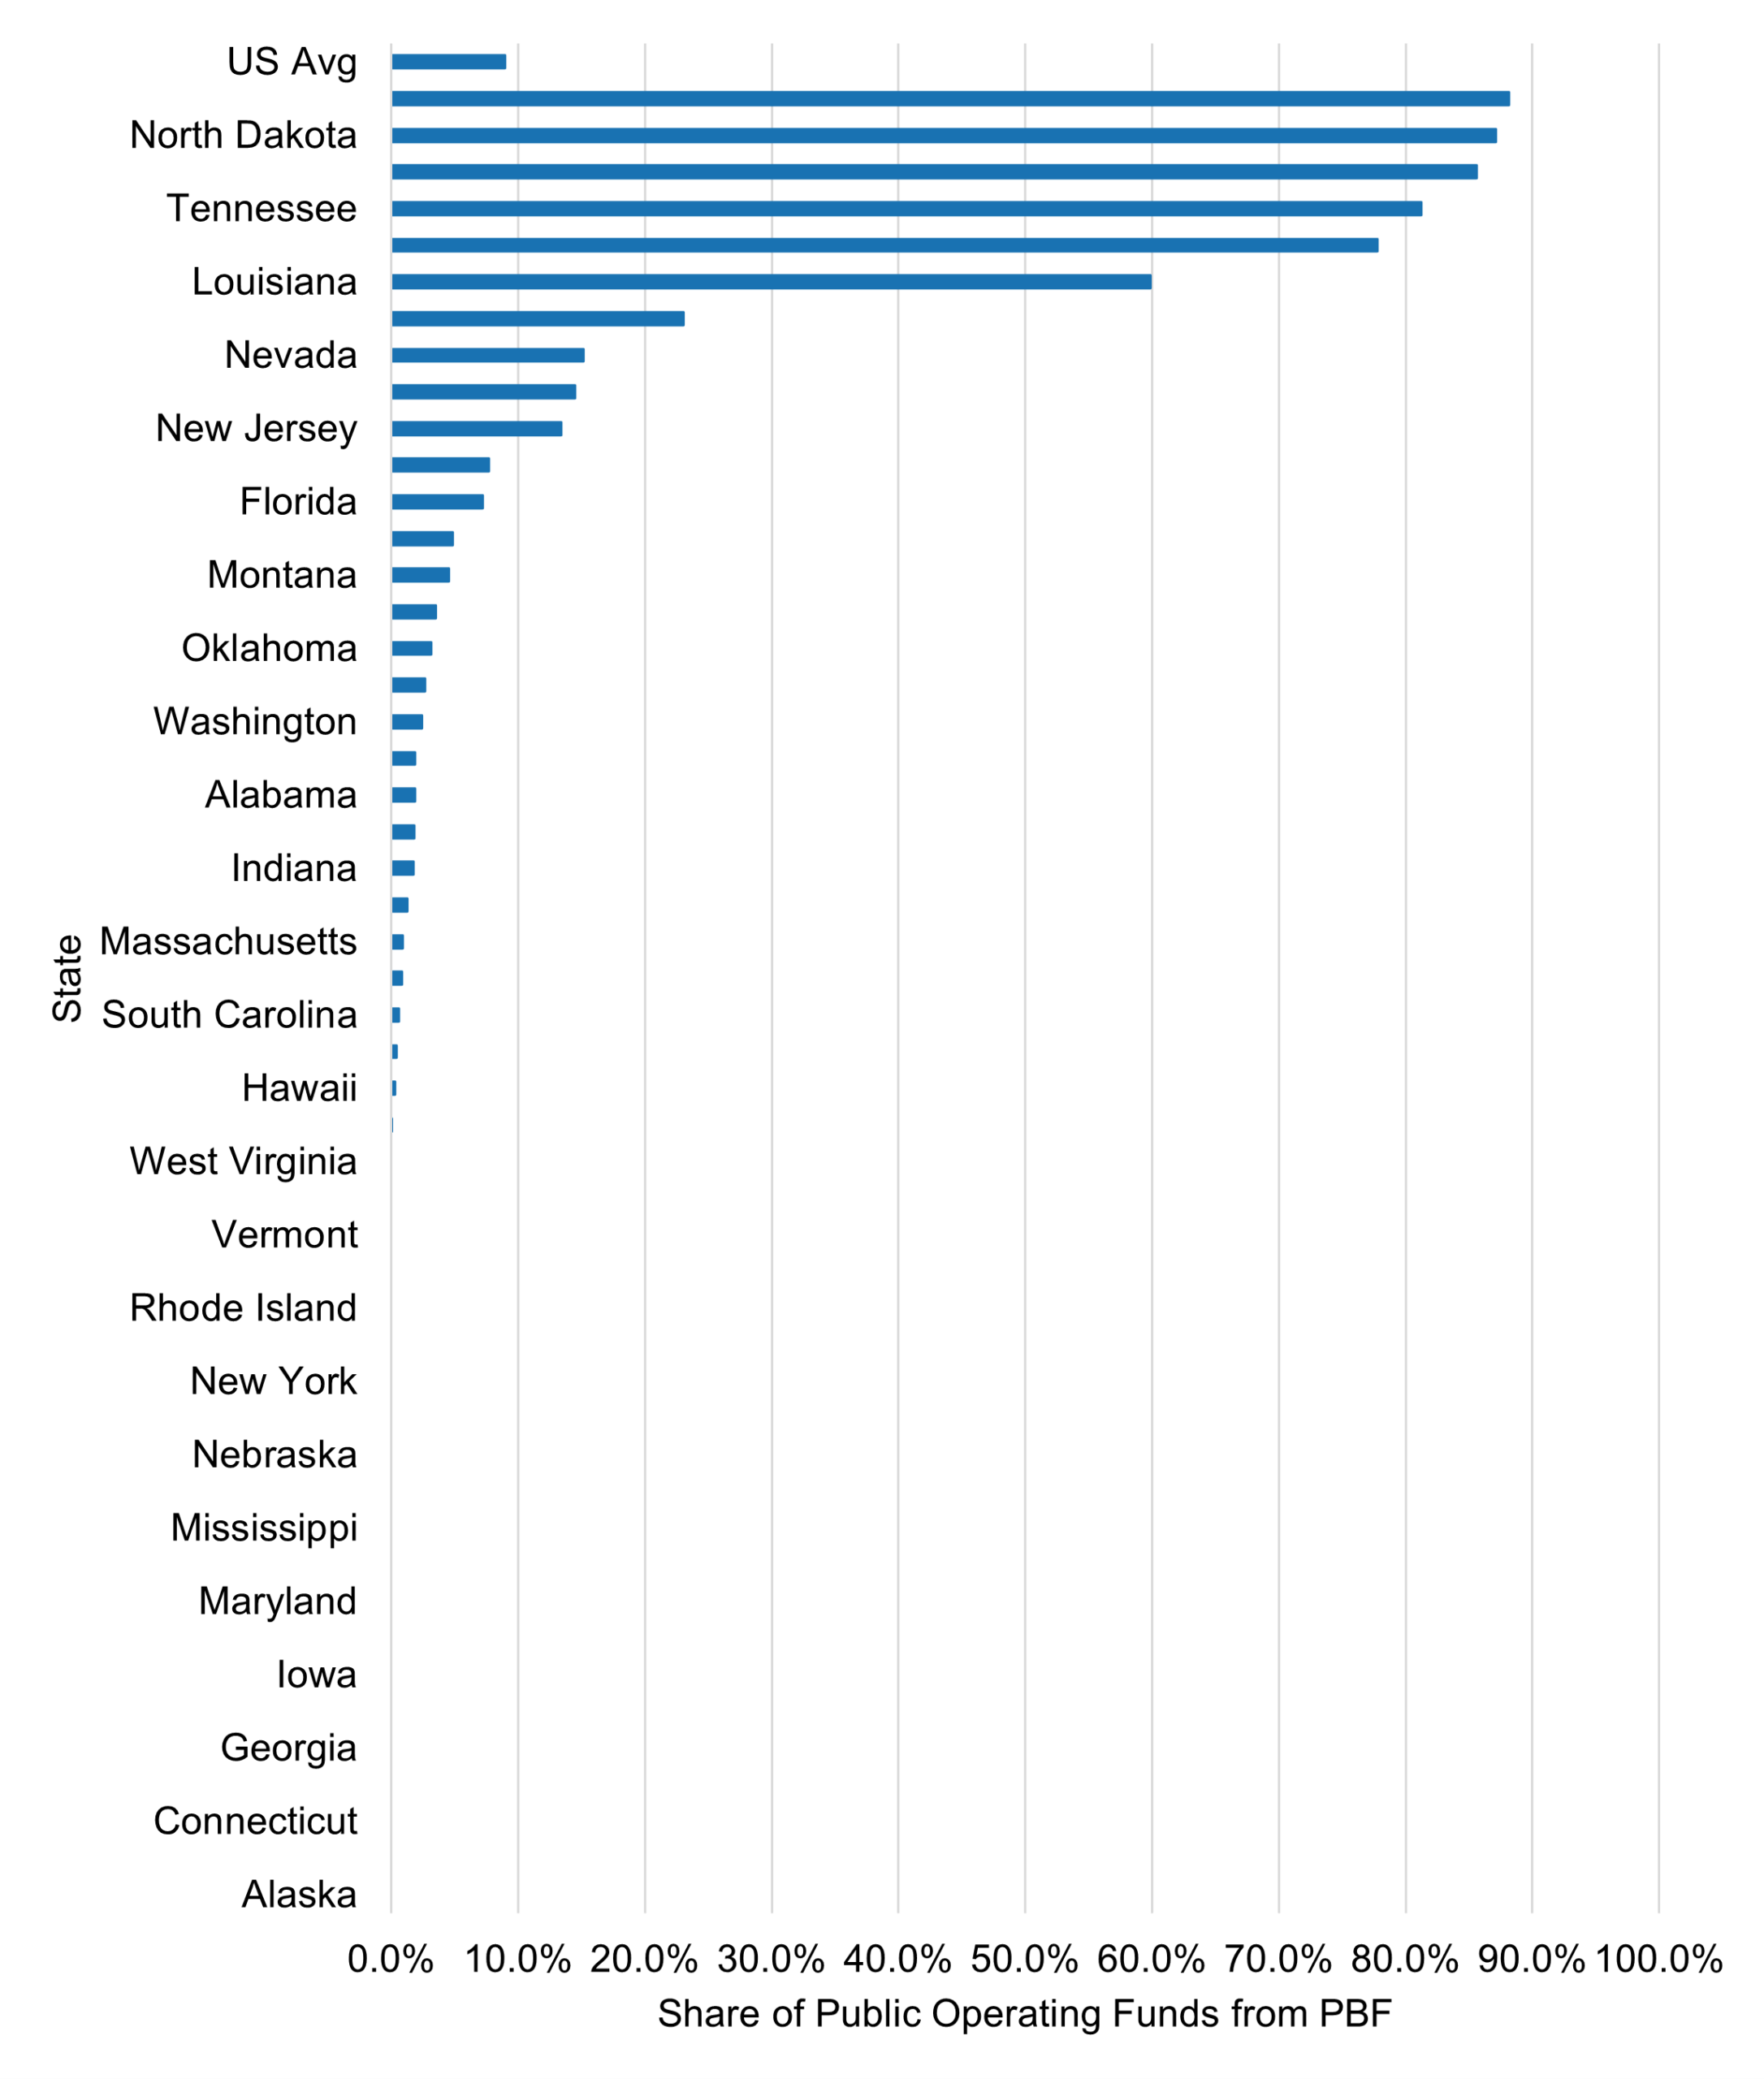
Source: SHEF’s FY2024 data on performance-based funding
Although SHEF now reports total PBF allocations, there is no national dataset indicating how much of this funding is allocated to the production of specific, industry-aligned degrees. Specific state examples, however, can illustrate the variation in scale and approach. In Kentucky, eight percent of the PBF model rewards institutions for producing “degrees and credentials that garner higher salaries upon graduation: STEM+H [health] fields, high-wage, high-demand fields,” amounting to approximately $66 million per year or $473 per student.[13] Similarly, Indiana, which ties a fairly small share of overall funding to institutional outcomes, allocates about five percent of its PBF model to incentivize completions of high-impact degrees (now simply STEM degrees) at its public institutions, which amounts to approximately $1.2 million per year or $5 per student.[14] Finally, the State University System of Florida awards up to 10 points (out of 100) for bachelor’s degrees in areas of “strategic emphasis” and another 10 points for graduate degrees in those same fields, which are updated every three years. Effectively, 10 to 20 percent of an institution’s performance-based funding could be tied to the production of degrees in areas of strategic emphasis, which means that across all institutions in the system at least $64 million per year, or $110 per student, is tied specifically to this outcome metric.[15]
The research literature, however, offers mixed evidence on whether PBF models achieve their intended effects. Studies consistently show that PBF has limited or no sustained impact on increasing degree completion, particularly at the bachelor’s level; that any positive effects tend to be small and short-lived; and that PBF can generate unintended consequences such as increased selectivity or shifts toward lower-cost, short-term credentials.[16] These findings suggest that while PBF can affect how resources flow to institutions, it may not be the strongest available lever to change student enrollment behavior or meaningfully increase the production of high-value credentials.
States differ in how they define high-value credentials, but their goals are consistent: incentivize institutions to produce more credentials that provide students with real economic value in the labor market.
Despite these limitations, states have increasingly introduced PBF metrics that reward institutions for producing credentials in fields designated as high-demand or high-value. As of 2020, at least 21 institutions incorporated metrics for production of STEM or healthcare-related degrees into their PBF formulas. Five of those institutions and an additional three institutions also had PBF metrics for evaluating students’ labor market outcomes.[17] These efforts align with Lumina Foundation’s “credentials of value” framework, which defines credentials of value as postsecondary awards that enable graduates to earn at least 15 percent more than the national median earnings for high school graduates.[18] As we discuss later in the paper, states differ in how they define high-value credentials, but their goals are consistent: incentivize institutions to produce more credentials that provide students with real economic value in the labor market.
State financial aid to students
In addition to state funding through appropriations, states also invest in postsecondary education through financial aid programs. Traditionally, state aid is understood along two dimensions: whether eligibility is based on financial need or academic merit, and whether the award is delivered to the student as a grant or a loan.[19] While these distinctions remain important, our analysis focuses on a third dimension, one that has been less visible in prior research: whether the aid is targeted to students who enroll in degree programs that are aligned with that state’s workforce priorities or high-demand occupations. Throughout this paper, we refer to this dimension of financial aid as “targeted” or “industry-aligned.”
To the best of our knowledge, no national dataset identifies whether state financial aid programs meet this definition. Using data from the National Association of State Student Grant and Aid Programs (NASSGAP), however, we constructed such a dataset (download the data: https://sr.ithaka.org/wp-content/uploads/2026/03/SR-Dashboard-High-Opportunity-Occupations-and-State-Financial-Aid-2026.xlsx). NASSGAP’s annual survey documents key characteristics of each state-funded aid program, including program name; award type (e.g., grant, loan, etc.); award criteria (e.g., need, merit); total expenditures; and students served. By examining program descriptions and state websites, we were able to identify which programs, across all states, target specific fields, industries, or occupations. See Appendix A for more information about how we classified these programs.
Using these data, we calculated the total amount of financial aid that states allocate to targeted programs. Figure 5 shows those states that allocate at least three percent of their total aid to targeted programs. A quarter of the states offer no targeted aid programs at all, and half of states allocate less than five percent of their overall financial aid expenditures to targeted programs.
Figure 5. Targeted vs. Non-Targeted Aid Expenditures by State
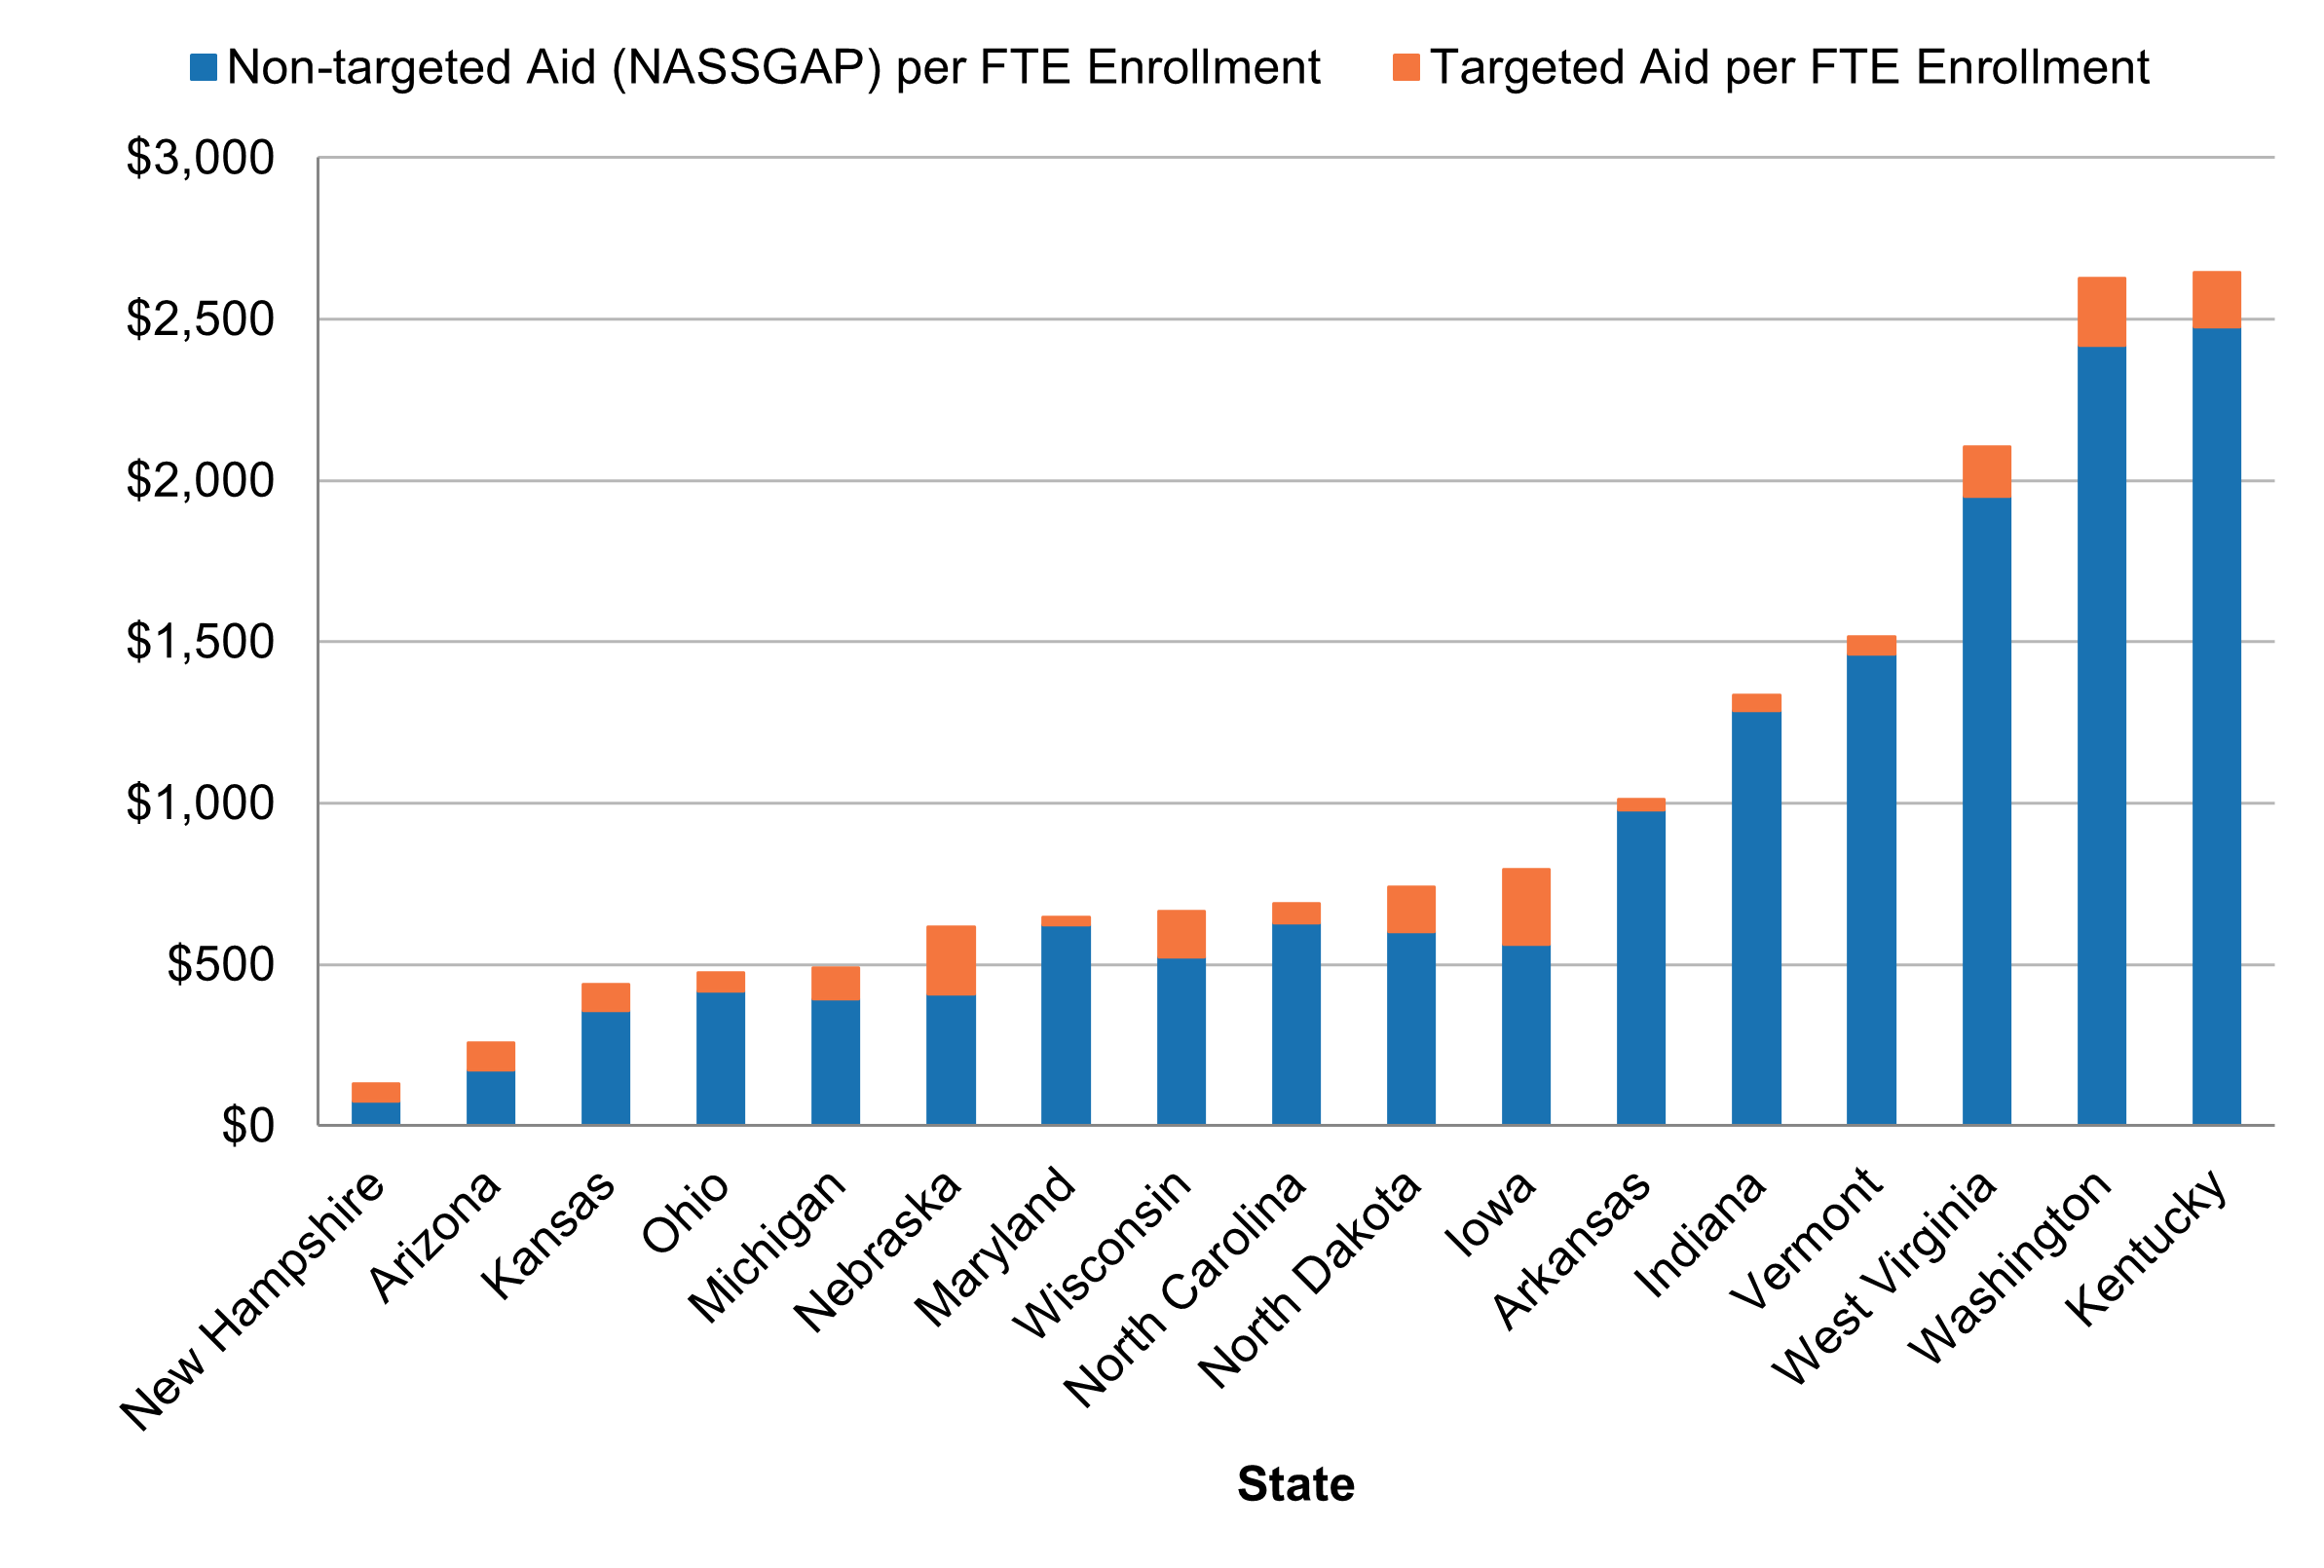
Note: Financial aid data comes from FY 2023 NASSGAP survey, and FTE enrollment figures come from SHEF 2023. Portrayed are the 17 states that dedicate at least 3 percent of their aid portfolio to targeted programs. Financial aid figures differ between NASSGAP and SHEF because the former reports expenditures by aid program, whereas the latter reports total state appropriations. In practice, states do not always disburse all appropriated funds; meanwhile, expenditures can include pass-through funds from other sources (commonly federal funding).
Even in states that offer targeted financial aid programs, most aid dollars still flow to non-targeted aid. Only a handful—New Hampshire (41 percent), Nebraska (34 percent), Arizona (33 percent), and Iowa (30 percent)—dedicate a substantial share of aid funding to industry-aligned programs, but in absolute terms, these targeted amounts are fairly small. All but four states in Figure 5 have per-student financial aid awards, across all award types, that are below the national average ($1,388), suggesting that states with limited aid budgets may turn to targeted aid as a strategy for concentrating resources where they will have the greatest effect. Should states want to pursue this further, most of them have room to allocate more funding to targeted programs.
Targeted aid can come in a variety of forms. Figure 6 shows how much money states are allocating to different types of targeted aid. A total of 37 states employ at least some targeted aid, with New Jersey reporting the lowest amount at approximately $150,000. At nearly $43 million, Washington State provides the greatest amount of targeted aid, while the next seven states provide amounts in approximately the $20 to $30 million range. Overwhelmingly, targeted aid is most commonly distributed in the form of grants. Conditional grants are the next most common aid type, followed by loan assumption or forgiveness programs. The “Other” category only appears in the state of Michigan and comprises a stipend the state provides to future educators during their required semester of student teaching.
A total of 37 states employ at least some targeted aid, with New Jersey reporting the lowest amount at approximately $150,000.
Figure 6. Funding Amounts to Various Types of Targeted Aid Programs
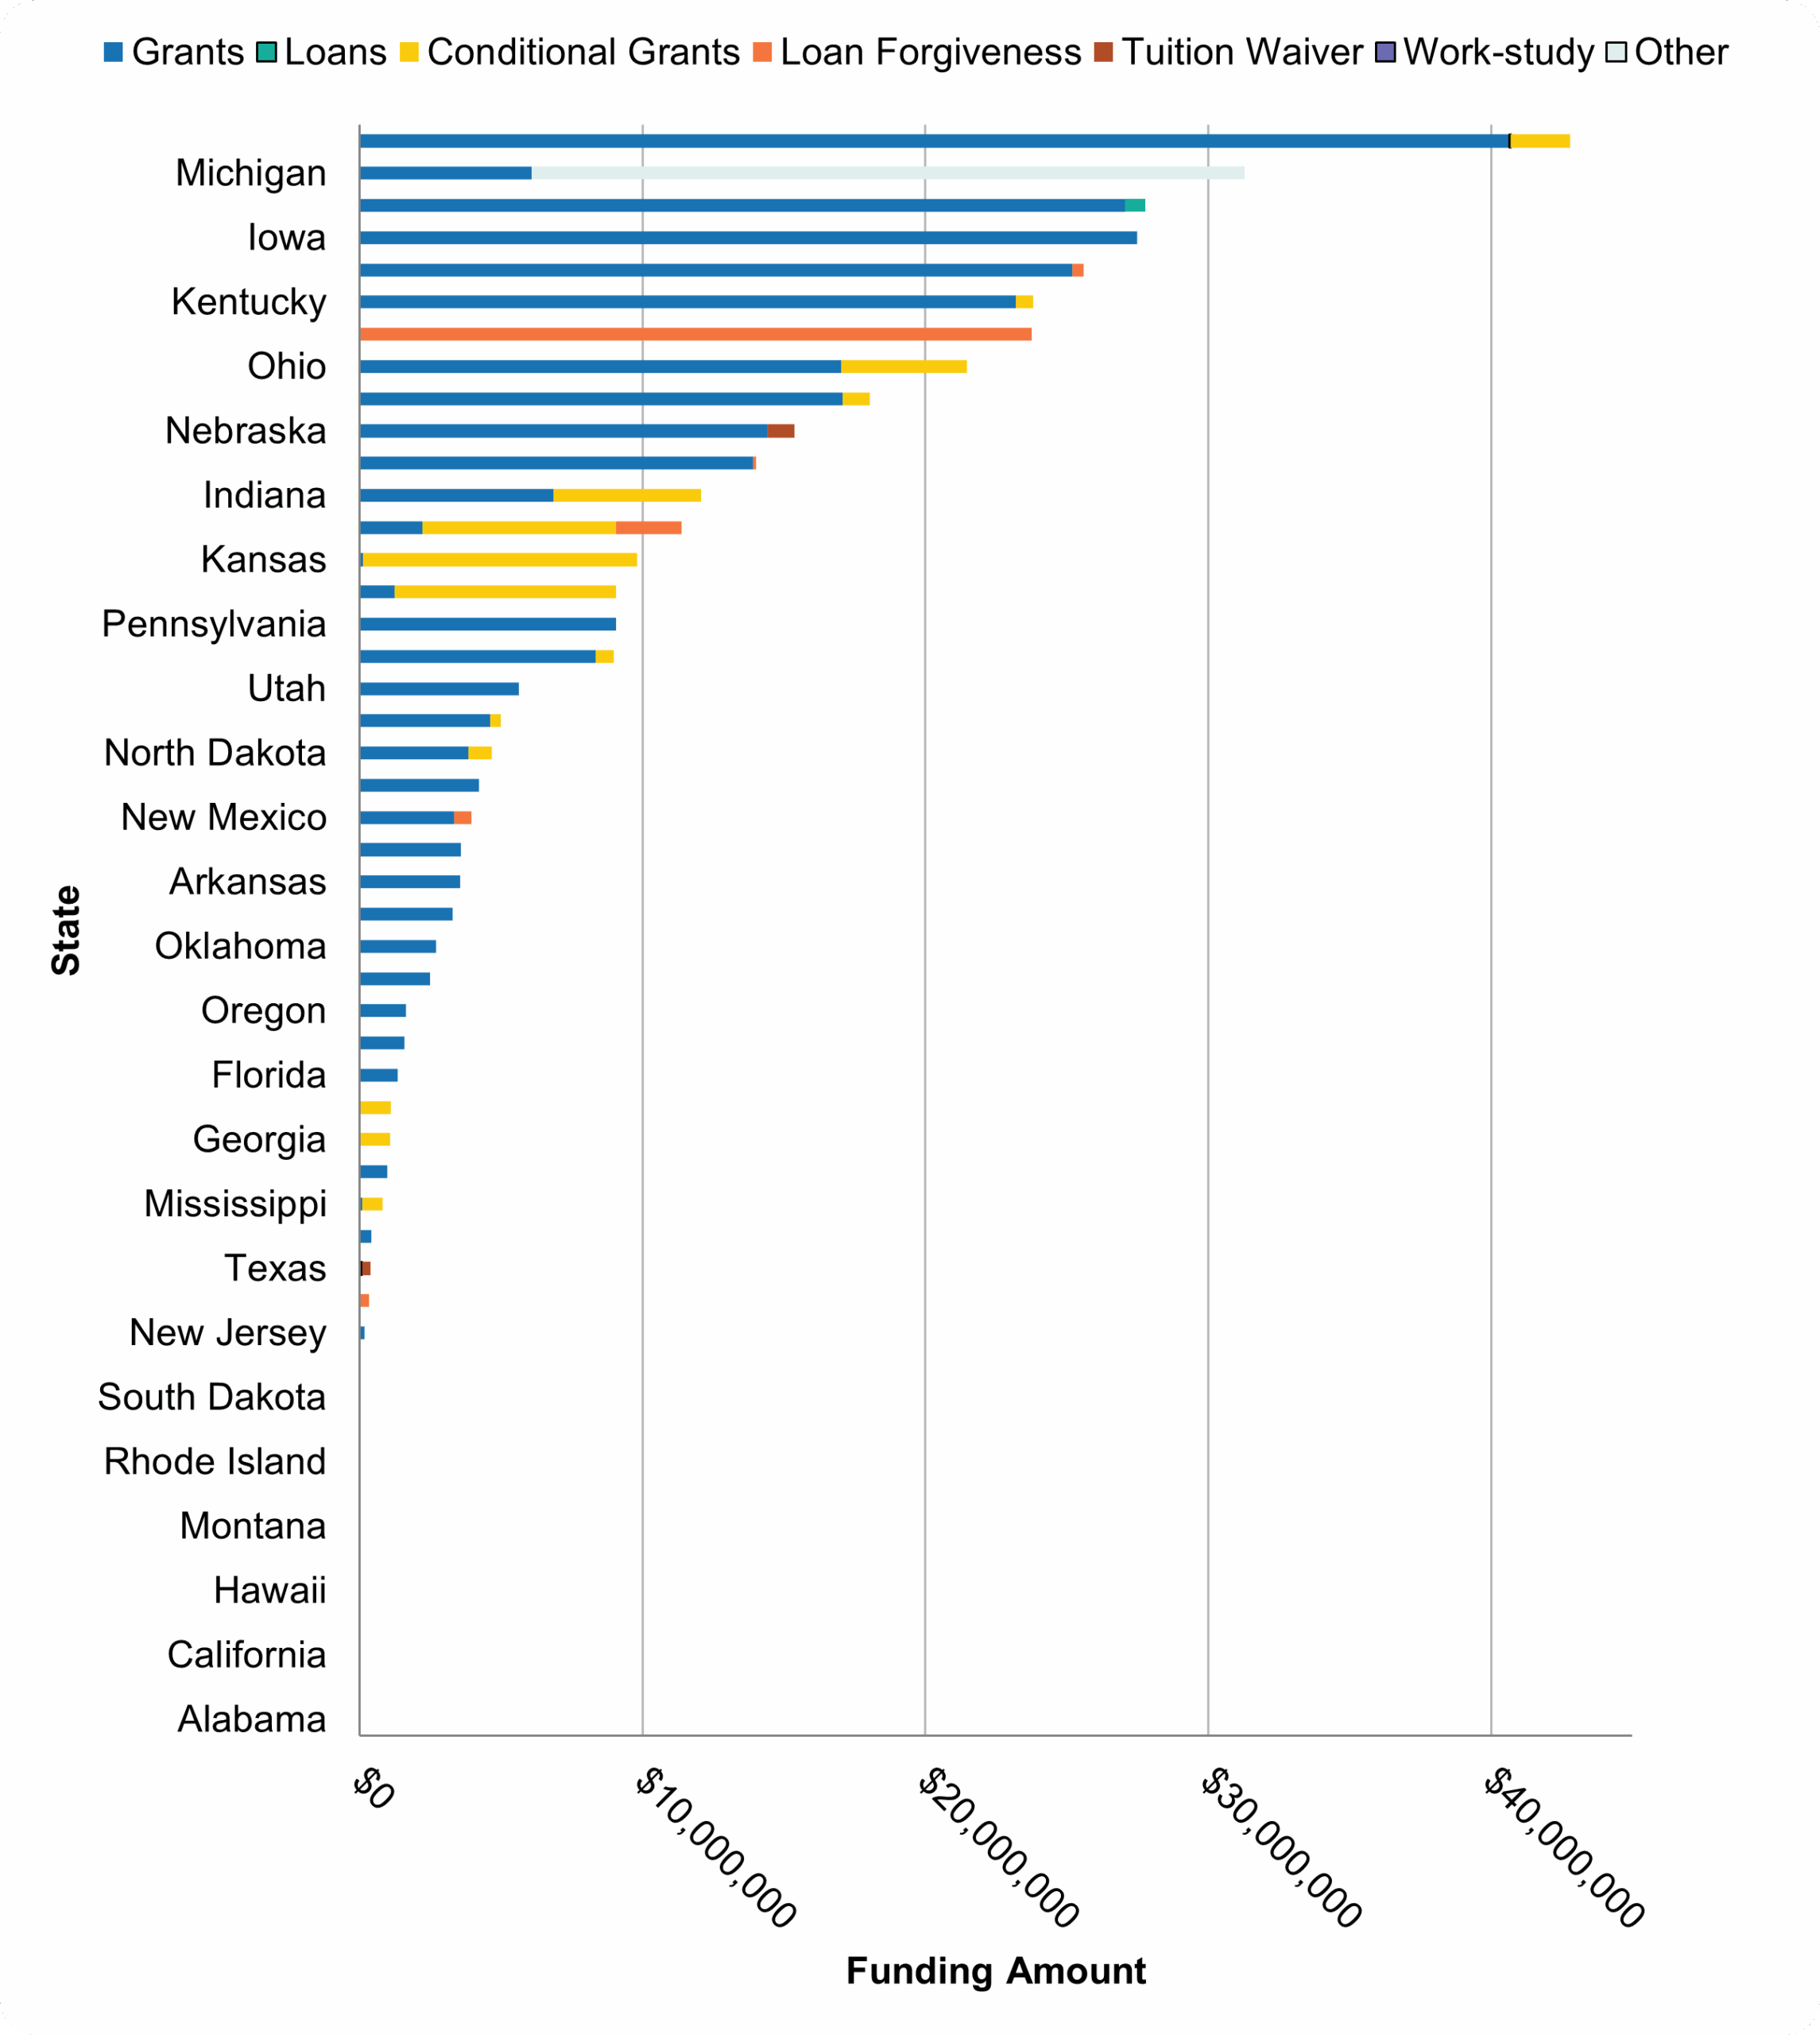
Source: FY 2023 NASSGAP data
Industry-aligned programs are often designed to increase the supply of graduates in specific fields. Our research reveals that these programs are most commonly focused on increasing the number of educators or healthcare professionals within the state; however, policymakers may target a wide variety of degree types. Sometimes, rather than targeting particular degree programs, policymakers will target a broad range of degree programs without any further specification of industries (e.g., some aid programs target STEM fields without then specifying any particular scientific industries). Below, we highlight some program examples:
- In North Dakota, students may apply for the ND Career Builders Scholarship,[20] which is a conditional grant program for students enrolling in one of the state’s extraordinarily large number of high-need and emerging occupations. The list is periodically updated, but as of the time of this writing, there were 2,700 eligible degree programs the state had connected to 152 occupations.
- Maryland offers the Teaching Fellows for Maryland Scholarship,[21] which is a much more narrowly targeted conditional grant specifically for future grade school or kindergarten teachers. There are no need- or merit-based eligibility requirements for the program, and even out-of-state students are now eligible.
- New Mexico’s Nursing Loan for Service program provides a forgivable loan to students going into professional healthcare fields who graduate and work in the state for the duration of the specified service requirement.[22] Borrowers earn some percentage of loan forgiveness for each year of service.
- The Arkansas Future Grant covers tuition and fees for certificate programs in regional high-demand areas of study or associate degree programs in STEM.[23]
- In Delaware, the Career-Based Scholarship provides aid to students enrolled at public or private colleges in a bachelor’s program leading to one of the state’s most in-demand career fields (e.g., accounting, computer science, nursing).[24]
- In Wisconsin, the need-based Wisconsin Grant allocated $26,195,430 to technical colleges in FY2023.,[25] We highlight this grant as one that is similar to the kind of targeted aid on which we focused but that is too broad for inclusion according to our criteria. Although we did include other financial aid targeting career and technical programs, we excluded ones such as the Wisconsin Grant because they were available to students in any and all majors housed within the state’s technical colleges (i.e., not specific enough in their targeting).
As we discussed earlier, states typically use grants to award their targeted financial aid, but there are examples of other types of mechanisms like conventional loans, conditional grants or loans, or income-contingent financing.[26] The Texas FORWARD loan is an example of a conventional loan program for students enrolled in programs aligned with high-value credentials and high-demand occupations.[27] The program offers low-interest loans and some flexibility with repayment terms should borrowers fall below a certain income threshold or face financial hardship, but it otherwise operates on a standard 10-year repayment term.
Income-contingent programs offer loans to students, who then later repay an amount based on their income. The programs and repayment terms may be structured in a variety of ways, and many also feature a loan assumption or forgiveness element once a borrower makes a set number of repayments. For example, New Jersey has partnered with non-profit organization Social Finance to offer the Pay It Forward loan, which provides borrowers enrolled in programs leading to high-demand occupations with a zero percent interest loan. Upon graduating, borrowers only begin repaying the loan should their income meet a minimum threshold amount, and repayment terms are capped at five years and no more than the initial balance of the loan.[28]
An alternative to income-contingent finance is a conditional grant, which is administered as a grant but is converted into a loan if the recipient fails to meet certain conditions, normally a set number of years of service in a particular industry within the state administering the loan. For example, West Virginia’s STEM Scholarship Program is available to students who major in STEM and agree to work full-time in a STEM field in the state.[29] Recipients must work one year for each year they received the scholarship, or else the grant converts into an interest-accruing loan that must be repaid. Indiana’s Next Generation Hoosier Educators Scholarship is an example of a merit-based conditional grant for students pursuing a career in education. To be eligible, recipients must meet certain academic thresholds in terms of class rank, ACT or SAT score, and GPA.[30]
High-opportunity occupations
Together, the patterns described in the previous section illustrate the wide variation in how states deploy higher education dollars through both direct support and financial aid programs. However, understanding how states spend is only half of the picture. To evaluate whether these investments are positioned to meet states’ workforce goals, we must also understand what states need—specifically, which occupations provide strong economic opportunities for residents and require the kinds of credentials that higher education systems produce. Identifying these “high-opportunity” occupations allows us to assess whether state funding strategies—especially targeted financial aid, which directly shapes student choices—are aligned with labor market demand. The next section develops a consistent, state-specific definition of high-opportunity occupations and uses it to map the fields where strategic investment is most likely to yield strong returns for students and for state economies.
Identifying these “high-opportunity” occupations allows us to assess whether state funding strategies—especially targeted financial aid, which directly shapes student choices—are aligned with labor market demand.
The concept of a “high-opportunity” occupation has taken on increasing importance as states seek to align postsecondary education with workforce needs. Yet definitions of what constitutes such an occupation vary widely across institutions and state agencies. Most converge on a set of core variables, such as wages, projected job growth, the number of openings, and the level of education or training required, but the weight and thresholds attached to each factor differ. The Federal Reserve Banks of Cleveland, Atlanta, and Philadelphia, for example, identify “opportunity occupations” as those paying above the national median wage (adjusted for regional cost-of-living differences) and not requiring a bachelor’s degree.[31] Georgetown University’s Center on Education and the Workforce defines a “good job” as one that pays above the national median while also meeting minimum age-specific thresholds. It then identifies “promising occupations” as those where a majority are good jobs and where workers on a particular educational pathway are more likely to be employed than in the economy overall.[32]
State agencies have also experimented with their own formulas. California’s Employment Development Department and the Ohio Governor’s Office of Workforce Transformation publish lists of in-demand fields primarily ranked by projected job openings, sometimes further broken down at a regional level.[33] Washington’s Employment Security Department employs a more complex methodology to define “occupations in demand,” requiring jobs to meet region-specific thresholds for both growth and share of projected openings.[34] Kentucky’s Workforce Innovation Board employs a weighted scoring model that places the greatest emphasis on current demand, while Alabama requires occupations to clear various criteria, including multiple wage floors, growth projections, and annual opening counts, before being classified as in-demand.[35] Taken together, these approaches underscore the flexibility states have in tailoring definitions to their local labor markets, while also revealing the usefulness of a consistent, nationally applicable framework.
For the purposes of this paper, we adopt a definition that reflects both the lessons of existing frameworks and the need for consistency across states. We define high-opportunity occupations as those that pay wages at or above the 75th percentile of individual income within a state, offer at least the median number of annual job openings in the state, and are projected to grow at or above the state’s median growth rate through 2032. To ensure accessibility for a broad range of students, we further limit our scope to occupations that typically require some postsecondary education or on-the-job training, but no more than a bachelor’s degree. To explore our data using an interactive excel tool, click here: https://sr.ithaka.org/wp-content/uploads/2026/03/SR-Dashboard-High-Opportunity-Occupations-and-State-Financial-Aid-2026.xlsx.
By using state-specific thresholds, this approach recognizes variation in labor markets across regions. At the same time, by requiring a combination of high wages, strong demand, and accessible educational pathways, it ensures that identified occupations represent real opportunity for students and real value for states seeking to strengthen their economies.
What occupations emerge?
Applying our definition of high-opportunity occupations to 2023 Bureau of Labor Statistics data identifies 218 distinct occupations that qualify as high opportunity in at least one state. Nationally, these occupations are concentrated in a handful of broad fields: management roles account for roughly 34 percent of all high-opportunity openings, followed by business and financial operations (23 percent) and computer and mathematical occupations (14 percent).[36] Figure 7 reports the top 10 occupations in terms of national high-opportunity openings share.
Nationally, these occupations are concentrated in a handful of broad fields: management roles account for roughly 34 percent of all high-opportunity openings, followed by business and financial operations (23 percent) and computer and mathematical occupations (14 percent).
Within management, three occupations stand out as especially common. General and operations managers represent 15 percent of national high-opportunity openings, and more than two in five of all management positions on state lists. Both financial managers and medical and health services managers make up another three percent nationally, and between them make up 18 percent of high-opportunity management positions. These occupations are not only numerous but also widespread across states: general and operations managers appear on 47 of 51 state and District of Columbia high-opportunity lists, financial managers on 49, and medical and health services managers on 50.
Figure 7: Top 10 Occupations in Terms of National High-opportunity Openings Share
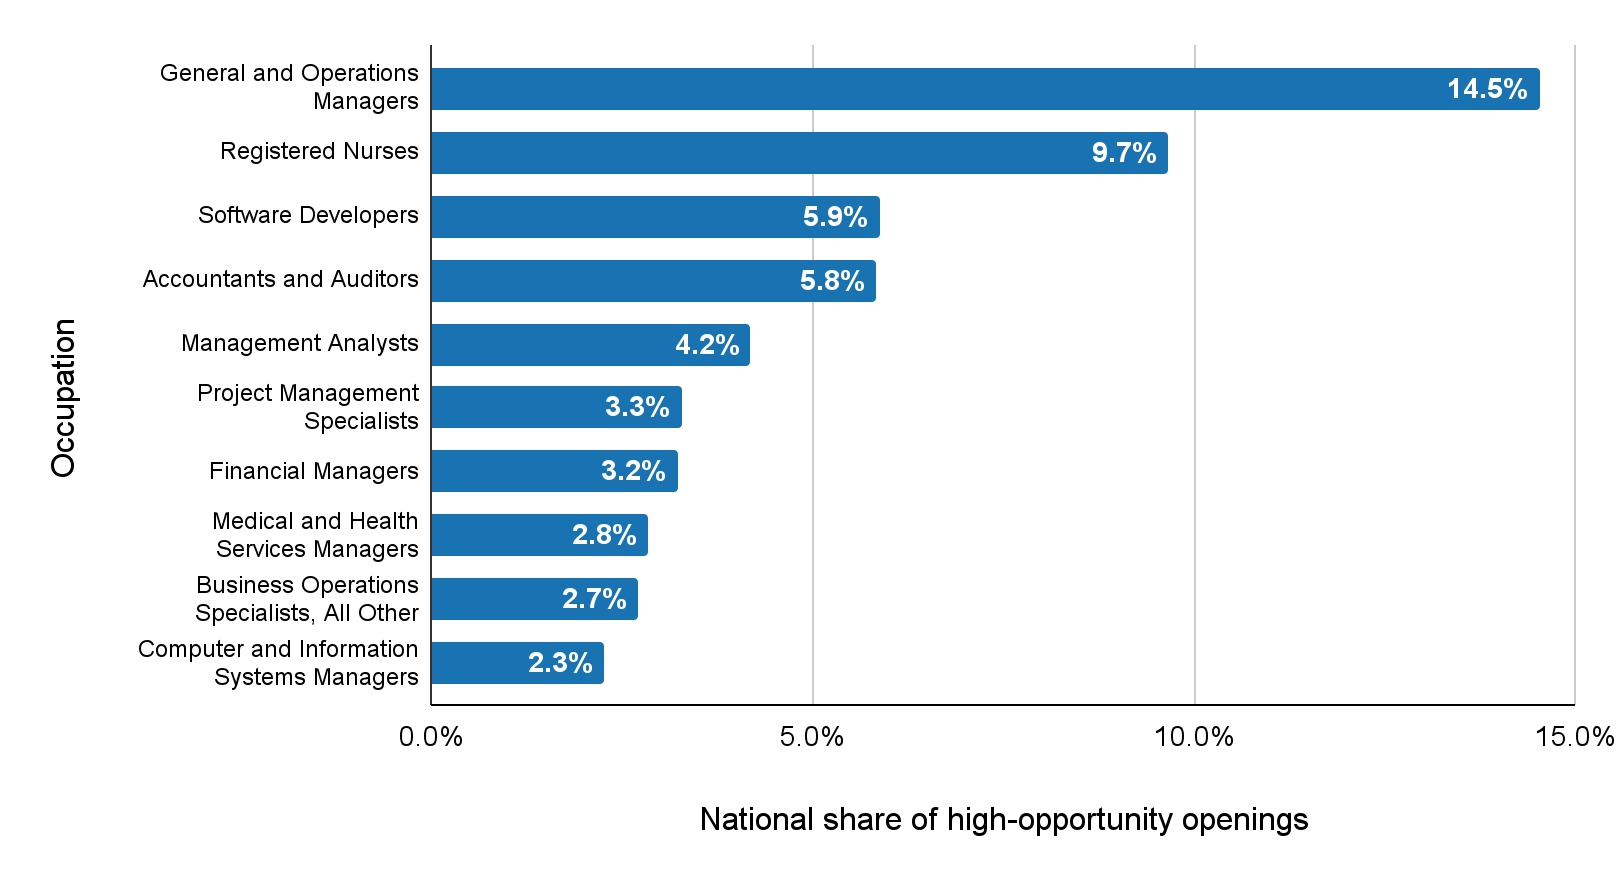
Figure 8: Occupations that Appear on at least 45 High-opportunity Lists across US States + DC
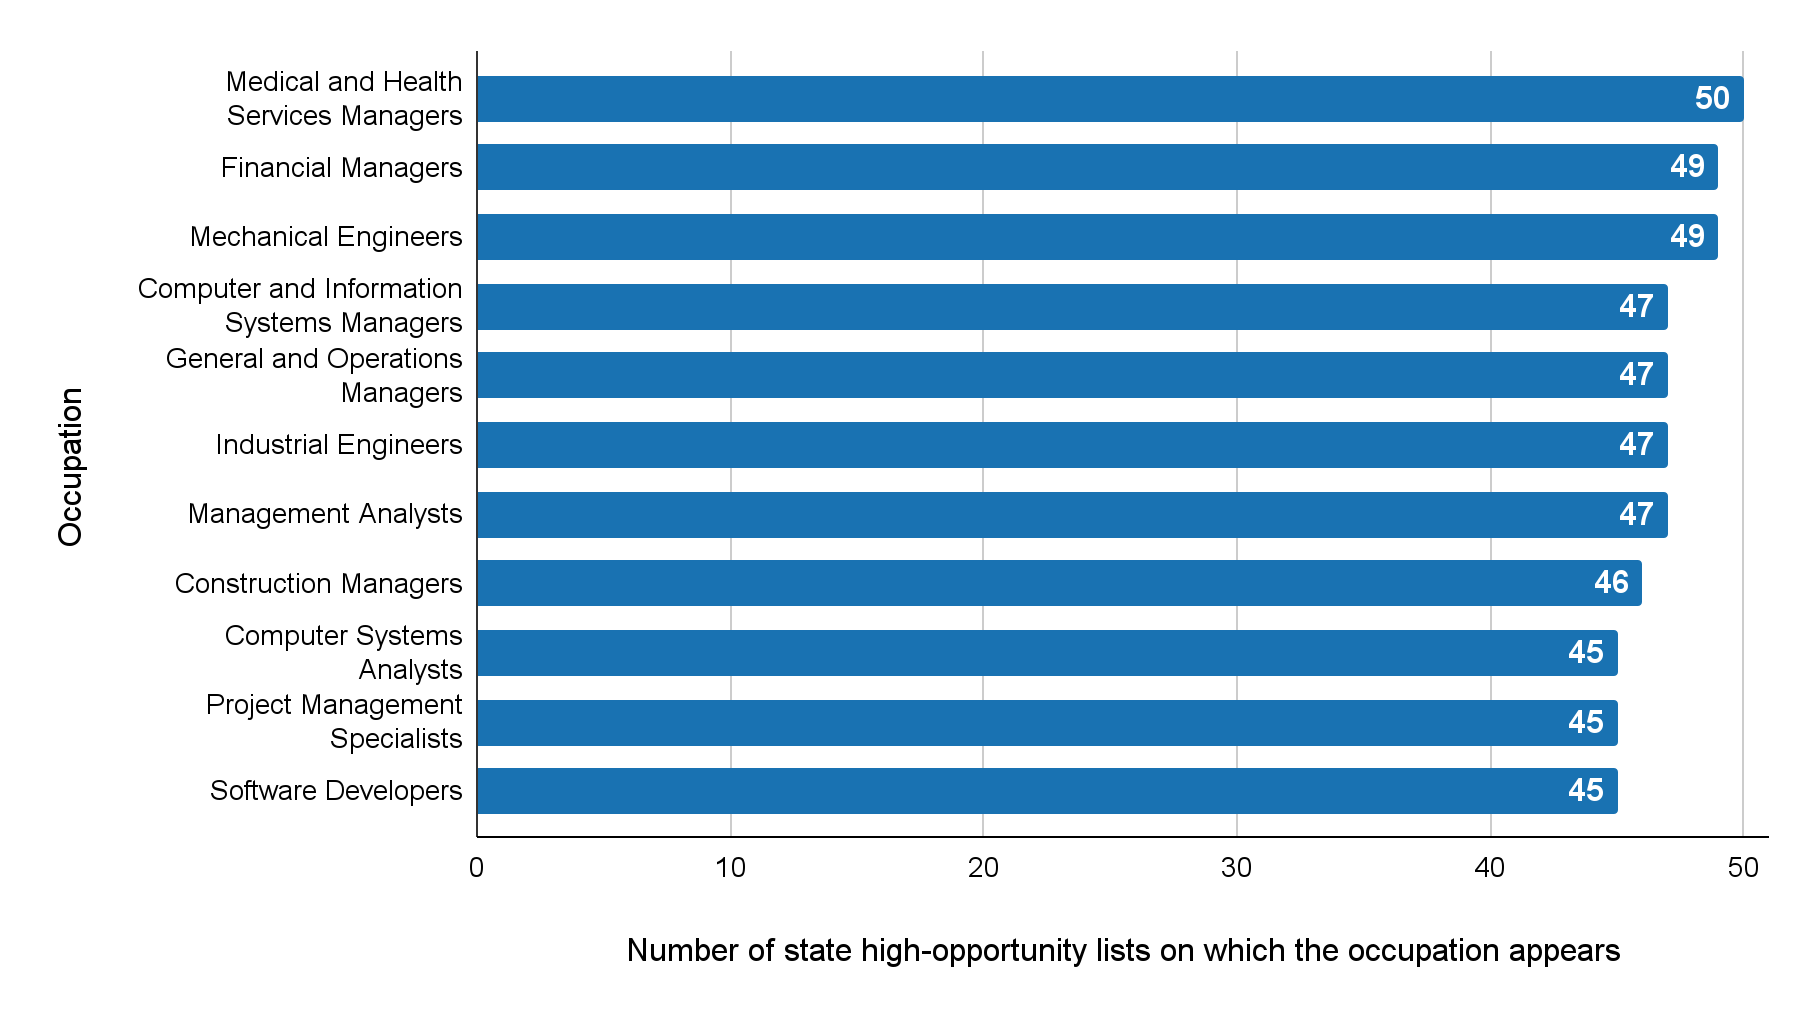
Within the Business and Financial Operations group, the three most common occupations account for 57 percent of all high-opportunity openings within the occupational group. Accountants and auditors account for six percent of national high-opportunity openings and a quarter of all openings within this occupational group. They meet the high-opportunity threshold in 37 states. Management analysts represent 4 percent of national openings, 18 percent of openings within Business and Financial Operations, and feature on 47 state lists. Project management specialists comprise 3 percent nationally, 14 percent within the group, and appear on 45 state lists.
A similar pattern of concentration appears in the Computer and Mathematical group, where three roles account for 65 percent of its high-opportunity openings. Software developers make up 6 percent of national openings, 42 percent of those within this occupational group, and appear on 45 state lists. Computer systems analysts comprise 2 percent nationally and 12 percent within Computer and Mathematical, and are recognized as high opportunity in 45 states. Computer occupations (all other) represent two percent nationally, 11 percent within this group, and appear on 41 lists.
Healthcare practitioners and technicians are also prominent, making up 12 percent of high-opportunity openings. Registered nurses alone make up 10 percent of all high-opportunity openings nationally, and 82 percent of high-opportunity healthcare practitioner jobs.
Across the over 200 occupations identified as high opportunity, 57 percent typically require at least a bachelor’s degree. Within management, only a few high-opportunity roles—funeral home managers, food service managers, and property, real estate, and community association managers—typically require less than a bachelor’s degree, and each qualifies as a high opportunity occupation in no more than seven states. In the Business and Financial Operations group, just one occupation, claims adjusters, examiners, and investigators, meets the high-opportunity threshold without requiring a four-year degree, and only in a single state (Arkansas). Similarly, in the Computer and Mathematical group, computer network support specialists are the only occupation that typically requires no more than an associate’s degree. They represent about 2 percent of openings in the Computer and Mathematical group, and are classified as high opportunity in 14 states.
Although a bachelor’s degree is the point of entry for most high-opportunity roles, a handful of occupations that require less formal education still provide strong wages and growth potential. The largest among these are dental hygienists, who account for 0.82 percent of national high-opportunity openings (over 16,000 annually) and appear on 39 state lists. The next largest is police and sheriff’s patrol officers (0.77 percent of national openings and recognized as high-opportunity in nine states).
Together, these patterns suggest that while most high-opportunity work is concentrated in occupations requiring a bachelor’s degree or higher, there remain meaningful pathways to economic mobility for workers with sub-baccalaureate credentials, though these opportunities are less consistently distributed across states.
Figure 9: Top 10 Occupations in Terms of National High-opportunity Openings Share, Typically Do Not Require a Bachelor’s Degree
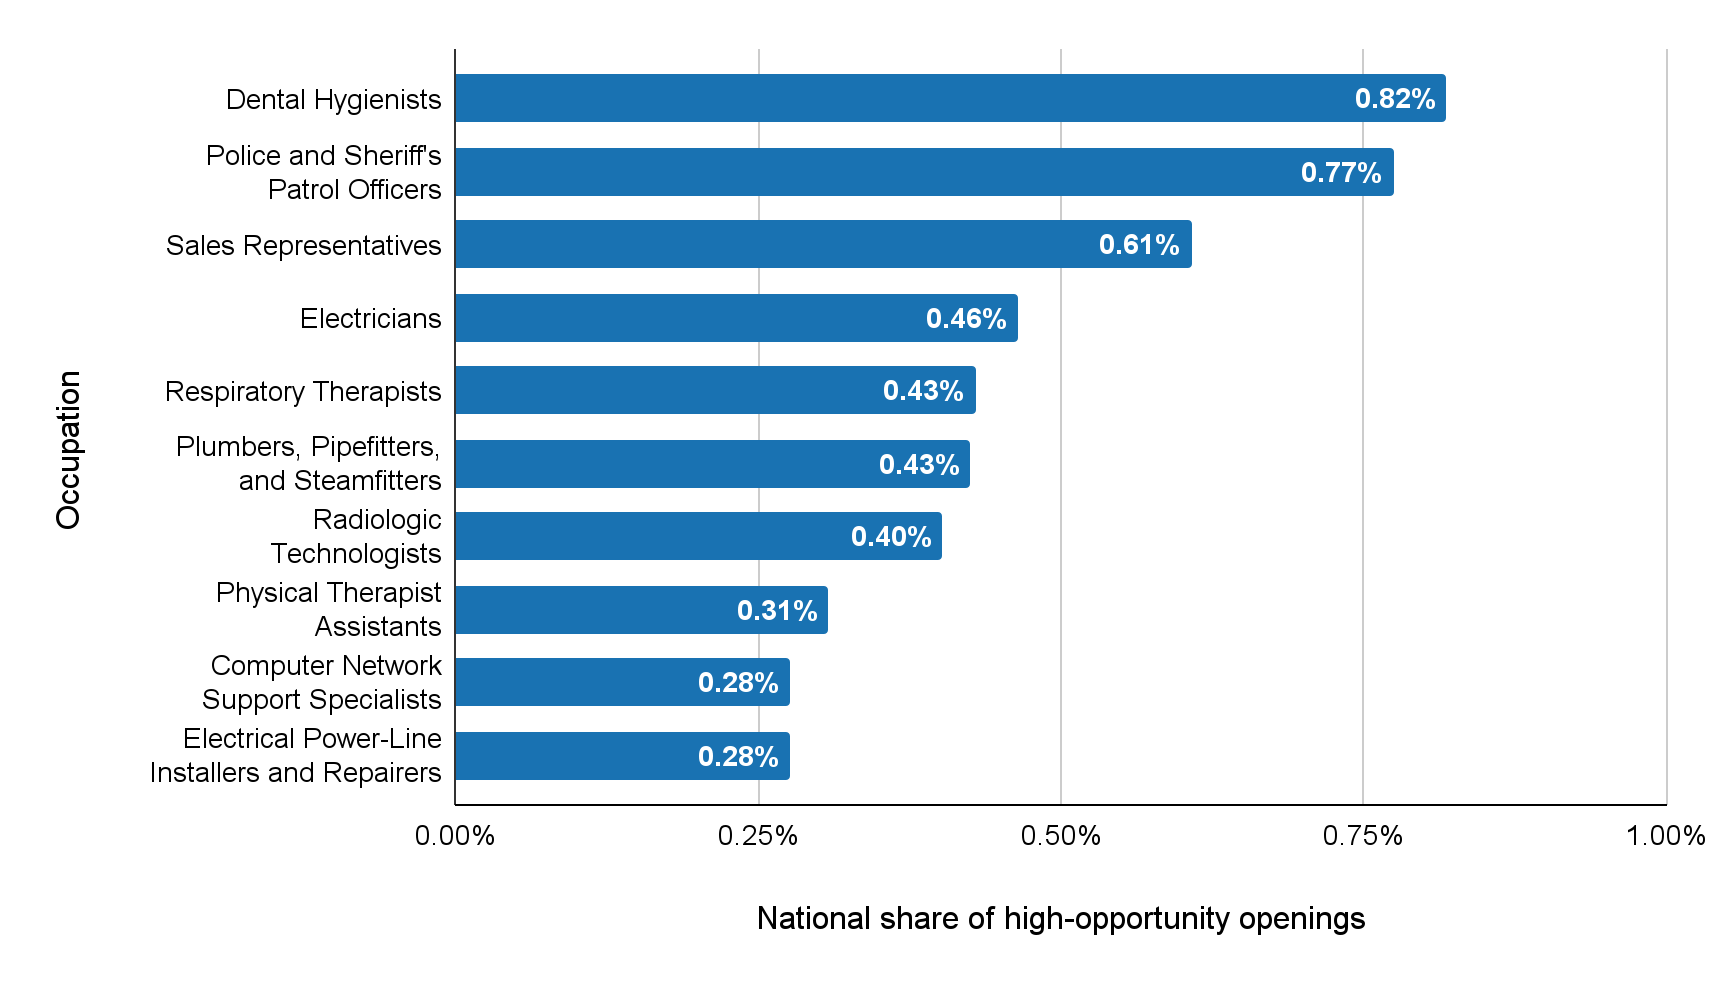
Notes: The full title for Sales Representatives is “Sales Representatives, Wholesale and Manufacturing, Except Technical and Scientific Products.”
Our definition of high-opportunity work is intentionally strict, requiring at-or-above-median job openings and growth, along with wages at or above the 75th percentile, with thresholds calculated within states. As a result, occupations vary widely in how commonly they qualify as high-opportunity across states. Among management occupations, the median role meets high opportunity criteria in 21 states. The median Business and Financial Operations occupation meets these criteria in 10 states, and the median Computer and Mathematical occupation in 20. Taken together, these patterns suggest that while management, business, and technology roles are common sources of high-opportunity work, not all occupations within these broad fields qualify equally across the country. The extent to which a given occupation meets state-level opportunity thresholds depends on local industry mix, demand for specific skills, and wage structures. For policymakers designing targeted financial aid programs, these findings point to the usefulness of using occupation-level, state-specific data to understand how opportunity can differ even within broadly in-demand fields such as “STEM” or “business.”
Taken together, these patterns suggest that while management, business, and technology roles are common sources of high-opportunity work, not all occupations within these broad fields qualify equally across the country.
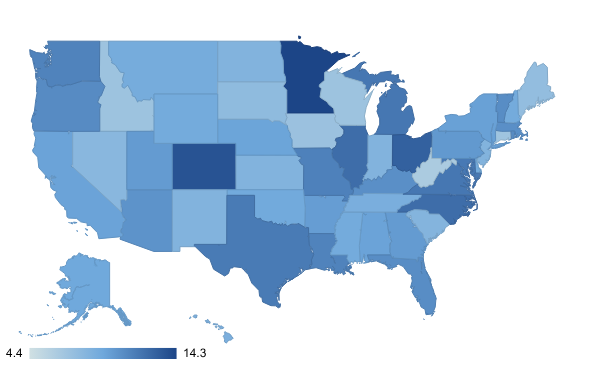
Looking across states, the share of total job openings that qualify as high-opportunity varies widely (Figure 10 and Figure 11). For the median state, about 9 percent of annual openings are in occupations that meet our criteria for high opportunity. A few states stand out for having especially large shares of high-opportunity work. In Minnesota, where 14.3 percent of openings are in high-opportunity roles, general and operations managers lead with 6,700 annual openings, followed by registered nurses (4,120) and software developers (3,220). The state with the next largest high-opportunity share is Colorado at 13.6 percent. Its set of high-opportunity jobs are led by business operations specialists (6,420 openings), general and operations managers (5,480), and software developers (4,460). At the other end of the distribution, the areas with the smallest share of openings in high-opportunity occupations are the District of Columbia at 4 percent and West Virginia at 6 percent.
Figure 10: Top 10 States in Terms of High-opportunity Share of Total State Openings
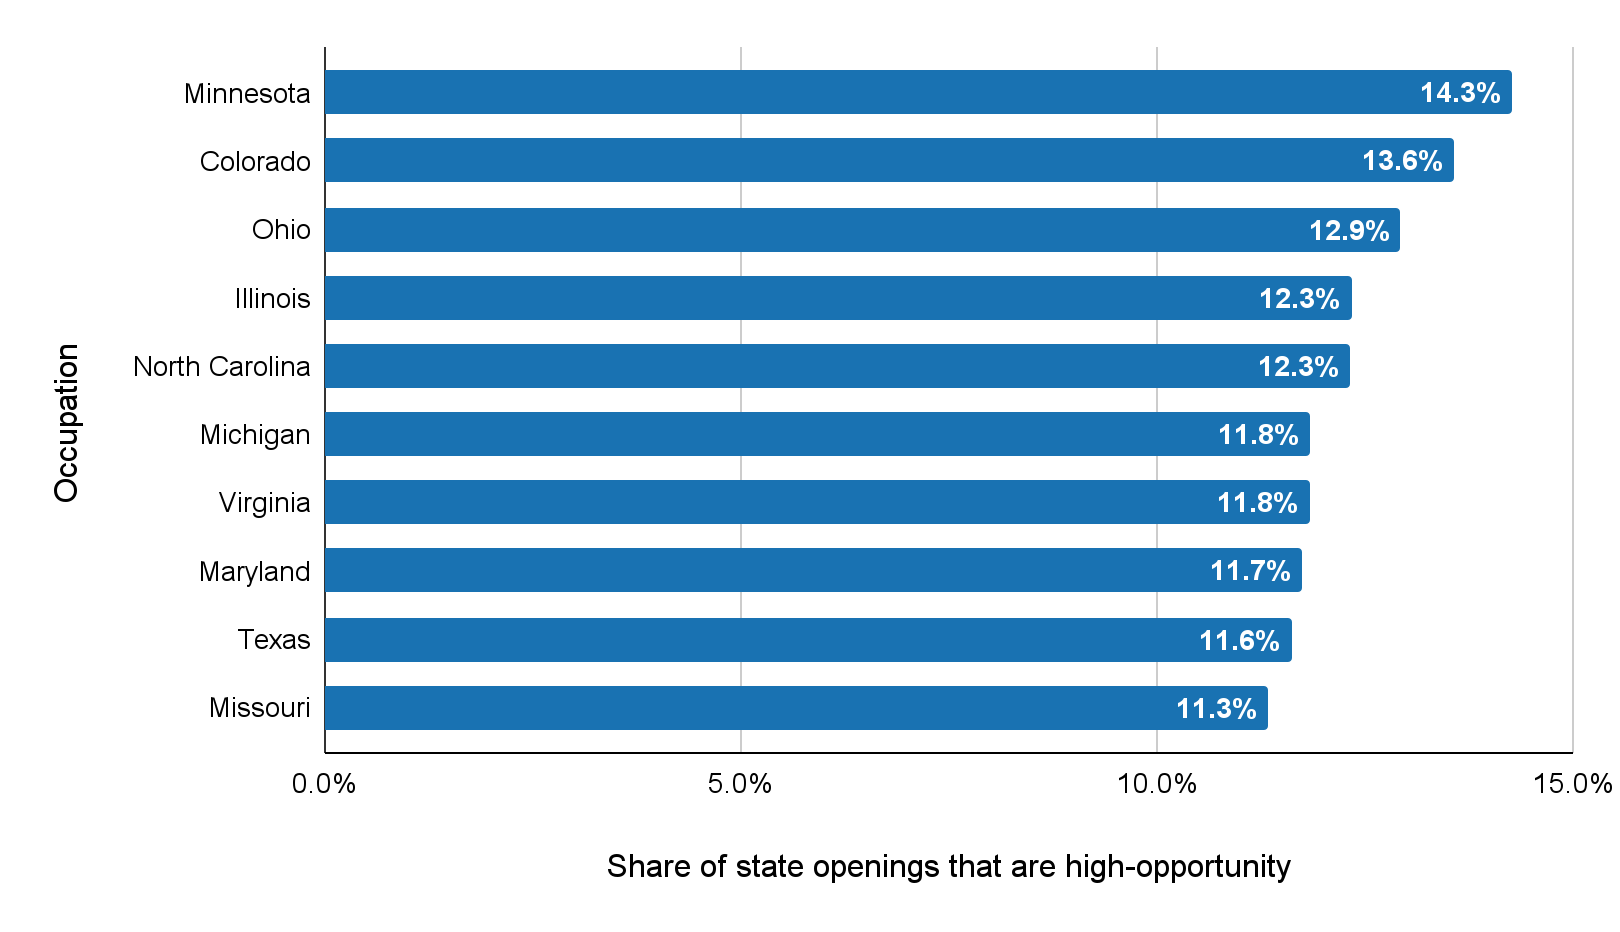
Figure 11: Map Showing the Share of Openings that are High-opportunity across US States
What do we know about alignment?
States invest in targeted financial aid with the aim of steering students toward certain professional pathways, raising the question of how these targeted occupations compare to the labor market opportunities in a given state. This section examines how the fields prioritized by targeted financial aid programs align with those showing the strongest labor market outcomes nationally and in three states: Nebraska, North Carolina, and New York.
Nationally, 27 percent of all US targeted financial aid expenditures for which undergraduates are eligible were directed exclusively toward teaching and education, while K-12 teaching jobs very rarely qualified as “high-opportunity” in any state. This suggests that states often use aid to incentivize entry into fields with high social value and modest economic returns, rather than exclusively using it to promote economic mobility. Conversely, business-related occupations constituted a large share of high-opportunity openings, but no aid programs exclusively targeted business-related fields of study. Similarly, while STEM occupations account for roughly one-fifth of high-opportunity openings, less than 10 percent of targeted aid expenditures in 2023 were directed exclusively toward STEM programs.[37]
Nebraska stands out nationally for the extent to which its financial aid system targets particular fields. In 2023, 34 percent of all state financial aid funding supported programs particular to specific industries, second highest in the country behind Iowa at 36 percent.[38] Nebraska’s largest initiative, the Nebraska Career Scholarship, exemplifies this approach.[39] The program provides grants to students pursuing credentials in fields tied closely to the state’s priorities, including business, computer science, agriculture, healthcare, engineering, skilled trades, and education. While this program targets a broad set of industries, it notably does not extend to fields such as the social sciences, humanities, arts and design, or natural sciences. In 2023, it disbursed roughly $13 million, accounting for more than 80 percent of Nebraska’s total spending on targeted aid.
The fields prioritized through the Nebraska Career Scholarship align closely with the state’s high-opportunity occupations, which mirror national patterns. The roles with the largest number of high-opportunity openings in Nebraska include general and operations managers, accountants and auditors, software developers, and registered nurses. Together, management, business, computer and mathematical, and health practitioner occupations account for nearly 90 percent of Nebraska’s high-opportunity openings. Although education is one of the targeted fields under the Career Scholarship, teaching occupations do not meet the state’s threshold for high-opportunity jobs, reflecting a commitment to credential production in fields that are economically high-performing and those that are socially essential.
North Carolina’s approach to targeted aid centers on addressing critical workforce shortages. In 2023, 9 percent of the state’s higher education aid was devoted to programs tied to specific occupations. The largest by far was the Forgivable Education Loans for Service (FELS) program, which accounted for roughly 90 percent of North Carolina’s targeted aid spending, disbursing $21.7 million that year.[40] FELS provides state-funded loans to students pursuing degrees in education, nursing, allied health, and medicine, fields that the North Carolina State Education Assistance Authority identifies as “critical employment shortage professions.” Borrowers who graduate and secure full-time employment in one of these fields within the state have their loans forgiven, with one year of funding canceled for each year of qualifying work.
The state’s second targeted program, the North Carolina Teaching Fellows Program, follows a similar model but is tailored specifically to the teaching workforce.[41] It offers forgivable loans to students preparing to teach in STEM or special education, with accelerated loan forgiveness for those who take positions in low-performing schools. Together, these programs illustrate a deliberate strategy: using financial aid to strengthen pipelines into service-oriented occupations, especially teaching and healthcare, where labor shortages are persistent and socially consequential.
The occupations supported through these programs that most overlap with North Carolina’s high-opportunity fields are in healthcare. Roles such as registered nurses, dental hygienists, and respiratory therapists all appear on the state’s list of high-opportunity occupations, with registered nurses alone accounting for nearly 8,000 average annual openings, the second largest of any occupation in the state. However, no teaching occupations meet North Carolina’s definition of high opportunity under our criteria. More generally, the state’s largest high-opportunity fields are management, business, and computer-related occupations, but they are not the focus of North Carolina’s targeted aid investments.
Rather than using financial aid primarily to promote entry into the highest-paying fields, the state has deployed it as a tool to mitigate shortages in sectors that are deemed to be socially valuable.
In this sense, North Carolina’s strategy highlights an important policy choice. Rather than using financial aid primarily to promote entry into the highest-paying fields, the state has deployed it as a tool to mitigate shortages in sectors that are deemed to be socially valuable. The approach underscores the dual role targeted aid can play: not only as an instrument of economic mobility, but also as a mechanism for sustaining public service occupations thought to be important for the community.
Eight percent of New York’s average annual openings qualify as high-opportunity. The composition of these occupations is also notably different from national patterns. Nationally, management (34 percent), business (23 percent) and computer and mathematical occupations (14 percent) are the most common fields for high-opportunity occupations. But in New York, business-related occupations (27 percent), educators (22 percent), and healthcare practitioners (21 percent) account for 70 percent of all high-opportunity openings. Only nine other states designate even one teaching occupation as high opportunity, underscoring the unique importance that teachers play in New York’s labor market.
This importance is reflected in the structure of the state’s targeted financial aid programs. The NYS Math and Science Teaching Incentive Program, New York’s second-largest targeted aid initiative in 2023, provides conditional grants to undergraduates preparing to teach math or science at the secondary level.[42] The program disbursed about $614,000 that year. Recipients must commit to teaching in New York State for at least five years; otherwise, the award converts to a loan repayable over ten years.
The state’s largest targeted aid program, the NYS Science, Technology, Engineering and Mathematics (STEM) Incentive Program, distributed $8.3 million in 2023.[43] Eligibility is limited to students who graduate in the top 10 percent of their high school class and enroll in an approved STEM field, which includes both secondary and postsecondary STEM teaching alongside over 100 other occupations. Like the teaching incentive program, recipients must live in New York and work in an approved STEM occupation for five years following graduation to avoid loan conversion. Interestingly, while this program’s design emphasizes STEM, less than 10 percent of New York’s high-opportunity openings are in non-teaching STEM occupations, illustrating that an assumption of STEM occupations having the greatest economic opportunity does not necessarily apply evenly across states.
New York’s third targeted aid program, the NYS Child Welfare Worker Incentive Scholarship, extends support to individuals already employed by child welfare agencies who seek to complete degrees relevant to their roles.[44] Taken together, New York’s targeted aid portfolio seems to blend economic and social priorities.
Several factors constrain the interpretation of these findings. First, NASSGAP data capture program expenditures rather than allocations. As a result, the amount of money disbursed through targeted aid programs reflects not only a state’s policy priorities but also student demand, that is, how many eligible students choose to participate in a given program. Second, when assessing the relationship between in-demand fields and those prioritized by financial aid, it is important to consider degree production, how many credentials are already awarded in targeted areas. National-level gaps between targeted aid programs and high-opportunity fields, such as in business or STEM, may not necessarily reflect misalignment. Instead, they could indicate that policymakers view existing educational pipelines in these areas as sufficient to meet workforce needs. Despite these constraints, this analysis offers valuable insight into the ways states are using financial aid to shape educational and occupational pathways, and highlights opportunities for future research that could more fully capture how these programs influence labor market outcomes.
Discussion
States are investing enormous public resources in higher education at a time when both budgets and institutions are under strain, and when the focus on “credentials of value” is rapidly increasing. We argue that understanding not just how much states spend, but how they spend—and on whom—is critical to maximizing the economic and social returns of these investments. By distinguishing between direct support to institutions and financial aid to students, and then classifying each stream according to whether it is targeted to specific industries or occupations, we provide a framework for making these choices visible and comparable across states.
Our analysis underscores that direct institutional support remains the indispensable foundation of state higher education finance and adequate funding is essential to promoting affordability, increasing completion, and improving students’ labor market outcomes. However, its usefulness as a tool to increase the production of credentials of value is unclear. Currently, the share and size of direct appropriations that are targeting credentials of value via performance-based funding models are both very small or zero in most states. In addition, performance-based funding models have a mixed track record on actually improving desired outcomes, and they typically function as a strategy for reducing the institutional costs of producing degrees, rather than as a tool to influence student enrollment decisions.
Financial aid, by contrast, is an underutilized lever for incentivizing student enrollment in credentials of value. Research demonstrates that financial aid has a powerful and direct effect on student behavior, particularly for low-income students and those who are otherwise unlikely to enroll or persist.[45] Aid therefore plays a complementary role to direct support, functioning as a demand-side lever that influences students’ initial program choices and likelihood of completion. Without increasing their financial aid budgets or overall spending, states can reallocate financial aid spending towards targeted programs that align with their specific labor market needs. While many states are focusing on credentials that have economic value, they should keep in mind that investments in credentials that have social value are also important.
The comparison with high-opportunity occupations highlights both gaps and deliberate tradeoffs. In states like Nebraska, targeted aid is tightly aligned with occupations that offer strong wages, robust demand, and accessible educational pathways, suggesting a strategy focused on maximizing economic returns. In others, such as North Carolina, targeted aid is used to shore up socially critical but not always high-earning fields like K–12 teaching. New York targets occupations with high social value and those with economic value, like education and STEM, but in New York, STEM jobs are not necessarily in high-demand. These choices reflect different visions of what “value” means in higher education—whether it is defined primarily by earnings, by filling shortages in essential services, or by some blend of the two.
All of these decisions are being made in an increasingly constrained budget environment. Any consideration of how states allocate funding to postsecondary aid programs must, of course, acknowledge the budgetary strains under which many states operate. Many states fund their aid programs through a general fund and run out of funding before they are able to serve all eligible students.[46] Low-income students are especially hard hit by such budgetary shortfalls. In the case of limited aid dollars and shrinking budgets, policymakers have a greater responsibility to ensure that resources are allocated as efficiently as possible, and reallocating non-targeted aid to targeted aid programs could help the state meet its existing obligations and achieve its attainment and economic goals. In addition, the evidence on the effectiveness of student loans in improving student outcomes suggests that loans ought to remain a strategy for states to employ to achieve their economic goals, as their ability to increase grant aid spending might be constrained.
The goal is not to elevate one tool at the expense of others, but to help policymakers assemble a more coherent portfolio.
Taken together, the evidence points toward a balanced policy agenda. States should protect and, where possible, increase direct institutional support to maintain capacity, avoid shifting costs onto students, and sustain degree production across sectors and levels. At the same time, they should view targeted financial aid as a high-potential tool for aligning educational pathways with labor-market opportunity and public priorities. A pragmatic path forward would involve thinking more strategically about their higher education investments, including financial aid, while using state-specific labor-market data to ensure that targeted fields reflect both economic opportunity and social need. The goal is not to elevate one tool at the expense of others, but to help policymakers assemble a more coherent portfolio: one that sustains institutions, supports students, and channels both toward educational and occupational pathways that generate lasting value for individuals, communities, and state economies.
Appendix A
Our approach to classifying targeted financial aid
In our review of financial aid programs catalogued in the NASSGAP survey, we indicated which undergraduate financial aid programs qualify as industry- or occupation-targeted aid and which industries or occupations they targeted. Our sources were the websites associated with the program, institutions offering the program, the legislative proceedings, and/or governing/coordinating board websites.
For our categorization and analyses, we only included financial aid programs that supported undergraduate students, although several programs that assist both undergraduate and graduate students were included.
We considered programs to be targeted if eligibility requirements specified particular academic majors or occupations/industries to which a degree might lead. We also included programs that broadly included multiple industries (e.g., STEM or career and technical fields). We did, however, exclude any programs that were targeted toward institution types (e.g., technical colleges) rather than academic major or field of study.
Endnotes
- “State Higher Education Finance (SHEF) Report,” State Higher Education Finance (SHEF), https://shef.sheeo.org/report/. ↑
- Page Forrest, Riley Judd, and Samuel Pittman, “Higher Education’s Uncertain Fiscal Future,” Pew, November 12, 2025, https://www.pew.org/en/research-and-analysis/articles/2025/11/12/higher-educations-uncertain-fiscal-future. ↑
- Colloquially, credentials of value refer to those certificates and degrees that increase a graduate’s economic opportunity in the labor market. ↑
- “State Expenditure Report,” National Association of State Budget Officers (NASBO), https://www.nasbo.org/reports-data/state-expenditure-report. ↑
- Governor Kathy Hochul, “Free Community College: Governor Hochul Unveils Plan to Make Higher Education More Affordable and Bolster New York State’s Workforce,” New York State Governor, January 29, 2025, https://www.governor.ny.gov/news/free-community-college-governor-hochul-unveils-plan-make-higher-education-more-affordable-and; NC Community Colleges, https://www.nccommunitycolleges.edu/boost/. ↑
- James Dean Ward et al., “An Overview of State Higher Education Funding Approaches: Lessons and Recommendations,” Ithaka S+R, December 10, 2020, https://doi.org/10.18665/sr.314511. ↑
- James C. Hearn, “Outcomes-based Funding in Historical and Comparative Context,” Lumina Foundation, November 2015, https://www.luminafoundation.org/files/resources/hearn-obf-full.pdf. ↑
- Douglas A. Webber, “State Divestment and Tuition at Public Institutions,” Economics of Education Review 60 (2017): 1-4, https://doi.org/10.1016/j.econedurev.2017.07.007. ↑
- Bo Zhao, “Disinvesting in the Future? A Comprehensive Examination of the Effects of State Appropriations for Public Higher Education. Working Papers. No. 18-1,” Federal Reserve Bank of Boston, 2018, https://eric.ed.gov/?id=ED589714. ↑
- Ozan Jaquette et al., “Tuition Rich, Mission Poor: Nonresident Enrollment Growth and the Socioeconomic and Racial Composition of Public Research Universities,” The Journal of Higher Education 87, no. 5 (2016): 635-673, https://doi.org/10.1080/00221546.2016.11777417. ↑
- Bo Zhao, “Disinvesting in the Future? A Comprehensive Examination of the Effects of State Appropriations for Public Higher Education. Working Papers. No. 18-1,” Federal Reserve Bank of Boston, 2018, https://eric.ed.gov/?id=ED589714. ↑
- John Bound et al., “Public Universities: The Supply Side of Building a Skilled Workforce,” RSF: The Russell Sage Foundation Journal of the Social Sciences 5, no. 5 (2019): 43-66, https://doi.org/10.7758/RSF.2019.5.5.03. ↑
- See: “Performance Funding,” Kentucky Council on Postsecondary Education, retrieved September 24, 2025, https://cpe.ky.gov/ourwork/performancefunding.html; Postsecondary Working Group on Performance Funding Meeting Agenda,” Kentucky Council on Postsecondary Education, September 4, 2024, https://cpe.ky.gov/aboutus/records/perf_funding/agenda-2024-09-04-pf.pdf; and “Performance-Based Funding for Higher Education,” State Higher Education Executive Officers Association (SHEEO), retrieved September 24, 2025, https://shef.sheeo.org/performance-based-funding-for-higher-education/. ↑
- “SEA 366 Report: Outcomes-based Performance Funding, 2025-2027,” Indiana Commission for Higher Education, retrieved September 24, 2025, https://www.in.gov/che/files/OBPF_Report_2024.pdf. ↑
- See: “Programs of Strategic Interest,” State University System of Florida, retrieved September 24, 2025, https://www.flbog.edu/resources/academic/programs-of-strategic-emphasis/; and “SUS Universities Receive $645 Million for Performance-Based Funding,” State University System of Florida, July 11, 2025, https://www.flbog.edu/2025/07/11/sus-universities-receive-645-million-for-performance-based-funding/. ↑
- See: Nicholas W. Hillman et al., “Evaluating the Impact of Performance Funding in Ohio and Tennessee,” American Educational Research Journal 55, no. 1 (2018): 144-170, https://doi.org/10.3102/0002831217732951; and Amy Y. Li and Alec I. Kennedy, “Performance Funding Policy Effects on Community College Outcomes: Are Short-Term Certificates on the Rise?” Community College Review 46, no. 1 (2018): 3-39, https://doi.org/10.1177/0091552117743790. ↑
- Kelly Ochs Rosinger et al., “New Evidence on the Evolution and Landscape of Performance Funding in Higher Education,” The Journal of Higher Education 93, no. 5 (2022): 735–768, https://doi.org/10.1080/00221546.2022.2066269. ↑
- “Introducing the Credentials of Value Goal,” Lumina Foundation, retrieved September 24, 2025, https://strongernation.luminafoundation.org/credentials-of-value; According to Lumina’s data, as of 2023, 44.1 percent of the United States labor force (ages 25-64) possesses a credential of value. Lumina set a national goal that “by 2040, 75 percent of adults in the US labor force will have college degrees or other credentials of value leading to economic prosperity.” ↑
- In this paper, we consider scholarships a type of grant aid. ↑
- “ND Career Builders,” North Dakota University System, retrieved September 25, 2025, https://ndus.edu/paying-for-college/career-builders. ↑
- “Teaching Fellows for Maryland Scholarship,” Maryland Higher Education Commission, retrieved September 25, 2025, https://mhec.maryland.gov/preparing/pages/teachingfellowsmdscholarship.aspx. ↑
- “Nursing Loan-For-Service Program,” New Mexico Higher Education Department, retrieved September 25, 2025, https://hed.nm.gov/financial-aid/loan-service-programs/nursing. ↑
- “Arkansas Future Grant | ARFUTURE,” Arkansas Division of Higher Education, retrieved September 25, 2025, https://sams.adhe.edu/scholarship/details/ARFUTURE. ↑
- “DHEO Scholarships,” Delaware Department of Education, retrieved September 25, 2025, https://education.delaware.gov/families/college-career-life/college-scholarship-financial-aid/scholarships-and-financial-aid-resources/dheo-scholarships/. ↑
- “Financial Aid Programs,” Higher Educational Aids Board, the State of Wisconsin, retrieved September 25, 2025, https://heab.state.wi.us/programs.html#TES. ↑
- Ethan Pollack et al., “How Can Innovative Finance Transform Our Postsecondary Education and Training Systems?” Jobs for the Future, November 29, 2023, https://www.jff.org/idea/how-can-innovative-finance-transform-postsecondary-education-and-training/. ↑
- “Future Occupations & Reskilling Workforce Advancement to Reach Demand (FORWARD) Loan Program,” My Texas Future, retrieved September 25, 2025, https://www.mytexasfuture.org/adult-college/loans-for-texans/forward-loan/. ↑
- “New Jersey Pay It Forward Program,” Social Finance, https://socialfinance.org/work/new-jersey-pay-it-forward/. ↑
- “West Virginia STEM Scholarship,” College for West Virginia, retrieved September 25, 2025, https://www.cfwv.com/financial-aid/wv-stem-scholarship/how-it-works/. ↑
- “Next Generation Hoosier Educators Scholarship,” Indiana Commission for Higher Education, retrieved September 25, 2025, https://www.in.gov/che/state-financial-aid/state-financial-aid-by-program/next-generation-hoosier-educators-scholarship/. ↑
- “Opportunity Occupations and the Occupational Mobility Explorer Tool,” Federal Reserve Bank of Cleveland, https://www.clevelandfed.org/community-development/opportunity-occupations ↑
- “The Future of Good Jobs: Projections through 2031,” Center on Education and the Workforce, https://cew.georgetown.edu/cew-reports/goodjobsprojections2031/ ↑
- “Labor Market Information for Job Seekers and Students,” State of California Employment Development Department, https://labormarketinfo.edd.ca.gov/customers/job-seekers.html. See also “Ohio’s Top Jobs List,” Governor’s Office of Workforce Transformation, https://topjobs.ohio.gov/top-jobs-list/ohios-top-jobs-list ↑
- “Learn About an Occupation,” Washington State Employment Security Department, https://esd.wa.gov/jobs-and-training/labor-market-information/learn-about-occupation ↑
- “Kentucky’s Top Five In-Demand Sectors,” Kentucky Workforce Innovation Board, https://kwib.ky.gov/About/Pages/Kentuckys-Top-Five-In-Demand-Sectors.aspx. See also “ACCCP,” AlabamaWorks! https://alabamaworks.com/acccp/. ↑
- All statistics concerning the high-opportunity share of average annual openings is based on the set of state-by-occupations that have non-missing median wage, growth, and openings data. ↑
- Fifty-three percent of targeted expenditures went toward “multi-sector” programs that target several fields of study at once. Several such programs include business and STEM among those targeted fields. ↑
- All statistics concerning the share of undergraduate financial aid that is targeted are based on the FY 2023 NASSGAP survey data which includes expenditures for both targeted and non-targeted programs. ↑
- “NE Career Scholarship at Community Colleges,” Nebraska’s Coordinating Commission for Postsecondary Education, https://ccpe.nebraska.gov/ne-career-scholarship-community-colleges. ↑
- “Forgivable Education Loans for Service (FELS),” North Carolina State Education Assistance Authority, https://www.ncseaa.edu/loan/state-funded-loans/forgivable-loans-fels/. ↑
- “North Carolina Teaching Fellows Program,” North Carolina State Education Assistance Authority, https://www.ncseaa.edu/loan/state-funded-loans/forgivable-loans-tfp-s/. ↑
- “NYS Math and Science Teaching Incentive Program,” Higher Education Services Corporation, https://www.hesc.ny.gov/find-aid/nys-grants-scholarships/nys-math-and-science-teaching-incentive-program. ↑
- “NYS Science, Technology, Engineering and Mathematics (STEM) Incentive Program,” Higher Education Services Corporation, https://www.hesc.ny.gov/find-aid/nys-grants-scholarships/nys-science-technology-engineering-and-mathematics-stem-incentive. ↑
- “NYS Child Welfare Worker Incentive Scholarship,” Higher Education Services Corporation, https://www.hesc.ny.gov/find-aid/nys-grants-scholarships/nys-child-welfare-worker-incentive-scholarship. ↑
- Tuan D. Nguyen et al., “The Effects of Grant Aid on Student Persistence and Degree Attainment: A Systematic Review and Meta-Analysis of the Causal Evidence,” Review of Educational Research 89, no. 6 (2019): 831-874, https://doi.org/10.3102/0034654319877156. ↑
- Meredith Kolodner, “Eligible for Financial Aid, Nearly a Million Students Never Get It,” The Hechinger Report, May 23, 2018, https://hechingerreport.org/eligible-for-financial-aid-almost-one-third-of-students-never-get-it/. ↑