Does Financial Aid Help Those Who Need it Most?
As tuition and fees at public and private not-for-profit four-year institutions continue to rise, so does the role of financial assistance, particularly for low- and moderate-income students. Yet, recent reports show that the distribution of financial aid is far from equitable. Last month, an Atlantic article highlighted an array of college-affordability efforts–including private and employer grants, the federal work-study program, and federal tax credits–that often fail to provide financial assistance to those that need it most. For instance, students from families that earn $106,000 and up received more of the approximately $17 billion in grant aid allocated in 2014-15 by private and employer grants than those with incomes under $30,000.
Institutional allocation of financial aid seems to favor richer students, too. Indeed, an Education Trust report found that private colleges and universities spend almost twice as much on financial aid for students from the top income quintile than they do on aid for students from the bottom quintile. The difference may be even greater at institutions with high completion rates.
Interested in how these financial aid findings affect the bottom line for students, I looked into trends in the average net price of students from different socioeconomic backgrounds at all public and private not-for-profit four-year institutions.
The data are from IPEDS’ Data Center, and include the 707 public four-year and 1,646 private not-for-profit four-year institutions in the United States (although not all institutions have net price data). I collected the average net price for full-time, first-time degree/certificate-seeking undergraduate students who received Title IV federal financial aid. The students are disaggregated into five household income categories: $0-$30,000; $30,001-$48,000; $48,001-$75,000; $75,001-$110,000; and $110,001 and up. The net price at public institutions is based on students paying the in-state tuition rate. To account for differences in enrollment size, the average for each institution by year and household income category is weighted by the number of full-time, first-time degree/certificate-seeking undergraduate students who received Title IV federal financial aid for that institution by year and household income category.
Simply comparing the average net price across income categories would provide limited information; the average net price paid by low-income students is typically less than the price paid by their more well-off peers. What is more insightful is how the average net price has changed across income levels since 2008, when institutions first began reporting net price to the federal Department of Education. In order to adjust for inflation, I used the U.S. Bureau of Labor Statistics’ CPI Inflation Calculator to convert the net price for all academic years into 2013 dollars.
Figure 1. Change in Average Net Price from 2008-09 to 2013-14 for Public Four-Year Institutions
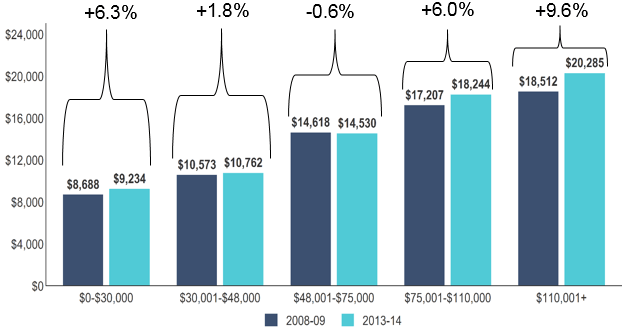
The data show some noteworthy patterns. At public four-year institutions, the largest percent increase in average net price was experienced by the highest income category (9.6 percent), but the lowest income category experienced the second highest increase in average net price (6.3 percent). The $48,001-$75,000 income category was the only one with a decline since the 2008-09 academic year in average net price.
Figure 2. Change in Average Net Price from 2008-09 to 2013-14 for Private Not-For-Profit Four-Year Institutions
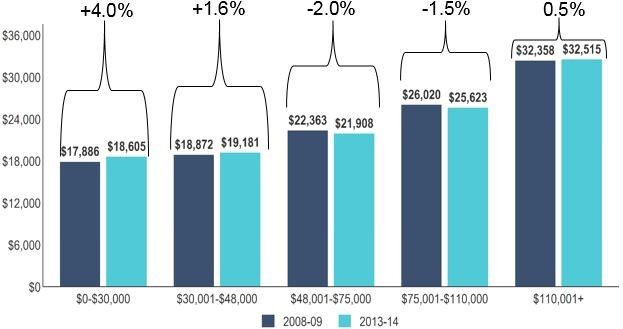
Surprisingly, at private not-for-profit four-year institutions, the lowest income category experienced the largest percent increase since the 2008-09 academic year in average net price while the second lowest income category experienced the second largest. Meanwhile, the highest income category experienced less than a 1 percent increase and the two remaining income categories even saw a decline in average net price.
Figure 3. Change in Average Net Price from 2008-09 to 2013-14 for High-Completion-Rate Private Not-For-Profit Four-Year Institutions
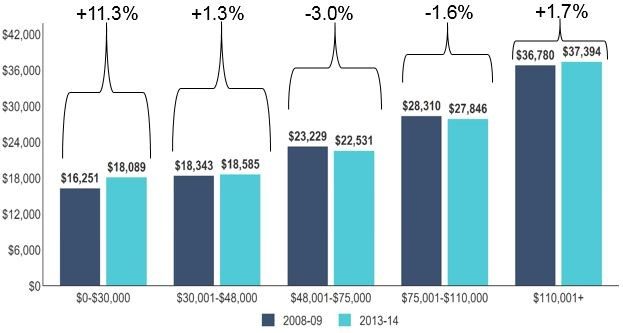
This pattern of lower income students experiencing a greater increase was even more pronounced among high-completion-rate private institutions: those that averaged, over the past five years, a six-year graduation rate of 70 percent or higher. While the increase in average net price for the lowest income category was 4.0 percent for all private not-for-profits, the increase at the high-completion-rate institutions was a staggering 11.3 percent. (There was no noteworthy difference in net price trends between all public four-year institutions and high-completion-rate public four-year institutions.)
It is important to point out that, despite the large increase since 2008-09, the average net price at high-completion-rate institutions remained lower in 2013-14 than the net price at all private four-year not-for-profits. Still, these results suggest a troubling trend: with their costs rising and a finite financial aid budget, high-completion-rate institutions as a group chose to raise prices for the students who can least afford it.