Trends in College Net Price for Low-Income Students
Last week, New America’s Stephen Burd published a report showing that low-income students who receive Pell grants still face a substantial financial burden to attend college, especially at private not-for-profit institutions. Looking at the average net price—“the average amount of money that students and their families have to pay after all grant and scholarship aid is deducted from the listed price”—of low-income students attending 1,400 four-year institutions, Burd found that 94 percent of the private not-for-profit institutions he studied have an average net price for low-income students of more than $10,000. About half of public institutions had an average net price above that threshold in 2013-14, a significant increase from the one-third that were above the threshold in 2010-11.
Inspired by this report, I decided to analyze average net price trends for the broader higher education sector since 2008, when institutions were first mandated by the Higher Education Act to report net price to the federal Department of Education. In 2013-14, two-year institutions and public institutions averaged the lowest net price while private not-for-profits and less than two-year institutions averaged the highest. Despite rising tuition, average net price fell at public, private not-for-profit, and private for-profit institutions in 2010-11. The drop was largest at for-profit institutions, where tuition was cut and cost-conscious consumers sought cheaper alternatives. Missing data for years preceding the drop may have played a role as well. Since then, average net price at for-profits has slightly decreased as the net price at public and private not-for profit institutions has risen.
Like the blog post I published in February, the data are from IPEDS’ Data Center and include 7,434 institutions (although not all institutions have net price data). I collected the average net price for full-time, first-time degree/certificate-seeking undergraduate students from households with incomes between $0 and $30,000 who received Title IV federal financial aid. The net price at public institutions is based on students paying the in-state tuition rate. To adjust for inflation using the U.S. Bureau of Labor Statistics’ CPI Inflation Calculator, the net price for all academic years is in 2013 dollars. To account for differences in enrollment size, the average for each institution by year is weighted by the number of full-time, first-time degree/certificate-seeking undergraduate students from households with incomes between $0 and $30,000 who received Title IV federal financial aid for each institution by year.
Figure 1. Average Net Price in 2013-14 by Level of Institution
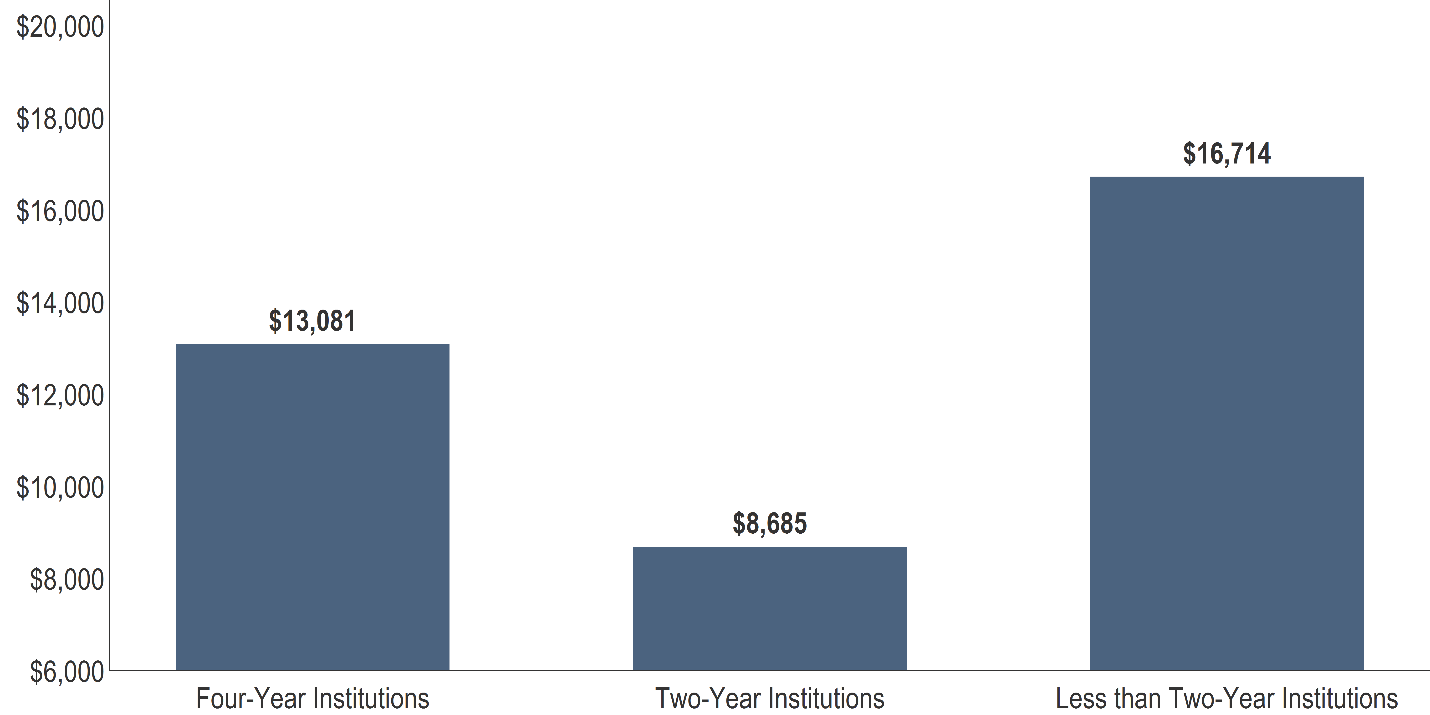
Looking at differences across the level of institution, the average net price is lowest at two-year institutions ($8,685) and highest at less than two-year institutions ($16,714), with four-year institutions in the middle ($13,081).
Figure 2. Average Net Price in 2013-14 by Control of Institution
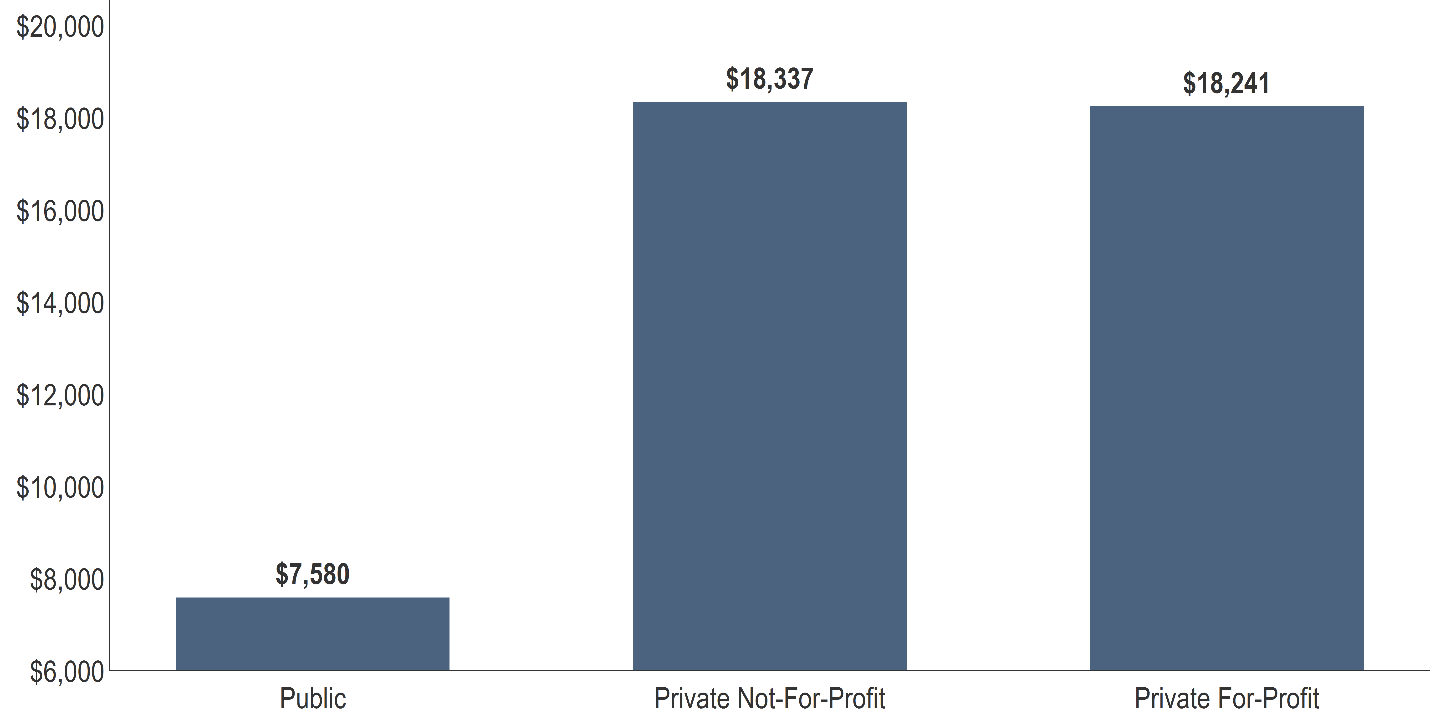
At $7,580, the average net price at public institutions is less than half the average net price at private not-for-profits ($18,337) and private for-profits ($18,241). While the average net price at not-for-profits and for-profits is about the same, as I noted in another recent blog post, a much larger portion of students who attend for-profits default on their federal student loans than those who attend not-for-profits.
Figure 3. Change in Average Net Price by Control of Institution
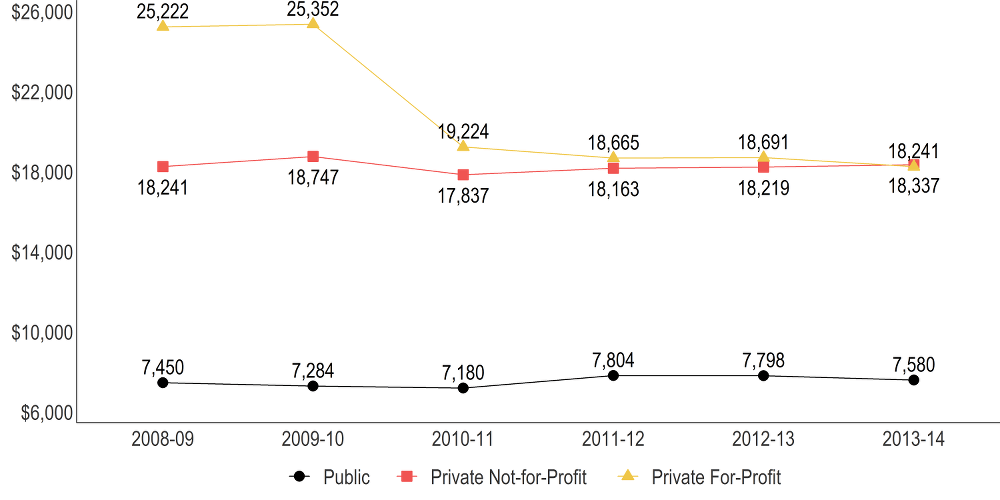
Scanning this graphic, it is hard to overlook the drop in the average net price at private for-profits from 2009-10 to 2010-11. That drop of more than $6,000 represents a 24.2 percent decrease in the average net price in one year. The big drop in net price may be due to a declining share of for-profit institutions with missing data. But there is also evidence that, in recent years, students have gravitated toward less-expensive for-profit institutions, and for-profit institutions have lowered their tuition. While the average net price at for-profit institutions has decreased since 2010-11, the opposite has occurred at public and private not-for-profits, which have seen increases of 5.6 and 2.8 percent, respectively.
Whether looking at public, private not-for-profit, or private for-profit institutions, the fact remains that, even after grant aid, college is expensive for low-income students. And there is solid evidence that higher net price harms low-income students’ college outcomes. Whether it comes about through the kind of federal-state partnership that Burd envisions or through institutions taking it upon themselves to find innovative ways to lower net price, greater affordability is urgently needed to improve undergraduate education in the United States.