Parental Income, State Funding, and Access to Higher Education
Questions about who gets into America’s most prestigious colleges and why have been at the center of American discourse recently. In June, the Supreme Court struck down the use of race-conscious admissions practices in higher education. And soon after the Court’s decision, a federal civil rights complaint was filed against Harvard University for its use of legacy admissions, which disproportionately benefits white, affluent students.
New research by Opportunity Insights adds to the conversation with a robust analysis of another key factor in admissions: parental income. The novel and groundbreaking study includes an examination of why the most selective institutions in the US (or the “Ivy-Plus” colleges: the eight Ivy League schools plus Stanford University, Massachusetts Institute of Technology, Duke University, and the University of Chicago) enroll a disproportionate share of high-income students. One of their many findings is that children from families with incomes in the top 1 percent were about 2.3 times more likely to attend an Ivy-Plus college than those from middle-class families, even after controlling for SAT/ACT scores.[1]
Despite enrolling less than 1 percent of all college students, these institutions disproportionately produce leadership positions in the US. For instance, their graduates have accounted for a quarter of US Senators, over 40 percent of US Presidents (since 1960), nearly 50 percent of Rhodes Scholars, and 71 percent of Supreme Court Justices (since 1963). Who gets into these schools has a profound impact on American leadership and subsequent public policy. Still, these schools represent just a tiny sliver of the thousands of higher education institutions in the US. Do other selective but less prestigious schools also enroll a disproportionate share of high-income students? What about the selective public institutions where state funding and public policy more generally play a role?
While the Opportunity Insights study focused primarily on Ivy-Plus colleges, the researchers released income distribution and attendance data on a broader set of 139 selective four-year institutions. Using their data, I explored the relationship between parental income and relative attendance rates at the 12 Ivy-Plus schools as well as the other 127 schools in the dataset, grouped into mutually exclusive tiers. These tiers extend those categories created by the Opportunity Insights team, using a combination of institutions’ selectivity and institutional control (i.e., public vs. private not-for-profit):
- Ivy-Plus colleges
- Very elite privates (tier created by the Opportunity Insights team of the most selective private institutions other than the Ivy-Plus colleges)[2]
- Elite privates (private institutions in Barron’s 2009 top selectivity tier other than the Ivy-Plus and very elite privates)[3]
- Highly selective privates (private institutions in Barron’s 2009 2nd selectivity tier)
- Selective privates (private institutions in Barron’s 2009 3rd, 4th, and 5th selectivity tiers)
- Flagship publics (tier created by the Opportunity Insights team of the most selective public institutions)[4]
- Very elite publics (public institutions in Barron’s 2009 top selectivity tier other than the flagship publics)
- Highly selective publics (public institutions in Barron’s 2009 2nd selectivity tier)
- Selective publics (public institutions in Barron’s 2009 3rd, 4th, and 5th selectivity tiers)
Figure 1. Relative Attendance Rates by Parental Income and Tier[5]
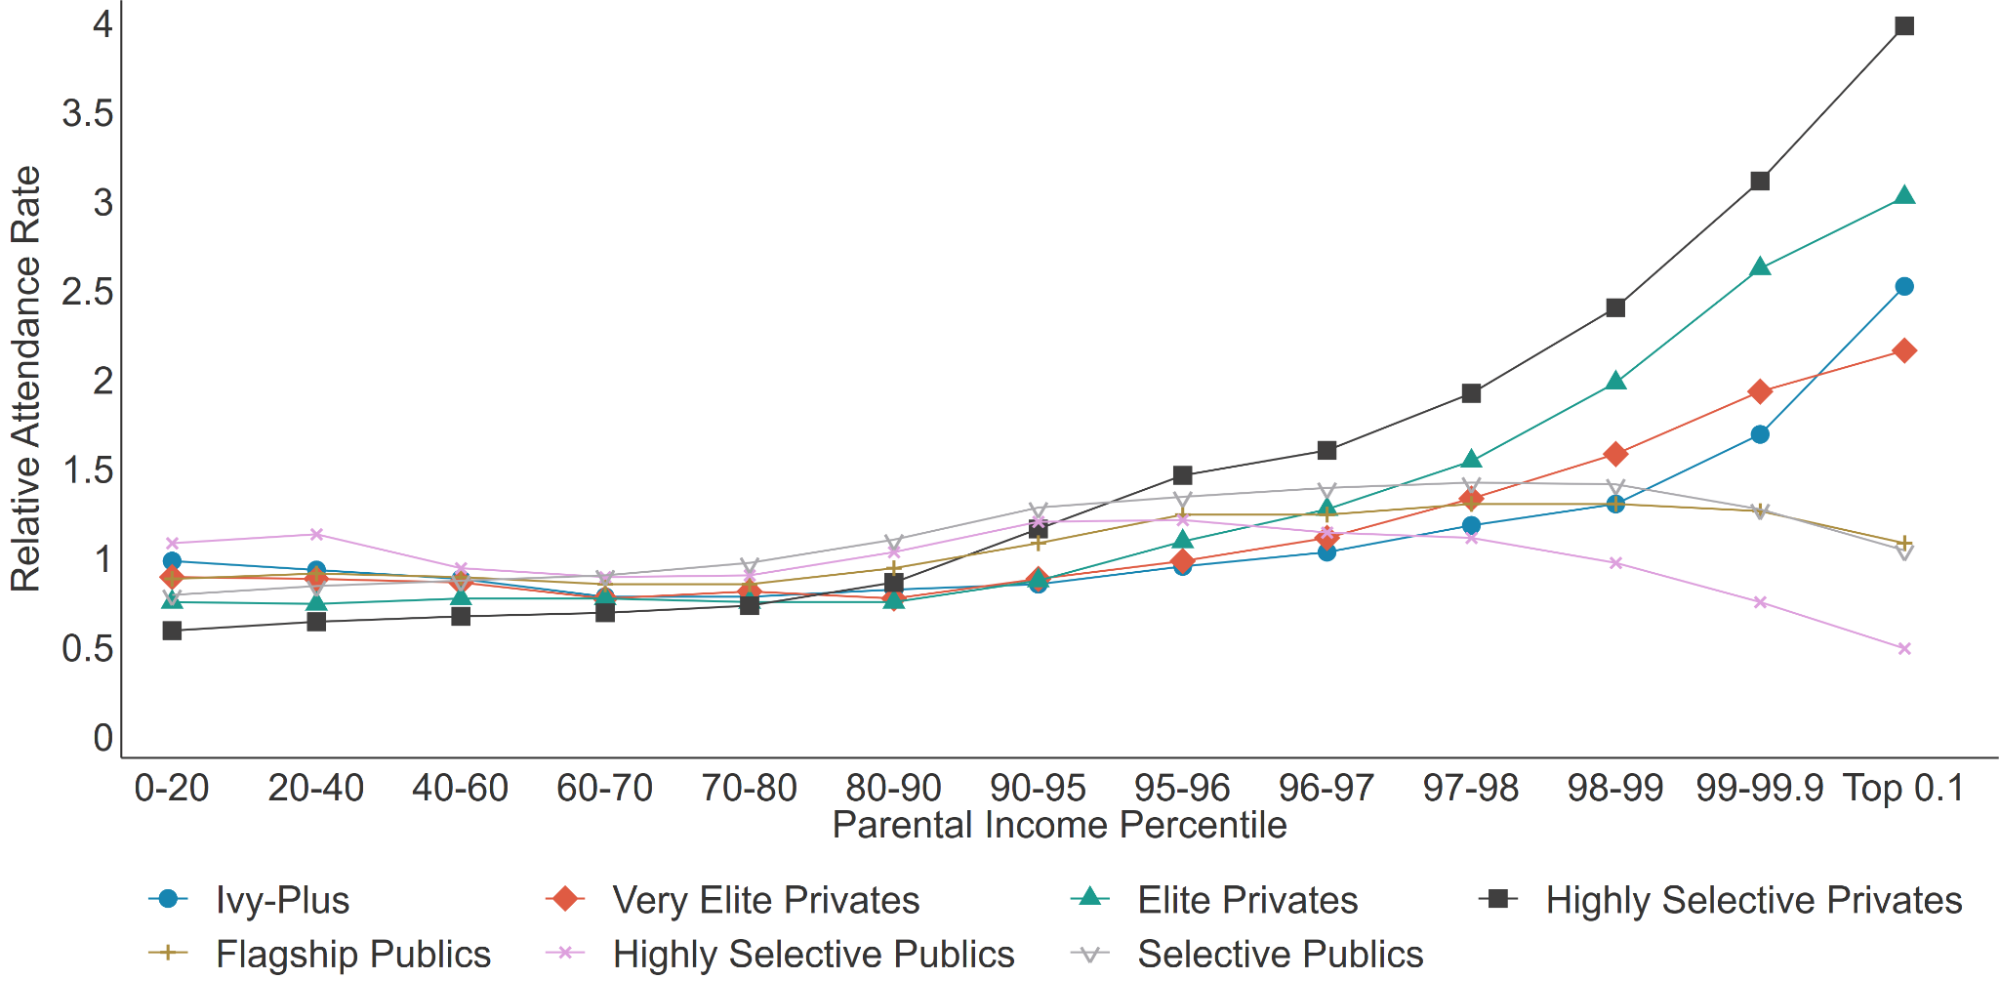
Figure 1 shows that while children from families with incomes in the top 1 percent were about 2.3 times more likely to attend an Ivy-Plus college than those from middle-class families, that rate was higher at elite privates (3.5 times more likely) and highly selective privates (4.4 times more likely).
However, this was not the case at public institutions, where students from middle-class families were as or more likely to attend those institutions than students from the top 1 percent. The average, however, masks the variation across public institutions, where the relative attendance rate among the top 1 percent ranged from a low of 0.2 (Stony Brook University) to a high of 3.5 (University of Mississippi). What, then, drove more equitable results at some public institutions but not others, and what implications do those findings have on public policy?
To try to answer these questions, I first incorporated data on educational appropriations per FTE student at the state level from SHEEO’s State Higher Education Finance (SHEF) FY 2015 report and compared it to the relative attendance rate of those from the top 1 percent at the 51 public institutions with available data across 33 states. I used historical data rather than more recent data to better align with the student sample included in the Opportunity Insights data, which consisted of students who took the SAT or ACT in 2011, 2013, or 2015.
Figure 2. Relationship between Educational Appropriations per FTE in FY 2015[6] and Relative Attendance Rate of the Top 1 Percent
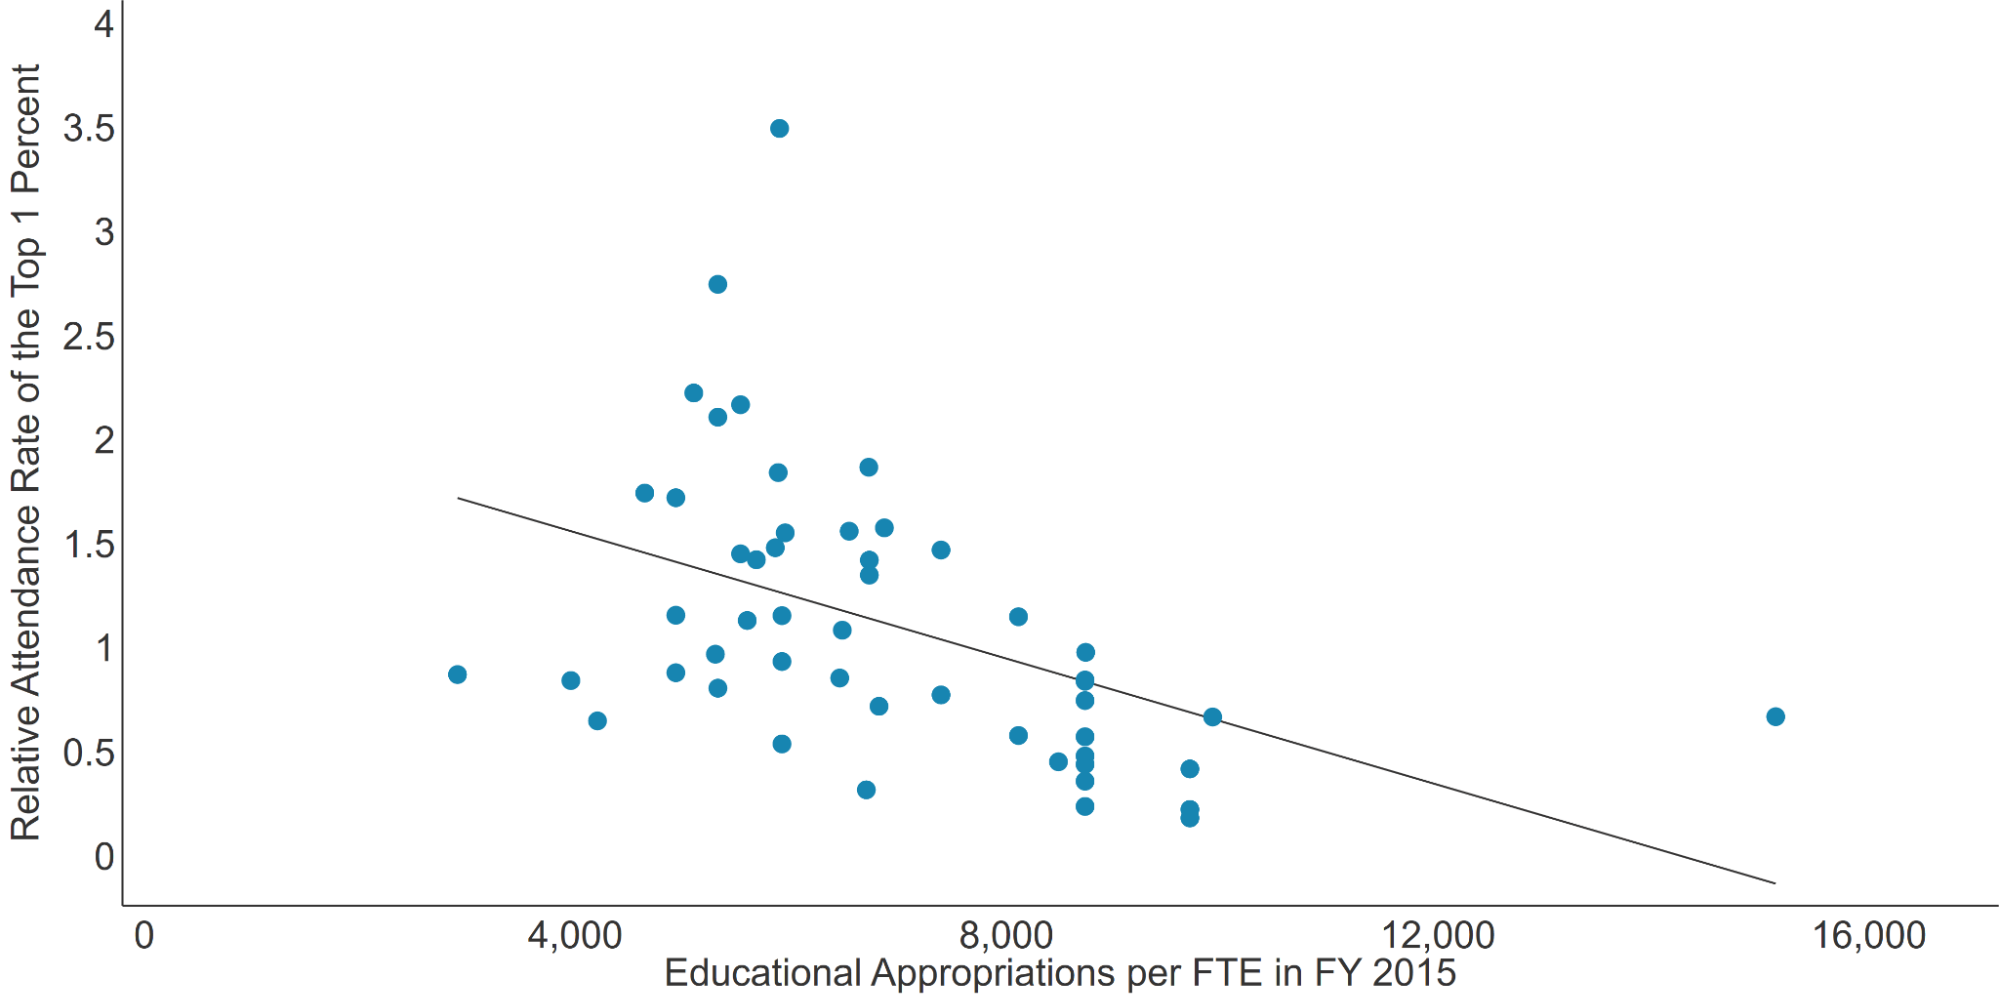
Figure 2 shows that there was a negative association between educational appropriations per FTE in FY 2015 at the state level and the relative attendance rate of the top 1 percent at a state institution, with a correlation of -0.46. In other words, public institutions located in states with relatively high public funding enrolled a more socioeconomically diverse student body than public institutions in states with relatively low public funding. For example, the state of South Carolina had the fourth lowest educational appropriations at just over $4,600 per FTE, while Clemson University, the only South Carolina institution in the dataset, had the eighth largest relative attendance rate of the top 1 percent (1.7). New York, on the other hand, had the third highest educational appropriations at nearly $10,000 per FTE. The three New York institutions included in the dataset (Stony Brook University, Binghamton University, and the University at Buffalo) had the lowest, second lowest, and sixth lowest relative attendance rates of the top 1 percent.
Public institutions located in states with relatively high public funding enrolled a more socioeconomically diverse student body than public institutions in states with relatively low public funding
I also explored the relationship between the share of total educational revenue from tuition and the relative attendance rate of the top 1 percent, hypothesizing that the association would be flipped because institutions typically raise tuition to offset declines in state funding.
Figure 3. Relationship between Share of Total Educational Revenue from Tuition in FY 2015 and Relative Attendance Rate of the Top 1 Percent
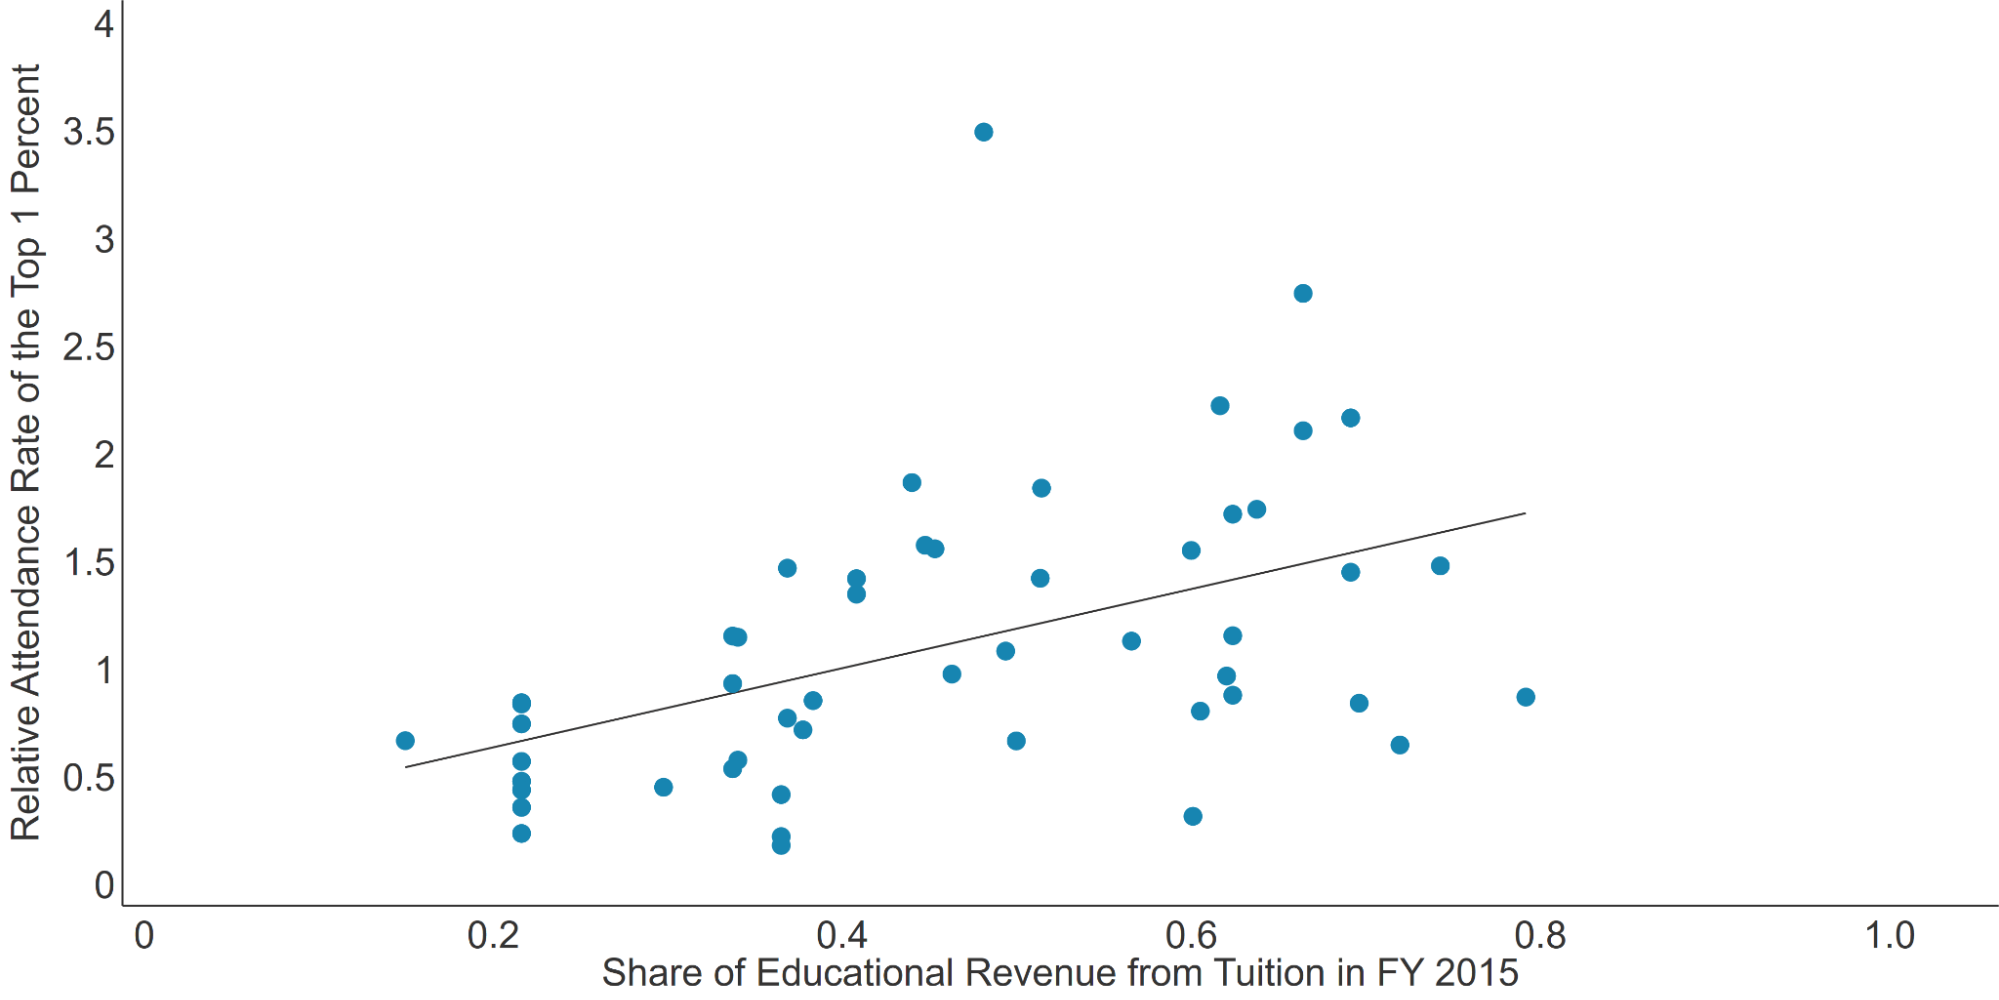
As expected, Figure 3 shows that there was a positive association between the share of total educational revenue from tuition in FY 2015 at the state level and the relative attendance rate of the top 1 percent at a state institution, with a correlation of 0.47. In other words, public institutions located in states that relied relatively more on tuition for revenue enrolled a less socioeconomically diverse student body than public institutions located in states that relied relatively less on tuition. For example, in Alabama, two-thirds of revenue came from tuition, the sixth highest of any state, while the University of Alabama and Auburn University, the two Alabama institutions in the dataset, had the second (2.7) and fifth (2.1) highest relative attendance rate of those from the top 1 percent. On the other side of the spectrum, in California, less than 22 percent of revenue came from tuition, the second lowest of any state. Eight California institutions were included in the dataset, none of which had a relative attendance rate of the top 1 percent that exceeded 0.9.
Public institutions located in states that relied relatively more on tuition for revenue enrolled a less socioeconomically diverse student body than public institutions located in states that relied relatively less on tuition
Both sets of findings are closely aligned with previous research (here and here) that public institutions, especially more selective ones, offset declines in state funding by relying more heavily on higher-income students, including out-of-state and international students, to pay higher tuition prices, thereby crowding out lower-income students. There are certainly other factors contributing to these results. But there is no doubt that public funding plays an important role in broadening or narrowing access to public higher education and either advancing or hindering equity.
There is no doubt that public funding plays an important role in broadening or narrowing access to public higher education and either advancing or hindering equity.
One of the main takeaways from this new study is that many institutions need to do a much better job of living up to their aspirations of serving the public good. But that’s only one piece of the equation. This new analysis gives researchers and policymakers extensive data on the outsized role of parental income in admission to the country’s top institutions, including at public institutions, where state funding can mitigate the association. While national levels of education appropriations have recovered since the Great Recession, that is not the case for 28 states, where education appropriations per FTE in 2022 were below 2008 levels. If policymakers also believe that higher education institutions in their state should serve the public good, not just the wealthiest, they should take this as an opportunity to recommit to investing in higher education.
[1] This is calculated by taking the relative attendance rate of children with parental incomes in the top 1 percent of the national income distribution (1.8), at over $611,000, and dividing by the relative attendance rate of children from middle-class families (0.8), defined as parental incomes between the 70th and 80th percentiles of the national income distribution, from $83,000 to $116,000.
[2] Includes the California Institute of Technology; Carnegie Mellon University; Emory University; Georgetown University; Johns Hopkins University; New York University; Northwestern University; Rice University; University of Notre Dame; University of Southern California; Vanderbilt University; and Washington University in St. Louis.
[3] Additional details on Barron’s selectivity tiers can be found in a 2020 Opportunity Insights study on the role of colleges in intergenerational mobility. The original listing of schools and their selectivity tier can be found in Barron’s Profiles of American Colleges 2009.
[4] Includes the University of Florida; University of Georgia; University of Michigan – Ann Arbor; Ohio State University; University of California, Berkeley; University of California, Los Angeles; University of North Carolina – Chapel Hill; University of Texas at Austin; and University of Virginia.
[5] I excluded from the analysis other elite publics and selective privates because of very low samples (n<5).
[6] All educational appropriations data are in 2015 dollars and were not adjusted for inflation.