Better Than We Thought
Comparing Publicly Available Data on College Students’ Income Distribution
This report was updated on October 28, 2020. Since publishing this report in May 2019, we have identified four analytical corrections and improvements, which are now reflected in the document. The four updates are:
- The dollar values for the parental income thresholds reported by Opportunity Insights have been deflated to 2008 USD to match the income groups reported by IPEDS. Previously, the Opportunity Insights values were in 2015 USD.
- The IPEDS vs. CDS comparison has been restricted to the same universe of institutions. The previous version included 29 institutions that appeared in either IPEDS or CDS, but not both.
- The IPEDS vs. CDS trends analysis has been restricted to institutions that appeared in both the 2009 and 2015 datasets. Previously, there were 6 institutions with IPEDS data in 2015 but not 2009 and one institution with CDS data in 2015 but not 2009.
- In assigning thresholds to the income groups in the Opportunity Insights data we interpolated to the “best percentile,” assuming even distribution of students within the reported parental income ventiles. The previous version used the closest reported ventile as the threshold.
These updates together led to a number of minor changes in the findings, and one more significant change. In the previous version, we reported that the smallest variance between the IPEDS and Opportunity Insights income distributions was between Groups 1, 2, and 3, on one hand, and Groups 4 and 5, on the other hand. With these updates, the smallest variance is now between Groups 1 and 2, on one hand, and Groups 3, 4, and 5, on the other hand.
Introduction
In January 2017, a valuable new information source was introduced to the higher education community. Researchers at the Equality of Opportunity Project—now called Opportunity Insights—released detailed data on the financial circumstances of undergraduate students at each of the vast majority of American colleges and universities.[1] Covering students born between 1980 and 1991, and relying on tax records held by the Internal Revenue Service, the publicly available Opportunity Insights data provided a nuanced look at the family income distribution as well as subsequent earnings of a generation of college-goers. The data have already been influential in shaping the public debate regarding colleges’ role in social mobility, and the research uses of the data are only just starting to be explored.
The Opportunity Insights dataset joins two other important public sources of panel data on the socioeconomic diversity of undergraduate student populations at American colleges and universities. First, the Integrated Postsecondary Education Data System (IPEDS), maintained by the US Department of Education, collects data from institutions that participate in the federal student aid system and, among other things, reports information on the number of students who receive need-based federal Pell grants.[2] It also collects and reports on the number of students who receive Title IV federal student aid that fall into five income categories. Second, the Common Data Set (CDS) is a voluntary data reporting template developed and maintained by The College Board, Peterson’s, and US News and World Report, which is completed by many institutions who post it on their websites. Among other things, the Common Data Set includes granular statistics on the number and characteristics of students receiving different types of financial aid.[3]
In the past, policymakers, institutional leaders, and researchers have used the IPEDS and CDS data on socioeconomic diversity, but have raised concerns about the data’s adequacy. The IPEDS-reported share of students receiving a Pell grant has been the most commonly used metric. This metric lacks precision, in that it covers a potentially large swath of the income distribution without differentiation—nearly all Pell recipients have family income below $60,000, which covers approximately half of the national income distribution.[4] Furthermore, there are students with incomes in that range who are not eligible for, or do not apply for, federal financial aid, and therefore are not counted among Pell recipients. Finally, the share of the population eligible for Pell has varied over time, as Congress has occasionally changed the income threshold for Pell eligibility and fluctuations in the economy affect the share of the population who are eligible.
The share of students receiving need-based financial aid reported in the CDS is similarly variable and blunt. The income ranges of students who receive need-based aid are broad and vary from institution to institution. Moreover, there is no publicly-available, comprehensive set of CDS data: individual institutions decide whether and in what form to post their own CDS survey responses publicly. Collecting those data from institutional websites is a laborious process and does not produce a complete dataset.[5]
Beginning with the fall 2008 cohort of first-time, full-time freshmen, IPEDS has also published data on the number of students who receive federal financial aid that fall into five income ranges: $0-30,000, $30,001-48,000, $48,001-$75,000, $75,001-110,000 and $110,001 and above. While these data provide a more granular picture of the income distribution, they exclude significant categories of students—most notably students who do not receive federal financial aid and, for public institutions, those who pay out-of-state tuition. These limitations raise questions about the accuracy of the income distribution portrayed in the data.
Although the Opportunity Insights dataset is more comprehensive than both Pell share and the share receiving need-based aid, and is more complete than the IPEDS income data limited to Title IV recipients, even this vast dataset has limitations. It does not include every institution and merges some groups of institutions together. Further, it only includes income data for students (and parents who identify them as dependents) who file US taxes, and data are only available through 2013. While the Opportunity Insights researchers have indicated that they intend to update the publicly available data periodically, there has not yet been an update since the original publication of the data in January 2017.
In this report, we compare and contrast the three datasets—IPEDS, CDS, and Opportunity Insights—for various categories of public and private four-year institutions, in the aggregate. We find that, when grouping students who do not receive federal financial aid—whose income is therefore unknown—with students in the top income category, the IPEDS income distribution is very similar to the Opportunity Insights income distribution at this aggregate level. Furthermore, comparing IPEDS data with CDS data provides insights about which students benefit from institutional financial aid policies. Specifically, we find that significant shares of students in each category of institutions have family income above $110,000 and receive need-based financial aid. Moreover, in each category of institutions, the share of students receiving Pell grants is larger than the share of students with family income of $48,000 and below. Within each category of institutions, the income distribution, share receiving need-based aid, and share receiving Pell grants have changed little between the 2008-09 and the 2015-16 academic years. Although our analysis in this report focuses on groups of four-year institutions categorized by their sector and selectivity, it could be extended to the institution-level for any institution that submits data to IPEDS and completes the CDS survey. While each of these datasets has significant limitations and ought to be interpreted with caution, we conclude that the public, annually updated income distribution data in IPEDS provides more insight into the full income distribution of incoming students at US colleges than commonly acknowledged.
Comparing the Three Data Sets
Integrated Postsecondary Education Data System
The National Center for Education Statistics (NCES) publishes data on the characteristics, finances, and outcomes of nearly all US colleges and universities through the Integrated Postsecondary Education Data System (IPEDS). Since 2008-09, NCES has collected data directly from colleges and universities on the number of Title IV federal student aid recipients whose family income falls in five income bands: $0-30,000, $30,001-$48,000, $48,001-$75,000, $75,001-$110,000, and greater than $110,000.
IPEDS counts only include first-time, full-time students who receive federal Title IV funds, including federal grants and loans, as well as work study. Moreover, for public institutions, the counts in the income categories only include students who pay in-state tuition.[6] Some students with lower family incomes do not receive Title IV aid. The residency status of some students makes them ineligible for federal financial aid (e.g., international students and DACA students); other students with financial need may not complete the paperwork necessary to receive it.
The income represented in IPEDS is the students’ family income for dependent students and the students’ own income for independent students. Because of the timing of tax filings and the application cycle, IPEDS reports students’ family income from at least the year preceding the academic year indicated.[7] Beyond that, institutions calculate students’ family income in different ways. Institutions may use the “federal methodology” based on adjusted gross income that is used by the federal student aid program for determining a student’s family income, or they may use a College Board-created or their own custom “institutional methodology” that considers additional sources of income and assets, such as home equity or non-custodial parents’ income, than are used in the federal methodology.[8]
Finally, the IPEDS income bands are fixed; the thresholds that determine the bands do not change in accordance with shifts in the national income distribution over time. Even though institutions have reported these data in their IPEDS submissions since 2008-09, neither the thresholds nor the underlying income data are adjusted for inflation in subsequent years.
Common Data Set
Each year since 1995, through the Common Data Set (CDS) initiative, The College Board, Peterson’s, and U.S. News & World Report (USNWR) have maintained a data collection template that many colleges and universities have voluntarily completed. The CDS includes general information on an institution; information on admissions, enrollment, and persistence; information on the institution’s annual expenses and distributed financial aid; and other curricular elements. Each of the organizations above, and numerous other organizations, collect portions of the CDS data from institutions through various means and publish it in various forms. For example, USNWR reports some of the collected data by individual institution in its college ranking publications, but not all the data for all institutions.[9] Peterson’s and The College Board collect some of the data and incorporate them into their college search products; The College Board also collects some of the data for its research publications.[10] Many individual colleges and universities publish their own CDS data on their websites. However, an aggregated source of CDS data for all institutions is not publicly available.
Most relevant to this brief, CDS reports information about the number of students that have financial need, the number of students who receive institutional need-based and non-need-based aid, and the average and total amount of need-based and non-need-based institutional aid awarded. The determination of a student’s financial need is based on the institution’s methodology for calculating family income (federal, institutional, or both) and the institution’s financial aid policies, which are not specified in the CDS. Similarly, the number of students who receive institutional need-based and non-need-based aid, and the amount of aid, depend on the institution’s financial aid policies.
The counts of students who have financial need and receive federal and institutional aid are reported for the first-time, full-time cohort as well as the total cohort in each of the covered academic years. The counts include non-resident aliens and other students who may be ineligible for federal student aid, if they are eligible for institutional aid.
Opportunity Insights
Through a unique arrangement with the Department of the Treasury, Opportunity Insights researchers have been able to use federal tax data to address a range of research questions regarding income inequality and social mobility. In January 2017, they released a report and accompanying dataset focused on the social mobility of students who enrolled in each of the majority of US colleges and universities.[11]
The Opportunity Insights dataset includes students who attended college between ages 19 and 22 and who were identified as dependents on their parents’ income taxes when the child was between the ages of 12 and 17. The dataset is organized by students’ birth cohort, covering the 1980 through the 1991 birth cohorts. Students are assigned to the college or university from which they received a Form 1098-T for the longest period of enrollment between the ages of 19 and 22.[12] The data exclude college students whose parents are not US residents, whose parents earned negative income when the student was between 15 and 19 years old, who themselves first enroll after age 22, or who do not pay tuition and do not receive a Pell grant. Finally, for some colleges and universities that operate as part of a system, the system office issues the 1098-T forms under a single identifier such that the individual campuses that comprise the system are indistinguishable from one another in the data.[13]
Family income is defined as the parents’ average Adjusted Gross Income (AGI) during the years when the child was aged 15 to 19.[14] In the publicly available dataset, students are categorized into five income quintiles based on the income distribution of the sample. (These quintiles, therefore, do not match the quintiles of the overall income distribution for the whole US population or for families with college age children.) The researchers also make the data available in ventiles with dollar boundaries for aggregated groups of institutions with similar levels of selectivity.
Findings
Although IPEDS, CDS, and Opportunity Insights data are similar in the types of data, groups of students, and institutions they cover, they are not exactly the same. Nevertheless, by aligning cohorts, category cut points, and institutional groupings to the extent possible—and keeping in mind the ways in which they still differ—we can make comparisons across the datasets that enlighten our understanding of each.
Comparison of IPEDS and Opportunity Insights data
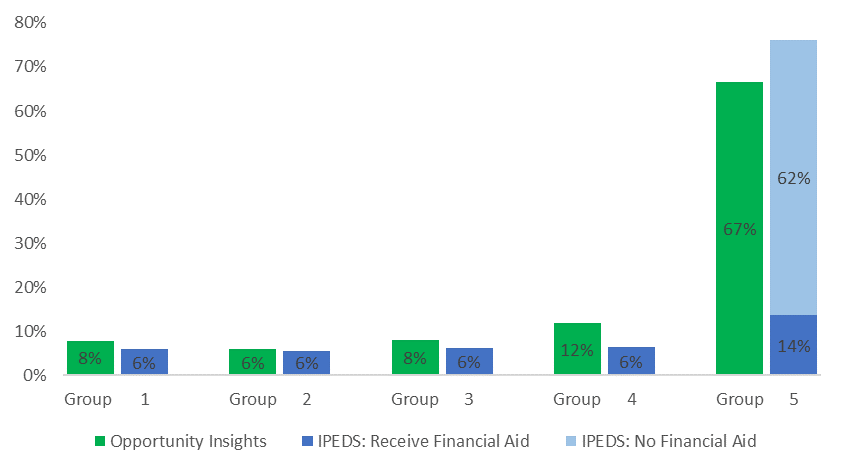
In the graphs below, we compare IPEDS income categories for the first-time, full-time entering cohort of 2009 with Opportunity Insights income categories for the 1991 birth cohort, for groups of institutions organized by sector and selectivity.[15] In the IPEDS data, Group 1 represents the share of students with family incomes of $0 to $30,000, Group 2 represents $30,001 to $48,000, Group 3 represents $48,001 to $75,000, Group 4 represents $75,001 to $110,000, and Group 5 combines students with family income of $110,001 and above and students for whom income data are not available.[16] In the Opportunity Insights data, the income groups are created by choosing thresholds for ventiles that are closest to the income category thresholds reported by IPEDS, and allocating individual percentiles across ventile boundaries to allow for a closer fit.[17] Group 1 represents the share of students with family incomes from $0 to $30,100, Group 2 represents above $30,100 to $47,500, Group 3 represents above $47,500 to $74,500, Group 4 represents above $74,500 to $108,800, and Group 5 represents above $108,800.
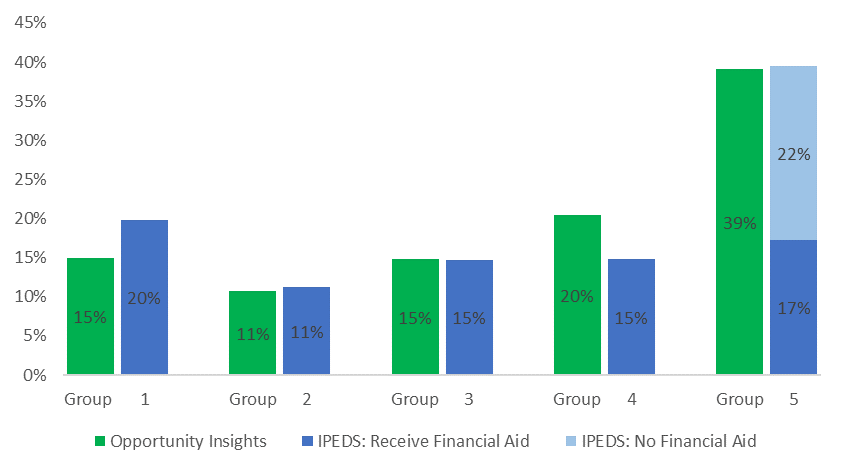
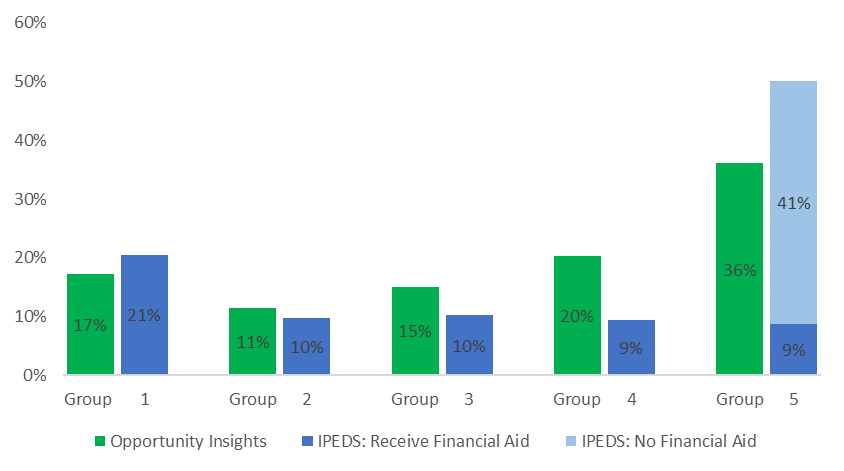
Figure 1: Comparing the 2009-10 Income Distribution at Select Colleges and Universities using IPEDS data and Opportunity Insights Data, by Institution Selectivity
A. Selectivity Tier: Ivy Plus – Ivy League Institutions plus Stanford, Duke, MIT, and University of Chicago
B. Selectivity Tier: Elite Private and Public Colleges and Universities
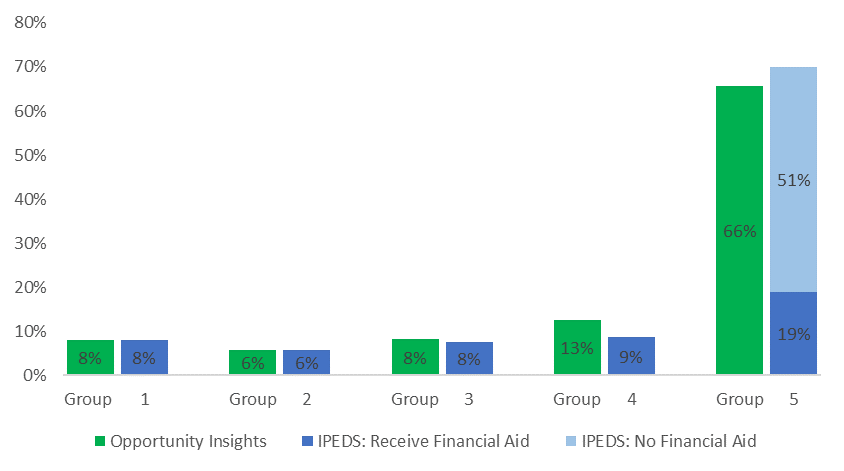
Note for Figure 1B: Students who pay out-of-state tuition at public institutions comprise 4.3 percent of total enrollment at all elite private and public institutions. Private institutions do not offer out-of-state tuition and in-state tuition, so all students, regardless of their state of residence, are included.
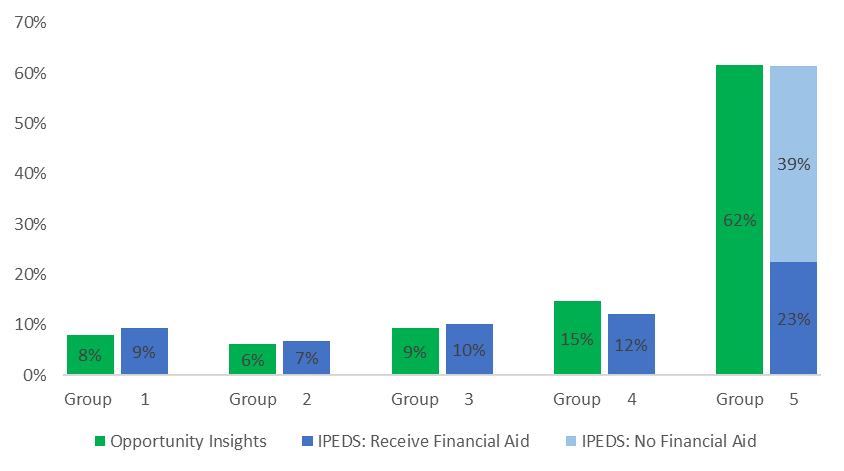
C. Selectivity Tier: Highly Selective Private Colleges and Universities
D. Selectivity Tier: Highly Selective Public Colleges and Universities
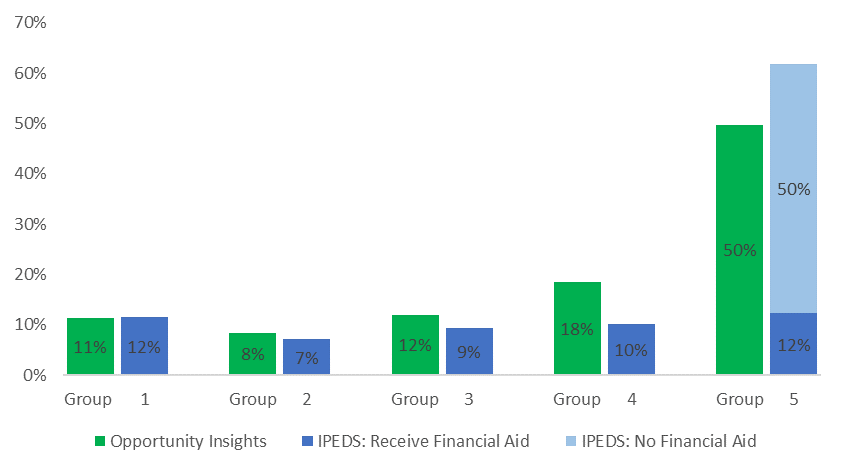
Note for Figure 1D: Students who pay out-of-state tuition comprise 18.7 percent of total enrollment at highly selective public institutions.
E. Selectivity Tier: Selective Private Colleges and Universities
F. Selectivity Tier: Selective Public Colleges and Universities
Note for Figure 1F: Students who pay out-of-state tuition comprise 16.9 percent of total enrollment at all selective public institutions.
Notes for Figures 1A-1F: IPEDS denominator includes all first-time, full-time students who are eligible to receive Title IV financial aid (i.e., the denominator excludes students classified as “non-resident alien”). Group 5 students are students included in the IPEDS data whose families’ earn $110,001+ annually (darker blue) and students who do not receive Title IV aid (lighter blue). For publics, the lighter blue portion of Group 5 also includes students who pay out-of-state tuition. Opportunity Insights selectivity tiers (e.g., Ivy Plus, Elites, Highly Selective Publics) are used to classify institutions in both data sources.
Within each tier, the share of students in Group 1 and Group 2 are very similar. For example, in the Ivy Plus tier, Opportunity Insights Group 1 is 2 percentage points larger than IPEDS’ Group 1, while Opportunity Insights and IPEDs Group 2 are the same. In the Elite Private and Public Universities tier, Groups 1 and 2 are identical across the two sources. The largest gap is in Group 1 of the Selective Privates tier, where the Opportunity Insights data shows Group 1 as four percentage points smaller than the IPEDS data and in Group 2 for the Selective Publics where the Opportunity Insights data is four percentage points higher than the IPEDs data.[18]
There are larger gaps in Groups 3, 4, and 5 between the two data sources. For example, in the Ivy Plus tier, the Opportunity Insights data shows Group 3 as four percentage points larger and Group 4 as seven percentage points larger than IPEDS shows Groups 3 and 4; counterbalancing this, IPEDS shows Group 5 as thirteen percentage points larger than Opportunity Insights shows Group 5. The largest gaps between data sources are observed in the tiers composed of public institutions—at least partly, we believe, a result of IPEDS’ exclusion of students who pay out-of-state tuition from the income categories (thereby adding them to the portion of Group 5 for whom income data are not available).
Comparing several income groups together also yields some interesting findings. When we compare Groups 1 and 2 in the aggregate to Groups 3, 4 and 5 in the aggregate, no selectivity tier has a difference of more than three percentage points between the two data sources. Groups 1 and 2 together represent students with family income below $48,000, which represented the bottom 40 percent of the family income distribution in 2008.[19] For the Elite Public and Private Universities, there is no difference between IPEDS and Opportunity Insights when comparing Groups 1 and 2 with Groups 3, 4, and 5. Selective Publics have a two percentage point difference. Highly Selective Publics have a three percentage point difference. The Ivy Plus tier has a two percentage point difference. And Highly Selective Privates and Selective Privates show a one and three percentage point difference, respectively. Opportunity Insights reports a larger share of students in Groups 1 and 2 than IPEDS for all of the tiers that show a difference, except for the selective and highly selective privates, where the IPEDs shares are higher.
In every tier, across both data sources, Group 5 has the largest share of students; indeed, it is data like these that raise issues about colleges’ and universities’ commitments to broadening college opportunity. Given that context, it is worth asking how consistent the two datasets are in their allocation between the top income category and the four lower categories—roughly the top 20 percent and bottom 80 percent of the national family income distribution.[20] The gap between the two data sources ranges from five percentage points for Highly Selective Privates and the Selective Privates, and nine percentage points in the Elite Publics and Privates, to thirteen percentage points for Ivy Plus, 18 percentage points for the Highly Selective Public Colleges and Universities, and 21 percentage points for the Selective Publics. Opportunity Insights reports a smaller share in Group 5 than IPEDS in all of the tiers.
There are several possible explanations for the inconsistencies between the two sources. First, the basis for including students in the cohort are not the same. The Opportunity Insights statistics include students born in 1991 who attended college between the ages of 19 and 22 and are assigned to the institutions they attended for the longest period of time during that period, while students included in the IPEDS statistics are assigned to the institution if they enrolled in Fall 2009 as a freshman and, regardless of age, had never enrolled in higher education previously. Second, family income is determined differently for the Opportunity Insights and IPEDS statistics. For Opportunity Insights, family income is the average adjusted gross income during the tax years when the student was age 15 through 19 of those who claimed the student on their tax return. IPEDS reports the income used by the institution to calculate the student’s expected family contribution, typically the adjusted gross income of those claiming the student as a dependent and/or the student in at least the tax year prior to the IPEDS data collection (i.e., in the 2009 IPEDS collection, income earned in 2008).[21] Third, even after interpolation, there are slight differences in the income category cut-offs used by Opportunity Insights and IPEDS.[22] Fourth, in Opportunity Insights, Groups 1 through 4 include students who did not receive Title IV aid, while in IPEDS, all students who did not receive Title IV aid are allocated to Group 5. Finally, for public institutions, the Opportunity Insights statistics include out-of-state students in Groups 1 through 5, while the IPEDS statistics allocate all out-of-state students to Group 5.[23]
Notwithstanding these known differences, the two sources yield similar distributions across the income scale. In particular, the share of students with family income below $48,000 is no more than three percentage points different between the two sources for any group of institutions. This similarity may alleviate concerns that the lack of information about non-Title-IV-aid recipients and out-of-state students for public institutions renders the IPEDS income distributions unusable. At least for the bottom 40 percent of the income distribution at the aggregate level, assuming that those students are in the top income category yields a distribution largely consistent with another, more-comprehensive source. Importantly, we have not made an apples-to-apples comparison of the IPEDS and Opportunity Insights income distributions at the institution-level using the publicly available Opportunity Insights data. It is quite possible that there are institutions for which the gaps between the two data sources are larger—or smaller—than the aggregate. There are a host of other considerations in interpreting the income distribution data that are beyond the scope of this report.[24] Nevertheless, for those analysts currently limiting themselves to Pell data for assessing the socioeconomic diversity of colleges’ student populations, the IPEDS income distribution data provide important additional information about how students cluster across a broader spectrum of income.
Comparison of IPEDS and CDS Data
Comparing information about the share of students who receive financial aid from different sources with the information about the income distribution adds an additional level of insight into the financial situation of students from different parts of the income distribution. Figure 2 compares the data on the income distribution of first-time, full-time students in the 2009 entering cohort from IPEDS to two sets of information about financial aid receipt for the same group of students: the share of students who receive need-based financial aid (data available through CDS), and the share of students who receive federal Pell grants (data available through IPEDS). Like the previous figure, this figure aggregates institutions into groups by selectivity and control.
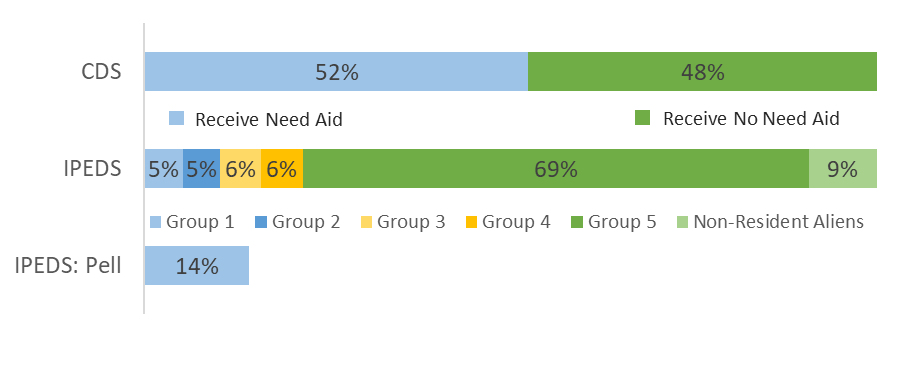
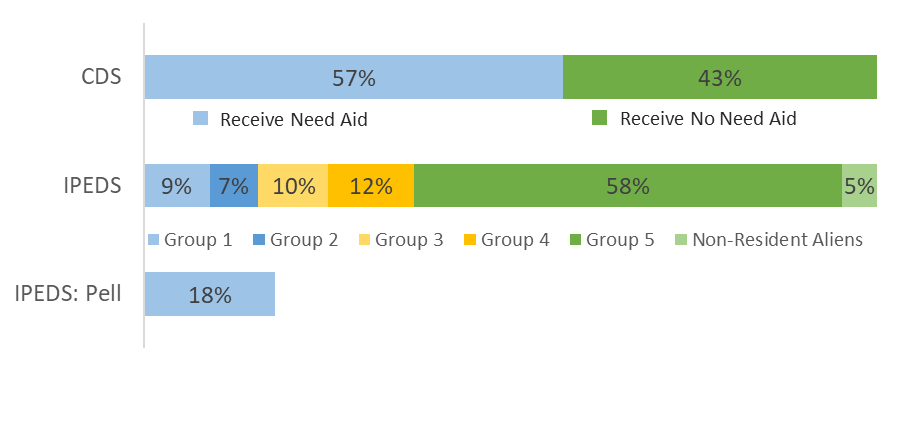
Figure 2: Comparing the 2009-10 Income Distribution at Select Colleges and Universities using IPEDS Data and the Common Data Set, by Institution Selectivity
A. Selectivity Tier: Ivy Plus
B. Selectivity Tier: Elite Privates and Public

C. Selectivity Tier: Highly Selective Privates
D. Selectivity Tier: Highly Selective Publics
E. Selectivity Tier: Selective Privates
F. Selectivity Tier: Selective Publics
Notes for Figures 2A-2F: For IPEDS data, the denominator is all first-time, full-time students, regardless of their eligibility to receive Title IV financial aid (i.e., the denominator includes students classified as “non-resident alien”). IPEDS Group 5 students (darker green) include students whose families’ earn $110,001+ annually who receive need-based aid and US and permanent resident students who do not receive Title IV aid. Opportunity Insights selectivity tiers are used to classify institutions across all data sources.
Note that, because the CDS data includes non-resident aliens in the numerator and denominator, we have included non-resident aliens in the IPEDS income distribution and the calculation of the share of students receiving Pell. As a result, the IPEDS income distributions presented in Figure 2 are slightly different from those presented in Figure 1. Importantly, IPEDS does not indicate the income distribution of non-resident aliens and CDS does not indicate the share of non-resident aliens that receive need-based, institutional financial aid. Nevertheless, we can bound the share of US citizens and permanent residents receiving need-based aid by assuming that either all or none of the non-resident alien students receive need-based aid. In most cases, the actual shares will be someplace in between. For some institutions, data on non-resident alien, need-based aid are available, and so a more precise estimate for those institutions would be possible with further analysis.
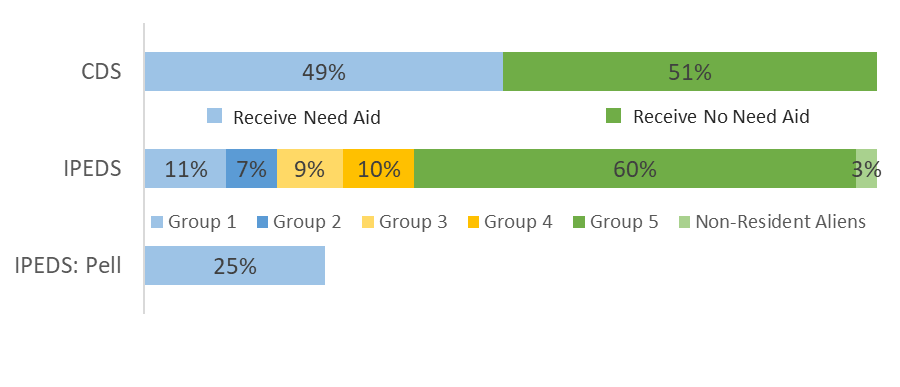
Figure 2 shows that, at the Ivy Plus, Elite Publics and Privates, and Highly Selective Privates, need-based aid is awarded to a significant share of students with incomes above $110,000 or whose income is unknown.[25] For example, in the Ivy Plus tier, according to IPEDS, 22 percent of students are US citizens or permanent residents with incomes below $110,000, while nine percent are international students. That leaves 69 percent of students who are US citizens or permanent residents and have incomes above $110,000 or whose income is unknown. The CDS reports that 52 percent of students at Ivy Plus institutions received need-based aid. If all non-resident alien students received need-based aid, it would mean that 21 percent of all students were US citizens or permanent residents from families earning more than $110,000 or whose income is unknown who received need-based aid (52 percent minus 22 percent minus 9 percent). If no non-resident alien students in fact received need-based aid, then 30 percent of all students were US citizens or permanent residents from families earning more than $110,000 or whose income is unknown who received need-based aid (52 percent minus 22 percent).
This analysis also provides insight on the share of need-based aid recipients who are US students from families with income above $110,000 or whose income is unknown. For the Ivy Plus institutions in 2009-10, approximately 40 to 58 percent of students who received need-based aid were US citizens or permanent residents from families earning more than $110,000 or whose income is unknown.
In each selectivity tier, many students with incomes above $110,000 or whose income is unknown received need-based financial aid. Specifically, the lower- and upper-bounds for each selectivity tier are:
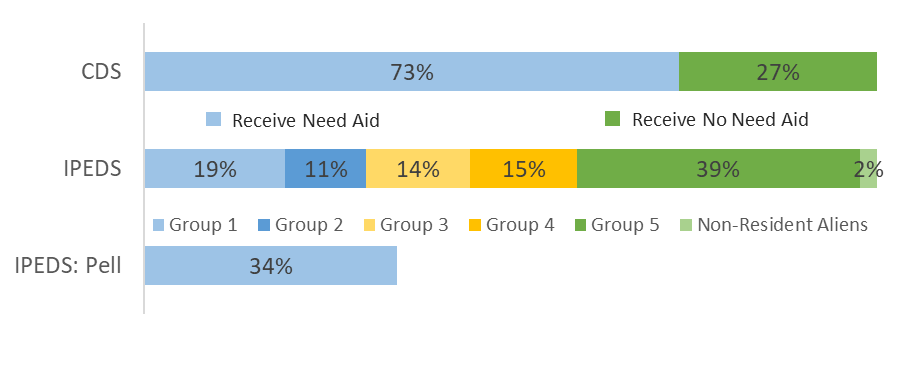
- Elite Privates and Publics: 14 to 20 percent of all students are US citizens or permanent residents from families earning more than $110,000 or whose income is unknown who receive need-based aid. Thirty to 43 percent of those who received need-based aid are US citizens or permanent residents from families earning more than $110,000 or whose income is unknown.
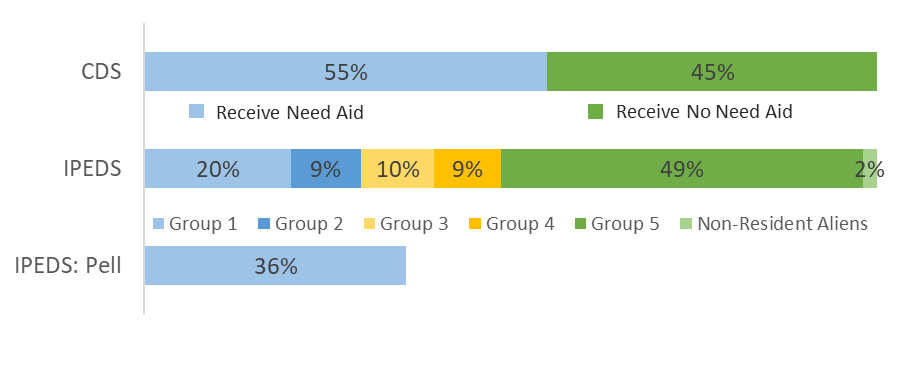
- Highly Selective Privates: 14 to 19 percent of all students are US citizens or permanent residents from families earning more than $110,000 or whose income is unknown who receive need-based aid. Twenty-five to 33 percent of those who received need-based aid are US citizens or permanent residents from families earning more than $110,000 or whose income is unknown.
- Highly Selective Publics: Eight to 11 percent of all students are US citizens or permanent residents from families earning more than $110,000 or whose income is unknown who receive need-based aid. Seventeen to 23 percent of those who received need-based aid are US citizens or permanent residents from families earning more than $110,000 or whose income is unknown.
- Selective Privates: 11 to 13 percent of all students are US citizens or permanent residents from families earning more than $110,000 or whose income is unknown who receive need-based aid. Fifteen to 18 percent of those who received need-based aid are US citizens or permanent residents from families earning more than $110,000 or whose income is unknown.
- Selective Publics: Six to eight percent of all students are US citizens or permanent residents from families earning more than $110,000 or whose income is unknown who receive need-based aid. Eleven to 15 percent of those who received need-based aid are US citizens or permanent residents from families earning more than $110,000 or whose income is unknown.
Another finding evident from Figure 2 is that, for all selectivity tiers, the share of students receiving Pell grants is larger than the share from IPEDS income Groups 1 and 2. In other words, within each tier, there were between two and six percent of students with incomes above $48,000 who received Pell grants. Pell grant receipt is often used as a proxy for “low-income.” This comparison suggests that, in fact, at least for these groups of institutions in 2009, Pell grant recipients included many students with family incomes between $48,000 and $75,000. Nationally, the median family income in 2008 was $61,521.[26] In short, many Pell recipients at these institutions in 2009 would more accurately be considered “middle-income.”
Trends in IPEDS and CDS
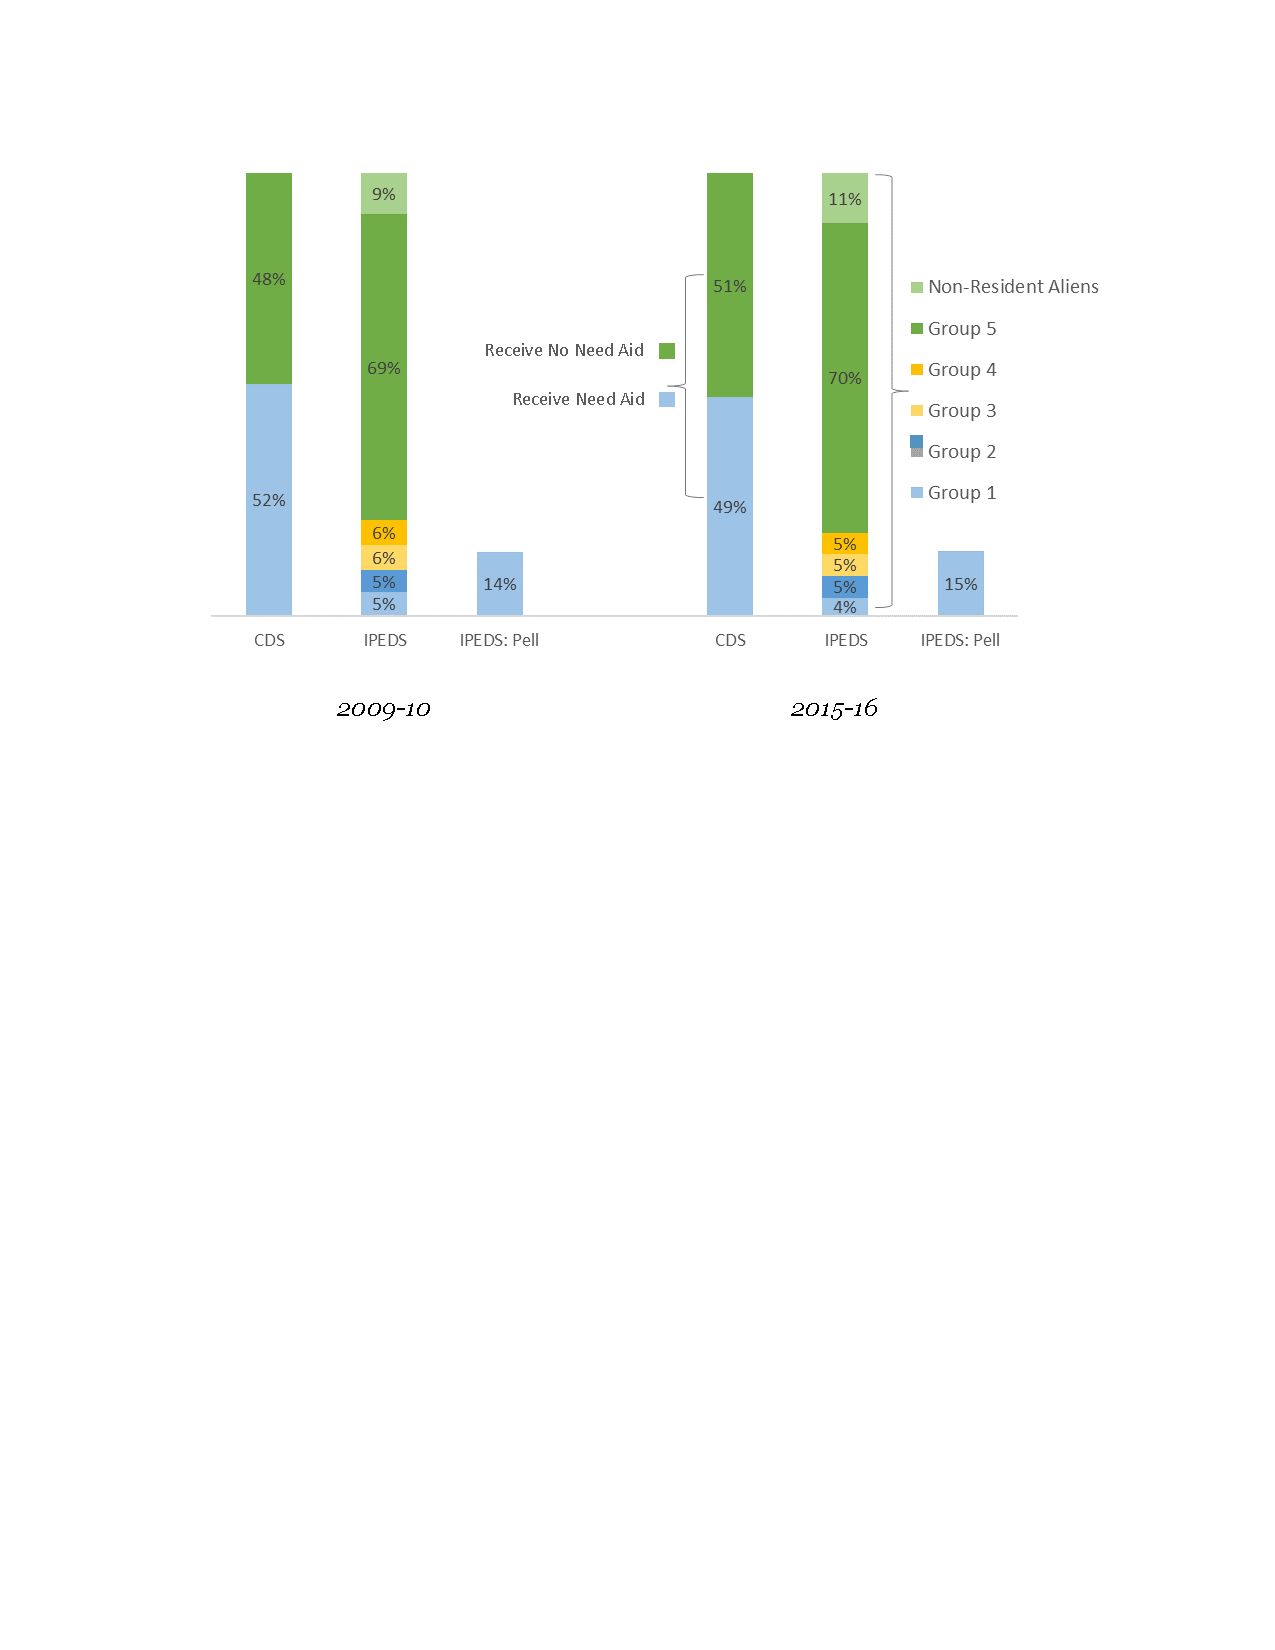
One important limitation of the publicly-available Opportunity Insights data is that it is not currently available for cohorts after the 1991 birth cohort, who most likely enrolled in college in 2009—the height of the Great Recession. It is particularly interesting to study trends in the income distribution as the consequences of the Recession unfolded and during the recovery; fortunately, more recent data are available from both IPEDS and CDS, allowing us to examine trends in the income distribution, need-based financial aid, and Pell receipt during that time. Figure 3 presents those statistics for the fall 2009 and fall 2015 entering cohorts of first-time, full-time students, in our now-familiar institutional tiers.
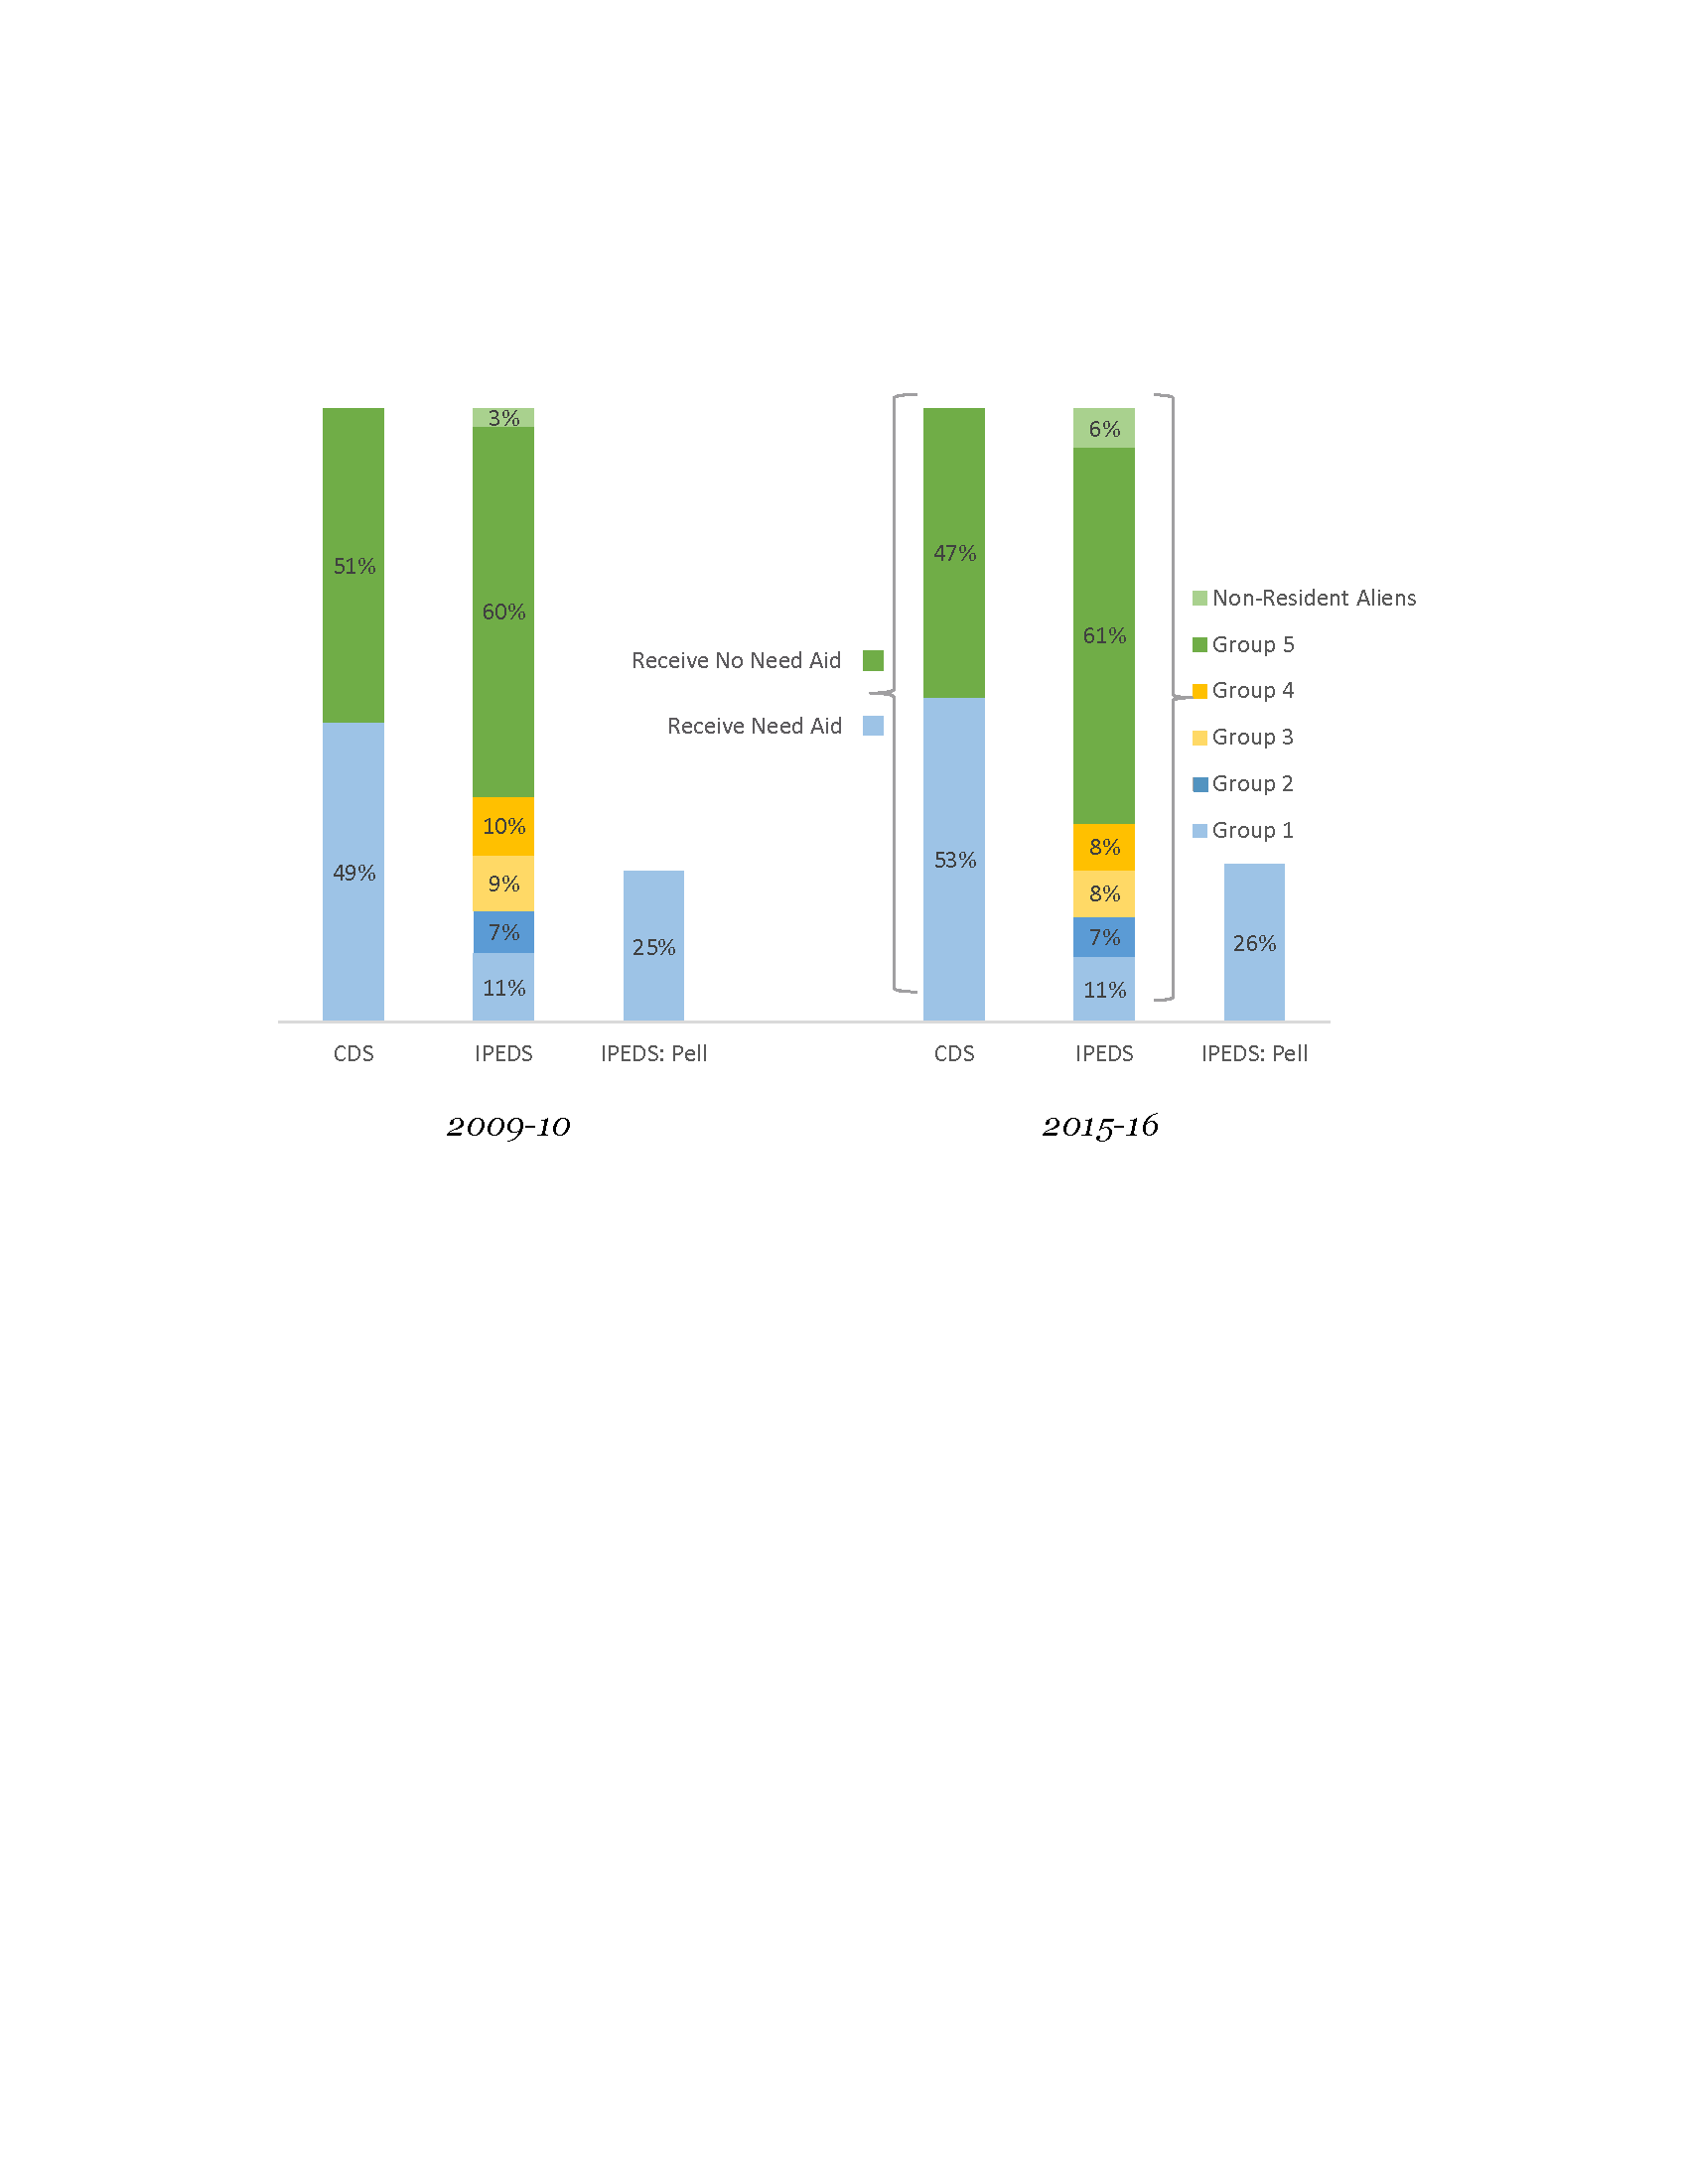
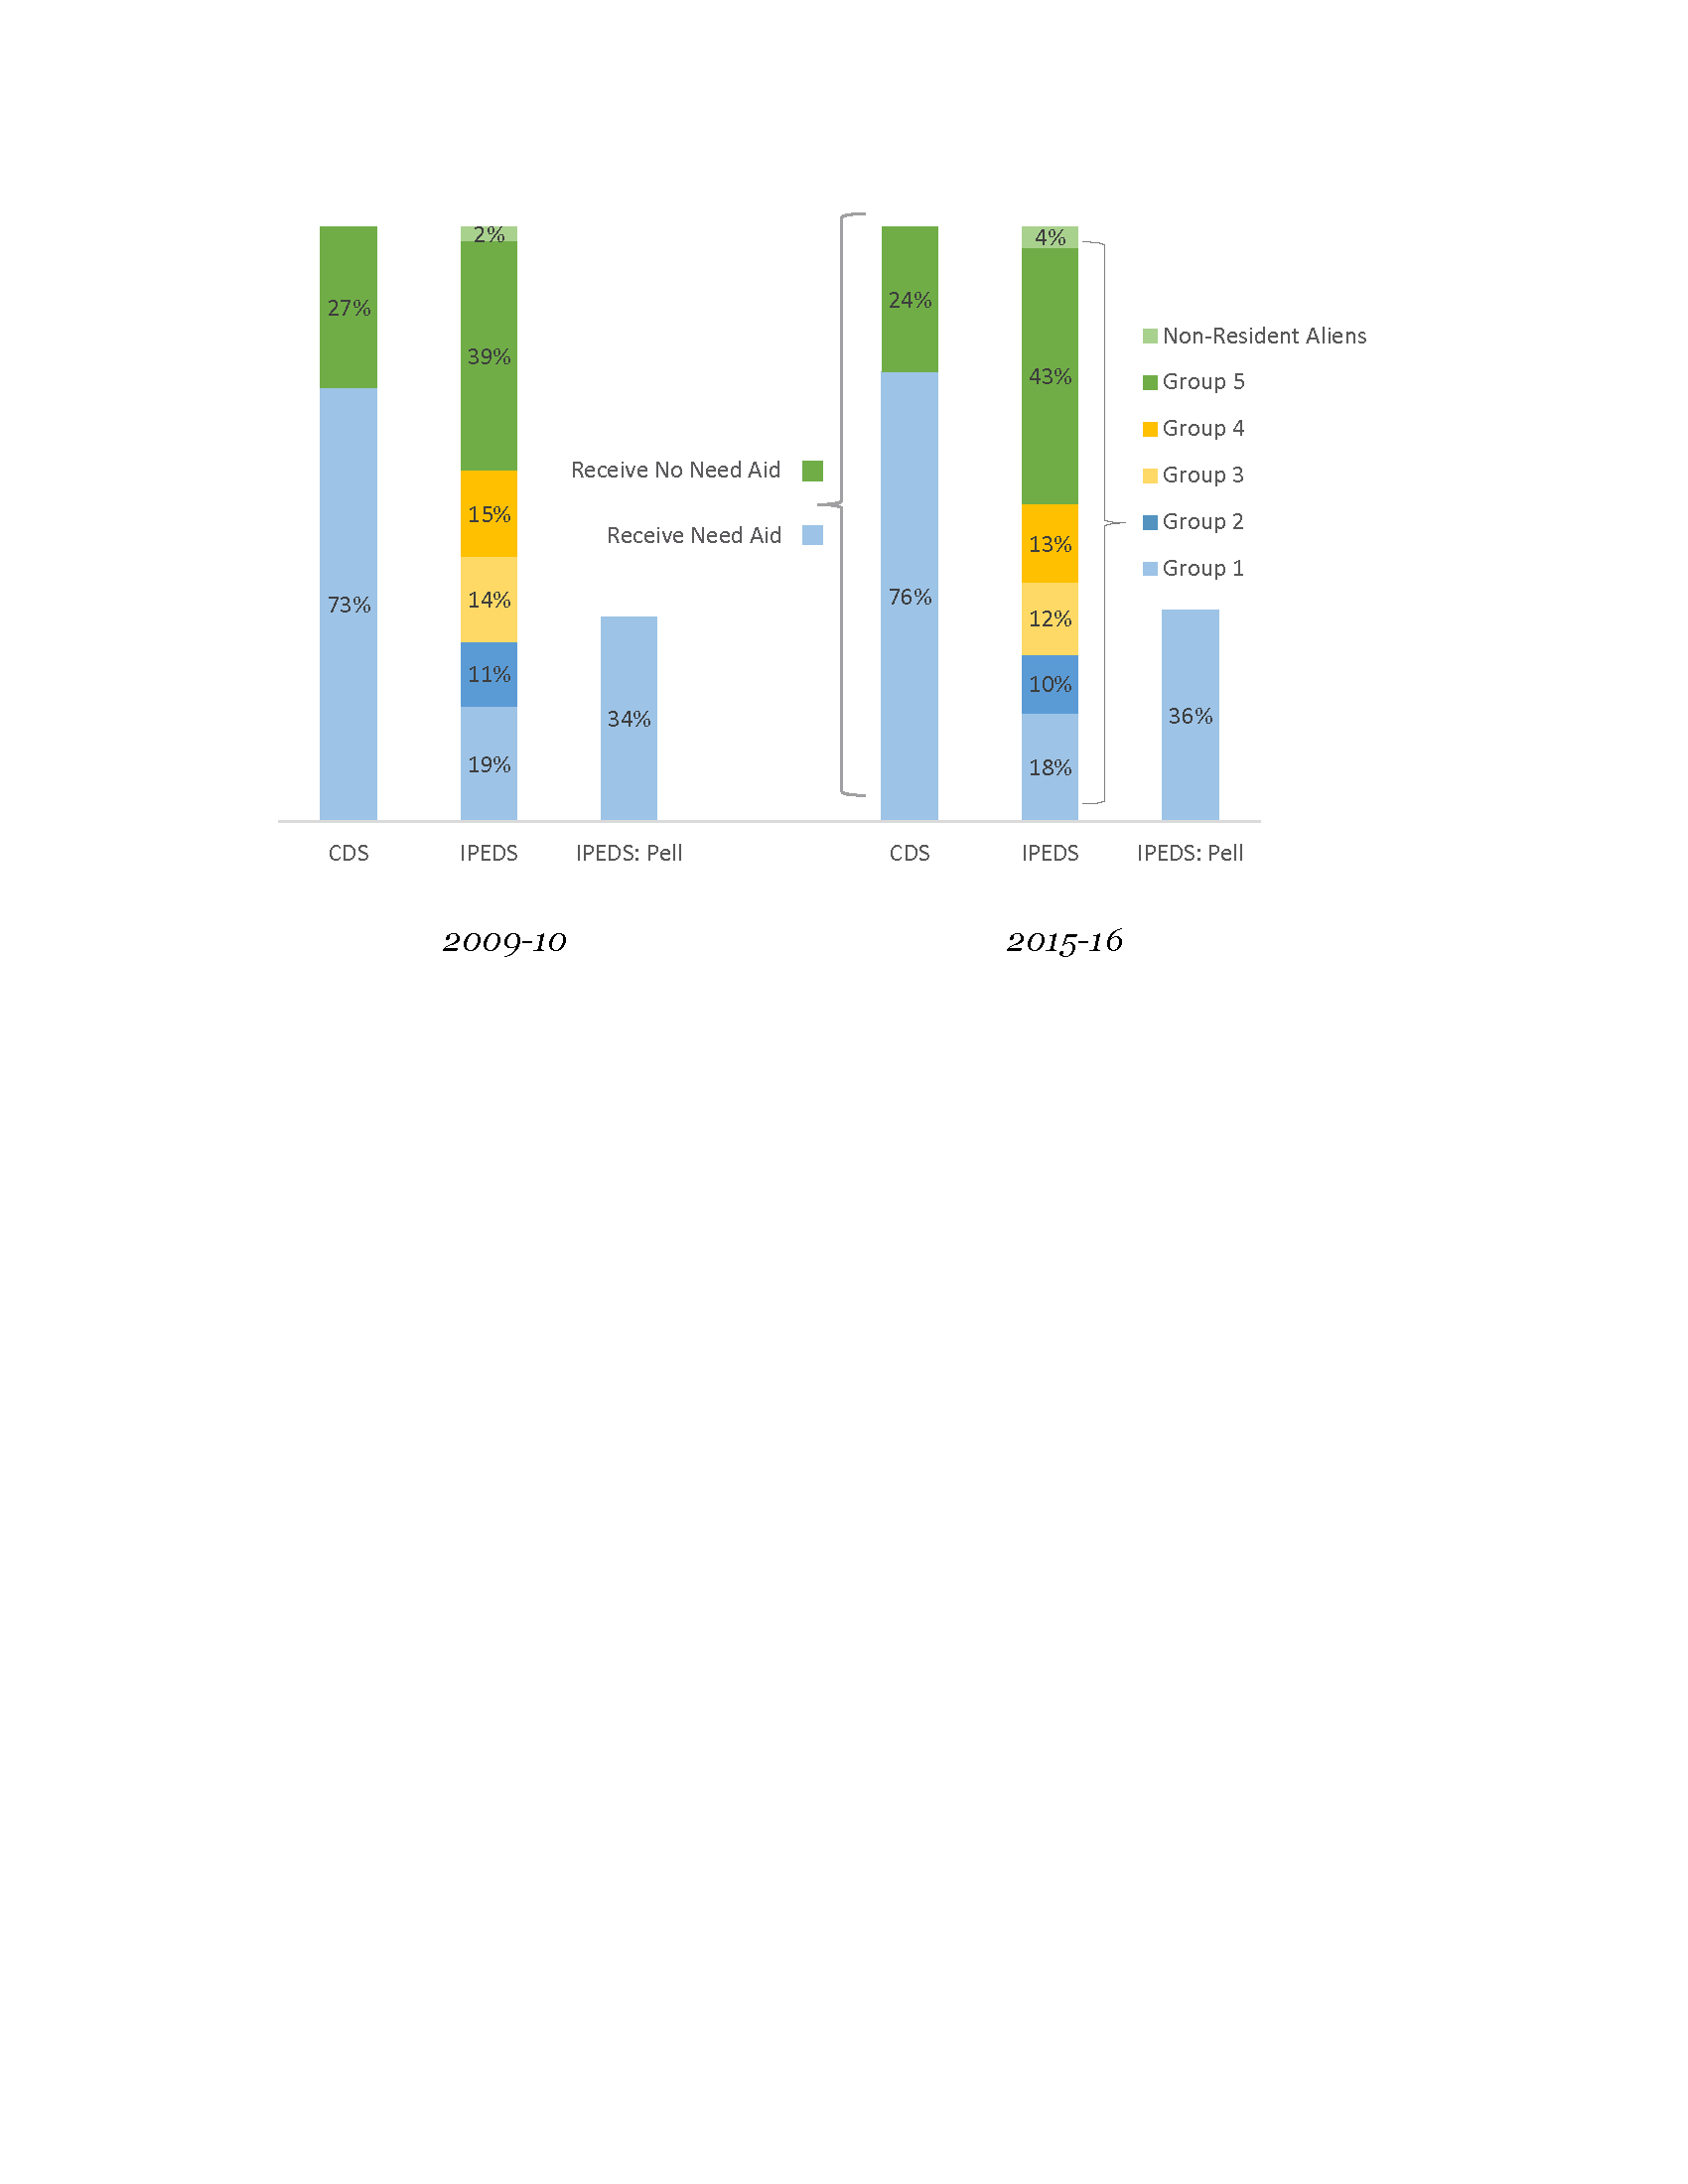
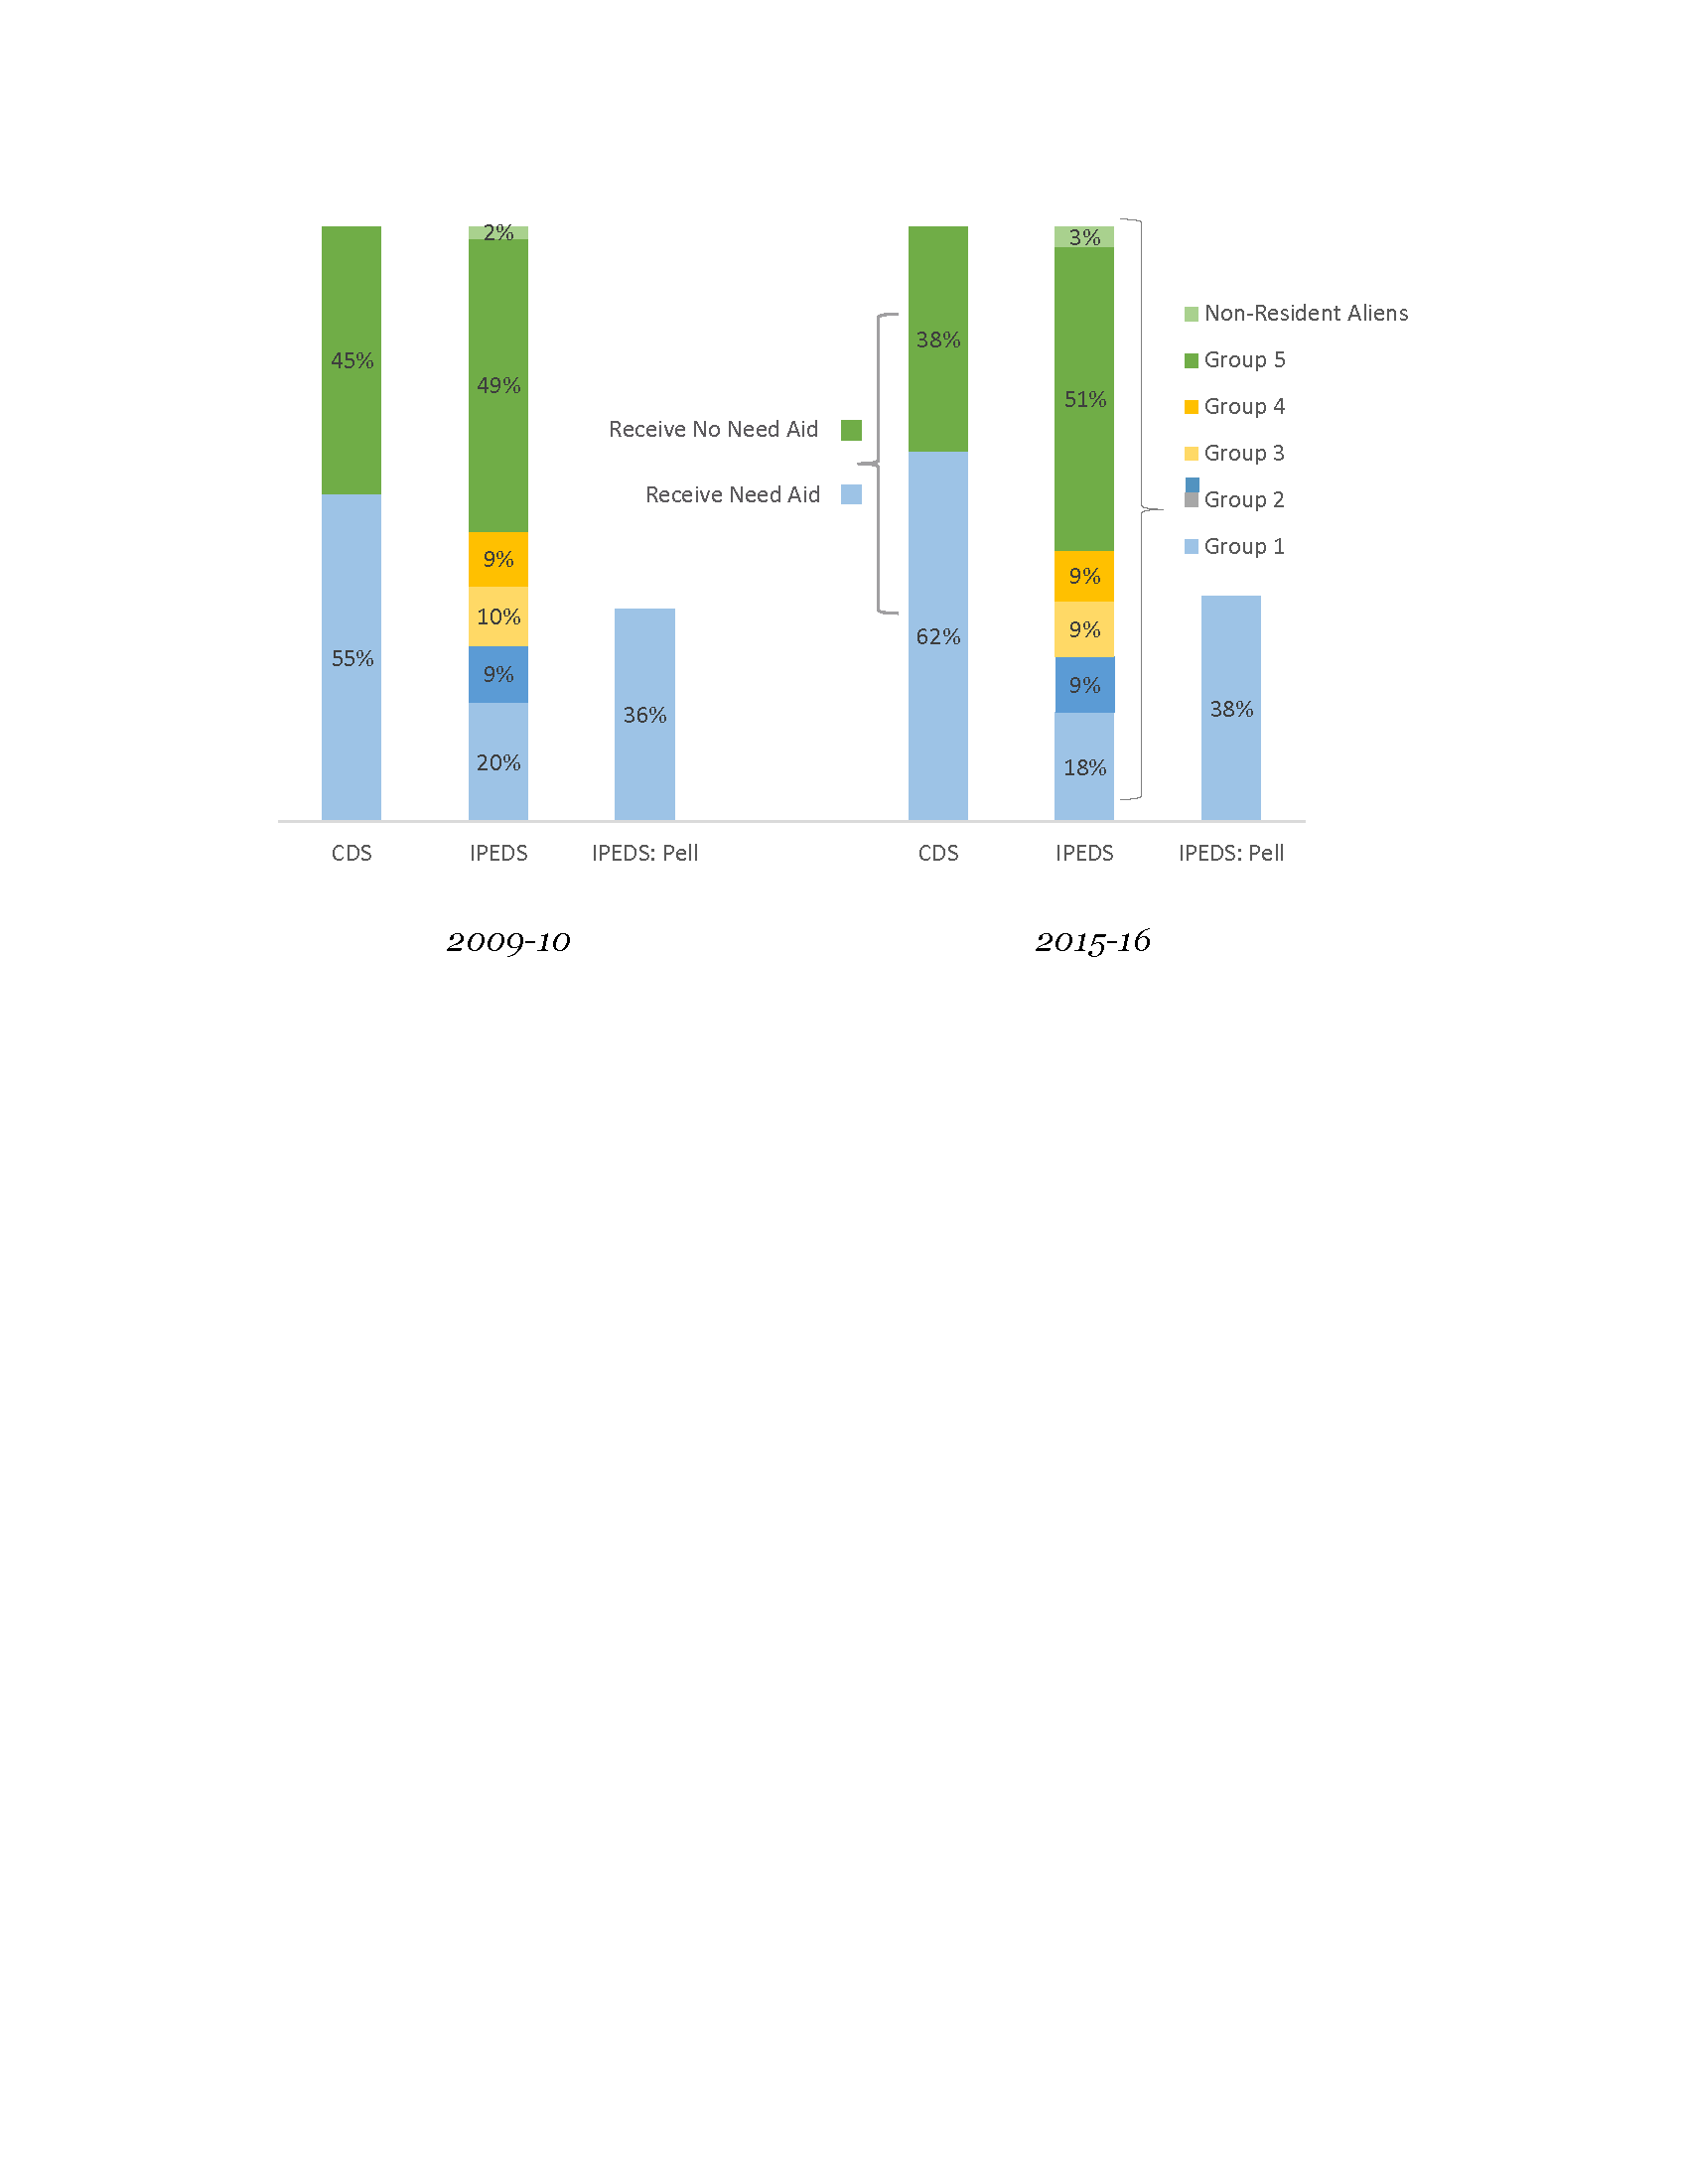
Figure 3: Comparing the 2009-10 and 2015-16 Income Distribution at Select Colleges and Universities using IPEDS Data and the Common Data Set, by Institution Selectivity
A. Selectivity Tier: Ivy Plus
B. Selectivity Tier: Elite Publics and Privates

C. Selectivity Tier: Highly Selective Privates

D. Selectivity Tier: Highly Selective Publics
E. Selectivity Tier: Selective Privates
F. Selectivity Tier: Selective Publics
Notes for Figures 3A-3F: For IPEDS data, the denominator is all first-time, full-time students, regardless of their eligibility to receive Title IV financial aid (i.e., the denominator includes students classified as “non-resident aliens”). IPEDS Group 5 students (darker green) include students whose families’ earn $110,001+ annually and US citizens and permanent resident students who do not receive Title IV aid. Opportunity Insights selectivity tiers are used to classify institutions across all data sources.
Note that the IPEDS categories are in nominal dollars, not adjusted for inflation. As a result, changes in the share of students from each nominal income category do not necessarily reflect changes in real income.[27]
With this caveat in mind, we call still learn something from comparing the data over time. For the Ivy Plus institutions, the income distribution remained relatively unchanged between 2009-10 and 2015-16 with the share of US citizens and permanent resident students with incomes above $110,000 or whose income is unknown increasing by one percentage point. During the same time period, these schools experienced a one percentage point increase in the share of students receiving Pell grants and a three percentage point reduction in the share of students who received need-based aid. The share of non-resident aliens increased by two percentage points. The combination of the reduction in students receiving need-based aid and the small increase in students with incomes over $110,000 or whose income is unknown could mean that there was a shift toward higher income students within that top income category. It could also suggest changes to policies related to distributing need-based aid at these schools – they may have reduced the amount of aid awarded, increased the income threshold for eligibility to receive that aid, or changed their methodology for determining family income.
For the Elite Public and Private schools, the IPEDS data show a reduction of four percentage points in the share of students with incomes below $110,000 and a four percentage point increase in the share who are non-resident aliens between 2009-10 and 2015-16. The share of students who received need-based financial need remained unchanged. This suggests that in 2015-16, these institutions awarded need-based aid to larger shares of students in the top IPEDS income category (or possibly to non-resident aliens or out-of-state students) than in 2009-10, and this increase came at the expense of enrolling US citizens and permanent residents with family incomes below $110,000, whose share declined by four percentage points.
The schools in the Highly Selective Private tier enrolled larger shares of wealthier students and non-resident aliens in 2015-16 than they did in 2009-10, while maintaining the share of students who receive need-based aid—meaning that there were more students with incomes above $110,000 or non-resident aliens receiving need-based aid.[28]
The Highly Selective Publics saw an increase in the share of students receiving need-based financial aid by five percent and doubled the share of non-resident aliens from three percent to six percent. The share of US citizens and permanent residents with incomes over $110,000 or whose income is unknown remained unchanged at 61 percent in 2015 compared to 61 percent in 2009.
The Selective Privates increased the share of students receiving need based aid by three percentage points, the share of non-resident aliens by two percentage points, and the share of US citizens and permanent residents with incomes over $110,000 or whose income is unknown by five percentage points. The Selective Publics increased the share on need-based aid by seven percent, the share of non-resident aliens by one percent and the share of US citizens and permanent residents with incomes over $110,000 or whose income is unknown by one percentage point.
In summary, each group saw an increase in the share of non-resident aliens. It is possible that this resulted from institutions seeking out full-pay international students to increase revenue. The Ivies, the Elite Publics and Privates, and the Highly Selective Privates all saw decreasing or constant shares of students receiving need-based aid. Combined with increased shares of non-resident aliens, this implies a constant or lower share of US citizens and permanent residents on financial aid, unless the share of non-resident aliens receiving financial aid decreased. The Highly Selective Publics and the Selective Privates and Publics all saw increasing shares of need-based aid, of four percent, three percent and seven percent respectively. None of the categories saw a shift in Pell grants of more than two percent. None of the categories of institutions reported a declining share of students in the top IPEDS category.
Conclusion
While there are limitations with each of the available datasets, by comparing the Opportunity Insights data with IPEDS income distribution data, we conclude that the IPEDS data give additional useful information on the income distribution of students. This is particularly the case for the more selective institutions. Combining these data with information on financial aid available in the CDS, we are able to estimate the share of students who have incomes above $110,000 (roughly, the top quintile of the income distribution) and are receiving need-based aid. Looking at these data over time, we can trace the shift in the income distribution of students, as well as shifts in need-based aid allocation across the income distribution.
Especially among the most selective institutions, low shares of students with incomes below $48,000 correspond with high shares of students with family incomes above $110,000 or whose income is unknown who are receiving need-based financial aid. Furthermore, between 2009-10 and 2015-16, a decreasing share of students had incomes below $110,000 and an increasing share of students had incomes above $110,000 and received need-based aid. Based on what we know about the value of a bachelor’s degree, these enrollment and financial aid trends are likely to be a barrier to, rather than advancement of, economic and social mobility.
Appendix
Figure A: The Total Cohort of Students with Opportunity Insights Income Data compared to the Total Number of Students in the IPEDS Data, by Institution Selectivity
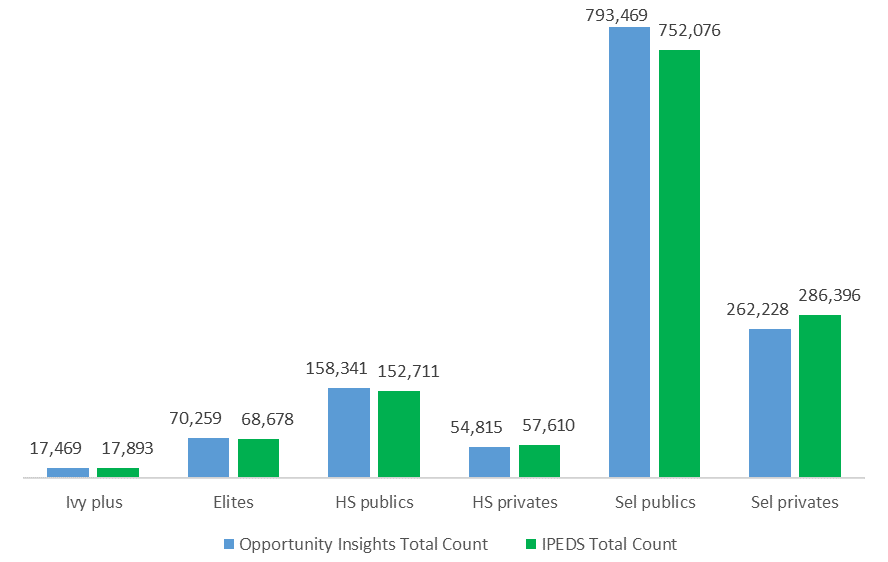
Figure A shows the number of students in each of the income categories for Opportunity Insights and IPEDS, as a check on the validity of the comparison. In general, these results confirm that the number of students represented in the two datasets are similar at the level of aggregate selectivity groups, bolstering our conclusion that the Opportunity Insights and IPEDS distributions are consistent at this multi-institutional level. The largest gaps are in the Selective Public tier and the Selective Private tier, which also have the largest gaps in the income distribution between the two data sources.
Endnotes
- See Opportunity Insights, https://opportunityinsights.org/. ↑
- See U.S. Department of Education, National Center for Education Statistics, Integrated Postsecondary Education Data System, https://nces.ed.gov/ipeds/. ↑
- See Common Data Set Initiative, http://www.commondataset.org/. Many but not all colleges that participate in the CDS post their completed templates on their websites, and the data from those posted templates could be collected and aggregated. The College Board administers the Annual Survey of Colleges, which captures many of the data points in the CDS. See The College Board, Annual Survey of Colleges, https://professionals.collegeboard.org/higher-ed/recruitment/annual-survey. To conduct the analyses in this paper, we requested and received from The College Board a dataset of Annual Survey of Colleges responses to items found in the CDS for the years 2006 through 2016. ↑
- In 2015-16, approximately 95 percent of Pell students were from families who earn less than $60,000 annually. Calculations by Ithaka S+R staff using data from the US Department of Education, 2015–16 Federal Pell Grant Program End-Of-Year Report, Table 71, https://www2.ed.gov/finaid/prof/resources/data/2015-2016eoyresearchreports.zip. The average Pell grant gives some information on the income of the recipients, since it varies as a function of income. ↑
- As an example, of the 12 Ivy Plus institutions, two (the University of Chicago and Columbia University) do not report their CDS data. ↑
- U.S. Department of Education, National Center for Education Statistics, IPEDS Archived Survey Materials, 2009 Student Financial Aid Survey, https://nces.ed.gov/ipeds/UseTheData/ArchivedSurveyMaterialPdf?year=2009&fileName=sfa_2009.pdf. ↑
- For the entering cohort of 2017-18, federal financial aid applicants were permitted to use tax returns from the year prior to application, or two years prior to enrollment, in their applications. See U.S. Department of Education, Changes Impacting the 2017–18 FAFSA®: Frequently Asked Questions, https://financialaidtoolkit.ed.gov/resources/fafsa-changes-17-18-faq.pdf. ↑
- See The College Board, Institutional Methodology (IM), https://professionals.collegeboard.org/higher-ed/financial-aid/im. ↑
- See, e.g., U.S. News & World Report, Best Colleges Ranking 2019, https://www.usnews.com/best-colleges. ↑
- See The College Board, Annual Survey of Colleges; Peterson’s, https://www.petersons.com/. ↑
- See Opportunity Insights, Mobility Report Cards, https://opportunityinsights.org/paper/mobilityreportcards/. The project was announced in The New York Times with an accompanying interactive data tool. See “Some Colleges Have More Students from the Top 1 Percent Than the Bottom 60. Find Yours,” The Upshot, The New York Times, January 18, 2017, https://www.nytimes.com/interactive/2017/01/18/upshot/some-colleges-have-more-students-from-the-top-1-percent-than-the-bottom-60.html. The most recently revised version of the research paper is Raj Chetty, John N. Friedman, Emmanuel Saez, Nicholas Turner, and Danny Yagan, “Mobility Report Cards: The Role of Colleges in Intergenerational Mobility,” July 2017, https://opportunityinsights.org/wp-content/uploads/2018/03/coll_mrc_paper.pdf. ↑
- Each year, US residents file a 1040 tax form to report their annual wages and other income in order to determine the total amount of their federal tax burden. Colleges and universities issue a 1098-T tax form for each enrolled student who pays tuition and in some cases, students who do not pay tuition. The researchers link children to the college they attended for the greatest number of years between ages 19-22. See Chetty et al., p. 7. ↑
- Ibid. The researchers report this impacts approximately four percent of the colleges and universities and approximately 18 percent of students in their sample. ↑
- This income measure typically includes W-2 wages, earnings from other income sources—such as income reported on tax form 1099 or income from real estate investments, partnerships, or sole proprietorships—and certain “above the line” deductions. See https://www.irs.gov/pub/irs-pdf/f1040.pdf. ↑
- The 1991 birth cohort would have been 18 in 2009, the most typical age for first-time, full-time students. The institutional groups are those reported by Opportunity Insights, and in some cases include multiple public institutions from the same state with different levels of selectivity that share a Form 1098-T reporting system. We matched the IPEDS data to those institutional groups, even though IPEDS does not have the same limitation. ↑
- Students for whom family income is unknown include students who do not receive Title IV aid because they are ineligible or do not apply, and out-of-state students at public institutions. In these graphs, non-resident aliens are excluded from both the numerator and the denominator. ↑
- An empirical challenge arises when comparing the income distributions reported by IPEDS and Opportunity Insights. While IPEDS reports shares of students in fixed income groups ($0-30,000, $30,001-48,000, $48,001-$75,000, $75,001-110,000 and $110,001 and above), Opportunity Insights reports shares in income ventiles based on a birth cohort-specific national income distribution. Opportunity Insights also provides cutoffs for each parental income percentile. In order to construct the most direct comparison, we use the following imputation procedure to map the shares reported by Opportunity Insights into the fixed IPEDS income groups. First, we locate the Opportunity Insights parental income percentile cutoff that is closest to the threshold for a given IPEDS income group. For example, the closest cutoff to the upper threshold for IPEDS Group 1 (representing incomes of $30,000 and below) is the 35th parental income percentile which corresponds to incomes up to $30,100. Second, we estimate the share of students within each percentile by diving the reported number within each ventile by five. [This assumes an even distribution of students within each reported parental income ventile, a method we followed because it was the most effective at reducing errors in imputed shares within the five IPEDS income groups. We tested this by comparing the reported ventile shares with imputed shares generated using a faux dataset of quintile (aggregated ventile) shares using a variety of alternative imputation methods.] Finally, we aggregate the percentile shares within each imputed income group. In our example, that means that the imputed student share for Group 1 is the aggregate of estimated shares for percentiles 0 through 35. ↑
- Throughout the paper in the graphs, totals may not sum to 100% because of rounding. In addition, we report ratios based on the rounded figures reported in the paper. ↑
- US Census Bureau, Current Population Survey, Annual Social and Economic Supplements, Table F-1, https://www.census.gov/content/census/en/data/tables/time-series/demo/income-poverty/historical-income-families.html. The U.S. Census Bureau reports family income annually, for all families, not just the population with college-age students. A family consists of two or more people related by birth, marriage, or adoption residing in the same housing unit. ↑
- The lower limit for the top fifth of family incomes for all families in 2008 was $ 113,205. In 2014, this cutoff increases in current dollars to $129,006. US Census Bureau, Current Population Survey, Annual Social and Economic Supplements, Table F-1, https://www.census.gov/content/census/en/data/tables/time-series/demo/income-poverty/historical-income-families.html. ↑
- With nominal and real incomes normally increasing, we would expect IPEDS incomes to be greater than Opportunity Insights incomes for most students. Also, some institutions use the institutional methodology rather than the federal methodology, which may include additional income not included in AGI, pushing IPEDs incomes higher. ↑
- The ventile cutoffs are reported in the Opportunity Insights data by institutional category, not individual institution. ↑
- While interpretation of comparisons across any of the institution categories should be treated with caution, this treatment of out-of-state students at public institutions means that comparisons between the IPEDS income distribution of publics and privates is particularly fraught. ↑
- For example, two institutions with the same income distribution may face very different pools of potential students. See Caroline Hoxby and Sarah Turner, “The Right Way to Capture College ‘Opportunity,’” Education Next, 19, no. 2 (Spring 2019), https://www.educationnext.org/right-way-capture-college-opportunity-popular-measures-can-paint-wrong-picture-low-income-student-enrollment/; Catharine B. Hill and Gordon C. Winston, “Low-Income Students and Highly Selective Private Colleges: Geography, Searching, and Recruiting,” Economics of Education Review 29 (2010): 495-503; Catharine B. Hill and Gordon C. Winston, “How Scarce Are High-Ability, Low-Income Students?,” in Michael S. McPherson and Morton Owen Schapiro eds., College Access: Opportunity or Privilege? (The College Board, 2006), 75-102. While the context of a school’s pool is helpful in evaluating the socioeconomic diversity of its student body, it is important to remember that the pool is a choice variable and not completely exogenous. Even public institutions that face some constraints on in-state admissions have significant flexibility in many cases, as demonstrated by the share of out of state students or international students. Beyond interpretation, it is important to consider all of the potential implications of how these data are used. In particular, the use of categorical measures such as the Pell recipient share and the share of students below an income threshold as targets in an accountability scheme may incentivize recruitment of students just within the category threshold at the expense of students just outside the threshold. See Hoxby and Turner. While Hoxby and Turner advocate a fine-grained approach to the measurement of income distribution that depends on access to confidential IRS data, until such data are generally available, gross information on the broader income distribution such as that included in IPEDS may help to understand and guard against the threshold effects they caution against. ↑
- For simplicity, the calculations reported in this section group together students who are known to have family incomes above $110,000 and students whose family incomes are unknown because they do not receive Title IV aid or, for the publics, are out-of-state students. To the extent that students whose family income is unknown actually have family income of $110,000 and below, there will be errors in the estimates presented in this section of the shares of higher-income students receiving need-based aid. Based on the analysis in the previous section comparing IPEDS and Opportunity Insights data, it is likely that the vast majority of students with incomes below $110,000 do receive Title IV aid and are in-state for public institutions. ↑
- U.S. Census Bureau, Current Population Survey, Annual Social and Economic Supplements, Table F-6, https://www.census.gov/content/census/en/data/tables/time-series/demo/income-poverty/historical-income-families.html. ↑
- Table 1 reports the IPEDs income categories as well as the 2008 and 2014 upper limits of the quintiles of family incomes in the United States in current dollars. If the IPEDs categories had been inflated by the CPI – U – RS between 2014 and 2008, the inflator would have been 1.101. Table 1: IPEDS categories compared to Family Income Quintile Boundaries, 2008 and 2014 (current dollars)
IPEDS Categories National Family Income Upper Bounds IPEDS Groups Quintile 2008 2014 Group 1 0-30,000 Q1 27,800 29,100 Group 2 30,001-48,000 Q2 49,325 52,697 Group 3 48,001-75,000 Q3 75,000 82,032 Group 4 75,001-110,000 Q4 113,205 129,006 Source: U.S. Census Bureau, Current Population Survey, Annual Social and Economic Supplements, Table F-1, https://www.census.gov/content/census/en/data/tables/time-series/demo/income-poverty/historical-income-families.html. ↑
- In both cases the data could be consistent with little change in the incomes distribution of students, with inflation and income growth pushing some students into the IPEDS Group 5 whose incomes would have placed them in IPEDS Group 4 in 2009-10. ↑
Attribution/NonCommercial 4.0 International License. To view a copy of the license, please see http://creativecommons.org/licenses/by-nc/4.0/.