Collecting Additional Data on Students with Disabilities in the Integrated Postsecondary Education Data System (IPEDS)
Benefits and Challenges
Foreword
In 2024, the National Postsecondary Education Cooperative (NPEC), an advisory group to the National Center for Education Statistics and part of the US Department of Education, commissioned this report, which we completed in February 2025. The report’s purpose was to assess the feasibility of expanding the Integrated Postsecondary Education Data System (IPEDS) to capture better information about students with disabilities enrolled in US postsecondary institutions.
The release of the report was delayed due to policy and personnel changes at the US Department of Education and the National Center for Education Statistics (NCES). With permission from Synergy Enterprises, the primary contractor that supported the work for NPEC, Ithaka S+R is now pleased to share the report publicly.
The report’s findings are based on an environmental scan of national data collections, a review of relevant federal laws, an analysis of IPEDS and NPSAS data, and interviews with institutional researchers, disability services professionals, and staff from state higher education agencies. We conducted the interviews and reviewed the data and broader landscape between September 2024 and January 2025.
We would like to thank the NCES staff who provided advice and support in the development of this work, as well as the members of the NPEC IPEDS Research and Development Committee, who first identified this topic as a priority and provided valuable guidance throughout the project.
We hope this report contributes to ongoing discussions about how IPEDS and related federal data collections can evolve to reflect the presence and needs of students with disabilities in higher education more accurately.
Executive summary
The National Postsecondary Education Cooperative (NPEC) commissioned this paper to help provide background information on the feasibility of collecting more data on students with disabilities in the Integrated Postsecondary Education Data System (IPEDS). It aims to (1) provide an overview of the data currently collected on students with disabilities attending postsecondary institutions; (2) highlight gaps in data collection; (3) summarize relevant federal and state laws; (4) discuss the barriers institutions face in collecting and reporting these data; and (5) provide recommendations for potential additional data that could be collected through IPEDS to enhance understanding and support of students with disabilities in higher education.
The paper examines the rising enrollment of students with disabilities in postsecondary education, highlighting a significant increase from 11 percent in 2004 to 21 percent in 2020. The growth rate of this population underscores the need for comprehensive and reliable data about their experiences and outcomes in higher education. Despite these trends, the field lacks robust information about how students with disabilities navigate the academic landscape.
The field lacks robust information about how students with disabilities navigate the academic landscape.
The paper outlines several challenges in collecting data related to students with disabilities, including varied definitions of disability, reliance on students’ self-disclosure, and disparities in institutional data infrastructure. These complexities hinder the effectiveness of current data collection efforts and complicate the ability to generate a cohesive view of this population’s needs.
IPEDS alone cannot solve all the problems around data collection on students with disabilities because it will require actions such as standardizing definitions across government agencies and states, enhancing data collection methodologies, and prioritizing privacy. To make progress in these areas, stakeholder engagement will be key. Additionally, investing in institutional infrastructure and ongoing research will not only facilitate more effective data management but also yield insights that can drive actionable policies to support students with disabilities. These are worthwhile endeavors yet many are outside of the scope of NPEC and IPEDS’ authority.
However, NPEC and IPEDS can create a more robust framework for capturing disability data in incremental ways. To enhance the collection of data on students with disabilities within IPEDS, the report offers the following key recommendations:
- Revise the current IC Section 2, Part B, Question 9 (and Instructions) to collect more information on the number of students with disabilities while still complying with the Higher Education Opportunity Act of 2008 (HEOA).
- Add a new question to IC Section 2, Part B, to collect similar information on graduate students.
- Add two additional questions to IC Section 2, Part B, about services offered to qualified students with disabilities and include this information on the College Navigator Website.
- Move the current question about comprehensive transition and postsecondary programs from the Special Learning Opportunities question to IC Section 2, Part B, and ask for those with programs to provide student enrollment counts.
- Continue exploring avenues to have institutions report on student retention and graduation rates for students with disabilities.
- Collaborate with the Department of Education (ED) Office of Civil Rights (OCR) on possible ways the two parts of the Department–the National Center for Education Statistics (NCES) and OCR–can coordinate to collect more information on students with disabilities in postsecondary education, like the data collection OCR conducts for K12 education.
- Collaborate with the Institute of Education Science’s (IES) State Longitudinal Data Systems (SLDS) program to learn more about how states use these robust systems to provide research and reports on the educational pathways of students with disabilities through K12 and postsecondary education and into the workforce.
- Collaborate with the Association for Institutional Research (AIR) to develop training materials and resources for IR professionals about best practices in student surveys on issues related to students with disabilities and in working with offices across their institutions to provide reliable data on students with disabilities for reporting to IPEDS. Also, consider working with AIR and an organization like AHEAD, the Association on Higher Education and Disabilities, to develop a short training module for disability services offices on how they could be using data from IPEDS and the National Postsecondary Student Aid Study (NPSAS) on students with disabilities to inform their work.
Introduction
Between 2004 and 2020, the prevalence of students with disabilities in postsecondary education increased from one out of every 10 students (or 11 percent) with a mental or physical disability to one in five students (21 percent).[1] This increase is likely a combination of higher rates of diagnosis among college-aged people and more students with disabilities enrolling in college. Unfortunately, collecting data on students with disabilities is complicated, so we do not have robust information to know how much each explanation is contributing to the increase nor do we know enough about those students’ experiences once in college. Comprehensive and reliable data regarding this population would help us tease apart the contributing factors and understand students’ experiences in higher education, all with the goal to serve these students and improve their outcomes.
The approach to collecting data on this population varies widely between colleges, universities, and state agencies, making it challenging to obtain a comprehensive and consistent picture of the landscape. While several data sources exist, including some federal surveys, the reliance on self-reported data and inconsistent reporting practices complicates the development of a unified approach to tracking and supporting students with disabilities in postsecondary education.
The Integrated Postsecondary Education Data System (IPEDS) is a vital source of information about US colleges and universities and the students they serve, providing insights into enrollment, graduation rates, and institutional characteristics. However, IPEDS data collection related to students with disabilities and the services available to them are minimal. Collecting additional data on students with disabilities through IPEDS could (1) enhance the federal government’s ability to monitor and assess the educational outcomes of this population; (2) allow institutions to compare and benchmark themselves against other institutions on how well they serve these students; (3) provide researchers with important information on these students’ representation in and pathways through postsecondary education; and (4) provide current and potential students valuable insights into which institutions meet their needs. However, there are significant challenges and barriers to implementing such data collection. Institutions may face difficulties in standardizing definitions of disability and concerns regarding privacy and confidentiality when reporting sensitive information. Additionally, varying levels of institutional commitment and resources dedicated to supporting students with disabilities can lead to inconsistencies in data reporting.
The National Postsecondary Education Cooperative (NPEC) commissioned this paper to help provide background information on the feasibility of collecting more data on students with disabilities in IPEDS. It aims to (1) provide an overview of the data currently collected on students with disabilities attending postsecondary institutions; (2) highlight gaps in data collection; (3) summarize relevant federal laws; (4) discuss the barriers institutions face in collecting and reporting these data; and (5) provide recommendation for potential additional data that could be collected through IPEDS to enhance understanding and support of students with disabilities in higher education.
Research questions
- What relevant federal laws impact data collection on students with disabilities in postsecondary education?
- What are the federal government and non-government data sources regarding students with disabilities in postsecondary education, including NCES data, other US Department of Education data collections, and other federal agencies such as the National Science Foundation and the US Census?
- What are the trends in enrollment regarding students with disabilities at postsecondary institutions based on data currently available in IPEDS? What trends do we know about students with disabilities based on the analysis of data from the National Postsecondary Student Aid Study (NPSAS)?
- Are there examples of states or higher education system offices that collect and report on data for students with disabilities in postsecondary education? What types of data do they collect and report?
- What are the barriers and challenges for institutions to collect, maintain, and report data on students with disabilities?
- What additional data are needed to understand the existence of and support for students with disabilities in postsecondary education that could be collected via IPEDS?
Methodology
Three research approaches inform the answers to the research questions guiding this work: an environmental scan, interviews with IPEDS stakeholders and experts on the needs of students with disabilities, and an analysis of relevant IPEDS and NPSAS data.
Environmental scan and literature review. The environmental scan included a review of IPEDS-related background materials and a review of the literature related to data on students with disabilities in postsecondary education at national and state levels. The review of background materials included the IPEDS survey instruments, instructions, frequently asked questions (FAQ) sections, and the NPEC product, The History and Origins of Survey Items for the Integrated Postsecondary Education Data System (2022-23 Update).[2]
The literature review covered scholarly articles, papers, and other reports. Searches for terms including: “college students with disabilities,” “data on students with disabilities in postsecondary education,” “federal and state laws related to postsecondary students with disabilities,” and variations thereof in the databases Education Resources Information Center (ERIC), Google Scholar, and JSTOR provided the foundation for the review. Searches were also conducted using standard, non-academic search engines like Google and newer AI-driven tools like ChatGPT. Works cited in the studies found through these searches aided in the identification of additional materials and verification of the completeness of the scan. Peer-reviewed studies and reports from government agencies, industry associations, and non-profit organizations were considered in the review. A search for other national data collections that include data on students with disabilities in postsecondary education was also conducted, and relevant materials from any collections of interest were reviewed.
Semi-structured interviews. Seven virtual, semi-structured interviews were conducted to provide insights from IPEDS stakeholders on the research. Interviewees included diverse professionals, including leaders and researchers from higher education data offices, state commissions, academic institutions, and research and advocacy organizations. Interview questions were also posed in a discussion at one state’s higher education commission’s convening of institutional research representatives from various colleges and universities.
IPEDS and NPSAS data analysis. Data from both the IPEDS and NPSAS data collections were analyzed to provide information about trends in enrollment for students with disabilities at postsecondary institutions. IPEDS collects only minimal information on students with disabilities, so the analysis primarily focused on how the number of institutions that meet a minimum threshold requirement for reporting on these students has changed since data collection began in 2008. The National Postsecondary Student Aid Study (NPSAS), a student-based survey conducted approximately every four years by NCES, allowed for additional analysis of enrollment trends and students with disabilities between 2004 and 2020.
Findings
Relevant legislation and definitions
There are several relevant federal laws and regulations related to students with disabilities that dictate definitions of disabilities and/or require data reporting. The law most relevant to the data currently collected in IPEDS is the Higher Education Opportunity Act (HEOA) [20 U.S.C. § 1001 et seq.], which was passed into law in 2008, amending the Higher Education Act of 1965 (HEA). The HEOA requires institutions to report data on student demographics, including those with disabilities, as part of IPEDS, ensuring accountability and transparency.
Beyond HEOA, there are additional federal laws that have implications for the data currently collected on students with disabilities, especially in how these laws define disabilities. The Individuals with Disabilities Education Act (IDEA) [20 U.S.C. § 1400 et seq.] mandates the provision of free, appropriate public education (FAPE) to eligible children with disabilities. While primarily focused on K-12 education, it sets the stage for later transitions to postsecondary education, emphasizing the need for data tracking throughout the educational journey. IDEA defines a student with a disability as a child who has a disability that falls under one of 13 categories below and that said disability adversely affects their academic performance:
- Autism
- Deaf-Blindness
- Deafness
- Emotional disturbance
- Hearing impairment
- Intellectual disability
- Multiple disabilities
- Orthopedic impairment
- Other health impairment, which includes ADHD
- Specific learning disability, which includes dyslexia, dyscalculia, dysgraphia, and other learning differences
- Speech or language impairment
- Traumatic brain injury
- Visual impairment, including blindness
The IDEA definition guides how states define disability and who is eligible for special education and related services.
The Americans with Disabilities Act (ADA) [42 U.S.C. § 12101 et seq.] prohibits discrimination against individuals with disabilities in all areas of public life, including schools. It requires postsecondary institutions to track and report on accommodations and services provided to students with disabilities. The ADA defines a disability as a physical or mental impairment that significantly limits a person’s ability to perform major life activities. Major life activities are basic tasks that most people can do with little to no difficulty, such as walking, seeing, hearing, speaking, learning, breathing, and working.
Section 504 of the Rehabilitation Act of 1973 [29 U.S.C. § 794] prohibits discrimination based on disability in programs and activities receiving federal financial assistance, including higher education institutions. Institutions are required to collect and maintain data related to the provision of services to students with disabilities. Under this law, individuals with disabilities are defined as persons with a physical or mental impairment that substantially limits one or more major life activities. People who have a history of or who are regarded as having a physical or mental impairment that substantially limits one or more major life activities are also covered. Major life activities include caring for oneself, walking, seeing, hearing, speaking, breathing, working, performing manual tasks, and learning. Some examples of impairments that may substantially limit major life activities, even with the help of medication or aids/devices, are AIDS, alcoholism, blindness or visual impairment, cancer, deafness or hearing impairment, diabetes, drug addiction, heart disease, and mental illness. In addition to meeting the above criteria, qualified individuals with disabilities meet standard and essential eligibility requirements for receiving services, education, or training.
Finally, another highly relevant law for how data is reported on students, generally, is the Family Educational Rights and Privacy Act (FERPA) [20 U.S.C. § 1232g]. FERPA primarily focuses on the privacy of student educational records, including information such as their disability status. Institutions must ensure that data collection methods safeguard student privacy while providing meaningful insights. FERPA also requires institutions to maintain records of the number of students receiving services under Section 504 and the ADA, ensuring compliance with disability regulations.
Federal and Other National Data Collections with Disability Data
National Center for Education Statistics
IPEDS. Data on students with disabilities in IPEDS is limited and based on legislative requirements in the Higher Education Opportunity Act (HEOA). To protect student privacy, particularly at smaller institutions, institutions are first asked whether a minimum of three percent of undergraduate students are registered with the office of disability services (or equivalent office). Only if an institution meets that minimum reporting requirement are they then required to report the percentage of undergraduate students who are formally registered. Therefore, while NCES displays this data in the General Information section of an institution’s profile on College Navigator, it has minimal usefulness for analytic and research purposes, including trend analysis. These data were primarily added to the IPEDS data collection to provide consumer information to students and their parents, which is crucial but limited in its utility.
In the 2020 revision to the Classification of Instructional Programs (CIP),[3] which is used in IPEDS for reporting completions data, added a new code, 30.0001, to capture the number of certificates and degrees awarded by institutions to students in comprehensive transition and postsecondary (CTP) programs. CTP programs are recognized by Federal Student Aid (FSA) within the US Department of Education because students in them may receive funding from the Federal Pell Grant, Federal Supplemental Educational Opportunity Grant, and Federal Work-Study programs. To receive federal student aid, students in CTP programs must meet the basic federal student aid eligibility requirements, “except that they are not required to have a high school diploma or GED and are not required to be pursuing a degree or certificate.”[4] The 2020 CIP defines a CTP program as one “that provides students with intellectual disabilities with academic enrichment, socialization, independent living skills, self-advocacy skills, and integrated work experiences and career skills that lead to gainful employment.”[5] Therefore, IPEDS has data reported by institutions in the Completions component on the numbers of certificates and awards, including details on the level of award as well as gender and race/ethnicity of recipients, beginning with degrees and certificates awarded in 2020-21, when the 2020 CIP was implemented in the IPEDS Completions component data collection.
In 2022-23, NCES also added an option for institutions to report whether they offer a CTP program as a special learning opportunity in the Institutional Characteristics component. More details on the data captured in IPEDS for disabilities are provided on the following page.
IPEDS Current Survey Elements on Students with Disabilities, 2024-5
The current three related survey items, collected within the Institutions Characteristics (IC) survey component, are:
- The percentage of undergraduate students who are formally registered with the institution’s Office of Disability Services using the following question format:
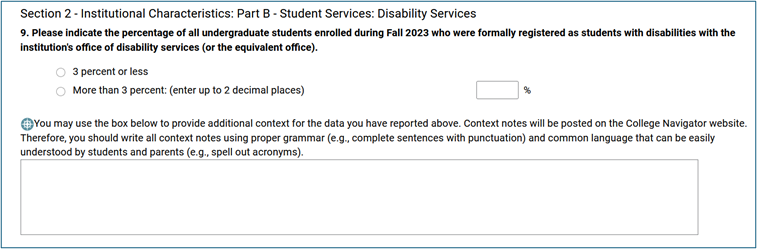
The accompanying instructions for answering this question read: “Please indicate the percentage of all undergraduate students enrolled during the period indicated who were formally registered as students with disabilities with the institution’s office of disability services (or the equivalent office), including students with physical or learning disabilities, as well as other types of disabilities. If greater than three percent of students are registered as having a disability, you will need to indicate a percentage (up to two decimal places).
Please use the context box on the page to provide information, such as the webpage for your disability services website.”*
NCES displays these data on the College Navigator website as part of each institution’s General Information section, as HEOA requires.
- A checkbox to indicate whether, as a special learning opportunity, the institution offers a comprehensive transition and postsecondary program for students with intellectual disabilities (added in 2022-23).
According to the IPEDS Glossary, a comprehensive transition and postsecondary program for students with intellectual disabilities is defined as: “A degree, certificate, nondegree, or noncertificate program designed to support and provide students with intellectual disabilities with opportunities to participate in coursework and other activities with students without disabilities while obtaining academic training and independent living instruction at an institution of higher education to prepare for gainful employment. (For more information, see 34 CFR 668.231).”
- Institution’s website for disability services
- Completions (awards) in comprehensive transition and postsecondary programs for students with intellectual disabilities (CIP 30.0001) by level of award, first or second major, and disaggregated by student gender and race/ethnicity of award recipients (added in 2020-21 with implementation of 2020 CIP code).
*“IPEDS 2024-25 survey materials, institutional characteristics component,” National Center for Education Statistics, 2024, http://surveys.nces.ed.gov/ipeds/public/survey-materials/index.
NPSAS (and related longitudinal surveys). NPSAS is a nationally representative cross-sectional study of undergraduate and graduate students enrolled in postsecondary education conducted every three to four years since 1987. The study examines the characteristics of students in postsecondary education, with a special focus on how they finance their education. The study connects multiple data sources, including student surveys, institution records, government databases, and other administrative sources.[6]
NPSAS collects the following information related to disabilities from students:[7]
- Disability status
- Use of services for students with disabilities (yes/no)
- Importance of services for students with disabilities in the decision to stay in school (Not at All Important, Somewhat Important, Important, Very Important)
- Questions to better understand the educational services available for people with disabilities:
- Are you deaf, or do you have serious difficulty hearing? (yes/no)
- Are you blind, or do you have serious difficulty seeing even when wearing glasses? (yes/no)
- Because of a physical, mental, or emotional condition, do you have serious difficulty concentrating, remembering, or making decisions? (yes/no)
- Do you have serious difficulty walking or climbing stairs? (yes/no)
- What is the main type of condition or impairment you have?
- Hearing impairment (for example, deaf or hard of hearing)
- Blindness or visual impairment that cannot be corrected by wearing glasses
- Speech or language impairment
- Orthopedic or mobility impairment
- Specific learning disability or dyslexia
- Attention deficit disorder (ADD)
- Health impairment or problem
- Mental, emotional, or psychiatric condition
- Depression
- Developmental disability
- Brain injury
- Other
These same survey questions are included in the Beginning Postsecondary Students (BPS) and Baccalaureate & Beyond (B&B) longitudinal studies, allowing for research on the persistence and graduation of beginning full-time students with disabilities using BPS and following students with disabilities graduating with a bachelor’s degree for up to 10 years using B&B.
US Department of Education (ED)
In addition to NCES data collection efforts on students with disabilities in postsecondary education, other parts of the Department of Education are interested in these students because they administer programs that serve them. For example, Federal Student Aid manages Pell Grants and other aid that are available to students in Comprehensive Transition and Postsecondary (CTP) programs that allow for students with intellectual disabilities to be dually enrolled in high school and college level courses and receive Pell Grants, Federal Supplemental Educational Opportunity Grants (FSEOG), and work-study. FSA maintains a list of colleges and universities that offer CTP at https://studentaid.gov/understand-aid/eligibility/requirements/intellectual-disabilities.
In addition, the Office of Postsecondary Education (OPE) oversees the Student Support Service (SSS) discretionary grant program, one of eight TRIO grant programs promoting achievement in postsecondary education among disadvantaged students. The SSS program provides grants to institutions of higher education, and part of the program design for SSS is “to foster an institutional climate supportive of students with disabilities.[8] While OPE produces annual performance reports on the program, the Government Accountability Office (GAO) noted in a 2023 report that the “Department of Education collects information about whether SSS participants meet one of several possible eligibility criteria but does not collect data on the disability status of each SSS participant. In addition, Education periodically reports on the performance of SSS but does not include performance information for participants with disabilities.” GAO recommended that ED begin collecting “each participant’s disability status and use this information to report on program performance for participants with disabilities.”[9] ED agreed with this recommendation and, as of April 2024, was pursuing permission to add that data element to their data collection, likely beginning in 2026.
Another program through which students with disabilities data are collected by ED is the Perkins Collaborative Resource Network, part of the Office of Career, Technical, and Adult Education (OCTAE), Division of Academic and Technical Education (DATE). Under the Carl D. Perkins Career and Technical Education Act of 2006, as amended by the Strengthening Career and Technical Education for the 21st Century Act (Perkins V), states submit Perkins V State plans and Consolidated Annual Reports (CARs) that include enrollment, retention, skill attainment, and placement data for students with disabilities, as defined by the ADA, who are enrolled in career and technical education programs at the secondary and postsecondary education levels. For secondary students, the ESEA/IDEA definition of a student with disabilities is used while for postsecondary students, the ADA definition is used. ED’s Perkins State Plans and Data Explorer is designed to provide career and technical education (CTE) practitioners, researchers, and stakeholders, with ready access to information and data submitted by states on their CTE programs.[10]
Finally, since 1968, the ED Office of Civil Rights (OCR) has collected civil rights data on students’ access and barriers to educational opportunities from early childhood through grade 12. OCR collects these data from all public schools and districts, as well as long-term secure justice facilities, charter schools, alternative schools, and special education schools that focus primarily on serving the educational needs of students with disabilities under IDEA or Section 504 of the Rehabilitation Act. Unfortunately, OCR does not currently collect data on disabilities in postsecondary settings. However, IPEDS has a history of collaborating with OCR for data on race/ethnicity for postsecondary students, possibly providing an avenue for working together to collect this information.
National Science Foundation (NSF)
National Survey of College Graduates (NSCG). The NSCG is a biennial survey that provides data on the characteristics of the nation’s college graduates, focusing on those in the science and engineering workforce. The survey is sponsored by the National Center for Science and Engineering Statistics (NCSES) within NSF to provide data on the characteristics of the nation’s college graduates, focusing on those in the science and engineering workforce. It samples individuals living in the United States during the survey reference week, having at least a bachelor’s degree, and younger than 76. By surveying college graduates in all academic disciplines, the NSCG provides data that helps understand the relationship between college education and career opportunities and between degree fields and occupations.[11] The disability status of college graduates is included in the data collection.[12]
Survey of Earned Doctorates (SED). The SED is an annual census conducted since 1957 of all individuals receiving a research doctorate from an accredited US institution in a given academic year. The SED is sponsored by NCSES within the National Science Foundation (NSF) and three other federal agencies. The SED collects information on the doctoral recipient’s educational history, demographic characteristics, and postgraduate plans. Results are used to assess the characteristics of the doctoral population and trends in doctoral education and degrees. Doctorate recipients in the survey could report more than one disability. The survey asks the degree of difficulty—none, slight, moderate, severe, or unable to do—an individual has in seeing (with glasses), hearing (with a hearing aid), walking without assistance, lifting 10 pounds, or concentrating, remembering, or making decisions. Those respondents who answered “moderate,” “severe,” or “unable to do” for any activity were classified as having a disability.[13] In 2021, 11.3 percent of doctorate recipients were classified as having a disability under this definition.[14]
US Census Bureau
The Census Bureau collects data on disability primarily through the American Community Survey (ACS), the Survey of Income and Program Participation (SIPP), and the Current Population Survey (CPS). All three surveys ask about six disability types: hearing difficulty, vision difficulty, cognitive difficulty, ambulatory difficulty, self-care difficulty, and independent living difficulty. Respondents who report any of the six disability types are considered to have a disability.
Each survey has unique advantages. The ACS can estimate disability for smaller subgroups of the population. The CPS Annual Social and Economic Supplement (CPS ASEC) has additional questions on work disability. The Social Security Administration Supplement to the SIPP has information on other types of disability.[15]
Non-governmental national data collection on students with disabilities in higher education
Cooperative Institutional Research Program Freshman Survey (CIRP) Freshman Survey. The CIRP Freshman Survey is a voluntary national survey in which higher education institutions can participate. It is administered by the Higher Education Research Institute at the University of California Los Angeles and is designed to survey incoming first-year students before they start classes at an institution. The instrument collects extensive information that allows for a snapshot of what incoming students are like before they experience college. Key sections of the survey examine established behaviors in high school, academic preparedness, admissions decisions, expectations of college, interactions with peers and faculty, student values and goals, student demographic characteristics, and concerns about financing college. Many items on the CIRP Freshman Survey are pre-test questions then post-tested on CIRP follow-up, providing a longitudinal examination of cognitive and affective growth during college.[16] The following disabilities or medical conditions: learning disability, attention deficit hyperactivity disorder, autism spectrum disorder, physical disability, chronic illness, psychological disorder, or other.[17] HERI’s CIRP data are available to external researchers, for a fee, through a research proposal and data request process.[18]
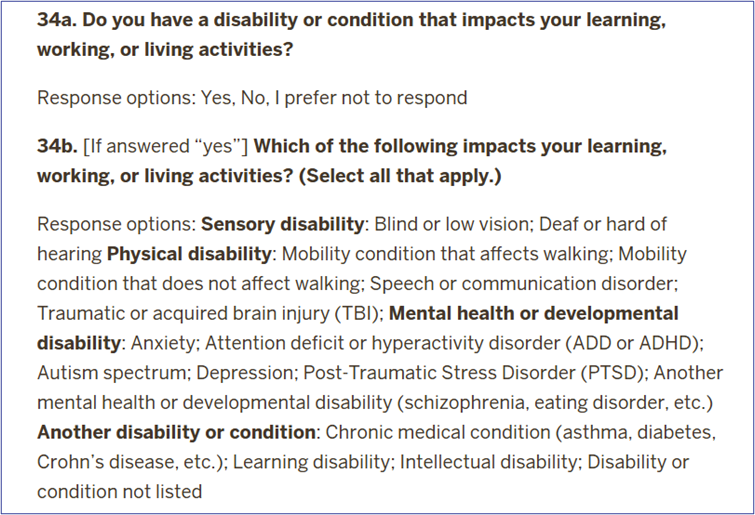
National Survey of Student Engagement (NSSE). Through its student survey, The College Student Report, NSSE annually collects information at hundreds of four-year colleges and universities about first-year and senior students’ participation in programs and activities that institutions provide for their learning and personal development. The results estimate how undergraduates spend their time and what they gain from attending college. Survey items on The College Student Report represent empirically confirmed “good practices” in undergraduate education. That is, they reflect behaviors by students and institutions associated with the desired outcomes of college. NSSE does not assess student learning directly, but survey results point to areas where colleges and universities perform well and aspects of the undergraduate experience that could be improved.[19] The survey includes demographic questions asking about diagnoses of a disability or impairment and specific type, including the following options: sensory impairment, mobility impairment, learning disability, mental health disorder, or other.[20] Questions 34a and 34b, excerpted from the NSSE 2025 US English Version survey instrument, are included below.[21]
Community College Survey of Student Engagement (CCSSE). CCSSE was established by the University of Texas’ College of Education in 2001 and collects information on student engagement, similar to NSSE, but is tailored for students attending community colleges.[22] CCSSE data on students with disabilities traditionally has focused on the frequency of students’ use of available services.
Interestingly, a 2024 research study compared IPEDS and CCSSE data “to demonstrate how triangulating responses from [CCSSE] with information from [IPEDS] exposes data incongruency, specifically when considering the population of students with disabilities at 2-year institutions.”[23] Among the 503 community colleges examined, only 203 reported the requested figure to IPEDS—the share of undergraduates officially registered with disabilities when that share exceeds 3 percent. The remaining 300 colleges left this field blank. Yet their own CCSSE survey results tell a different story: 251 of those 300 colleges had at least 4 percent of respondents who said they used disability services two or more times in the past year, and 71 colleges had usage rates of 8 percent or higher—more than double the threshold that should have prompted them to report their registration numbers.[24] These findings highlight the possibility of the underreporting of students with disabilities enrollments in IPEDS, an issue that will be discussed further in the section of this paper on “Challenges to Students with Disabilities Data Collection: Insights from Interviews with Key Stakeholders.”
Notably, beginning with CCSSE 2025, participating colleges will receive a “15-item set focused about campus accessibility” including questions on “student services and “institutional culture around disabilities.”[25] A description of the list of items for CCSSE is included as Appendix A.
An analysis of current IPEDS, Perkins V, and NPSAS data on postsecondary students with disabilities
As noted above, it is challenging to study enrollment trends for students with disabilities using data currently reported by institutions in IPEDS. However, some insights can be gained that might inform how data could be improved in the future, as an increasing number of students are registering with their institutions’ offices of disability services, depending on the institutional sector.
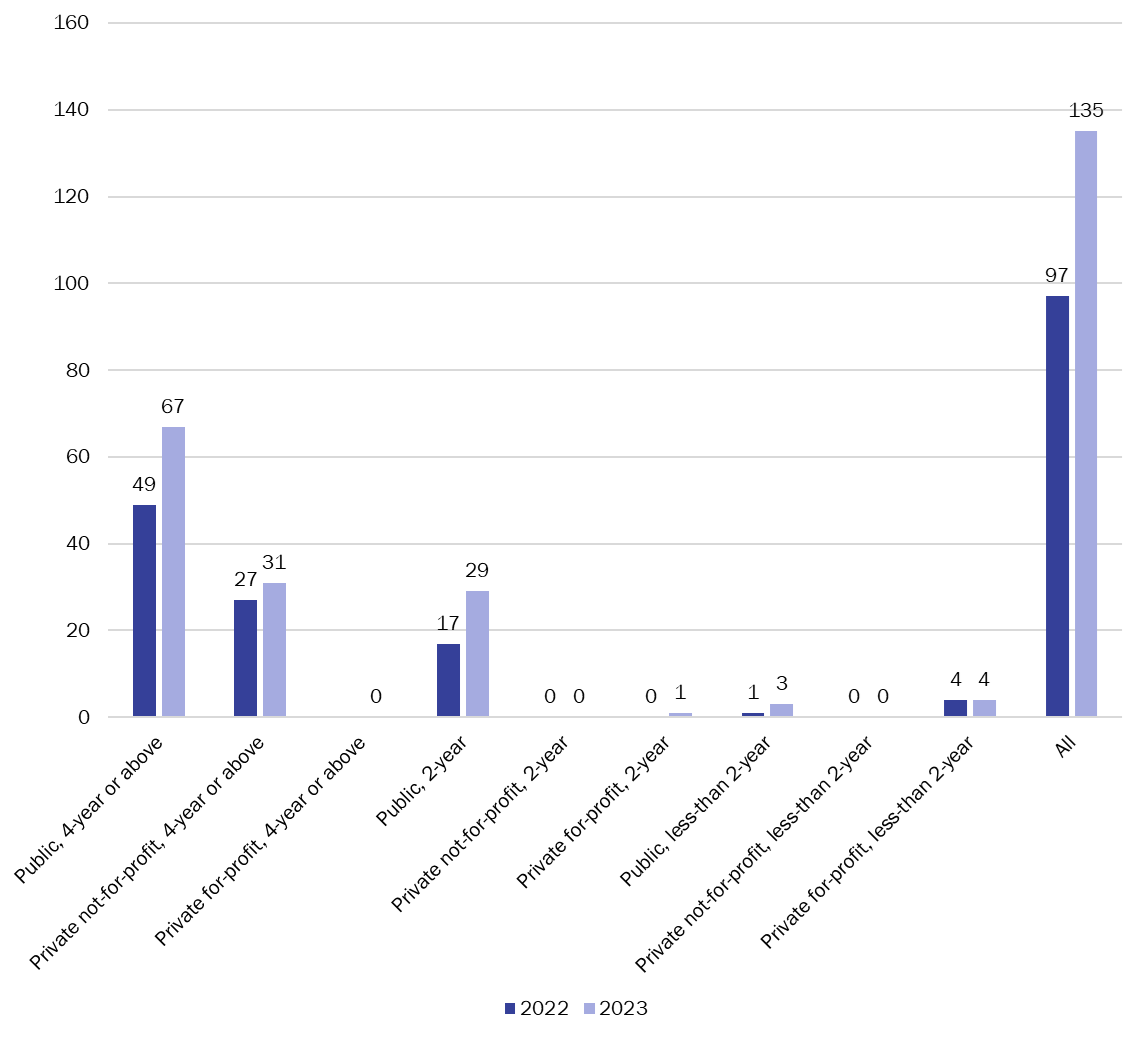
As shown in figures 1 and 2, reporting on students with disabilities differs vastly by the sector of institutions. Since Congress added the reporting requirement under the HEOA in 2008, the percentage of institutions that meet the minimal requirement of 3 percent of undergraduate students being formally registered with their institutions’ offices of disability services has increased across nearly all sectors,[26] particularly among four-year public and private not-for-profit institutions and two-year public institutions. For example, 22 percent of public four-year institutions met the reporting threshold in 2008 compared to 64 percent in 2023. Notably, these institutions, particularly the public ones, tend to be larger in overall enrollment size than institutions in the other sectors. Therefore, institutions in these sectors may be in a better position to report, for example, student enrollment counts of students with disabilities (rather than percentages) without risking disclosing confidential information on students that can arise when dealing with small cell sizes. NPEC and the IPEDS Technical Review Panel could explore whether requirements for reporting additional data on students with disabilities can be limited to institutions in particular sectors or that meet specific enrollment requirements overall.
Figure 3 provides insights into the number of institutions that offer CTP programs for students at postsecondary institutions by sector and how that number has increased over the first two years that IPEDS collected information about their availability. However, IPEDS does not collect information about how many students are enrolled in the CTP programs nor whether they receive federal student aid.
Figure 4 shows the very few reported completions of awards in CTP programs since IPEDS implemented the CIP 2020, which added a new six-digit CIP code (30.0001) for CTP awards.
Figure 1. Percentage of IPEDS Institutions within Each Sector Meeting Minimum Threshold (3 percent) for Reporting More Detailed Students with Disabilities Data, Selected Years
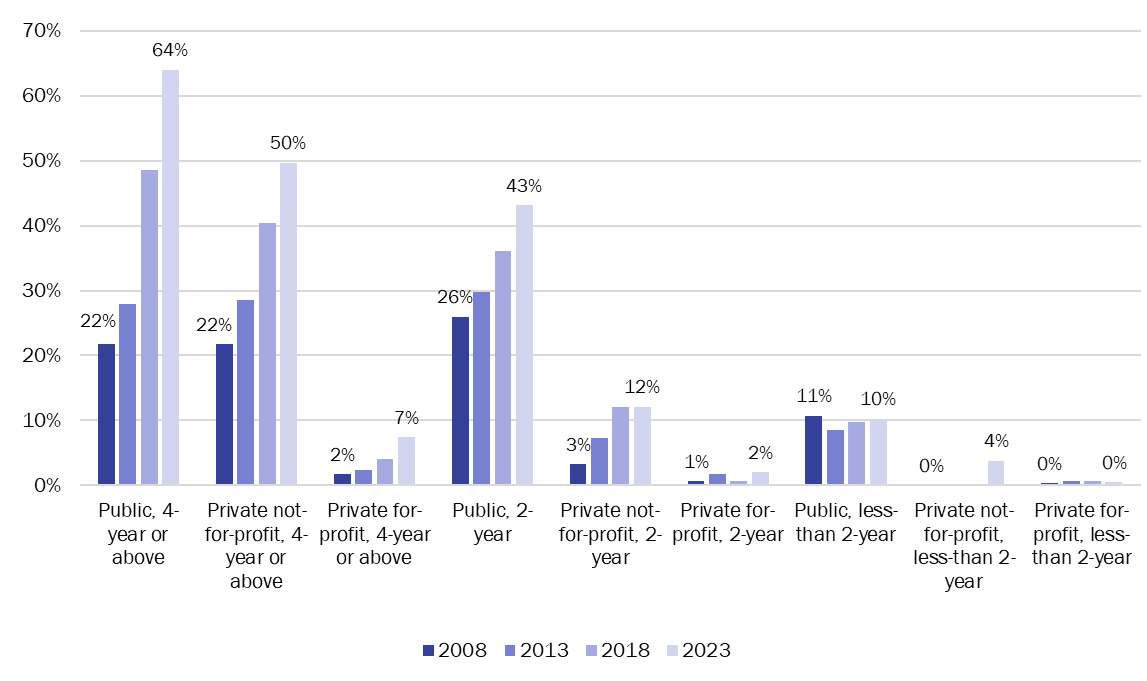
Source: US Department of Education, National Center for Education Statistics, Integrated Postsecondary Education Data System (IPEDS), 2023, Institutional Characteristics. Retrieved from http://nces.ed.gov/ipeds/usethedata on December 15, 2024. Analysis by authors. The reported n indicates the number of institutions within each sector that met the minimum 3 percent threshold to report a percentage of undergraduate students formally registered with the disability services office. Note: Analysis uses the 2023 universe of institutions as a base panel for calculations for all years.
Figure 2. Range (Minimum and Maximum) and Median Values for Percentage of Undergraduate Students with Disabilities Reported by Institutions Meeting Reporting Threshold, by Sector, 2023
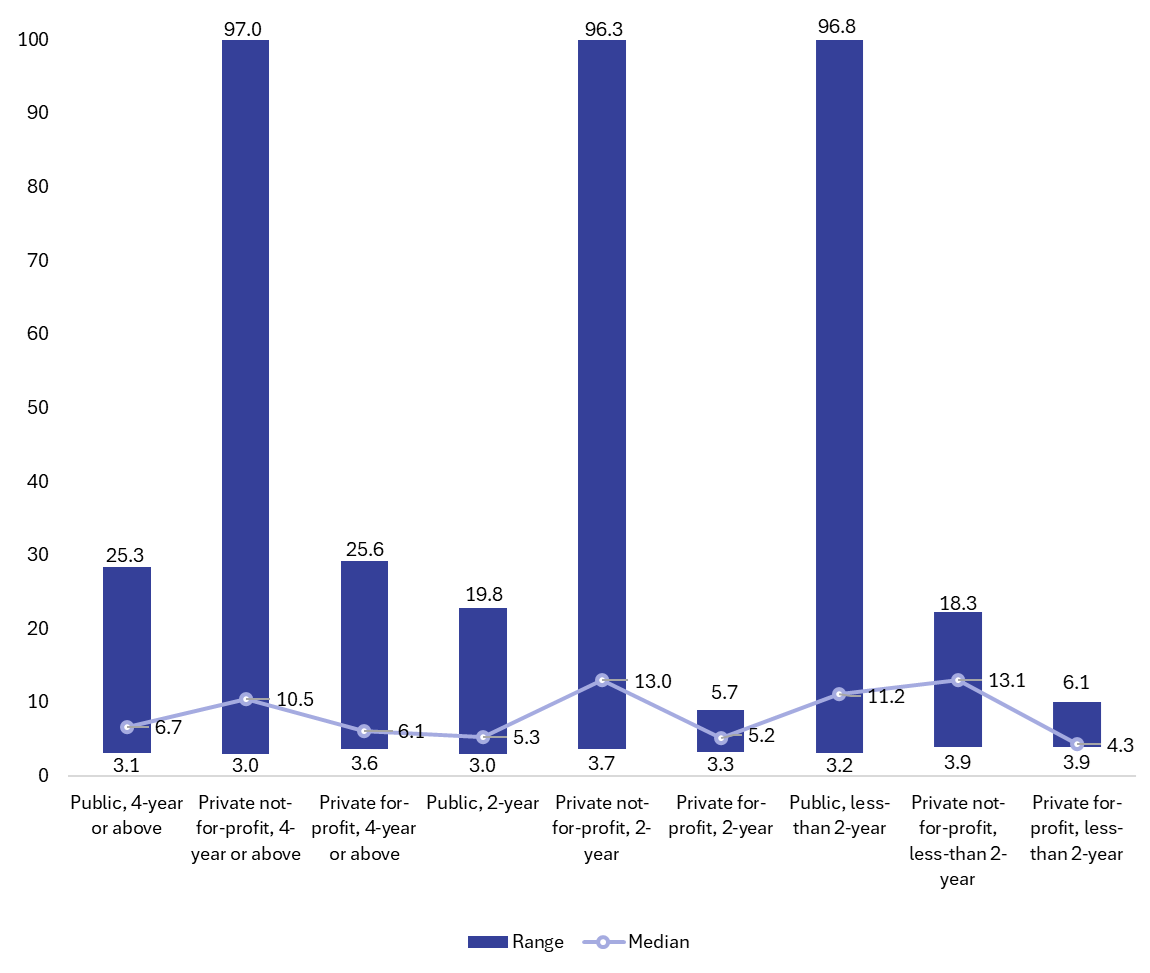
Source: US Department of Education, National Center for Education Statistics, Integrated Postsecondary Education Data System (IPEDS), 2023, Institutional Characteristics. Retrieved from http://nces.ed.gov/ipeds/usethedata on December 15, 2024. Analysis by authors. The reported n indicates the number of institutions within each sector that met the minimum 3 percent threshold to report an actual percentage of undergraduate students formally registered with the disability services office.
Figure 3. Number of Institutions Reporting Offering a Comprehensive Transition and Postsecondary Program for Students with Intellectual Disabilities, by Sector, 2022-23
Source: US Department of Education, National Center for Education Statistics, Integrated Postsecondary Education Data System (IPEDS), 2023, Institutional Characteristics, Retrieved from http://nces.ed.gov/ipeds/usethedata on December 15, 2024. Analysis by authors. Note: Analysis uses the 2023 universe of institutions as a base panel for calculations for all years.
Figure 4. Number of Awards Reported to IPEDS in CTP Programs (CIP 30.0001) by Type of Award, 2020-21 to 2022-23
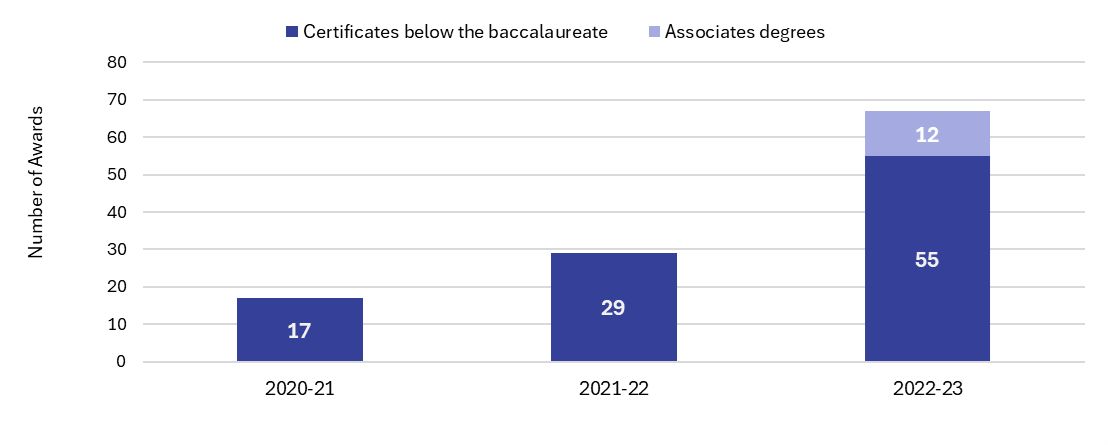
Source: US Department of Education, National Center for Education Statistics, Integrated Postsecondary Education Data System (IPEDS), 2021-2023, Completions, Retrieved from http://nces.ed.gov/ipeds/usethedata on December 15, 2024. Analysis by authors. Note: Analysis uses the 2023 universe of institutions as a base panel for calculations for all years.
As mentioned in the previous section, ED also captures data on students with disabilities enrolled in CTE programs at postsecondary institutions via Consolidated Annual Reports (CAR). States report data based on their definitions of CTE participant and CTE concentrator. When completing the CAR enrollment and accountability forms, a state must use its definitions for a CTE participant and CTE concentrator at the secondary and postsecondary levels. Figure 5 below shows the count of postsecondary student participants and concentrators in CTE programs and Figure 6 shows how those participants and concentrators break out by career clusters.
Figure 5. Counts of Students with Disabilities of Enrolled as Postsecondary CTE Participants and Concentrators, 2019-20 to 2022-23
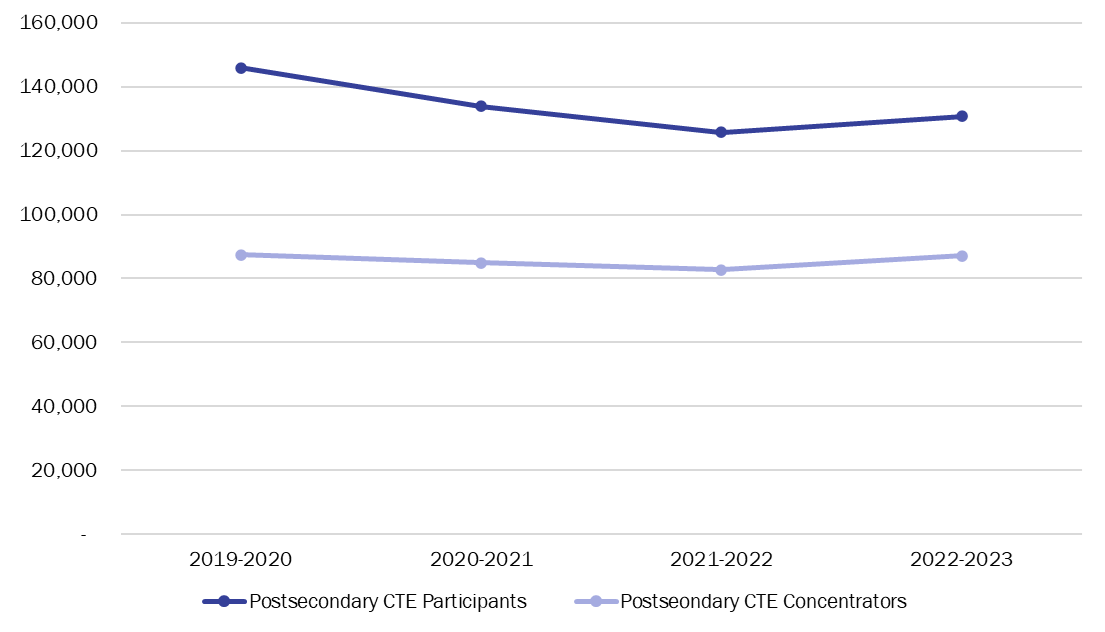
Source: US Department of Education, Office of Career, Technical, and Adult Education, Consolidated Annual Report (CAR), 2019-20 to 2022-23. Retrieved from https://cte.ed.gov/pcrn/explorer/enrollment/perkins-v on 1/22/2025. Notes: States report data based on their definitions of CTE participant and CTE concentrator. A “CTE Participant” means an individual who completes not less than one course in a career and technical education program or program of study of an eligible recipient. (Section 3(13) of Perkins V). A “CTE Concentrator” at the postsecondary level means a student enrolled in an eligible recipient who has— (i) earned at least 12 credits within a career and technical education program or program of study; or (ii) completed such a program if the program encompasses fewer than 12 credits or the equivalent in total. (Section 3(12) of Perkins V) This means that once a student completes two courses in a single CTE program of study, they are counted as a CTE concentrator.
Figure 6. Postsecondary CTE Enrollment of Students with Disabilities by Enrollment Type and Career Clusters, 2022-23
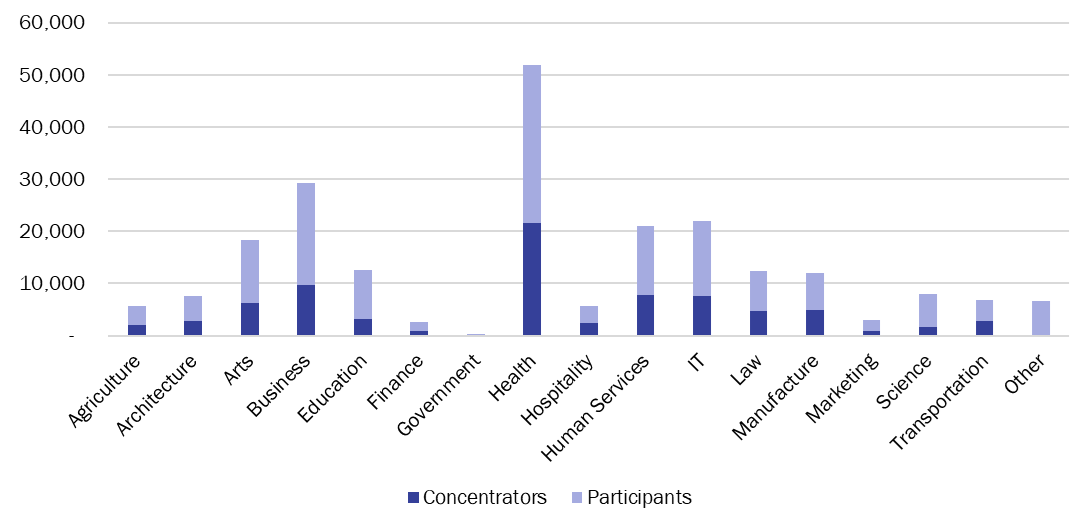
Source: US Department of Education, Office of Career, Technical, and Adult Education, Consolidated Annual Report (CAR), 2022-23. Retrieved from https://cte.ed.gov/pcrn/explorer/enrollment/perkins-v on 1/22/2025. Notes: States report data based on their definitions of CTE participant and CTE concentrator. A “CTE Participant” means an individual who completes not less than one course in a career and technical education program or program of study of an eligible recipient. (Section 3(13) of Perkins V). A “CTE Concentrator” at the postsecondary level means a student enrolled in an eligible recipient who has— (i) earned at least 12 credits within a career and technical education program or program of study; or (ii) completed such a program if the program encompasses fewer than 12 credits or the equivalent in total. (Section 3(12) of Perkins V) This means that once a student completes two courses in a single CTE program of study, they are counted as a CTE concentrator.
An analysis of NPSAS data provides more insights into enrollment trends for students with disabilities, the types of disabilities students report, and the services they use at their institutions to support them. According to GAO estimates using NPSAS data, the number of students with disabilities in postsecondary education has increased from 2.3 million in 2004 to 3.5 million in 2020 (see Figure 7).[27]
Figure 7. Estimated Number of College Students Disability Status, 2004-2020
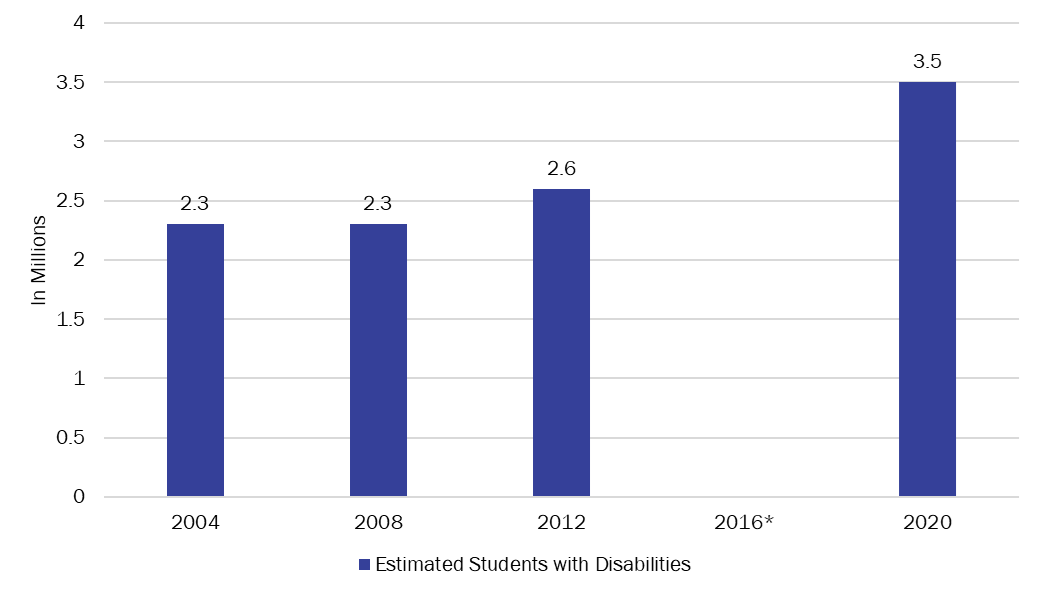
Source: Adapted from Government Accountability Office (2024), GAO-24-105614, Figure 2, pg. 8. Notes: “College Students” includes undergraduates from postsecondary institutions of all types. The figure excludes 2016 data because NPSAS changed the definition of disability for that year only and reverted to the prior definition in 2020. Estimates of the number of students are within an 8 percent margin of error.
GAO also used NPSAS data to examine the types of disabilities students report. According to their analysis, the largest increase in students with disabilities has been those with behavioral and emotional health disabilities. (See Figure 8, excerpted from the GAO report.)[28]
Figure 8. Estimated Number of College Students with Disabilities by Main Type of Disability, 2004-2020
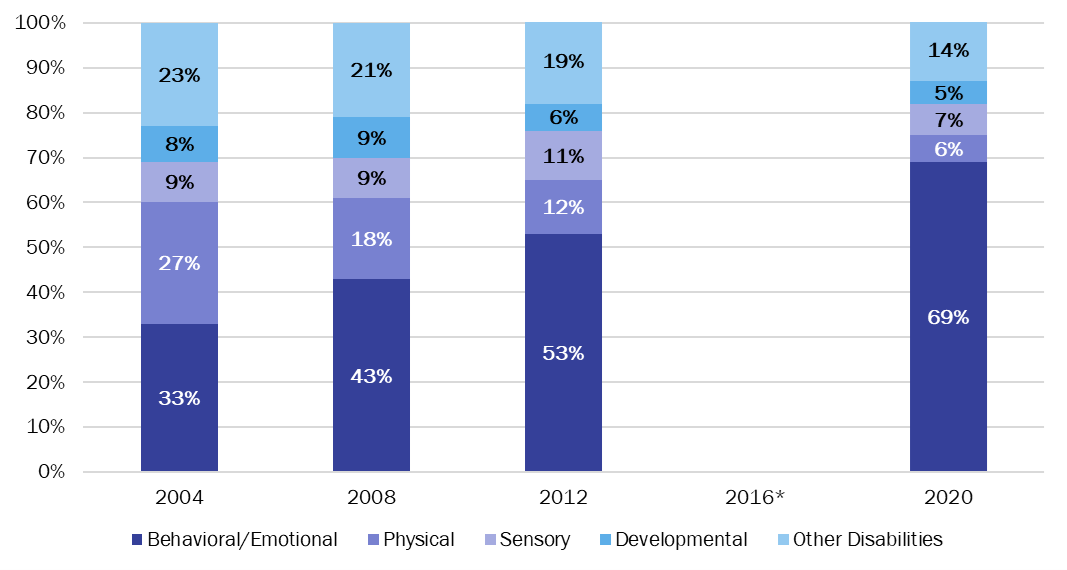
Source: Adapted from Government Accountability Office (2024), GAO-24-105614, Figure 3, pg. 9. Note: “College students” includes undergraduates from postsecondary institutions of all types (e.g., four-year, two-year, and less than two-year). The figure excludes 2016 data because NPSAS changed the definition of disability for only that year and reverted to the prior definition in 2020. The disability types are for an individual’s main condition, so a student with multiple disabilities is counted once. “Physical” includes speech or language, orthopedic or mobility, and brain injury impairments. “Developmental” includes specific learning disabilities, dyslexia, and developmental disabilities. “Behavioral/Emotional” includes attention deficit disorder; mental, emotional, and psychiatric conditions; and depression. “Sensory” includes hearing and visual impairments. “Other disabilities” includes other health impairments or problems. All percentage estimates are within 2 percent margin of error, and all estimates of the number of students are within a 15 percent margin of error.
In the same report, GAO used NPSAS data to look at the enrollment patterns of students with disabilities by sector as well as full-time and part-time attendance. Students with and without disabilities were similar in the schools they attended—public versus private schools and four-year versus two-year schools (see Figure 9). They also found that students with and without disabilities had similar attendance patterns (e.g., full-time versus part-time).[29]
Figure 9: Estimated Percentage of College Students by Disability Status and Institution Type, 2020
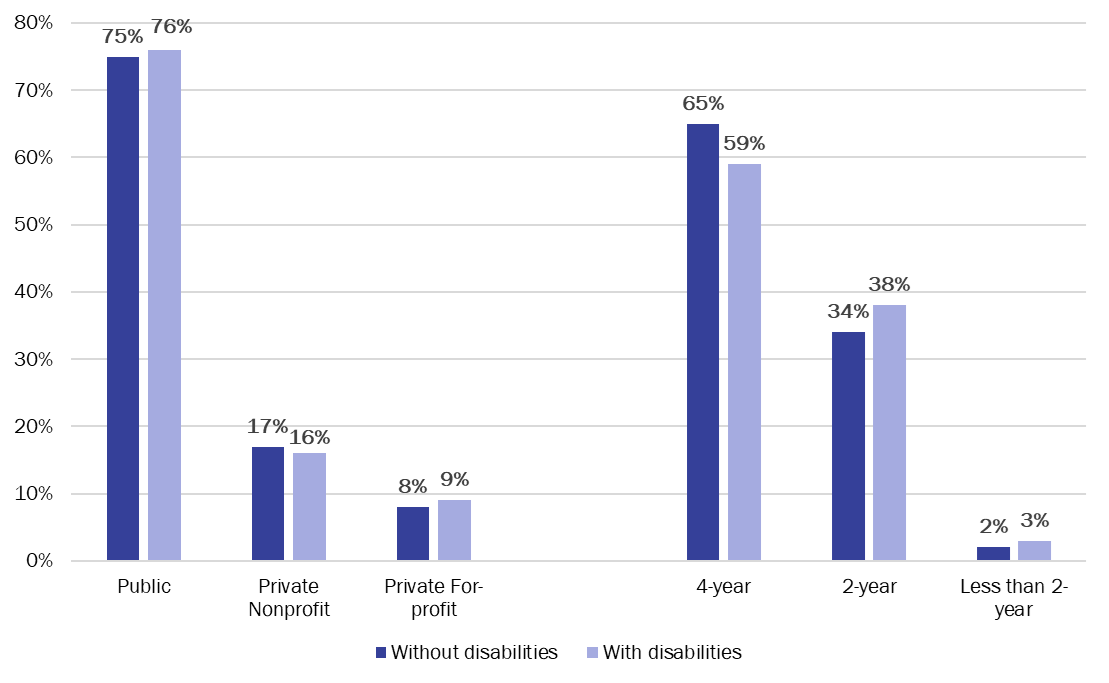
Source: Adapted from Government Accountability Office (2024), GAO-24-105614, Figure 5, pg. 12. Note: “College students” includes undergraduates from postsecondary institutions of all types. All estimates are within a 7 percent margin of error.
Research on students with disabilities using IPEDS data
While, as noted above, the utility of the current format for reporting data to IPEDS on students with disabilities is limited for research and analytic purposes, some analysts have used the data to study topics related to students with disabilities. For example, in as early as 2011, Borgemenke, Hinojosa, and Holt used IPEDS data to analyze the percentages of formally registered disabled students in public and proprietary two-year degree granting institutions in US large city urbanized areas. Similarly, Charran, Bicak, and Taylor used available IPEDS data to identify which Texas postsecondary institutions had enrolled students with disabilities over five years (2013-2017), to inform Texas education policies that support greater postsecondary access for this population.[30] They found that institutions of lower research intensity and private non-profit postsecondary institutions in Texas have enrolled more significant percentages of students with disabilities. Using IPEDS finance data, they also found that instructional expenses and institutional grant aid positively predicted enrollment from 2013 to 2017. In a more recent 2024 study, Taylor and Bicak used five years of IPEDS data to identify the enrollment patterns of students with disabilities.[31] Their analysis suggested that in Texas, urban, public, and bachelor’s-level institutions have enrolled more students with disabilities than other institution types over time, and that nationally, the enrollment of students with disabilities in postsecondary institutions, as captured in the IPEDS data, has steadily increased since 2013.
Examples of reports and research studies on students with disabilities using state- or system-level data
In the absence of robust data on postsecondary students with disabilities collected by IPEDS, some states or higher education systems have their own means for analyzing trends or reporting on this population of students. Some collect data on these students to meet state legislatively mandated reporting requirements. At the same time, Texas, for example, has utilized its longitudinal data system that links K12 and postsecondary education data to provide student-level information to researchers that allows for studying students’ enrollment and persistence patterns over time. Table 1 on the following pages provides a summary list of reports and research that were identified during the literature review process that utilize data generated at the state or system level to report on students with disabilities in higher education.[32]
Table 1: Summary Table of Reports or Research Using Data Collected by States
| State | Agency Responsible | Report | Description | Data Included | Source |
|---|---|---|---|---|---|
| California | California Community Colleges, Chancellor’s Office | Disabled Student Programs and Services | A report required under California Education Code section 67312(b) that requires the Board of Governors of the California Community Colleges to report to the governor and Legislature on its system for evaluating “state-funded programs and services for disabled students on each campus at least every five years.” The report includes information on the four elements mandated by legislation: (1) staff and student perception of program effectiveness, (2) data on the implementation of the program, (3) physical accessibility requirements, and (4) outcome data. | Enrollment, retention, transition, and graduation rates of community college students receiving services through the Disabled Student Programs and Services (DSPS) compared to non-DSPS students. | https://www.cccco.edu/-/media/CCCCO-Website/docs/report/2024-disabled-student-programs-and-service-legislative-report-a11y.pdf?la=en&hash=7F37AD8FB7A149D25E39B1B46C92626ED0D1CABE |
| Florida | Florida Department of Education | Summary Students with Disabilities: Services & Expenditures for Students with Disabilities | This annual data report from the Florida Department of Education provides detailed, institution-level data on expenditures spent on services for students with disabilities. for the 28 Florida College System member. | Expenditure data for: disability services personnel; Learning disability resource specialists/psychologists; direct student services (interpreters, note takers, readers, etc.); products and devices (e.g., adaptive equipment and device, software, alternative textbooks, adaptive furniture); and other direct expenses. | https://www.fldoe.org/file/19874/2324SSDR.pdf |
| Maryland | Maryland Higher Education Commission | Students with Disabilities at Maryland Colleges and Universities | This annual report provides information regarding registered students with disability services at Maryland colleges and universities. To better understand higher education outcomes for students with disabilities in Maryland, the Maryland Higher Education Commission (MHEC), in collaboration with the Maryland Department of Disabilities and in partnership with the state’s higher education institutions, created a survey administered to colleges and universities to collect these data in aggregate form. | The number of undergraduate and graduate students registered as students with disabilities with disability services, retention and graduation rates for undergraduates with disabilities, and degree progress for the students with disabilities at community colleges. | https://files.eric.ed.gov/fulltext/ED574980.pdf |
| New York | New York State Education Department | NY State Higher Education – Students with Disabilities Report | This annual report provided data on students with disabilities as well as staffing data for offices of disability/accessibility services. Data are provided at the individual institution level and aggregated to the County and State levels. County data is an aggregate of the institutions that reside in that county. State data is an aggregate of all institutions. For the County and State aggregations, data are further aggregated by Public or Private institutions, Sector (SUNY, CUNY, Independent, and Proprietary), and 2-year or 4-year/Grad institutions. The reporting period for this data is the academic year. | Student data: Counts of students (undergraduate and graduate, as well as full-time and part-time) who self-identified as a student with one or more disabilities and took one or more courses that carried credit. Staffing data: Unduplicated total number of staff and their 12-month full-time equivalents (FTEs, with full-time as defined by the institution) including all full-time and part-time staff who work in the Disability/Accessibility Services Office. |
https://data.nysed.gov/highered-swd.php?year=2023&state=yes |
| Texas | Regional Educational Laboratory Southwest | College Enrollment and Completion among Texas High School Graduates with a Disability | This research study, published by IES, uses student-level high school data from the Texas Education Agency and postsecondary data from the Texas Higher Education Coordinating Board, available at the Texas Education Research Center, to examine college enrollment and completion among four statewide cohorts of Texas public high school graduates (2006/07 through 2009/10) by disability status in high school, type of disability, and other student characteristics. | Data included students’ high school of enrollment, special education status, demographic characteristics, primary disability type, and high school graduation record for all members of the graduating cohorts examined in the study (2006/07 through 2009/10). Postsecondary data included records from all public two-year colleges and all public and private nonprofit four-year colleges in Texas for 2007/08 through 2017/18. | https://ies.ed.gov/pubsearch/pubsinfo.asp?pubid=REL2021043 |
Challenges to students with disabilities data collection: insights from interviews with key stakeholders
Collecting reliable data on students with disabilities presents challenges that hinders the ability to gather comprehensive and meaningful information. Interviewees cited a few distinct challenges, including inconsistent definitions of disability across federal laws, reliance on medical rather than social disability models, and students’ limited awareness of campus disability services. Privacy concerns and a lack of infrastructure within institutional research departments further complicate comprehensive data collection. As a result, institutions often struggle to fully understand and support the experiences of students with disabilities, highlighting the need for more consistent and integrated approaches.
The K-12/postsecondary education data gap
In the K-12 sector, a student with disabilities is offered services under the Individuals with Disability Education Act (IDEA) until the age of 21 or graduation. IDEA mandates that eligible students receive special education services. However, once these students transition to postsecondary education, these supports shift under Section 504 of the Rehabilitation Act and the Americans with Disabilities Act (ADA), requiring students to self-disclose their disabilities to access needed accommodations. Hybrid special education and postsecondary programs function similarly to dual enrollment, called “college-based transition services,” which can be instrumental in supporting students with disabilities in postsecondary education but fluctuate between states. However, as students with disabilities enter these transition services and are taking college credits, many of these students are overlooked in data collection as these programs are often overlooked by federal data collection, as one interviewee summarized:
So, students with intellectual disability who are receiving special education services can access special education services up until the age of 21 in most states…these college transition programs mean that students are receiving support to go on a college campus, take classes, work, enroll, be a part of that community. There is no reflection of those programs, such as enrollment, activities, or outcomes, in any federal data set. And I think that’s part of the problem. We can’t document what happens to these students between 18 and 22 unless they stay in high school. Therefore, there is no publicly recognized gap in service, which means there’s no definitive reason to worry about having them represented in college data. So, it is like they stop existing after 18.
Self-disclosure
One of the most significant challenges facing national postsecondary student disability data is that most disability and accessibility departments collect information from students who voluntarily disclose their disability status to access accommodations. In postsecondary education, students must self-disclose their disability voluntarily to access accommodations. Many do not disclose for due to stigma, a lack of awareness of services, or the perception that their needs do not require formal support. According to data from the High School Longitudinal Study of 2009 (HSLS:09), among students who responded that they have a disability while attending college, only about one-third of students (37 percent) informed their college.[33]
Those collecting data and researching students with disabilities often rely on proxy indicators derived from various federal, state, and institutional sources. These proxies frequently track whether students benefit from targeted programs or financial aid initiatives like state-mandated tuition waivers. In the case of IPEDS, institutions must report on the “percentage of undergraduate students who formally register with the institution’s office of disability services.” [emphasis added]
As previously noted, the self-disclosure and reporting process is often tied to the specific requirements of disability support services, such as documenting the need for assistive technologies, extended testing times, or housing accommodations. It can encompass students with lifelong disabilities or merely students who broke a bone during the semester and who need time-bound physical accommodations.
While these records are helpful in understanding the support provided in the aggregate, as one interviewee mentioned, “We know that students under-report,” these data represent only a subset of the total population of students with disabilities, as not all students register for services. Self-reported data makes it even more difficult for researchers and state agencies to analyze and recommend policies and services. Another interviewee noted, “We have to take it with a grain of salt because ultimately it is a self-reported measure and as such it probably is not capturing the full population of students, but it is the best the state has at its fingertips.”
Additionally, many students may not disclose their disabilities to access accommodations due to stigma, lack of awareness, or uncertainty about available support. A lack of awareness about campus disability and accessibility services can lead students to forgo self-identification, reducing the visibility of their needs in institutional data. An interviewee highlighted the confusion that students and parents alike face when making the change from K-12 to postsecondary support:
The undergraduate students and their parents are already confused enough when they arrive. They do not understand that their IEP [individualized education program][34] has no bearing on [getting accommodations] here. [They can] get accommodations, but they don’t [know how to] get them. They [could potentially qualify for multiple] accommodations [but, they] will never get an IEP at an institution of higher education. We’ve also talked about doing orientation sessions for parents to help them navigate that process because it is very different.
Even when students are aware of services, they may choose not to disclose if they believe their disability is manageable without accommodations or if they have concerns about confidentiality. This underreporting creates an incomplete picture of the population, limiting the utility of data for institutional planning and resource allocation.
Varying definitions of disability
Collecting comprehensive and accurate data on students with disabilities in postsecondary education presents a range of challenges that extend well beyond issues of self-disclosure. One significant obstacle lies in the complexities of defining disability, as different federal laws and regulations apply varying definitions that influence data collection. As one interviewee mentioned, “It’s mushy and complicated. [What] is it that we’re trying to measure? What is it that we’re trying to understand?”
As previously discussed, the Individuals with Disabilities Education Act (IDEA) provides a definition of disability for children with specific disorders and impairments listed. In contrast, the Americans with Disabilities Act (ADA) provides a more conceptual definition where an impairment could “significantly limit one or more major life activities.” These variations can create inconsistencies in identifying students with disabilities across educational settings. Conceptually, shared meanings of disability also vary. While some individuals view disability through a social model that emphasizes systemic barriers and the need for inclusive design, institutional practices align with federal definitions, and data collection efforts often rely on the medical model, which focuses on diagnoses and impairments. This reliance on diagnoses can limit the scope and relevance of collected data, as it fails to account for the broader social and environmental factors influencing students’ experiences—such as students who are experiencing multiple disabilities concurrently.
The current focus on acquiring accommodations or financial aid eligibility also provides a narrow perspective, neglecting broader aspects of campus life, academic engagement, and social inclusion. Without a unified approach to collecting and interpreting disability data, institutions risk overlooking critical barriers to success for these students, limiting their ability to create inclusive learning environments. Addressing these challenges requires rethinking data collection practices and shifting toward frameworks prioritizing students’ voices and lived experiences, fostering a more holistic understanding of disability in higher education.
Limited institutional data infrastructure and capacity
A GAO report indicated that many colleges and universities do not have uniform methods for identifying and reporting disabilities, which complicates the ability to derive meaningful insights from available data.[35] Interviewees for this paper confirm these findings. Unlike other student demographic and academic data typically housed and analyzed within centralized data systems that institutional researchers can access, information on students with disabilities is usually maintained by campus disability services or accessibility offices. These offices primarily collect data to administer accommodations and comply with federal laws like the Americans with Disabilities Act (ADA) or Section 504 of the Rehabilitation Act. However, their focus is operational rather than analytical, meaning the data are not always structured for broader institutional use, such as identifying trends or evaluating the effectiveness of accommodations. This separation creates silos that limit the ability to integrate disability data into institutional planning, assessment, and reporting.
As one interviewee underscores:
The hard part is [that] disability services offices are disconnected from the centralized student information system and to a certain extent rightly so for privacy concerns…so it makes it hard to figure out what are you going to extract and send up and link to enrollment data that’s stored essentially in the registrar’s office? And so, it is just particularly challenging… It’s not as easy as saying I will get someone’s course registration and grades.
In smaller institutions, capacity also becomes an issue. Many institutions lack the resources or infrastructure to implement robust data collection systems.
Data privacy concerns
Data privacy regulations, particularly the Family Educational Rights and Privacy Act (FERPA), add another layer of complexity to managing and sharing disability-related information across offices on campuses. As previously noted, FERPA governs the privacy of student education records and restricts the sharing of identifiable data without consent, including information about a student’s disability status. While FERPA allows for de-identified or aggregated data for institutional analysis, the practical challenges of separating personally identifiable information often discourage data sharing between offices like disability services and IR. As such, these data are frequently shared in the aggregate to mitigate any potential misuse. A survey from the Association on Higher Education and Disability indicated that 62 percent of college administrators expressed concerns about possible violations of student privacy when reporting disability data.[36] Another interviewee mentioned:
Generally speaking, IR [offices don’t] have direct access to any of the disability indicators, so they do have to work with the disability services offices across their campuses to access it. In some cases, the IR directors mentioned that what they get back ultimately is in aggregate. It is not going to be the record identifier with that. It will just be an aggregate of how many students self-identify and participate in services so the IR shops can submit their IPEDS reports.
Institutions may hesitate to integrate disability data across systems due to concerns about compliance and the potential to misuse sensitive information. As a result, institutions may be cautious about sharing data across departments, even when such integration could enhance student support services. This careful approach often leaves disability data underutilized, with limited analysis or application beyond the immediate needs of disability services. Without centralized data infrastructure or clear guidelines for securely sharing and analyzing this information, institutions face significant barriers to leveraging disability data for broader institutional insights and improvements.
Recommendations for IPEDS
- Revise the current IC Section 2, Question 9 (and Instructions) to collect more information on the number of students with disabilities while still complying with HEOA. Continue to publish the percentage of undergraduate students on the College Navigator website in accordance with HEOA; add the percentage of graduate students on College Navigator; and provide the number count of undergraduate and graduate students in IPEDS data files and tools. Suggested revised question:
Section 2 – Institutional Characteristics: Part B – Student Services: Disability Services
9a. Are more than 3 percent of all your undergraduate students enrolled during Fall 20XX formally registered as students with disabilities with the institution’s disability services office (or the equivalent office)?
- Yes, more than 3 percent
- Number of students____; Percentage of students ____
- No, 3 percent or less
- Yes, more than 3 percent
- Add a new question, 9b, to collect similar information on graduate students. Suggested new question:
Section 2 – Institutional Characteristics: Part B – Student Services: Disability Services
9b. Are more than 3 percent of all your graduate students enrolled during Fall 20XX formally registered as students with disabilities with the institution’s office of disability services (or the equivalent office)?
- Yes, more than 3 percent
- Number of students____; Percentage of students ____
- No, 3 percent or less
- Yes, more than 3 percent
- Add two additional questions about services offered to qualified students with disabilities and include this information on the College Navigator Website. Suggested new questions on disability services:
Section 2 – Institutional Characteristics: Part B – Student Services: Disability Services
9c. Which of the following services are offered to qualified students with disabilities by your institution? [Select all that apply]
- Accessible Media
- Alternative Testing
- Assistive Technology
- Note-Taking Services
- Communication Access (e.g., sign language interpreters and transcribers)
- Courseload Accommodations (e.g., course load reduction, priority course registration, course substitutions)
- Dining Accommodations
- Housing Accommodations
- Parking and Transportation
[Context box]
9d. Does your institution offer the following financial assistance for qualified students with disabilities?
- Tuition reduction
- Scholarships specifically for students with disabilities to help defray educational costs
[Context box]
- Move the current question about comprehensive transition and postsecondary programs from the Special Learning Opportunities question to IC Section 2, Part B, and ask for those with programs to provide student enrollment counts. Suggested new question:
9e. Does your institution offer a comprehensive transition and postsecondary (CTP) program for students with intellectual disabilities?
- No
- Provide the number of students participating in the CTP program in Fall 20XX. _____
- Continue exploring avenues to have institutions report on student retention and graduation rates for students with disabilities. As cited in the paper, Maryland, California’s Community Colleges, New York State Education Department, and likely others collect and report not only more detailed information about students with disabilities but also their retention and graduation rates.
- Collaborate with the ED Office of Civil Rights on possible ways the two parts of the Department (NCES and OCR) could coordinate and collaborate on data collection with more information on students with disabilities in postsecondary education, similar to the data collection OCR conducts for K12 education.
- Collaborate with IES’s State Longitudinal Data Systems (SLDS) program staff to learn more about how states use these robust systems to provide research and reports on the educational pathways of students with disabilities through K12 and postsecondary education and into the workforce.
- Consider collaborating with the Association for Institutional Research (AIR) to develop training materials and resources for IR professionals about best practices in student surveys on issues related to students with disabilities and in working with offices across their institutions to provide reliable data on students with disabilities to IPEDS. Also, consider working with AIR and an organization like AHEAD, the Association on Higher Education and Disabilities, to develop a short training module for disability services on how they could be using IPEDS and NPSAS data on students with disabilities to inform their work.
Conclusion
The increasing enrollment of students with disabilities in postsecondary education signifies a positive shift toward greater inclusivity and access to higher education. However, the lack of comprehensive and reliable data regarding their experiences presents significant challenges in understanding and addressing their needs. As outlined throughout this report, the complexities surrounding disability data collection—ranging from varied definitions to self-disclosure challenges—underscore the need for a cohesive strategy that aligns with the unique characteristics of this population. Incremental improvements to IPEDS, as outlined in this paper, serve as a good next step.
The complexities surrounding disability data collection—ranging from varied definitions to self-disclosure challenges—underscore the need for a cohesive strategy that aligns with the unique characteristics of this population.
Comprehensive data collection is not merely an administrative task; it is a fundamental component of ensuring all students, regardless of their backgrounds or disabilities, have access to and opportunities for success in higher education. A thorough understanding of the experiences and outcomes of students with disabilities will empower institutions and policymakers to implement informed strategies that promote success, access, and equality in postsecondary education.
Bibliography
Adam, Tara, and Catharine Warner-Griffin. “Use of Supports Among Students with Disabilities and Special Needs in College.” US Department of Education. National Center for Education Statistics, April 2022. https://nces.ed.gov/pubsearch/pubsinfo.asp?pubid=2022071.
Americans with Disabilities Act, 42 U.S.C. § 12101 et seq.
Avellone, Lauren and Sally Scott. “National Databases with Information on College Students with Disabilities.” National Center for College Students with Disabilities, Association on Higher Education and Disability 1, no. 1 (March 2017): https://eric.ed.gov/?id=ED574980.
Borgemenke, Arthur, Martina Hinojosa, Chuck Holt, Rick Lumadue, Sam Roberson, and Rusty Waller. “The Availability of Higher Education Services to Students with Disabilities in Large City Urbanized Areas.” Spaces and Flows: An International Journal of Urban and Extraurban Studies, 2011. https://doi.org/10.18848/2154-8676/cgp/v01i02/53787.
“The Classification of Instructional Programs, 2020.” National Center for Education Statistics, 2020. https://nces.ed.gov/ipeds/cipcode/.
Charran, Chelseaia, Ibrahim Bicak, and Z.W. Taylor. “Where Do Students with Disabilities Enroll in Texas Postsecondary Institutions? Texas Education Review 8, no. 1 (2019): 65–85. https://doi.org/10.26153/tsw/7051 .
“Department of Education: Additional Data Collection Would Help Assess the Performance of a Program Supporting College Students with Disabilities.” Government Accountability Office, February 2023. https://www.gao.gov/products/gao-23-105551.
“Disabled Student Programs and Services: 2024 Report.” California Community Colleges, Chancellor’s Office, 2024. https://www.cccco.edu/-/media/CCCCO-Website/docs/report/2024-disabled-student-programs-and-service-legislative-report-a11y.pdf?la=en&hash=7F37AD8FB7A149D25E39B1B46C92626ED0D1CABE.
“Doctorate Recipients from U.S. Universities: 2021” National Science Foundation. National Center for Science and Engineering Statistics, 2023. https://ncses.nsf.gov/pubs/.
“Education Could Improve Information on Accommodations for Students with Disabilities.” Government Accountability Office, April 2024. https://www.gao.gov/assets/gao-24-105614.pdf.
Higher Education Opportunity Act, 20 U.S.C. § 1001 et seq.
“How Disability Data Are Collected from the American Community Survey.” US Census Bureau, 2024. https://www.census.gov/topics/health/disability/guidance/data-collection-acs.html#:~:text=All%20three%20surveys%20ask%20about,considered%20to%20have%20a%20disability.
Individuals with Disabilities Education Act, 20 U.S.C. § 1400 et seq.
“IPEDS 2024-25 Survey Materials, Institutional Characteristics Component.” National Center for Education Statistics, 2024. http://surveys.nces.ed.gov/ipeds/public/survey-materials/index.
McNeely, Elise Miller. “The History and Origins of Survey Items for the Integrated Postsecondary Education Data System (2022-23 update).” National Center for Education Statistics, 2023. https://nces.ed.gov/ipeds/pdf/NPEC/data/The-History-and-Origins-of-Survey-Items.pdf.
“Member Snapshot: Disability Data Collection and Reporting Practices.” Association on Higher Education and Disability, February 2020.
Miller, T., M. Garland, and D. Gerdeman. “College Enrollment and Completion Among Texas High School Graduates with a Disability.” National Center for Education Evaluation and Regional Assistance at the Institute of Education Sciences, November 2020. https://ies.ed.gov/pubsearch/pubsinfo.asp?pubid=REL2021043.
National Center for Education Statistics. (2024). “2019–20 National Postsecondary Student Aid Study (NPSAS:20) Data Collection Instruments.” National Center for Education Statistics, 2024. https://nces.ed.gov/surveys/npsas/pdf/NPSAS20_questionnaire.pdf.
“NY State Higher Education – Students With Disabilities Report (2022 – 23).” New York State Education Department, 2024. https://data.nysed.gov/highered-swd.php?year=2023&state=yes.
Pendharkar, Eesha. “What Is an IEP? Individualized Education Programs, Explained.” Education Week, 27 July 2023. https://www.edweek.org/teaching-learning/what-is-an-iep-individualized-education-programs-explained/2023/07.
“Students with Disabilities: Additional Information from Education Could Help States Provide Pre-Employment Transition Services” Government Accountability Office, September 2018. https://www.gao.gov/assets/gao-18-502.pdf.
“Students With Intellectual Disabilities.” Federal Student Aid, 2024. https://studentaid.gov/understand-aid/eligibility/requirements/intellectual-disabilities.
“Summary Students with Disabilities: Services & Expenditures for Students with Disabilities, FY 2023-2024.” Florida Department of Education, 2024. https://www.fldoe.org/file/19874/2324SSDR.pdf.
“Survey of Earned Doctorates (SED) 2022.” National Science Foundation. National Center for Science and Engineering Statistics, 2024. https://ncses.nsf.gov/surveys/earned-doctorates/2022.
Taylor, Z. W., and Ibrahim Bicak. “US Postsecondary Students with Disabilities: Where Are They?” Review of Disability Studies: An International Journal 19, no. 3-4 (2024). https://rdsjournal.org/index.php/journal/article/view/1098.
“2024 Students with Disabilities at Maryland Colleges and Universities.” Maryland Higher Education Commission, June 2024. https://mhec.maryland.gov/publications/Documents/Research/AnnualReports/2024%20Students%20with%20Disabilities%20Report.pdf.
Zilvinskis, John. “Convergence Issues for Disability Measures at Public 2-Year Institutions.” The AIR Professional File, no. 166 (Spring 2024). https://doi.org/10.34315/apf1662024.
Appendix A: CCSSE additional item set on campus accessibility[37]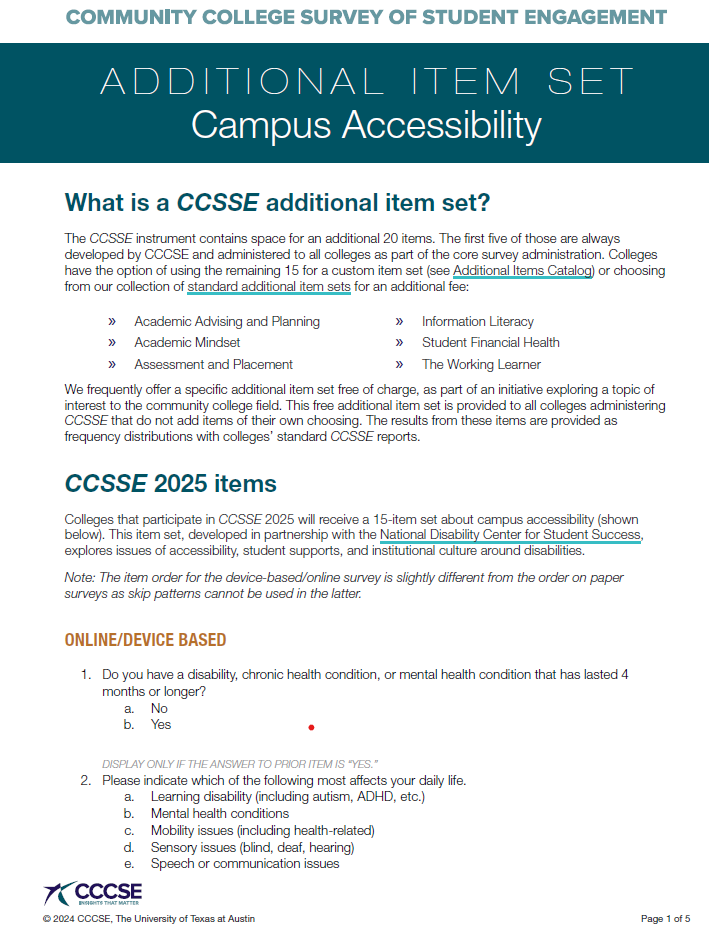
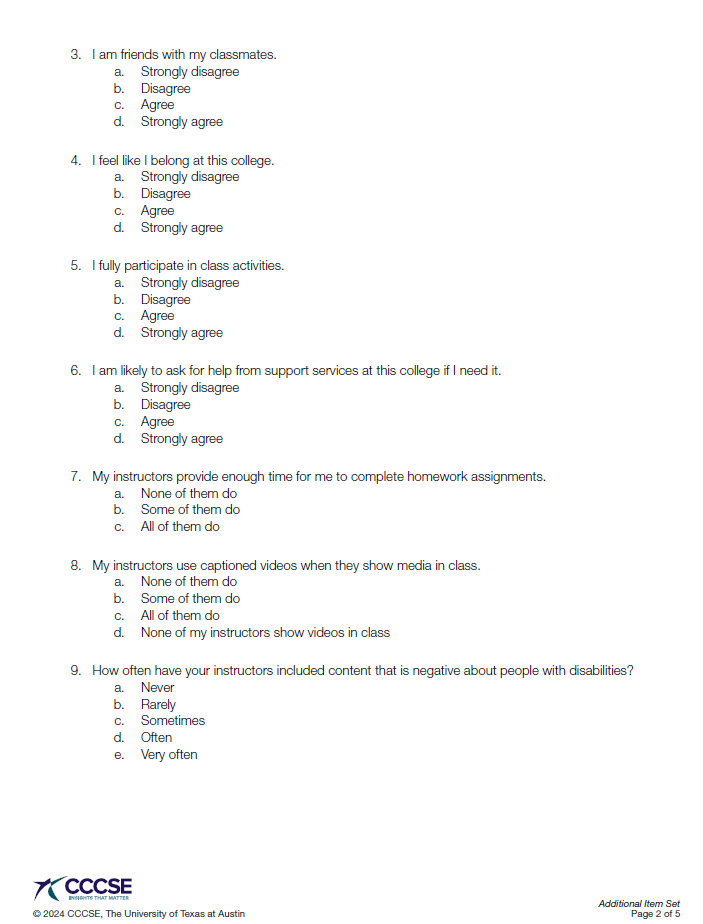
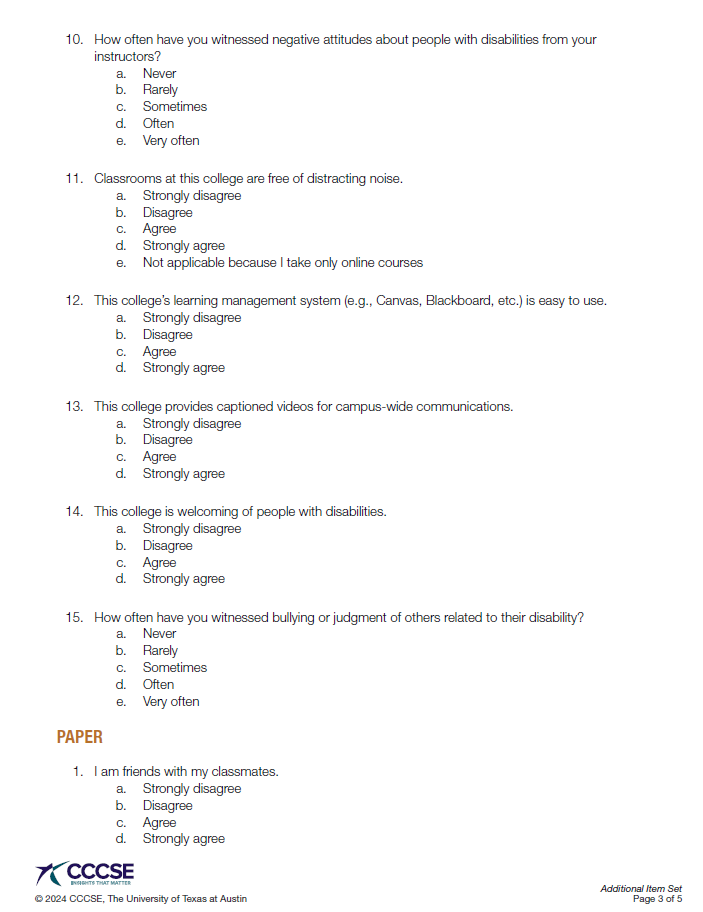
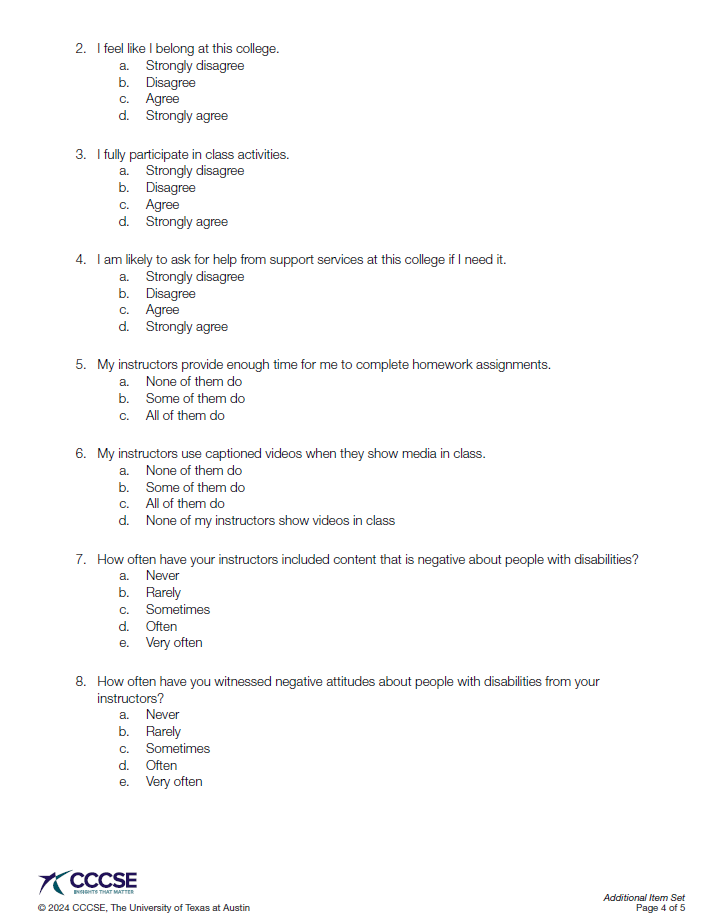
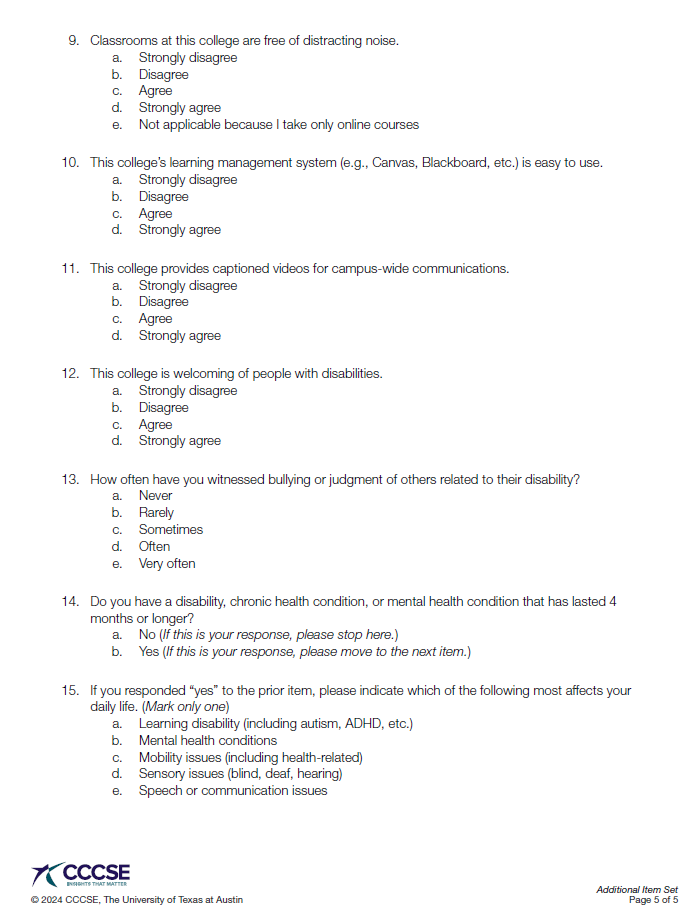
Endnotes
- “Education Could Improve Information on Accommodations for Students with Disabilities,” Government Accountability Office, April 2024, https://www.gao.gov/assets/gao-24-105614.pdf. ↑
- See Elise Miller McNeely, “The History and Origins of Survey Items for the Integrated Postsecondary Education Data System (2022-23 update),” US Department of Education, National Center for Education Statistics, 2023, http://nces.ed.gov/pubsearch. ↑
- The Classification of Instructional Programs (CIP) provides a taxonomic scheme that supports the accurate tracking and reporting of fields of study and program completions activity. CIP was originally developed by the US Department of Education’s National Center for Education Statistics (NCES) in 1980, with revisions occurring in 1985, 1990, 2000, 2010 and 2020. See: https://nces.ed.gov/ipeds/cipcode/. ↑
- “Students With Intellectual Disabilities,” Federal Student Aid, 2024, https://studentaid.gov/understand-aid/eligibility/requirements/intellectual-disabilities. ↑
- “The Classification of Instructional Programs, 2020,” National Center for Education Statistics, 2020, https://nces.ed.gov/ipeds/cipcode/. ↑
- “2019–20 National Postsecondary Student Aid Study (NPSAS:20) Data Collection Instruments,” National Center for Education Statistics, 2024, https://nces.ed.gov/surveys/npsas/pdf/NPSAS20_questionnaire.pdf. ↑
- Please note that NCES changed its definition of disabilities in its 2016 data collection and then reverted to its previous definition in the 2020 and 2024 data collection. Caution should be taken when using NPSAS: 16 data in any trend analysis on students with disabilities because of the definitional difference in that year. ↑
- “Department of Education: Additional Data Collection Would Help Assess the Performance of a Program Supporting College Students with Disabilities,” Government Accountability Office, February 2023, https://www.gao.gov/products/gao-23-105551. ↑
- “Department of Education: Additional Data Collection Would Help Assess the Performance of a Program Supporting College Students with Disabilities,” Government Accountability Office, February 2023, https://www.gao.gov/products/gao-23-105551. ↑
- The Perkins Data Explorer is accessible at https://cte.ed.gov/pcrn/explorer. ↑
- “Survey of Earned Doctorates (SED) 2022,” National Science Foundation, 2024, https://ncses.nsf.gov/surveys/earned-doctorates/2022. ↑
- Lauren Avellone and Sally Scott, “National Databases with Information on College Students with Disabilities,” National Center for College Students with Disabilities, Association on Higher Education and Disability 1, no. 1 (March 2017): https://eric.ed.gov/?id=ED574980. ↑
- “Survey of Earned Doctorates (SED) 2022,” National Science Foundation, 2024, https://ncses.nsf.gov/surveys/earned-doctorates/2022. ↑
- “Doctorate Recipients from U.S. Universities: 2021,” National Center for Science and Engineering Statistics, National Science Foundation, 2023, https://ncses.nsf.gov/pubs/. ↑
- Excerpted from “How Disability Data are Collected from The American Community Survey,” United States Census Bureau, Last revised 21 November 2021, https://www.census.gov/topics/health/disability/guidance/data-collection-acs.html#:~:text=All%20three%20surveys%20ask%20about,considered%20to%20have%20a%20disability. ↑
- See the Higher Education Research Institute website, https://heri.ucla.edu/. ↑
- Lauren Avellone and Sally Scott, “National Databases with Information on College Students with Disabilities,” National Center for College Students with Disabilities, Association on Higher Education and Disability 1, no. 1 (March 2017): https://eric.ed.gov/?id=ED574980. ↑
- For more information on the HERI CIRP data access process, see https://heri.ucla.edu/data-access-for-researchers/. ↑
- See National Survey of Student Engagement website, https://nsse.indiana.edu/nsse/index.html. ↑
- Lauren Avellone and Sally Scott, “National Databases with Information on College Students with Disabilities,” National Center for College Students with Disabilities, Association on Higher Education and Disability 1, no. 1 (March 2017): https://eric.ed.gov/?id=ED574980. ↑
- Full survey instrument available at https://nsse.indiana.edu/nsse/survey-instruments/us-english.html. ↑
- See CCSSE website at https://cccse.org/. ↑
- John Zilvinksis, “Convergence Issues for Disability Measures at Public 2-Year Institutions,” The AIR Professional File, no. 166 (Spring 2024): https://doi.org/10.34315/apf1662024. ↑
- John Zilvinksis, “Convergence Issues for Disability Measures at Public 2-Year Institutions,” The AIR Professional File, 2024 Spring Volume, no. 166 (2024): https://doi.org/10.34315/apf1662024. ↑
- See CCSE website: https://cccse.org/. ↑
- In IPEDS, institutional sector is defined by control of the institution (public, private non-for-profit, and private for-profit) and level (four-year, two-year, and less than two-year). ↑
- Figure 7 is excerpted from Figure 2 on Page 8 in “Education Could Improve Information on Accommodations for Students with Disabilities,” Government Accountability Office, April 2024, https://www.gao.gov/assets/gao-24-105614.pdf. ↑
- See Figure 3, Page 9 in “Education Could Improve Information on Accommodations for Students with Disabilities,” Government Accountability Office, April 2024, https://www.gao.gov/assets/gao-24-105614.pdf. ↑
- “Education Could Improve Information on Accommodations for Students with Disabilities,” Government Accountability Office, April 2024, https://www.gao.gov/assets/gao-24-105614.pdf. ↑
- Chelseaia Charran, Ibrahim Bicak, Z.W. Taylor, “Where Do Students with Disabilities Enroll in Texas Postsecondary Institutions?” Texas Education Review 8, no. 1 (2020): 65–85, https://doi.org/10.26153/tsw/7051. ↑
- Z.W. Taylor and Ibrahim Bicak, “US Postsecondary Students with Disabilities: Where Are They?” Review of Disability Studies: An International Journal 19, no. 3-4 (August 2024): https://rdsjournal.org/index.php/journal/article/view/1098. ↑
- These reports were identified through searches of the ERIC database and Google and insights from interviews. Other states may also have reports that were not found through this search process and would likely be better identified by surveying all 50 states’ higher education agencies, which was outside the scope of this project. ↑
- Tara Adam, Catharine Warner-Griffin, “Use of Supports Among Students with Disabilities and Special Needs in College,” US Department of Education, National Center for Education Statistics, April 2022, https://nces.ed.gov/pubsearch/pubsinfo.asp?pubid=2022071. ↑
- According to Education Week magazine, “An Individualized Education Program, or IEP, is a program tailored to meet the individual needs of students with disabilities. The program is written in collaboration between a child’s school district, their parent or guardian, and sometimes, the student. The document outlines the special educational needs based on the student’s identified disability. It outlines educational goals, and any specialist services they may need to meet those goals….” Read more: Eesha Pendharkar, “What Is an IEP? Individualized Education Programs, Explained,” Education Week, 27 July 2023, https://www.edweek.org/teaching-learning/what-is-an-iep-individualized-education-programs-explained/2023/07. See Sec. 300.320 of the Individuals with Disabilities Education Act (IDEA), for a full definition of individualized education program (IEP) at https://sites.ed.gov/idea/regs/b/d/300.320. ↑
- “Students with Disabilities: Additional Information from Education Could Help States Provide Pre-Employment Transition Services,” Government Accountability Office, September 2018, https://www.gao.gov/assets/gao-18-502.pdf. ↑
- “Member Snapshot: Disability Data Collection and Reporting Practices,” Association on Higher Education and Disability, February 2020. ↑
- Downloadable at https://utexas.app.box.com/v/campus-accessibility. ↑