Examining Employers’ Perceptions of Online Credentials
A Discrete Choice Experiment
-
Table of Contents
- Introduction
- Background
- Research questions
- Study design
- Final study sample
- Analytic approach
- Results
- Discussion
- Limitations
- Policy and stakeholder implications
- Appendix A: Sample size and power
- Appendix B: Diagnostic tests of key assumptions
- Appendix C: Understanding effects using separate models
- Appendix D: Regression tables
- Endnotes
Introduction
US colleges and universities received roughly $900 billion in total revenue in fiscal year 2024, with public funding and students’ tuition dollars making up the lion’s share.[1] This level of investment requires significant public oversight to ensure institutions use public and private funds effectively and to protect students and taxpayers from fraud and waste. State authorization is one important aspect of this oversight, wherein state governments serve a consumer protection role by authorizing institutions to operate within their jurisdiction and providing a legal framework to enforce state consumer protection laws. This process is meant to protect students from predatory institutions, though it has also been criticized for creating substantial administrative hurdles, particularly for institutions offering online programs across multiple states, which have historically needed to secure authorization from each state in which they operate.[2]
To help address the administrative burdens associated with state authorization, a group of higher education stakeholders developed the National Council for State Authorization Reciprocity Agreements (NC-SARA) in 2013.[3] NC-SARA is a private nonprofit organization designed to advance interstate reciprocity agreements that streamline the authorization process for institutions offering online education. As of 2026, all US states and the District of Columbia, with the exception of California, have joined SARA. Institutions located in participating states can more easily enroll students who reside in other SARA member states in their online programs.
While reciprocity agreements make the authorization process easier by lowering the regulatory burden placed on states, some have argued that SARA allows states to abdicate their oversight responsibilities in two key ways.[4] First, critics contend that reciprocity allows institutions to seek authorization in the state with the weakest oversight, thus creating opportunities for predatory colleges to easily enter a national market. Ithaka S+R’s previous research, however, did not find that for-profit institutions—which have a history of predatory behavior and, on average, leave their graduates with more debt and fewer labor market opportunities—disproportionately benefited from SARA.[5] Second, SARA limits the ability of each state’s attorney general to enforce their state consumer protection laws, hold institutions accountable, and protect their residents from fraud and abuse. NC-SARA has argued that the reciprocity agreement raises oversight standards because institutions have to apply and be accepted into SARA, whose own standards are higher than those of many states.[6]
Prior research in related contexts suggests that institution type plays an important role in labor market signaling. For example, resume audit studies have found that resumes of applicants who graduated from a for-profit college result in fewer recruiter callbacks than other sectors, and appear to hold the same market signaling power as high school diplomas or fictional universities.[7] Institutional selectivity and reputation are related to opportunities and wages too.[8] Similarly, degrees from locally recognized or in-state institutions may confer labor market advantages over those from less familiar out-of-state institutions. These factors have the potential to undermine the benefits of interstate enrollment and an expanded postsecondary market created by SARA.
In this study, supported by Strada Education Foundation and the Joyce Foundation, we conduct a discrete choice experiment with professional recruiters and hiring managers to better understand how they respond to online credentials, including those earned from out-of-state institutions.[9] Our research asks whether employers prefer hypothetical job applicants with in-person degrees compared to online degrees, if this preference differs based on whether the degree was earned from an in- or out-of-state institution, and how these preferences may vary by other candidate, respondent, and employer characteristics.
We find that candidates’ work experiences and skills play a substantially larger role in hiring managers’ decisions than degree program modality and institution type.
We find that candidates’ work experiences and skills play a substantially larger role in hiring managers’ decisions than degree program modality and institution type. However, candidates with online degrees face a modest penalty, which is largest for those with degrees from out-of-state public institutions. Employer industry plays a role too. Hiring professionals in industries aligned with fields of study that have a strong online presence, such as business, health care, and education, do not penalize candidates with online degrees. In contrast, those in industries where online credentials are less common do penalize these candidates.
In the following sections, we contextualize the current study with literature on the returns to postsecondary credentials and the labor market signaling of credentials. We then provide an overview of the study’s experimental design and present findings of how recruiters evaluate job candidates with varying characteristics, including the type of credential they hold. Lastly, we discuss the substantive significance of the findings, the limitations of the study design, and implications for state policymakers and other stakeholders.
Background
A college degree provides individuals with more labor market opportunities and higher wages. Research estimates that a bachelor’s degree recipient will earn over $1 million more than a high school graduate over the course of their lifetime.[10] Descriptive analysis from Georgetown’s Center for Education and the Workforce (CEW), summarized in Table 1, shows a graduated earnings premium from different levels of education. While such an earnings premium may reflect innate qualities or individual contexts (e.g., familial wealth or geography) that cause someone to self-select into higher levels of education, numerous studies have identified a causal relationship between more education and earnings.[11]
Research estimates that a bachelor’s degree recipient will earn more than $1 million more than a high school graduate over the course of their lifetime.
Table 1: Median Lifetime Earnings by Credential Level
| Credential level | Median lifetime earnings |
| Less than high school | $1,204,725 |
| High school diploma/GED | $1,576,059 |
| Some college | $1,866,005 |
| Associate’s degree | $2,034,523 |
| Bachelor’s degree | $2,803,620 |
| Master’s degree | $3,238,709 |
| Doctoral degree | $4,010,280 |
| Professional degree | $4,730,621 |
Source: Georgetown Center for Education and the Workforce
Higher earnings associated with additional education may reflect increased human capital development, as individuals gain knowledge and skills in college. Additionally, or alternatively, credentials may hold specific market signals that convey information to employers about ability and persistence that result in more labor market opportunities. This signals to employers that an individual can complete something they start and that they possess a level of productivity beyond the specific knowledge and skills earned during schooling.[12] Researchers have tested this market signaling by using various experimental designs to assess how employers respond to different types of credentials and to better understand how specific elements of a credential impact employer perceptions. For example, resume audit studies have shown job biases against applicants who attended for-profit institutions,[13] transferred from a community college to a four-year institution,[14] attended less selective institutions,[15] or completed their bachelor’s degree in six years instead of four.[16]
A growing body of work has examined how employers respond to online credentials. One resume audit study conducted at the beginning of the COVID-19 pandemic found that individuals with a master’s degree in business administration (MBA) from an online program, regional public, or for-profit institution received similar callback rates as individuals with just a bachelor’s degree, calling into question the value of MBAs from less selective institutions.[17] Another study examined within-institution variation in degree modality and found a penalty for obtaining an online credential.[18] However, this study was conducted from 2015 through 2017, prior to the recent expansion of online programs in response to the disruption brought on by the COVID-19 pandemic. It is possible that increased familiarity with online learning since the implementation of these studies has reduced biases against online credentials. Nevertheless, these findings point to potential biases students who obtain online credentials under SARA may face.
Research questions
This study aims to understand whether, and to what extent, online learners are earning credentials that are valued by the labor market. The research is guided by the following questions:
- Do employers prefer job applicants with in-person degrees compared to online degrees?
- Does this preference differ based on whether the degree was earned from an in-state or out-of-state institution?
- How do employer preferences vary by other candidate characteristics as well as by respondent and employer characteristics?
Study design
To answer these questions, Ithaka S+R designed and conducted a discrete choice experiment (DCE), a research method to measure preferences by asking participants to choose between hypothetical options that vary across defined characteristics, or attributes. The primary objectives of the experiment were to compare employer evaluations of job candidates who earned a bachelor’s degree online with those who earned a bachelor’s degree in person, and to assess whether and to what extent those evaluations varied depending on whether the degree-granting institution was in- or out-of-state. This comparison is central to our analysis because institutions located in SARA member states can more easily enroll students residing in other SARA states in their online programs.
The DCE was administered through an online survey of individuals who are responsible for recruiting and hiring new employees, including hiring managers and human resource specialists. Participants reviewed 12 pairs of hypothetical job candidates who varied across attributes that recruiters and hiring managers commonly use to assess an individual’s academic preparation, technical aptitude, and potential success in a given job. Participants were asked to consider these candidates for a junior-level position appropriate for a recent bachelor’s degree recipient, in order to emphasize the importance of the degree in hiring decisions. However, candidates’ fields of study were not specified. To minimize response bias, we did not disclose that the primary focus of the survey was to understand the influence of degree program modality and its intersection with institution type. After reviewing each pair of candidates, participants were required (through forced response) to choose the individual they would invite for a job interview. Respondents were not given the option to select none/neither.
Following the discrete choice tasks, the survey included background questions about respondents (e.g., highest degree earned, number of years of work experience) and their employers (e.g., industry, geographic region). These questions were included to assess whether and to what extent respondent and employer characteristics influenced the results.
Because survey respondents were aware that they were participating in a survey, the results reflect stated rather than revealed preferences. Additionally, the DCE does not generate strong incentives for respondents to carefully consider their true preferences since their choices carry no real consequences in these hypothetical scenarios.[19] See the Limitations section for further reflections on this aspect of the study design.
To recruit an appropriate sample, Ithaka S+R partnered with Alchemer, a panel management company, to identify and survey hiring professionals located in the United States. Alchemer managed participant recruitment, determined and distributed appropriate incentives for participation, and delivered a clean and validated dataset of survey responses. Ithaka S+R designed the survey and programmed it in Alchemer’s platform before it was digitally deployed.
Attributes and levels
Table 2 below summarizes the attributes that comprise the hypothetical candidate profiles. Each attribute includes between two and five levels, which are the specific variations within each attribute. For instance, a candidate’s experience with job-relevant tools and software can range from beginner to advanced. The levels assigned to hypothetical candidates in each choice task were randomly generated using Alchemer’s conjoint question feature.
Table 2. Attributes and Levels of Hypothetical Candidates
| Attribute | Definition | Number of Levels | Levels |
| Match of Field of Study and Job Tasks | Indicates the extent to which the candidate’s bachelor’s degree field of study aligns with the requirements of the position. | 3 | Field of study matches job tasks completely |
| Field of study related to job tasks but not exact match | |||
| Field of study unrelated to job tasks | |||
| Institution Type | Indicates the type of institution from which the candidate earned their bachelor’s degree and whether it is located in or outside of your current state of residence. | 5 | In-state public |
| In-state private not-for-profit | |||
| Out-of-state public | |||
| Out-of-state private not-for-profit | |||
| Out-of-state for-profit | |||
| Degree Program Modality | Indicates whether the candidate earned their bachelor’s degree through an online or in-person program.[20] | 2 | In person |
| Online | |||
| Institutional Selectivity | Indicates the admissions rate of the institution where the candidate earned their bachelor’s degree. | 4 | Less selective/open admissions (admit more than 85 percent of applicants) |
| Competitive (admit between 75 and 85 percent of applicants) | |||
| Very competitive (admit between 50 and 75 percent of applicants) | |||
| Highly selective (admit less than 50 percent of applicants) | |||
| Work Experience | Indicates the number of years of work experience the candidate has that it is relevant to the position. | 3 | 0 years of relevant work experience |
| 1 year of relevant work experience | |||
| 2 years of relevant work experience | |||
| Level of Experience with Job-Relevant Tools and Software | Indicates the candidate’s level of technical experience with tools and software relevant to the position. | 3 | Beginner |
| Intermediate | |||
| Advanced |
The order of the attributes in the table matches the order in which they appear in the choice sets. We intentionally did not place degree program modality or institution type at the top of the list to avoid signaling that these attributes were most important.
The institution type attribute combines institutional control (i.e., public, private not-for-profit, and for-profit) and whether the institution is in-state or out-of-state. It is important to point out that in-state versus out-of-state is from the perspective of the respondent, not the student. We used this approach to better capture the degree of recognizability and familiarity a respondent may have with a given institution. One concern with the growth of enrollment across state lines is that students are increasingly earning degrees from institutions across the country. Employers and hiring managers may be less familiar with these institutions and therefore perceive them to be of lower quality than schools with which they are more familiar. Defining in-state status from the respondent’s perspective more directly captures this dimension of familiarity than basing it on the student’s location. With this approach, a hypothetical applicant could have attended an institution in the same state as their residence, yet their institution would still be perceived as out-of-state if the respondent is located elsewhere.[21]
We also used institutional selectivity, defined by Barron’s Selectivity Index (often used by the National Student Clearinghouse), as a proxy not only for familiarity but also brand recognition and prestige.[22] We considered constructing a measure that explicitly categorized institutions as nationally, regionally, or only locally recognized, but ultimately decided that such a measure would be too misaligned from information shared through resumes and how respondents evaluate institutions. Although respondents may not know an institution’s specific admissions rate, selectivity serves as a reasonable proxy for brand recognition and prestige. Higher selectivity typically corresponds to greater recognition and prestige, and vice versa.
We relied on the literature to identify the attributes describing candidates’ work experience and alignment with the requirements of the job. Specifically, we drew on the match of field of study and job tasks and relevant work experience attributes developed and implemented by Martin Humburg and Rolf K. W. van der Velden and then applied similar logic to develop the attribute measuring the level of experience with job-relevant tools and software.[23]
Figure 1 below is an example of a choice task presented to respondents. The reminder of the prompt at the top of the choice task was also inspired by Humburg and van der Velden.
Figure 1. Choice Set Example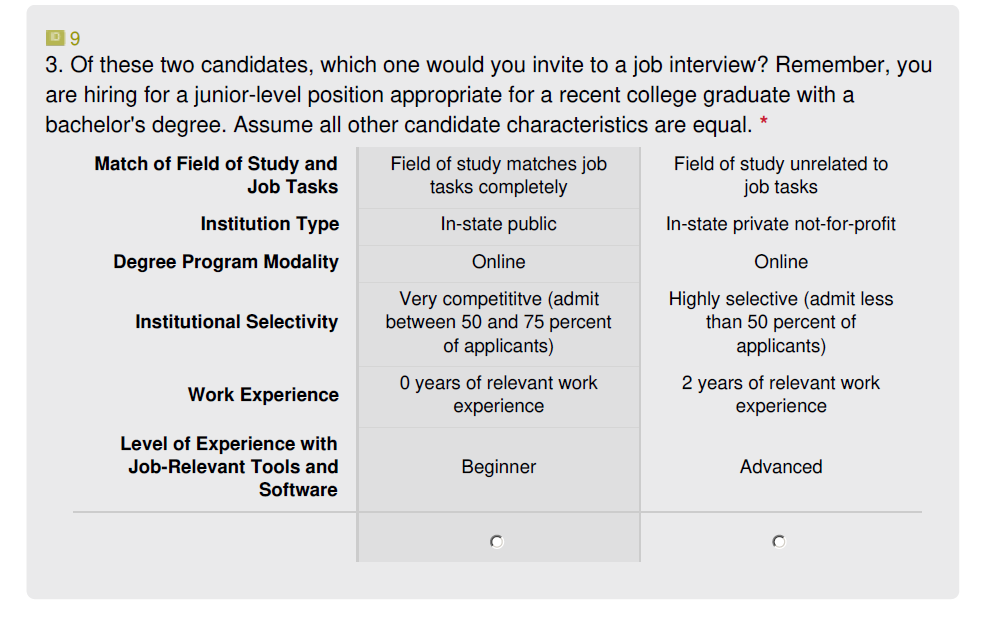
Final study sample
Alchemer fielded the survey over 12 days, from December 10, 2025 to December 22, 2025. The fielding began with a soft launch from December 10 to 11, during which 34 responses were collected. This phase allowed us to review initial results to verify that the survey was functioning as intended. After confirmation, the survey was fully launched and remained open until at least 500 validated responses were collected. In total, 543 validated responses were included in the final sample; 23 responses were removed for partial completion, and 232 responses were disqualified by Alchemer for failing to meet the eligibility criteria or for being duplicate responses. Because the 543 validated respondents each completed 12 choice tasks with two alternatives, the final dataset comprises 6,516 choice tasks and 13,032 alternative-level observations. See Appendix A for power calculations to ensure sufficient sample size.
Table 3 below presents descriptive statistics on the final sample, organized by respondent and employer characteristics. A plurality of respondents (42.4 percent) live in the South, higher than the national average of 39.2 percent. This is followed by the Midwest (22.8 percent) and the Northeast (18.6 percent). The West is underrepresented, with only 16.2 percent of respondents compared with 24 percent of the population nationally.[24] Nearly two-thirds of respondents report having between six and 15 years of work experience, while eight percent have zero to five years, 15.3 percent have 16-20 years, and 10.9 percent have more than 20 years of experience.
The majority of respondents have a bachelor’s degree or higher. Nearly half of respondents (47.5 percent) report a bachelor’s degree as their highest credential, and nearly one-fifth report holding a master’s degree, professional degree, or doctorate. The second most common credential is an associate degree, at 18.8 percent, while 14.4 percent report earning a high school diploma only. The educational attainment of this sample is greater than the national average among adults aged 25 and older. Nationally, fewer than one-quarter of adults hold a bachelor’s degree as their highest credential. Among respondents with an associate degree or higher, slightly more than one-quarter report having earned their degree exclusively online.
Among employer characteristics, the most commonly reported industries were Health Science and Medical Technology (18.4 percent), Manufacturing and Product Development (14.0 percent), and Business and Finance (11.6 percent).[25] Additionally, 30.4 percent of respondents reported working at a remote-first organization, where employees are not required to work in a physical office.
Table 3. Descriptive Statistics on the Study Sample
| Respondent Characteristics | ||
| n | Percent | |
| Geographic Region | ||
| South | 230 | 42.4 |
| Midwest | 124 | 22.8 |
| Northeast | 101 | 18.6 |
| West | 88 | 16.2 |
| Work Experience | ||
| 0-5 years | 45 | 8.3 |
| 6-10 years | 183 | 33.7 |
| 11-15 years | 173 | 31.9 |
| 16-20 years | 83 | 15.3 |
| 21+ years | 59 | 10.9 |
| Highest Degree Earned | ||
| High school diploma | 78 | 14.4 |
| Associate degree (e.g., AA, AS) | 102 | 18.8 |
| Bachelor’s degree (e.g., BA, BS) | 258 | 47.5 |
| Master’s degree (e.g., MA, MS) | 73 | 13.4 |
| Professional degree | 25 | 4.6 |
| Doctorate degree (e.g., PhD, EdD) | 7 | 1.3 |
| Highest Degree Earned Online[26] | ||
| Yes | 123 | 26.4 |
| No | 342 | 73.6 |
| Employer Characteristics | ||
| n | Percent | |
| Industry (top 3) | ||
| Health Science and Medical Technology | 100 | 18.4 |
| Manufacturing and Product Development | 76 | 14.0 |
| Business and Finance | 63 | 11.6 |
| Remote-First Organization | ||
| Yes | 165 | 30.4 |
| No | 378 | 69.6 |
Analytic approach
We employed ordinary least squares (OLS) regression models to assess the effect of the attributes listed in Table 2 on the likelihood of being selected for a job interview, with a focus on the effect of earning a bachelor’s degree online relative to one in person. We drew heavily on Jens Hainmueller, Daniel J. Hopkins, and Teppei Yamamoto, who argue that because all attribute levels in a DCE are independently randomized, OLS regressions consistently estimate the causal effects of individual attribute levels.[27] See Appendix B for the series of diagnostic tests that check the assumptions underlying this approach that Hainmueller, Hopkins, and Yamamoto recommend.
DCEs commonly rely on mixed or multinomial logit models rather than OLS models because they are grounded in utility theory, an economic framework for explaining how individuals make choices for goods and services. These models are especially relevant when estimating monetary tradeoffs, such as respondents’ willingness to pay. However, when a study does not involve monetary attributes, utility theory is less central to understanding decisions. In these cases, simpler models like OLS can be used to describe choice patterns.
The model for this analysis is as follows:
CHOSENi = δ + βPROGRAM MODALITYi + αXi + εi
Where CHOSEN indicates whether a respondent, i, chose a given candidate, PROGRAM MODALITY, as the key independent variable, indicates whether a given candidate earned their bachelor’s degree in person or online, and X is a vector of control variables, defined as the differences in the five other attributes between the two candidates presented in each choice task. Because all respondents were forced to complete all 12 tasks and partial responses were scrubbed from the dataset, the data contain no missing observations. Standard errors are clustered at the respondent level.
To assess whether the effects of degree program modality varied across other candidate attributes or employer characteristics, we added an interaction term to the OLS model.
The model for this analysis is as follows:
CHOSENi = δ + βPROGRAM MODALITYi + γOTHER CHARACTERISTICi + θ(PROGRAMi x OTHER CHARACTERISTICi) + αXi + εi
Where CHOSEN indicates whether a respondent, i, chose a given candidate, PROGRAM MODALITY, as the key independent variable, indicates whether a given candidate earned their bachelor’s degree in person or online, OTHER CHARACTERISTIC represents a set of dummies for all attribute levels or characteristic categories, PROGRAM MODALITY x OTHER CHARACTERISTIC represents the interaction, and X is a vector of control variables, defined as the differences in the remaining attributes between the two candidates presented in each choice task.
Specifically, we present results in the next section from analyses examining interaction effects between degree program modality and the following:
- Institution type, given SARA’s intended influence on out-of-state online enrollment
- Institutional selectivity
- Whether the respondent works in an industry aligned with a field of study that has an online presence
- Whether the respondent works at a remote-first organization
Results
Table 4 below presents how often each attribute level was part of the profile of the candidate selected to advance by the respondent. Many of the results align with expectations. Respondents tended to select candidates with more overall work experience, greater proficiency with job-relevant tools and software, and stronger alignment between field of study and job tasks. Candidates who earned their bachelor’s degree in person were also selected slightly more often (51.6 percent) than those with an online bachelor’s degree (48.4 percent). Candidates from in-state public institutions were selected most frequently, whereas candidates from out-of-state for-profits were selected least frequently. As a reminder, a candidate’s institution is categorized as in-state or out-of-state from the perspective of the respondent, not the student.
The one counter intuitive result is related to the institutional selectivity attribute. As expected, candidates from “less selective/open admission” institutions (those that admit more than 85 percent of applicants) were least often chosen. However, while we expected candidates who attended “highly selective” institutions (those that admit less than 50 percent of applicants) to be selected most often and candidates who attended “very competitive” institutions (those that admit between 50 and 75 percent of applicants) to be selected second most often, “competitive” institutions (those that admit between 75 and 85 percent of applicants) were selected most often. This finding may reflect a misunderstanding of how the levels were defined, that hiring managers do not distinguish degree quality among competitive, very competitive, and highly selective institutions, or the possibility that respondents typically hire from institutions they consider to fall within the competitive category.
Table 4. Distribution of Attribute Levels in Selected Candidates
| Match of Field of Study and Job Tasks | |
| Field of study matches job tasks completely | 38.6% |
| Field of study related to job tasks but no exact match | 33.3% |
| Field of study unrelated to job tasks | 28.2% |
| Institution Type | |
| In-state public | 20.7% |
| In-state private not-for-profit | 20.4% |
| Out-of-state public | 19.8% |
| Out-of-state private not-for-profit | 19.9% |
| Out-of-state for-profit | 19.3% |
| Degree Program Modality | |
| In person | 51.6% |
| Online | 48.4% |
| Institutional Selectivity | |
| Less selective/open admissions (admit more than 85 percent of applicants) | 22.7% |
| Competitive (admit between 75 and 85 percent of applicants) | 26.1% |
| Very competitive (admit between 50 and 75 percent of applicants) | 25.4% |
| Highly selective (admit less than 50 percent of applicants) | 25.7% |
| Work Experience | |
| 0 years of relevant work experience | 25.3% |
| 1 year of relevant work experience | 35.0% |
| 2 years of relevant work experience | 39.7% |
| Level of Experience with Job-Relevant Tools and Software | |
| Beginner | 27.4% |
| Intermediate | 34.3% |
| Advanced | 38.3% |
Modest disadvantage for online degrees
Table 5 below presents results of OLS regressions examining whether a candidate is chosen based on various attributes. The results of the regressions reflect average marginal component effects (AMCEs), which show how each level changes the probability, on average, that a profile is chosen relative to the reference level. Figure 2 below the table plots these AMCEs to clearly show how their magnitudes vary across attributes. For each attribute, one level is plotted on the dashed vertical line, which represents the reference level (e.g., in person within the degree program modality attribute). The horizontal solid blue lines represent 95 percent confidence intervals. A lack of overlap between the solid and dashed lines indicates that the results are statistically significant, meaning that the null hypothesis that the attribute level has no effect on selection can be rejected.
As indicated by the asterisks in the table and by the horizontal blue confidence intervals when they do not intersect the vertical line, all AMCEs are statistically significant relative to the reference level, except for the coefficients on the levels within institution type.
The largest spreads across levels are associated with work experience, experience with job-relevant tools and software, and the match between field of study and job tasks, suggesting that differences in candidates’ work experiences and skills are more influential than degree program modality or institution characteristics in hiring managers’ decisions about inviting candidates for an interview. For example, on average, increasing relevant work experience from zero to one year increases the probability that a profile is chosen by 15.3 percentage points, and increasing experience from zero to two years raises the probability by 21.4 percentage points. Similarly, increasing experience with job-relevant tools and software from beginner to intermediate increases the probability by 9.2 percentage points, while increasing experience from beginner to advanced increases the probability by 15.9 percentage points.
The smallest spreads across levels are degree program modality and institution characteristics (selectivity and type, specifically). The predicted probability that a profile with an in-person degree is chosen is 51.3 percent while the predicted probability that a profile with an online degree is chosen is 48.7 percent. In other words, changing the degree program modality from in person to online decreases the probability that a profile is chosen by 2.5 percentage points.[28] For institutional selectivity, the differences between less selective and the three more competitive categories are very similar: moving from less selective to competitive increases the probability of selection by 6.2 percentage points, moving from less selective to very competitive increases the probability by 5.4 percentage points, and moving from less selective to highly selective increases the probability by 5.6 percentage points. This finding suggests that employers discount degrees from less selective schools relative to competitive ones, while making little to no distinction between degrees from more competitive schools.
On the other hand, no levels within institution type are statistically different from the null hypothesis, though the coefficient of out-of-state for-profit is very close to being statistically significant at the 95 percent confidence level. These results suggest that holding all other characteristics constant, institution type alone does not influence hiring managers’ decisions.
Table 5. Average Marginal Component Effects of Candidate Attributes on Selection
| Attribute and Level | Coefficient | Standard Error |
| Match of Field of Study and Job Tasks | ||
| Field of study matches job tasks completely | Reference | – |
| Field of study related to job tasks but not exact match | -0.078*** | (0.01) |
| Field of study unrelated to job tasks | -0.151*** | (0.01) |
| Institution Type | ||
| In-state public | Reference | – |
| In-state private not-for-profit | -0.001 | (0.01) |
| Out-of-state public | -0.018 | (0.01) |
| Out-of-state private not-for-profit | -0.010 | (0.01) |
| Out-of-state for-profit | -0.027 | (0.01) |
| Degree Program Modality | ||
| In person | Reference | – |
| Online | -0.025** | (0.01) |
| Institutional Selectivity | ||
| Less selective/open admissions | Reference | – |
| Competitive | 0.062*** | (0.01) |
| Very competitive | 0.054*** | (0.01) |
| Highly selective | 0.056*** | (0.01) |
| Work Experience | ||
| 0 years of relevant work experience | Reference | – |
| 1 year of relevant work experience | 0.153*** | (0.01) |
| 2 years of relevant work experience | 0.214*** | (0.01) |
| Level of Experience with Job-Relevant Tools and Software | ||
| Beginner | Reference | – |
| Intermediate | 0.092*** | (0.01) |
| Advanced | 0.159*** | (0.01) |
Standard errors adjusted for clusters at the respondent level are in parentheses. * p <0.05, ** p <0.01, *** p <0.001
Figure 2. Average Marginal Component Effects of Candidate Attributes on Selection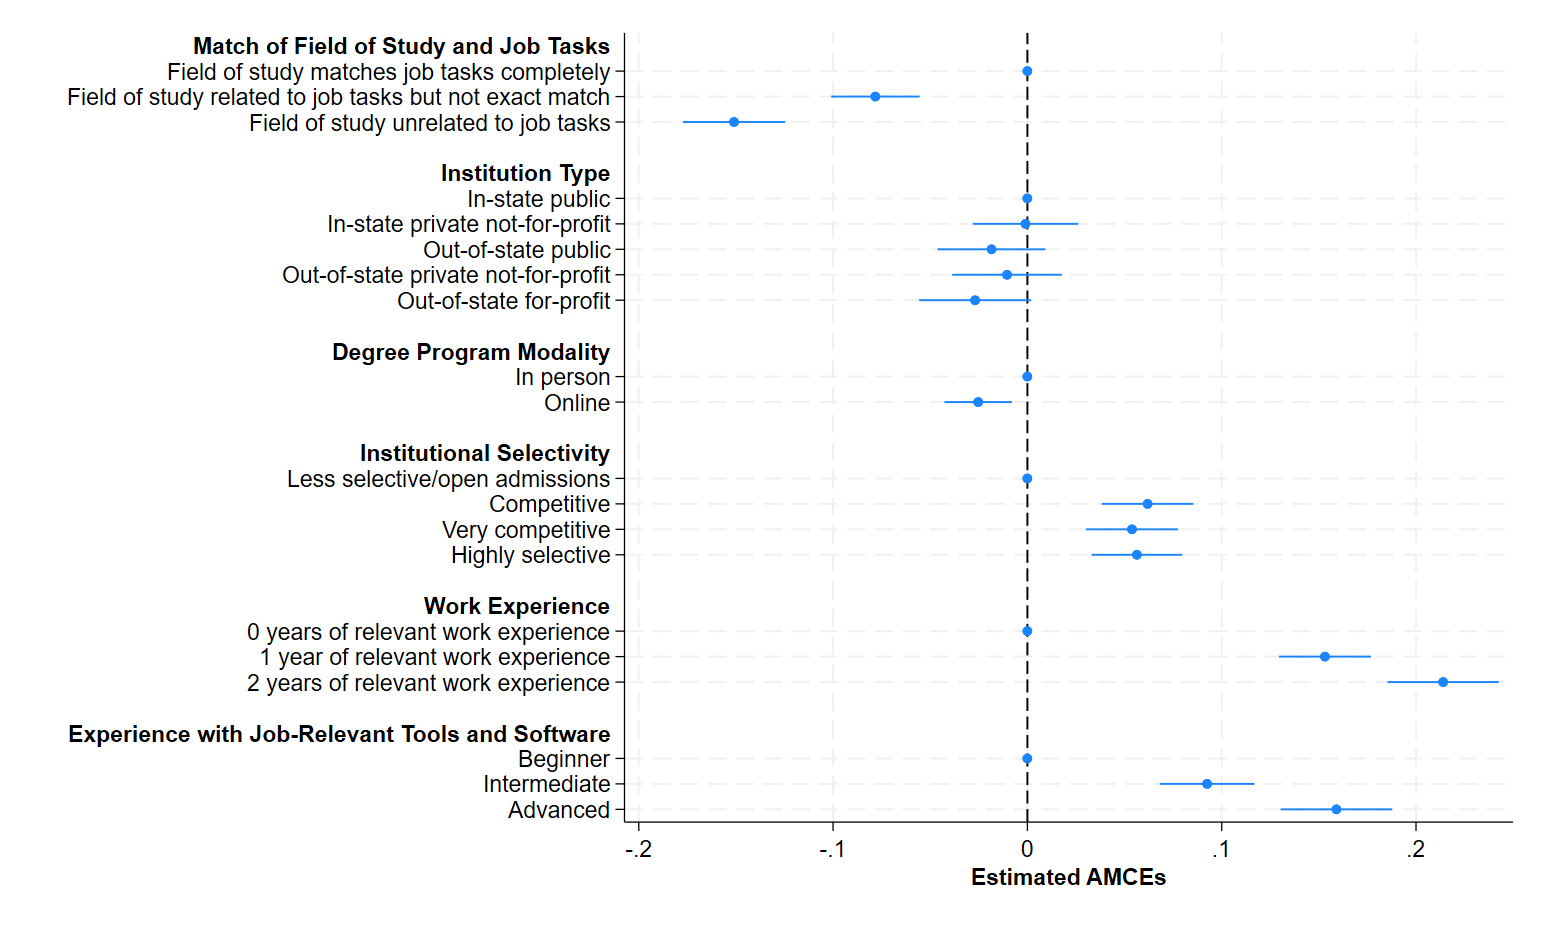
Largest penalty for out-of-state public institutions
The previous analysis of main effects assumes that the effect of degree program modality is constant across institution types. To test whether the importance of degree program modality varies by institution type given SARA’s intended influence on out-of-state online enrollment, we employed the same OLS regression model, this time with an interaction of degree program modality and institution type. As discussed in the Attributes and Levels section, employers and hiring managers may be less familiar with out-of-state institutions and therefore perceive them as lower quality than in-state institutions with which they are more familiar.
Table 6 below presents the results of this analysis. None of the coefficients are statistically significant except for the interaction of online modality and out-of-state public institutions. This interaction indicates that the penalty for earning an online degree from an out-of-state public institution is 5.0 percentage points larger than the penalty for earning an online degree from an in-state public institution.
The addition of the relevant coefficients—online (-0.003), out-of-state public institutions (0.006), and the interaction (-0.05)—indicates that changing a candidate’s profile from an in-person degree earned at an in-state public institution to an online degree earned at an out-of-state public institution decreases the likelihood of selection by 4.7 percentage points.
A more intuitive way to interpret these results is to compare the predicted probabilities of selection for the ten combinations of degree program modality and institution type generated by the OLS model presented in Table 6. These predicted probabilities are presented in Table 7. The results indicate that the penalty for online degrees is largest at out-of-state public institutions. The predicted probability that a profile is chosen when the degree is earned from an in-person program at an in-state public institution is 51.3 percent, compared to 46.6 percent when it is earned online at an out-of-state public institution, a reduction of 4.7 percentage points. Online degrees from out-of-state public institutions are tied with online degrees from out-of-state for-profit institutions for the lowest predicted probability of selection (46.6 percent). In contrast, in-person degrees earned at out-of-state public institutions have the second highest predicted probability of being selected (51.9 percent). These results suggest that degree program modality matters in combination with institution type: hiring managers penalize online degrees when they are earned at out-of-state public institutions.
Table 6. Average Marginal Component Effects on Selection: Degree Program Modality, Institution Type, and Interaction
| Attribute and Level | Coefficient | Standard Error |
| Degree Program Modality | ||
| In person | Reference | – |
| Online | -0.003 | (0.02) |
| Institution Type | ||
| In-state public | Reference | – |
| In-state private not-for-profit | 0.008 | (0.02) |
| Out-of-state public | 0.006 | (0.02) |
| Out-of-state private not-for-profit | -0.006 | (0.02) |
| Out-of-state for-profit | -0.010 | (0.02) |
| Degree Program Modality x Institution Type | ||
| In person x in-state public | Reference | – |
| Online x in-state private not-for-profit | -0.019 | (0.03) |
| Online x out-of-state public | -0.051* | (0.03) |
| Online x out-of-state private not-for-profit | -0.010 | (0.03) |
| Online x out-of-state for-profit | -0.035 | (0.03) |
Standard errors adjusted for clusters at the respondent level are in parentheses. * p <0.05, ** p <0.01, *** p <0.001. The coefficients for the remaining attributes are omitted from the table. Full regression tables are in Appendix D.
Table 7. Predicted Probabilities of Selection: Interaction of Degree Program Modality and Institution Type
| Attribute and Level | Predicted Probability | Standard Error |
| Degree Program Modality x Institution Type | ||
| In person x in-state public | 0.513 | (0.01) |
| In person x in-state private not-for-profit | 0.521 | (0.01) |
| In person x out-of-state public | 0.519 | (0.01) |
| In person x out-of-state private not-for-profit | 0.507 | (0.01) |
| In person x out-of-state for-profit | 0.503 | (0.01) |
| Online x in-state public | 0.510 | (0.01) |
| Online x in-state private not-for-profit | 0.499 | (0.01) |
| Online x out-of-state public | 0.466 | (0.01) |
| Online x out-of-state private not-for-profit | 0.495 | (0.01) |
| Online x out-of-state for-profit | 0.466 | (0.01) |
Penalties for online degrees do not vary by institutional selectivity
To test whether the importance of degree program modality varies by institutional selectivity, we employed the same OLS model described in the main effects section, this time with an interaction of degree program modality and institutional selectivity. One possibility is that online degrees earned from more competitive and prestigious institutions may be perceived as comparable in quality to in-person degrees from these institutions, whereas online degrees earned from open access may not be viewed in similar ways.
Table 8 below presents the results of that analysis. None of the coefficients on the interaction of institutional selectivity and degree program modality are statistically significant, while the coefficients on the levels within each attribute remain statistically significant.[29] These findings suggest that hiring managers’ perceptions of online degrees do not vary by the selectivity of the institution where the degree was earned. Instead, candidates face a) a penalty for earning an online degree that is constant across selectivity levels and b) an advantage for earning a degree from a more selective institution, an advantage that is unaffected by whether the degree was earned in person or online. The combination with highest predicted probability of selection is earning an in-person degree from a competitive institution (53.9 percent) and the combination with the lowest predicted probability is earning an online degree from a less selective institution (44.0 percent).
Table 8. Average Marginal Component Effects on Selection: Degree Program Modality, Institutional Selectivity, and Interaction
| Attribute and Level | Coefficient | Standard Error |
| Degree Program Modality | ||
| In person | Reference | – |
| Online | -0.033* | (0.02) |
| Institutional Selectivity | ||
| Less selective/open admissions | Reference | – |
| Competitive | 0.065*** | (0.02) |
| Very competitive | 0.044** | (0.02) |
| Highly selective | 0.048** | (0.02) |
| Degree Program Modality x Institutional Selectivity | ||
| In person x less selective/open admissions | Reference | – |
| Online x competitive | -0.007 | (0.02) |
| Online x very competitive | 0.020 | (0.02) |
| Online x highly selective | 0.017 | (0.02) |
Standard errors adjusted for clusters at the respondent level are in parentheses. * p <0.05, ** p <0.01, *** p <0.001. The coefficients for the remaining attributes are omitted from the table. Full regression tables are in Appendix D.
Penalties for online degrees driven by industries with limited online presence
There is also the question of whether perceptions of online degree holders vary by employer industry, which has practical implications for learners deciding which fields of study to pursue in college. The survey did not target hiring professionals in specific industries, in part because doing so would have made it difficult to recruit a sufficiently large sample. We also did not specify in the survey instructions the field of study in which a candidate earned their bachelor’s degree.
However, the survey did include follow-up questions about respondents and their employers, allowing for analysis by industry. One pattern worth investigating is whether employer perceptions differ depending on whether an employer operates in an industry aligned with fields of study that have a strong online degree presence—those fields of study in which a relatively large share of degrees is earned online. Hiring managers in these industries may be more accustomed to seeing applicants with online degrees and may view them as a more common and acceptable pathway into the industry and occupation. This level of familiarity may lead them to view online degrees as comparable in quality to in-person degrees. This has important practical implications. If online degrees are viewed unfavorably primarily in industries where pursuing an online pathway is uncommon, then the overall average negative effect identified in earlier analyses may be less relevant for a subset of online learners.
Drawing on findings from our previous report on in-state and out-of-state online enrollment before and after SARA, the three most common fields of study (out of a total of 45) for students earning online degrees across state lines are Business, Management and Marketing; Health Professions and Related Programs; and Education. While these fields do not perfectly map to the 15 industries included in our survey, three industry sectors align most closely: Business and Finance; Health Science and Medical Technology; and Education, Child Development, and Family Services. Using this mapping, we grouped respondents working in these three industries into a “strong online presence” category and all remaining respondents into a “limited online presence” category.[30]
To test whether the importance of degree program modality varies by whether a respondent is in an industry aligned with a field of study that has an online presence, we employed the same OLS model described in the main effects section, this time with an interaction of degree program modality and an indicator for online presence.
Table 9 below presents the results. The coefficient of online indicates that among respondents who work in industries aligned with fields of study that have a limited online presence, changing a candidate’s degree from in person to online decreases the predicted probability of selection from 51.9 percent to 48.0 percent, representing a decline of 3.9 percentage points, 2.4 percentage points more than the difference across the entire sample. In contrast, the coefficient of the interaction of degree program modality and online presence is nearly identical in magnitude to the main effect but opposite in sign. This indicates that among respondents who work in industries aligned with fields of study that do have an online presence, there is no statistically significant difference in the selection of candidates with online and in-person degrees (-0.039+0.038). These findings support our hypothesis that respondents who may be less familiar with online degrees impose a greater penalty on candidates who hold them. The implications of this are explored in more detail in the Discussion section.
Table 9. Average Marginal Component Effects on Selection: Degree Program Modality, Online Presence, and Interaction
| Attribute and Level | Coefficient | Standard Error |
| Degree Program Modality | ||
| In person | Reference | – |
| Online | -0.039*** | (0.01) |
| Online Presence | ||
| Limited | Reference | – |
| Strong | -0.018 | (0.01) |
| Degree Program Modality x Online Presence | ||
| In person x limited | Reference | – |
| Online x strong | 0.038* | (0.02) |
Standard errors adjusted for clusters at the respondent level are in parentheses. * p <0.05, ** p <0.01, *** p <0.001. The coefficients for the remaining attributes are omitted from the table. Full regression tables are in Appendix D.
No differences by whether organizations are remote-first
We also employed the same OLS model described in the main effects section, this time with an interaction of degree program modality and whether the respondent worked at a remote-first organization. We hypothesized that hiring professionals at remote-first organizations would be less likely to penalize online degrees. Their familiarity with remote work and online collaboration may lead them to view online and in-person degrees as comparable in quality.
While respondents at non-remote-first organizations impose a larger penalty on online degrees (3 percentage points) than those at remote-first organizations (1 percentage point), this difference is not statistically significant. As a result, we are unable to reject the null hypothesis that the effect of degree program modality on the likelihood of selection varies across these respondent groups. Full regression tables are in Appendix D.
Discussion
Overall, we find that individuals who earned their degree online face a slight disadvantage when applying for a job. On average, changing the degree program modality from in person to online decreases the probability that a profile is chosen by 2.5 percentage points, all else equal. By comparison, having more years of work experience, including with job-relevant tools and software, and studying in a field aligned with the requirements of the position were more influential in the probability of selection. These results suggest that differences in candidates’ work experiences and skills play a substantially larger role in hiring managers’ decisions on inviting candidates for an interview than degree program modality and institution type.
These results suggest that differences in candidates’ work experiences and skills play a substantially larger role in hiring managers’ decisions on inviting candidates for an interview than degree program modality and institution type.
Because this is a novel study, there are a limited number of studies to compare our findings with prior research. The most closely related work consists of resume audit studies that examine the relationship between degree program modality and the likelihood of selection for a job interview. “The Value of Postsecondary Credentials in the Labor Market: An Experimental Study,” found that candidates with a bachelor’s in business from a for-profit online institution are about two percentage points, or 22 percent, less likely to receive a callback than similar candidates with degrees from nonselective public institutions.[31] While this estimate represents the combined effect of both online degree and the for-profit sector, differences in callback rates between the baseline group and other for-profit types were not statistically significant. Connor Lennon used a resume audit study focused on recent undergraduates graduates and found larger differences: applicants with a traditional in-person degree were nearly twice as likely to receive a callback as those with an online degree (15.6 vs. 8.3 percent).[32] In contrast, Christopher T. Bennett, studying MBA applicants, found no statistically significant differences in callback rates across various MBA program types, including those earned online.[33]
To compare our results to prior studies, we report the percent decrease in the probability of being selected (4.9 percent) rather than the percentage point decrease (2.5 percentage points), since our study has a much higher baseline rate (50 percent) than resume audit studies (typically less than 10 percent chance). Expressing results as relative percent changes rather than absolute percentage point changes makes effect sizes more comparable across studies with different baseline rates. Our effect of 4.9 percent is much smaller than the 22 percent found in Deming et al. and the nearly 50 percent effect found in Lennon. Even with the adjustment to a percent change, there are reasons to be cautious when comparing these effect sizes. The effect sizes from the three audit studies referenced above are based on relatively low baseline callback rates, which can make treatment differences appear larger than they would in other contexts with higher baseline rates.
The average effect of 2.5 percentage points across all candidate profiles masks important differences across both candidate attributes and respondent characteristics. Further analyses indicate that this effect is driven by the type of institution that awarded the degree. Hiring managers penalize online degrees when they are earned at out-of-state public institutions specifically. On average, changing a profile from an in-person program at an in-state institution to an online program at an out-of-state public institution reduces the probability that the profile is chosen by 4.7 percentage points. The comparison of predicted probabilities provides additional evidence that the penalty for online degrees is largest at out-of-state public institutions.
By contrast, hiring managers’ perceptions of degree program modality do not vary by the selectivity of the institution that awarded the degree. Instead, the two effects operate separately: candidates are disadvantaged for earning a degree online and advantaged for earning a degree from a more selective institution. In other words, the magnitude of the online penalty does not differ across levels of selectivity. As a result, earning an online degree from a less selective institution yields the lowest predicted probability of selection.
We also find evidence that the respondents driving this result work in industries where candidates with online degrees are less commonly reviewed. Among respondents who work in industries aligned with fields of study that do not have a strong online presence, candidates with in-person degrees are viewed more favorably than those with online degrees. In contrast, among respondents who work in industries aligned with fields of study that have a strong online presence, there is no evidence that candidates with online degrees are perceived differently than those with in-person degrees.
Substantive significance
Another important question is whether the effects that we estimated are substantively meaningful. In practical terms, what does it mean for candidates to be 2.5 percentage points or 4.9 percent less likely to be selected when outcomes of interest are binary, candidates are either selected or not, and candidates often apply to many jobs?
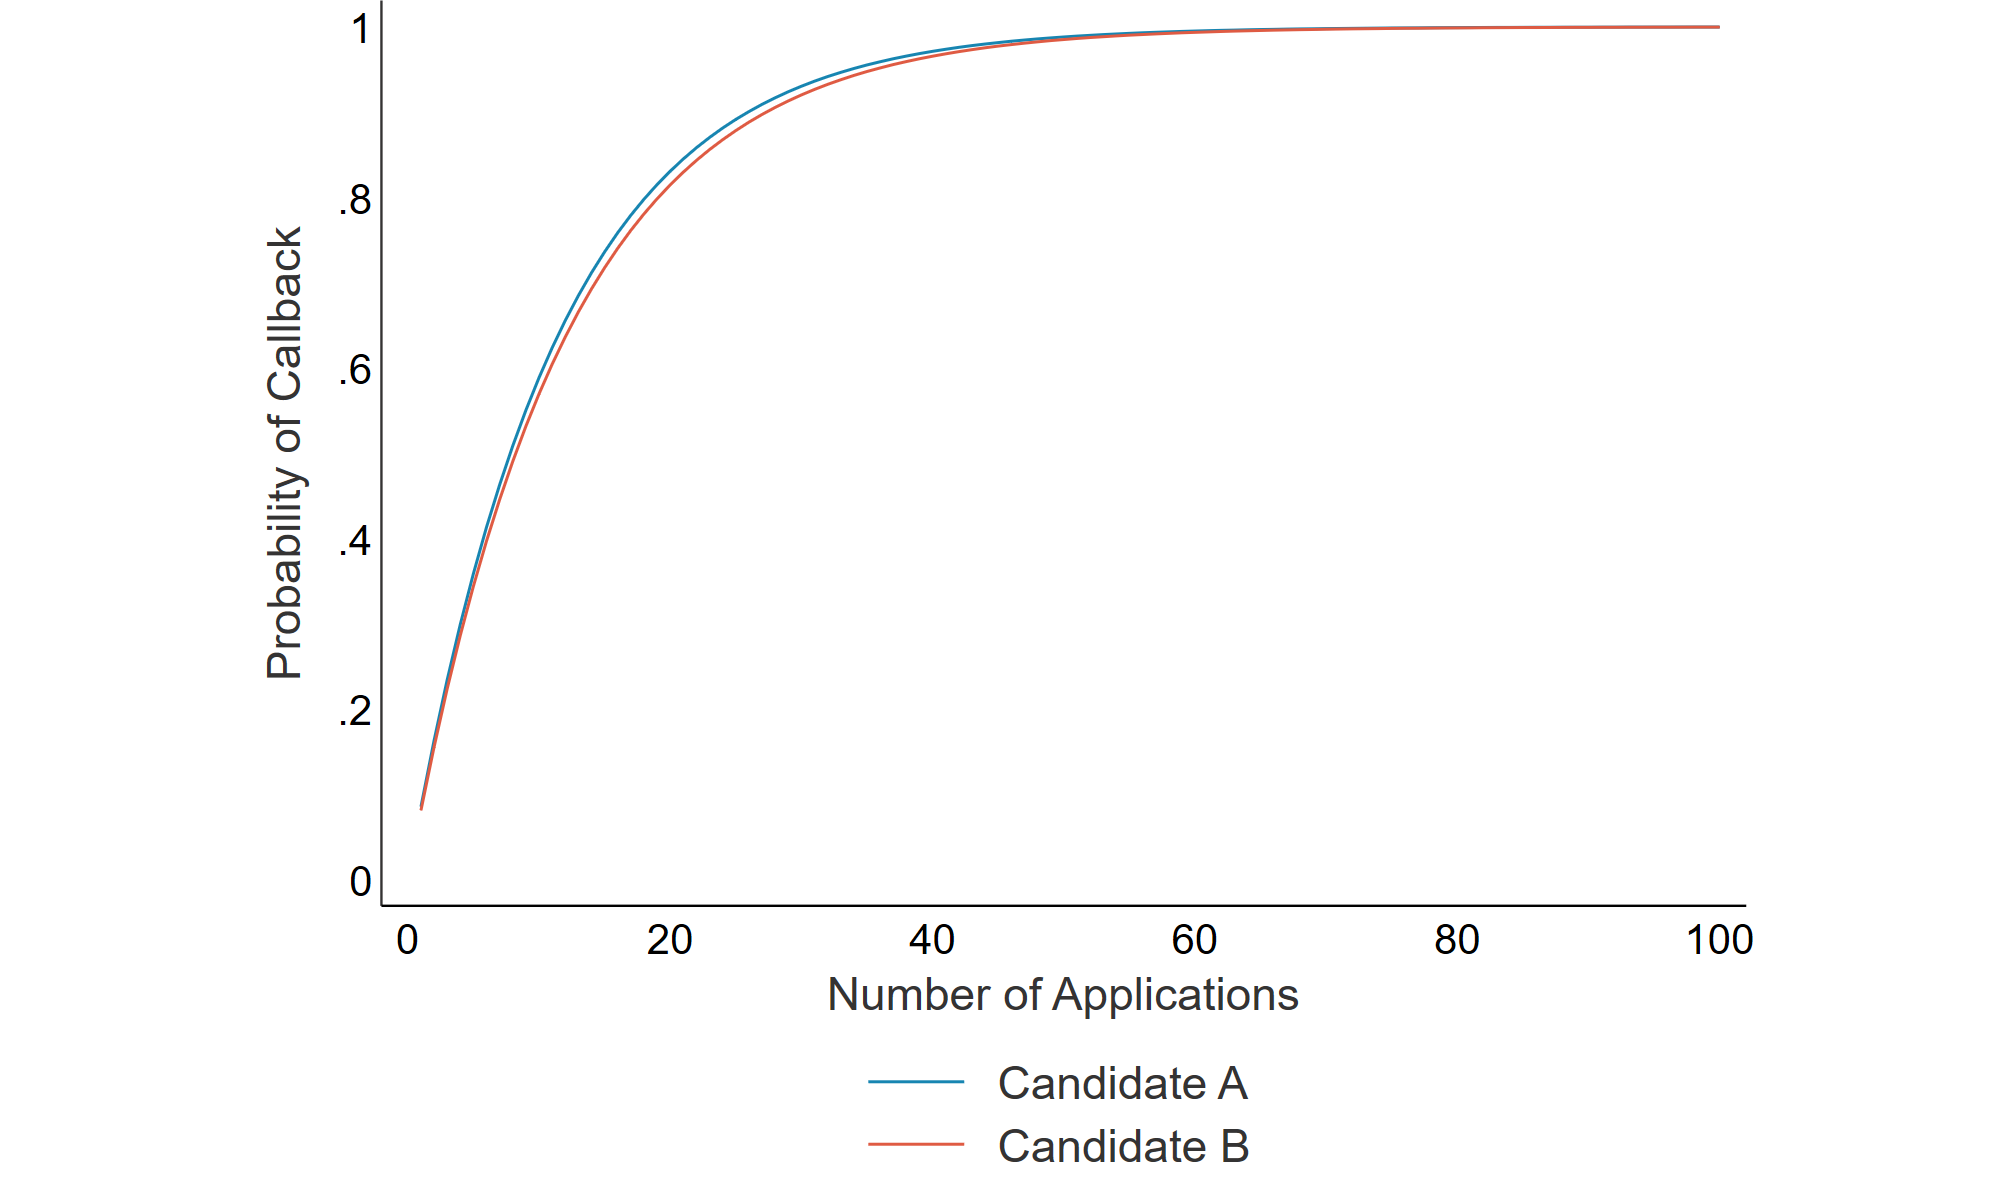
One way to understand these results is to calculate the probability of an applicant receiving at least one callback, conditional on the number of applications and average callback rate, using the following formula:
p = 1 − p(no callbacks)n
Where p is the probability of receiving at least one callback, p(no callbacks) is the probability of receiving no callbacks based on an average callback rate, and n is the number of applications. For the purposes of this discussion, we assume that the average callback rate for a candidate with an in-person degree is 8.5 percent, which is based on Deming et al.’s finding that bachelor’s degree recipients from both nonselective and selective public institutions (with no indication that their degree was earned online) received callbacks at this rate. This means that the probability of no callback from a single application is 91.5 percent. Applying our estimate that candidates who earn their degree online are 4.9 percent less likely to receive a callback, the callback rate of a candidate with an online degree is 8.08 percent, resulting in a 91.92 percent probability of no callback from a single application.
Figure 3 below plots the probability of receiving at least one callback based on the number of applications submitted and the applicant’s average callback rate for two candidates: Candidate A, who earned an in-person degree, and Candidate B, who earned an online degree. The gap in predicted probabilities is very small, and once the number of applications hits 30 or more, the lines become hard to distinguish. For example, if each applicant submits 40 applications, the probability that the average candidate with an in-person degree receives at least one callback is 97.1 percent, compared to 96.6 percent for the average candidate with an online degree, a difference of just 0.5 percentage points. Assuming that recent college graduates typically submit dozens of applications, this finding further diminishes the practical importance of the online penalty identified in the study.
Figure 3. Callback Probability by Number of Applications
Limitations
The most commonly cited limitation of DCEs is that they elicit stated rather than revealed preferences. This is a problem because respondents who are aware that they are participating in a study may alter their responses, including in ways they perceive to be more socially acceptable, which can be different from their actual thoughts, decisions, and behaviors. Additionally, DCEs typically do not generate strong incentives for respondents to carefully consider their true preferences since their choices carry no real consequences in these hypothetical scenarios. In contrast, research designs in which participants are not aware that they are being studied, like a resume audit study, typically elicit revealed preferences, in part because participants believe there are real stakes in their choices.[34] It is worth noting that the specific concern that respondents may alter their responses to appear more socially acceptable is unlikely in this study given that it does not elicit preferences related to candidates’ gender, race, or socioeconomic status.
Relatedly, DCEs create scenarios that do not fully mirror how hiring decisions are made in practice. In the real world, hiring managers are not presented with two candidates and required to choose one to interview. In addition, similar to resume audit studies, the study’s primary outcome of interest captures only the first stage of the hiring process, an initial interview invite. It does not measure final hiring decisions and therefore does not account for other factors that influence these decisions, including soft skills evaluated during interviews.
Further, some of the information included in the hypothetical profiles may not be easily deduced from resumes. For instance, hiring managers may not know that a candidate’s degree was earned online if it was awarded by an institution that does not have a reputation for conferring such degrees and if the resume does not explicitly indicate modality.[35] Indeed, standard resume practice does not require applicants to disclose whether a degree was earned online, and hiring professionals we interviewed note that this information is rarely explicitly indicated. Additionally, hiring managers often lack complete and accurate information to assess the alignment between candidates’ field of study and the job tasks and their level of experience across all job-relevant tools and software.
Additionally, our design intentionally avoided using real institution names to ensure portability across respondents in different states. This limits our ability to assess the role of institutional reputation or name recognition beyond using institutional selectivity as an imperfect proxy. For example, well-known public flagships, especially those in geographically proximate states, are likely perceived differently than “generic” out-of-state public institutions.
Another limitation is that the sample of respondents may not be nationally representative of professionals who are responsible for hiring decisions, a threat to external validity. The limited information we collected on the sample suggests it is not representative of professionals more broadly. See the Final Study Sample section for more information on the study sample. It is difficult to assess the extent of this limitation given the lack of a comprehensive data source describing the characteristics of professionals responsible for hiring decisions.
The final limitation relates to the presentation of hypothetical candidates to respondents in industries where such profiles are unlikely. This concern is explored in our comparison of respondents working in industries aligned with fields of study that have a relatively large online presence compared to those that do not. For example, hiring managers for architecture firms are less likely to review candidates with online degrees. As such, presenting such profiles may represent an unrealistic hypothetical, potentially leading to an overestimate of the practical effect of the penalty associated with online degrees.
Policy and stakeholder implications
This study is, to our knowledge, the first to rigorously examine whether employers treat online degrees differently when they are awarded by out-of-state institutions, the type of credential that SARA makes more accessible by reducing regulatory barriers to interstate enrollment. The central policy question is whether expanded access is leading students toward credentials that employers value.
Our findings indicate that candidates’ work experiences and skills play a substantially larger role in hiring managers’ decisions than degree program modality and institution type. That said, candidates with online degrees face a modest disadvantage, and this penalty is largest for degrees earned from out-of-state public institutions. Employer industry plays an important role too. Hiring professionals in industries aligned with fields of study that have a strong online presence do not penalize candidates with online degrees; however, hiring professionals in industries where online credentials are less common do penalize these candidates. Nationally, students are somewhat evenly split between fields with strong and limited online presence, so the small disadvantage for earning a degree online applies to about half of online students, specifically those in fields where such degrees are uncommon. The other half of online students, those in fields where such degrees are more common, face no penalty.
For states. The modest and relatively small penalty for earning an online degree does not necessarily argue against SARA. Using online modalities to expand access to postsecondary credentials remains valuable, especially for students who otherwise would not enroll. But the results do suggest that state higher education agencies should consider whether there are ways to help students understand how employers in their region perceive specific credentials, and whether institutions enrolling out-of-state students through online programs are providing adequate, tailored career support. For example, states should focus more attention on policies that expand opportunities to gain relevant work experience, such as promoting apprenticeship programs, given the significant role work experience plays in hiring managers’ decisions. This is especially relevant in fields where online degrees are uncommon, since our findings suggest that employer skepticism may be higher in those areas.
For institutions. Public institutions that enroll students across state lines should be aware that the labor market signal of their degrees may be weaker in regions where employers are unfamiliar with their institution. Building name recognition and employer relationships in the markets where out-of-state students are likely to seek employment after graduation could improve students’ labor market outcomes. Additionally, career advising for distance education students should account for the fact that these students may be entering labor markets where the institution is less known.
For students. SARA can expand access to higher education for working adults, caregivers, and others for whom geography or scheduling makes in-person enrollment difficult. That access is especially valuable for students whose most likely alternative is not enrolling at all. For these students, earning a credential that carries a modest penalty in the labor market can still lead to a net positive outcome. At the same time, students choosing among online programs should consider practical questions such as: Is the institution likely to be known by employers in my area? Is online education common in my field? How does this institution present itself to employers outside the state? Additionally, our findings suggest that the labor market penalty we observe may be concentrated among employers who can identify an online degree from the information on a resume. Students who follow standard resume conventions by not listing degree modality may face less scrutiny at the application stage.
In sum, our findings suggest that degrees facilitated by SARA are not viewed identically to traditional in-person, in-state credentials, nor are they heavily discounted. If SARA enables students to earn degrees they otherwise would not have pursued, even a credential that employers slightly discount may still leave those students better off.
Appendix A: Sample size and power
Sufficient sample size is needed to ensure statistical power and reduce the risk of false negatives. According to Rich Johnson and Bryan Orme, the minimum sample size needed to estimate main effects for discrete choice experiments is:
n ≥ 500c/(ta)
where t is the number of choice tasks per respondent, a is the number of candidates per choice task, and c is the largest number of levels for a single attribute.[36] Consistent with the literature, and to balance sample size and statistical power with respondent burden from survey length, we decided to present 12 choice tasks, each featuring two candidates per task, a design commonly used in DCEs. Given the maximum number of levels for any single attribute was five, a minimum sample of 105 was sufficient for main or average effects.[37]
In addition to analyzing main effects, we planned to use interaction effects to assess whether outcomes varied across combinations of levels, with a focus on the combination of degree program modality and institution type. In this case, c is equal to the largest product of levels of any two attributes. Assuming 12 choice tasks, two candidates per task, and a product of 20 (one attribute with a maximum of five levels and one attribute with a maximum of four levels), a minimum sample of 417 was sufficient for interaction effects. Based on these results, we planned to survey at least 500 respondents who met the study criteria to ensure sufficient power to estimate both main and interaction effects.
Appendix B: Diagnostic tests of key assumptions
Hainmueller, Hopkins, and Yamamoto’s argument that OLS regressions can consistently estimate the causal effects of individual attribute levels relies on several key assumptions. We review each of these assumptions and, where possible, test them empirically.
Assumption 1: There are no carryover effects.
The first assumption is that there are no carryover effects. In other words, respondents would make the same choice when presented with the same two profiles, regardless of which profiles they have already seen or will subsequently see. One way to test this assumption is to examine whether AMCEs vary by rounds of choice tasks. To do this, we employed the same OLS regression model as described in previous sections, this time including an interaction of degree program modality and indicators for each of the 12 choice tasks. We then conducted an F-test of the null hypothesis that the AMCEs for degree program modality are identical across choice tasks. Table 10 below presents the AMCEs of the interaction effect only.
Table 10. Average Marginal Component Effects on Selection: Interaction of Degree Program Modality and Choice Task
| Attribute and Level | Coefficient | Standard Error |
| Degree Program Modality x Choice Task | ||
| In person x 1 | Reference | – |
| Online x 2 | -0.020 | (0.04) |
| Online x 3 | 0.014 | (0.04) |
| Online x 4 | 0.017 | (0.04) |
| Online x 5 | -0.047 | (0.04) |
| Online x 6 | 0.047 | (0.04) |
| Online x 7 | 0.028 | (0.04) |
| Online x 8 | 0.007 | (0.04) |
| Online x 9 | -0.001 | (0.04) |
| Online x 10 | -0.011 | (0.04) |
| Online x 11 | 0.035 | (0.04) |
| Online x 12 | -0.005 | (0.04) |
Standard errors adjusted for clusters at the respondent level are in parentheses. * p <0.05, ** p <0.01, *** p <0.001. The coefficients for the remaining attributes are omitted from the table. Full regression tables are in Appendix D.
Based on the results of the F-test, we cannot reject the null hypothesis that degree program modality effects are identical across choice tasks (p-value=0.70). Therefore, we find no evidence of carryover effects, and the first assumption holds.
Assumption 2: There are no profile order effects.
The second assumption is the absence of profile order effects. This means that respondents ignore the order in which profiles are presented in a choice task, such that estimated AMCEs are similar whether the attribute appears in the first or the second profile. To test this, we employed the same OLS regression model as described in previous sections, this time with an interaction of degree program modality and an indicator for whether the profile is presented first or second. We then conducted an F-test of the null hypothesis that the AMCEs for degree program modality are identical across choice tasks. Table 11 below presents the AMCEs of the interaction effect only.
Table 11. Average Marginal Component Effects on Selection: Interaction of Degree Program Modality and Profile Order
| Attribute and Level | Coefficient | Standard Error |
| Degree Program Modality x Profile Order | ||
| In person x 1 | Reference | – |
| Online x 2 | 0.028 | (0.02) |
Standard errors adjusted for clusters at the respondent level are in parentheses. * p <0.05, ** p <0.01, *** p <0.001. The coefficients for the remaining attributes are omitted from the table. Full regression tables are in Appendix D.
Because profile order is binary, the F-test is equal to the p-value of the interaction term, which is 0.11. Based on the results of the F-test, we cannot reject the null hypothesis that degree program modality effects are the same across profile positions. Therefore, we find no evidence of profile order effects, and the second assumption holds.
Assumption 3: Randomization produces experimental groups that are well balanced.
In general, as Hainmueller, Hopkins, and Yamamoto explain, this assumption is expected to hold because a key feature of the study design is the randomization of attribute levels presented in each candidate profile. However, it is worth confirming that randomization produces groups that are well balanced. One way to assess balance is to regress respondent characteristics on indicators for all profile attributes, excluding the indicator for whether a profile is chosen. We conducted this regression separately for the following respondent characteristics: whether the respondent’s highest degree earned is a high school diploma, whether the respondent works at a remote-first organization, and whether the respondent works in an industry that is aligned with a field of study that has a relatively strong online presence.[38] For each regression, we then conducted an F-test of the null hypothesis that the profile attributes are jointly balanced across groups. The resulting p-values were 0.84, 0.14, and 0.72. Therefore, we cannot reject the null hypothesis and find no evidence that the experimental groups are imbalanced. The third assumption holds.
Assumption 4: There are no attribute order effects.
This assumption is that the estimated AMCEs do not vary based on the order in which an attribute appears within a choice task. In our study, however, the order of attributes was not randomized: the order shown in Table 2 is the same across all choice tasks. However, there is reason to believe that this does not pose a problem. According to Hainmueller, Hopkins, and Yamamoto, prior research suggests that attribute order effects tend to appear only when the number of attributes exceeds ten, which is significantly more than the six used in our study.
Assumption 5: Atypical profiles don’t cause respondents to act differently.
One potential threat to external (but not internal) validity is the realism of profiles presented to respondents. A common issue is the inclusion of combinations of attributes that are impossible or extremely rare. To address this, researchers sometimes impose constraints to prevent certain combinations from appearing in profiles. We did not impose any such constraints because we did not identify any combinations as impossible or impractical.
With that said, the combination that yields the most unlikely profile is fully online degrees offered at highly selective institutions, defined in this study as those admitting fewer than 50 percent of applicants. While fully online degrees at highly selective institutions are uncommon, they do exist. One example is the University of Florida, which offers fully online bachelor’s degrees and has an acceptance rate of around 20 percent.
Including such profiles can violate external validity if respondents react differently to atypical combinations than they would to more common ones. To assess this, we conducted the same OLS regression model as described in previous sections, with one consisting of typical profiles only and one consisting of atypical profiles only (i.e., choice tasks in which at least one of the profiles includes the combination of online and highly selective institutions). The results of the two regressions are similar. Table 12 below presents the AMCEs of degree program modality only.
Table 12. Average Marginal Component Effects on Selection: Degree Program Modality for Typical vs. Atypical Profiles
| Attribute and Level | Typical Profiles | Atypical Profiles | ||
| Coefficient | Standard Error | Coefficient | Standard Error | |
| Degree Program Modality | ||||
| In person | Reference | – | Reference | – |
| Online | -0.027* | (0.01) | -0.024 | (0.02) |
Standard errors adjusted for clusters at the respondent level are in parentheses. * p <0.05, ** p <0.01, *** p <0.001. The coefficients for the remaining attributes are omitted from the table. Full regression tables are in Appendix D.
We also employed the same OLS regression model as described in previous sections, this time with an interaction of degree program modality and an indicator for whether the profile is atypical. The F-test yields a p-value of 0.95, indicating that we cannot reject the null hypothesis that the AMCEs for degree program modality are identical for typical and atypical profiles. These results suggest that respondents do not react differently to the inclusion of this atypical combination. Full regression tables are in Appendix D.
Appendix C: Understanding effects using separate models
An alternative way to examine the role that degree program modality plays in the likelihood of selection is to estimate the same OLS model separately for candidates who earned their degree in person and those who earned their degree online. This method allows us to compare AMCEs of the two groups side-by-side. However, a key step when using separate models is that statistically significant differences in coefficients across models cannot be assumed. Instead, a formal test is required to determine whether differences are statistically significant.
Table 13 below presents the coefficients for the five remaining attributes among candidates with in-person and online degrees. Figure 4 visually presents these AMCEs for both candidate types. The coefficients on match of field of study and job tasks, institutional selectivity, work experience, and experience with job-relevant tools and software are statistically significant in both models and their magnitudes are similar. Formal tests confirm that these effects do not differ significantly, with one exception: the effect of increasing work experience from zero to one year differs across models (p-value 0.03). This finding suggests that candidates who earned their degree in person receive a larger marginal return from one year of work experience than those who earned their degree online. Outside of this effect, these findings suggest that preferences along these dimensions are largely consistent across degree program modality.
None of the coefficients for institution type are statistically significant among candidates who earned their degree in person. In contrast, among candidates who earned their degree online, the coefficients for out-of-state public and out-of-state for-profit institutions are negative and statistically significant. While the coefficient of out-of-state for-profit institutions is statistically significant in only one model, a formal test indicates that the difference between the coefficients is not statistically significant (p-value=0.21).
Table 13. Average Marginal Component Effects of Candidate Attributes on Selection: In-Person vs. Online Degrees
| Attribute and Level | In-Person Degrees | Online Degrees | ||
| Coefficient | Standard Error | Coefficient | Standard Error | |
| Match of Field of Study and Job Tasks | ||||
| Field of study matches job tasks completely | Reference | – | Reference | – |
| Field of study related to job tasks but not exact match | -0.076*** | (0.02) | -0.080*** | (0.02) |
| Field of study unrelated to job tasks | -0.154*** | (0.02) | -0.148*** | (0.02) |
| Institution Type | ||||
| In-state public | Reference | – | Reference | – |
| In-state private not-for-profit | 0.008 | (0.02) | -0.010 | (0.02) |
| Out-of-state public | 0.006 | (0.02) | -0.044* | (0.02) |
| Out-of-state private not-for-profit | -0.006 | (0.02) | -0.015 | (0.02) |
| Out-of-state for-profit | -0.010 | (0.02) | -0.044* | (0.02) |
| Institutional Selectivity | ||||
| Less selective | Reference | – | Reference | – |
| Competitive | 0.065*** | (0.02) | 0.058*** | (0.02) |
| Very competitive | 0.044** | (0.02) | 0.063*** | (0.02) |
| Highly selective | 0.047** | (0.02) | 0.064*** | (0.02) |
| Work Experience | ||||
| 0 years of relevant work experience | Reference | – | Reference | – |
| 1 year of relevant work experience | 0.175*** | (0.02) | 0.130*** | (0.02) |
| 2 years of relevant work experience | 0.228*** | (0.02) | 0.199*** | (0.02) |
| Level of Experience with Job-Relevant Tools and Software | ||||
| Beginner | Reference | – | Reference | – |
| Intermediate | 0.081*** | (0.02) | 0.104*** | (0.02) |
| Advanced | 0.162*** | (0.02) | 0.155*** | (0.02) |
Standard errors adjusted for clusters at the respondent level are in parentheses. * p <0.05, ** p <0.01, *** p <0.001
Figure 4. Average Marginal Component Effects of Candidate Attributes on Selection: In-Person vs. Online Degrees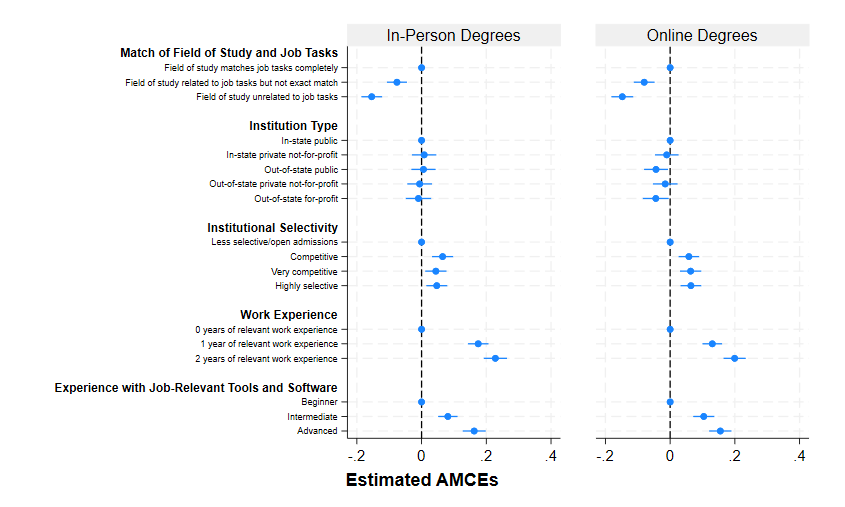
We employed a similar approach to alternatively estimate the difference in selection depending on whether respondents were in industries aligned with fields of study with an online presence.
Table 14 below presents the coefficients by group and Figure 5 plots these estimates. Because the coefficients for the four attributes other than degree program modality and institution type are very similar to those from previous models, they are omitted from this table.
The two models yield essentially opposite results. Among respondents who work in industries aligned with fields of study that have a strong online presence, there is no evidence that candidates with online degrees are perceived differently than those with in-person degrees. Instead, these respondents differentiate candidates based on institution type. On average, changing a profile from an in-state public institution to an out-of-state public institution decreases the likelihood of being selected by 9.4 percentage points. An additional test confirms that the difference in coefficients between the two models are statistically significant (p-value=<0.01). However, the difference between coefficients of out-of-state for-profit institutions across the two models is not statistically significant (p-value=0.10).
In comparison, respondents working in industries aligned with fields of study that do not have an online presence appear to penalize candidates with online degrees, while not differentiating degrees by institution type. Changing a profile from an in-person bachelor’s degree to an online degree reduces the likelihood of being selected by 4.0 percentage points, on average. An additional test confirms that the difference in coefficients between the two models are statistically significant (p-value=0.03).
Table 14. Average Marginal Component Effects on Selection: Degree Program Modality and Institution Type for Limited vs. Strong Online Presence
| Attribute and Level | Limited Online Presence | Strong Online Presence | ||
| Coefficient | Standard Error | Coefficient | Standard Error | |
| Degree Program Modality | ||||
| In person | Reference | – | Reference | – |
| Online | -0.040*** | (0.01) | -0.001 | (0.01) |
| Institution Type | ||||
| In-state public | Reference | – | Reference | – |
| In-state private not-for-profit | 0.011 | (0.02) | -0.022 | (0.02) |
| Out-of-state public | 0.024 | (0.02) | -0.094*** | (0.02) |
| Out-of-state private not-for-profit | 0.003 | (0.02) | -0.034 | (0.03) |
| Out-of-state for-profit | -0.008 | (0.02) | -0.061* | (0.03) |
Standard errors adjusted for clusters at the respondent level are in parentheses. * p <0.05, ** p <0.01, *** p <0.001. The coefficients for the remaining attributes are omitted from the table. Full regression tables are in Appendix D.
Figure 5. Average Marginal Component Effects of Candidate Attributes on Selection: Limited vs. Strong Online Presence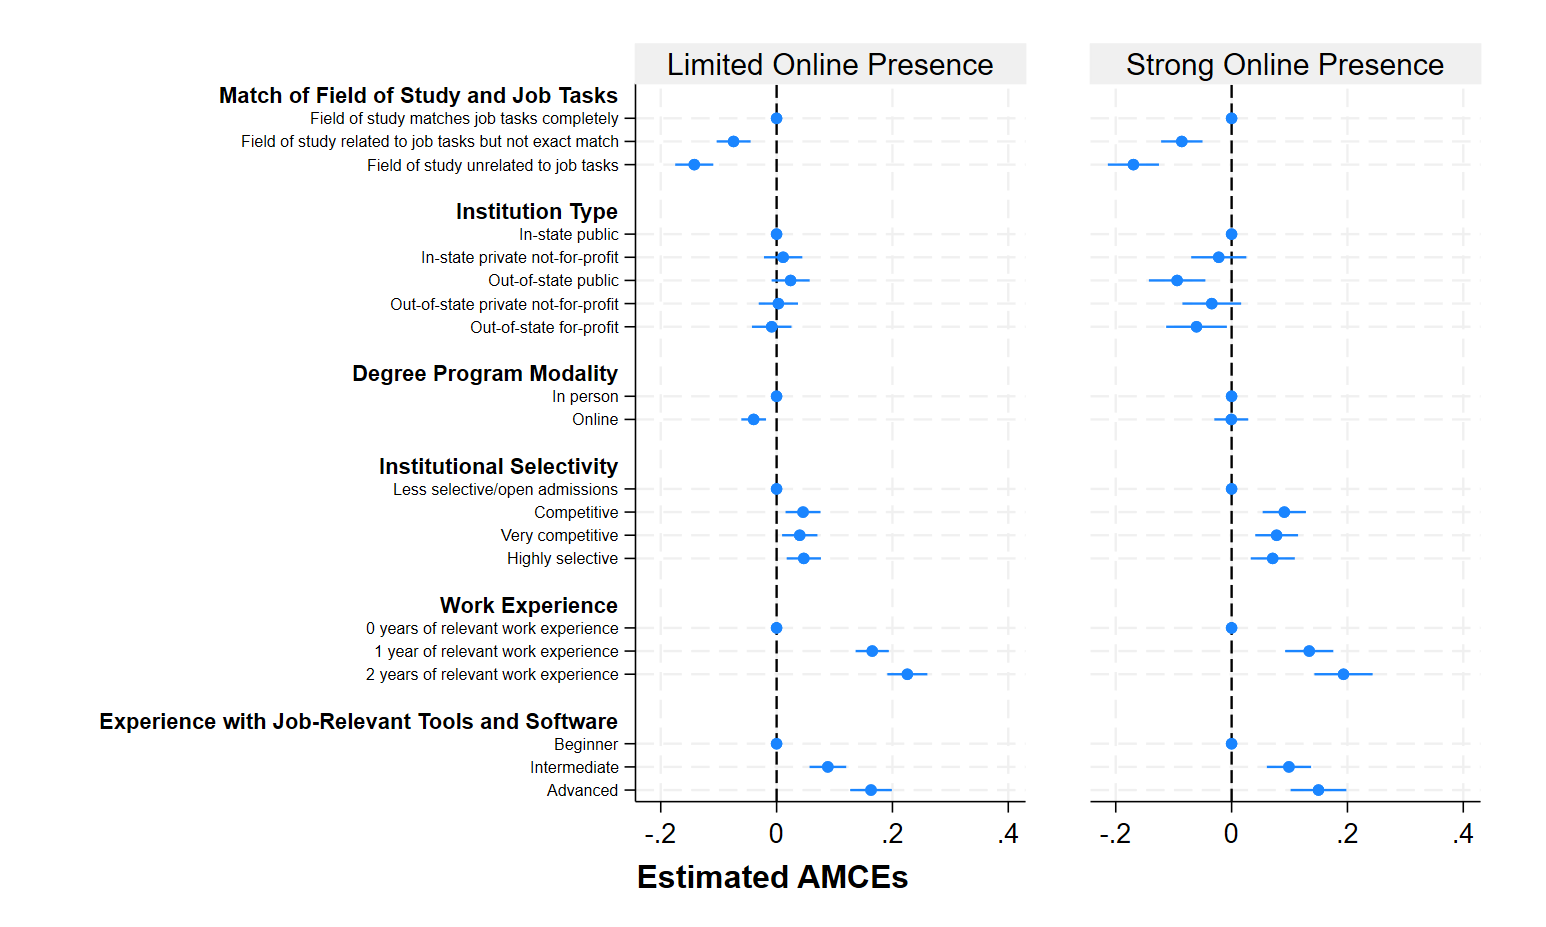
Appendix D: Regression tables
The tables in this appendix present the full results of the regression models and analyses described in the report.
Table 15. Average Marginal Component Effects of Candidate Attributes on Selection
| Attribute and Level | Coefficient | Standard Error |
| Match of Field of Study and Job Tasks | ||
| Field of study matches job tasks completely | Reference | – |
| Field of study related to job tasks but not exact match | -0.078*** | (0.01) |
| Field of study unrelated to job tasks | -0.151*** | (0.01) |
| Institution Type | ||
| In-state public | Reference | – |
| In-state private not-for-profit | -0.001 | (0.01) |
| Out-of-state public | -0.018 | (0.01) |
| Out-of-state private not-for-profit | -0.010 | (0.01) |
| Out-of-state for-profit | -0.027 | (0.01) |
| Degree Program Modality | ||
| In person | Reference | – |
| Online | -0.025** | (0.01) |
| Institutional Selectivity | ||
| Less selective/open admissions | Reference | – |
| Competitive | 0.062*** | (0.01) |
| Very competitive | 0.054*** | (0.01) |
| Highly selective | 0.056*** | (0.01) |
| Work Experience | ||
| 0 years of relevant work experience | Reference | – |
| 1 year of relevant work experience | 0.153*** | (0.01) |
| 2 years of relevant work experience | 0.214*** | (0.01) |
| Level of Experience with Job-Relevant Tools and Software | ||
| Beginner | Reference | – |
| Intermediate | 0.092*** | (0.01) |
| Advanced | 0.159*** | (0.01) |
| Observations | 13,032 | |
| R-squared | 0.069 | |
Standard errors adjusted for clusters at the respondent level are in parentheses. * p <0.05, ** p <0.01, *** p <0.001
Table 16. Average Marginal Component Effects of Candidate Attributes on Selection, with Interaction of Degree Program Modality and Institution Type
| Attribute and Level | Coefficient | Standard Error |
| Match of Field of Study and Job Tasks | ||
| Field of study matches job tasks completely | Reference | – |
| Field of study related to job tasks but not exact match | -0.078*** | (0.01) |
| Field of study unrelated to job tasks | -0.151*** | (0.01) |
| Institution Type | ||
| In-state public | Reference | – |
| In-state private not-for-profit | 0.008 | (0.02) |
| Out-of-state public | 0.006 | (0.02) |
| Out-of-state private not-for-profit | -0.006 | (0.02) |
| Out-of-state for-profit | -0.010 | (0.02) |
| Degree Program Modality | ||
| In person | Reference | – |
| Online | -0.003 | (0.02) |
| Degree Program Modality x Institution Type | ||
| In person x in-state public | Reference | – |
| Online x in-state private not-for-profit | -0.019 | (0.03) |
| Online x out-of-state public | -0.051* | (0.03) |
| Online x out-of-state private not-for-profit | -0.010 | (0.03) |
| Online x out-of-state for-profit | -0.035 | (0.03) |
| Institutional Selectivity | ||
| Less selective/open admissions | Reference | – |
| Competitive | 0.062*** | (0.01) |
| Very competitive | 0.054*** | (0.01) |
| Highly selective | 0.056*** | (0.01) |
| Work Experience | ||
| 0 years of relevant work experience | Reference | – |
| 1 year of relevant work experience | 0.153*** | (0.01) |
| 2 years of relevant work experience | 0.214*** | (0.01) |
| Level of Experience with Job-Relevant Tools and Software | ||
| Beginner | Reference | – |
| Intermediate | 0.093*** | (0.01) |
| Advanced | 0.159*** | (0.01) |
| Observations | 13,032 | |
| R-squared | 0.070 | |
Standard errors adjusted for clusters at the respondent level are in parentheses. * p <0.05, ** p <0.01, *** p <0.001
Table 17. Average Marginal Component Effects of Candidate Attributes on Selection, with Interaction of Degree Program Modality and Institutional Selectivity
| Attribute and Level | Coefficient | Standard Error |
| Match of Field of Study and Job Tasks | ||
| Field of study matches job tasks completely | Reference | – |
| Field of study related to job tasks but not exact match | -0.078*** | (0.01) |
| Field of study unrelated to job tasks | -0.151*** | (0.01) |
| Institution Type | ||
| In-state public | Reference | – |
| In-state private not-for-profit | -0.001 | (0.01) |
| Out-of-state public | -0.018 | (0.01) |
| Out-of-state private not-for-profit | -0.011 | (0.01) |
| Out-of-state for-profit | -0.027 | (0.01) |
| Degree Program Modality | ||
| In person | Reference | – |
| Online | -0.033* | (0.02) |
| Institutional Selectivity | ||
| Less selective/open admissions | Reference | – |
| Competitive | 0.065*** | (0.02) |
| Very competitive | 0.044** | (0.02) |
| Highly selective | 0.048** | (0.02) |
| Degree Program Modality x Institutional Selectivity | ||
| In person x less selective/open admissions | Reference | – |
| Online x competitive | -0.007 | (0.02) |
| Online x very competitive | 0.020 | (0.02) |
| Online x highly selective | 0.017 | (0.02) |
| Work Experience | ||
| 0 years of relevant work experience | Reference | – |
| 1 year of relevant work experience | 0.153*** | (0.01) |
| 2 years of relevant work experience | 0.214*** | (0.01) |
| Level of Experience with Job-Relevant Tools and Software | ||
| Beginner | Reference | – |
| Intermediate | 0.092*** | (0.01) |
| Advanced | 0.159*** | (0.01) |
| Observations | 13,032 | |
| R-squared | 0.069 | |
Standard errors adjusted for clusters at the respondent level are in parentheses. * p <0.05, ** p <0.01, *** p <0.001
Table 18. Average Marginal Component Effects of Candidate Attributes on Selection, with Interaction of Degree Program Modality and Online Presence
| Attribute and Level | Coefficient | Standard Error |
| Match of Field of Study and Job Tasks | ||
| Field of study matches job tasks completely | Reference | – |
| Field of study related to job tasks but not exact match | -0.078*** | (0.01) |
| Field of study unrelated to job tasks | -0.151*** | (0.01) |
| Institution Type | ||
| In-state public | Reference | – |
| In-state private not-for-profit | -0.001 | (0.01) |
| Out-of-state public | -0.018 | (0.01) |
| Out-of-state private not-for-profit | -0.010 | (0.01) |
| Out-of-state for-profit | -0.027 | (0.01) |
| Degree Program Modality | ||
| In person | Reference | – |
| Online | -0.039*** | (0.01) |
| Online Presence | ||
| Limited | Reference | – |
| Strong | -0.018 | (0.01) |
| Degree Program Modality x Online Presence | ||
| In person x limited | Reference | – |
| Online x strong | 0.038* | (0.02) |
| Institutional Selectivity | ||
| Less selective/open admissions | Reference | – |
| Competitive | 0.062*** | (0.01) |
| Very competitive | 0.054*** | (0.01) |
| Highly selective | 0.057*** | (0.01) |
| Work Experience | ||
| 0 years of relevant work experience | Reference | – |
| 1 year of relevant work experience | 0.153*** | (0.01) |
| 2 years of relevant work experience | 0.214*** | (0.01) |
| Level of Experience with Job-Relevant Tools and Software | ||
| Beginner | Reference | – |
| Intermediate | 0.093*** | (0.01) |
| Advanced | 0.159*** | (0.01) |
| Observations | 13,032 | |
| R-squared | 0.070 | |
Standard errors adjusted for clusters at the respondent level are in parentheses. * p <0.05, ** p <0.01, *** p <0.001
Table 19. Average Marginal Component Effects of Candidate Attributes on Selection, with Interaction of Degree Program Modality and Remote-First Organization
| Attribute and Level | Coefficient | Standard Error |
| Match of Field of Study and Job Tasks | ||
| Field of study matches job tasks completely | Reference | – |
| Field of study related to job tasks but not exact match | -0.078*** | (0.01) |
| Field of study unrelated to job tasks | -0.151*** | (0.01) |
| Institution Type | ||
| In-state public | Reference | – |
| In-state private not-for-profit | -0.001 | (0.01) |
| Out-of-state public | -0.018 | (0.01) |
| Out-of-state private not-for-profit | -0.010 | (0.01) |
| Out-of-state for-profit | -0.027 | (0.01) |
| Degree Program Modality | ||
| In person | Reference | – |
| Online | -0.032** | (0.01) |
| Remote-First Organization | ||
| No | Reference | – |
| Yes | -0.012 | (0.01) |
| Degree Program Modality x Remote-First Organization | ||
| In person x no | Reference | – |
| Online x yes | 0.023 | (0.02) |
| Institutional Selectivity | ||
| Less selective/open admissions | Reference | – |
| Competitive | 0.062*** | (0.01) |
| Very competitive | 0.054*** | (0.01) |
| Highly selective | 0.056*** | (0.01) |
| Work Experience | ||
| 0 years of relevant work experience | Reference | – |
| 1 year of relevant work experience | 0.153*** | (0.01) |
| 2 years of relevant work experience | 0.214*** | (0.01) |
| Level of Experience with Job-Relevant Tools and Software | ||
| Beginner | Reference | – |
| Intermediate | 0.092*** | (0.01) |
| Advanced | 0.159*** | (0.01) |
| Observations | 13,032 | |
| R-squared | 0.069 | |
Standard errors adjusted for clusters at the respondent level are in parentheses. * p <0.05, ** p <0.01, *** p <0.001
Table 20. Average Marginal Component Effects of Candidate Attributes on Selection, with Interaction of Degree Program Modality and Choice Task
| Attribute and Level | Coefficient | Standard Error |
| Match of Field of Study and Job Tasks | ||
| Field of study matches job tasks completely | Reference | – |
| Field of study related to job tasks but not exact match | -0.079*** | (0.01) |
| Field of study unrelated to job tasks | -0.151*** | (0.01) |
| Institution Type | ||
| In-state public | Reference | – |
| In-state private not-for-profit | -0.001 | (0.01) |
| Out-of-state public | -0.019 | (0.01) |
| Out-of-state private not-for-profit | -0.011 | (0.01) |
| Out-of-state for-profit | -0.027 | (0.01) |
| Degree Program Modality | ||
| In person | Reference | – |
| Online | -0.031 | (0.03) |
| Choice Task | ||
| 1 | Reference | – |
| 2 | 0.011 | (0.02) |
| 3 | -0.010 | (0.02) |
| 4 | -0.006 | (0.02) |
| 5 | 0.024 | (0.02) |
| 6 | -0.017 | (0.02) |
| 7 | -0.015 | (0.02) |
| 8 | -0.011 | (0.02) |
| 9 | 0.002 | (0.02) |
| 10 | 0.007 | (0.02) |
| 11 | -0.015 | (0.02) |
| 12 | 0.002 | (0.02) |
| Degree Program Modality x Choice Task | ||
| In person x 1 | Reference | – |
| Online x 2 | -0.020 | (0.04) |
| Online x 3 | 0.014 | (0.04) |
| Online x 4 | 0.017 | (0.04) |
| Online x 5 | -0.047 | (0.04) |
| Online x 6 | 0.047 | (0.04) |
| Online x 7 | 0.028 | (0.04) |
| Online x 8 | 0.007 | (0.04) |
| Online x 9 | -0.001 | (0.04) |
| Online x 10 | -0.011 | (0.04) |
| Online x 11 | 0.035 | (0.04) |
| Online x 12 | -0.005 | (0.04) |
| Institutional Selectivity | ||
| Less selective/open admissions | Reference | – |
| Competitive | 0.062*** | (0.01) |
| Very competitive | 0.054*** | (0.01) |
| Highly selective | 0.057*** | (0.01) |
| Work Experience | ||
| 0 years of relevant work experience | Reference | – |
| 1 year of relevant work experience | 0.154*** | (0.01) |
| 2 years of relevant work experience | 0.215*** | (0.01) |
| Level of Experience with Job-Relevant Tools and Software | ||
| Beginner | Reference | – |
| Intermediate | 0.092*** | (0.01) |
| Advanced | 0.159*** | (0.01) |
| Observations | 13,032 | |
| R-squared | 0.070 | |
Standard errors adjusted for clusters at the respondent level are in parentheses. * p <0.05, ** p <0.01, *** p <0.001
Table 21. Average Marginal Component Effects of Candidate Attributes on Selection, with Interaction of Degree Program Modality and Profile Order
| Attribute and Level | Coefficient | Standard Error |
| Match of Field of Study and Job Tasks | ||
| Field of study matches job tasks completely | Reference | – |
| Field of study related to job tasks but not exact match | -0.078*** | (0.01) |
| Field of study unrelated to job tasks | -0.151*** | (0.01) |
| Institution Type | ||
| In-state public | Reference | – |
| In-state private not-for-profit | -0.001 | (0.01) |
| Out-of-state public | -0.019 | (0.01) |
| Out-of-state private not-for-profit | -0.011 | (0.01) |
| Out-of-state for-profit | -0.027 | (0.01) |
| Degree Program Modality | ||
| In person | Reference | – |
| Online | -0.039** | (0.01) |
| Profile Order | ||
| 1 | Reference | – |
| 2 | -0.015 | (0.02) |
| Degree Program Modality x Profile Order | ||
| In person x 1 | Reference | – |
| Online x 2 | 0.028 | (0.02) |
| Institutional Selectivity | ||
| Less selective/open admissions | Reference | – |
| Competitive | 0.062*** | (0.01) |
| Very competitive | 0.054*** | (0.01) |
| Highly selective | 0.056*** | (0.01) |
| Work Experience | ||
| 0 years of relevant work experience | Reference | – |
| 1 year of relevant work experience | 0.153*** | (0.01) |
| 2 years of relevant work experience | 0.214*** | (0.01) |
| Level of Experience with Job-Relevant Tools and Software | ||
| Beginner | Reference | – |
| Intermediate | 0.093*** | (0.01) |
| Advanced | 0.159*** | (0.01) |
| Observations | 13,032 | |
| R-squared | 0.069 | |
Standard errors adjusted for clusters at the respondent level are in parentheses. * p <0.05, ** p <0.01, *** p <0.001
Table 22. Average Marginal Component Effects of Candidate Attributes on Selection: Typical Profiles
| Attribute and Level | Coefficient | Standard Error |
| Match of Field of Study and Job Tasks | ||
| Field of study matches job tasks completely | Reference | – |
| Field of study related to job tasks but not exact match | -0.087*** | (0.01) |
| Field of study unrelated to job tasks | -0.154*** | (0.01) |
| Institution Type | ||
| In-state public | Reference | – |
| In-state private not-for-profit | -0.003 | (0.02) |
| Out-of-state public | -0.011 | (0.02) |
| Out-of-state private not-for-profit | 0.003 | (0.02) |
| Out-of-state for-profit | -0.025 | (0.02) |
| Degree Program Modality | ||
| In person | Reference | – |
| Online | -0.027** | (0.01) |
| Institutional Selectivity | ||
| Less selective/open admissions | Reference | – |
| Competitive | 0.066*** | (0.01) |
| Very competitive | 0.059*** | (0.01) |
| Highly selective | 0.056** | (0.02) |
| Work Experience | ||
| 0 years of relevant work experience | Reference | – |
| 1 year of relevant work experience | 0.154*** | (0.01) |
| 2 years of relevant work experience | 0.214*** | (0.02) |
| Level of Experience with Job-Relevant Tools and Software | ||
| Beginner | Reference | – |
| Intermediate | 0.093*** | (0.01) |
| Advanced | 0.164*** | (0.02) |
| Observations | 10,000 | |
| R-squared | 0.072 | |
Standard errors adjusted for clusters at the respondent level are in parentheses. * p <0.05, ** p <0.01, *** p <0.001
Table 23. Average Marginal Component Effects of Candidate Attributes on Selection: Atypical Profiles
| Attribute and Level | Coefficient | Standard Error |
| Match of Field of Study and Job Tasks | ||
| Field of study matches job tasks completely | Reference | – |
| Field of study related to job tasks but not exact match | -0.052* | (0.02) |
| Field of study unrelated to job tasks | -0.143*** | (0.02) |
| Institution Type | ||
| In-state public | Reference | – |
| In-state private not-for-profit | 0.007 | (0.03) |
| Out-of-state public | -0.042 | (0.03) |
| Out-of-state private not-for-profit | -0.051 | (0.03) |
| Out-of-state for-profit | -0.032 | (0.03) |
| Degree Program Modality | ||
| In person | Reference | – |
| Online | -0.024 | (0.02) |
| Institutional Selectivity | ||
| Less selective/open admissions | Reference | – |
| Competitive | 0.032 | (0.03) |
| Very competitive | 0.013 | (0.03) |
| Highly selective | 0.031 | (0.03) |
| Work Experience | ||
| 0 years of relevant work experience | Reference | – |
| 1 year of relevant work experience | 0.150*** | (0.02) |
| 2 years of relevant work experience | 0.214*** | (0.02) |
| Level of Experience with Job-Relevant Tools and Software | ||
| Beginner | Reference | – |
| Intermediate | 0.090*** | (0.02) |
| Advanced | 0.143*** | (0.02) |
| Observations | 3,032 | |
| R-squared | 0.064 | |
Standard errors adjusted for clusters at the respondent level are in parentheses. * p <0.05, ** p <0.01, *** p <0.001
Table 24. Average Marginal Component Effects of Candidate Attributes on Selection, with Interaction of Degree Program Modality and Atypical Profile
| Attribute and Level | Coefficient | Standard Error |
| Match of Field of Study and Job Tasks | ||
| Field of study matches job tasks completely | Reference | – |
| Field of study related to job tasks but not exact match | -0.078*** | (0.01) |
| Field of study unrelated to job tasks | -0.151*** | (0.01) |
| Institution Type | ||
| In-state public | Reference | – |
| In-state private not-for-profit | -0.001 | (0.01) |
| Out-of-state public | -0.018 | (0.01) |
| Out-of-state private not-for-profit | -0.010 | (0.01) |
| Out-of-state for-profit | -0.027 | (0.01) |
| Degree Program Modality | ||
| In person | Reference | – |
| Online | -0.026* | (0.01) |
| Atypical Profile | ||
| No | Reference | – |
| Yes | 0.003 | (0.02) |
| Degree Program Modality x Atypical Profile | ||
| In person x no | Reference | – |
| Online x yes | 0.001 | (0.03) |
| Institutional Selectivity | ||
| Less selective/open admissions | Reference | – |
| Competitive | 0.062*** | (0.01) |
| Very competitive | 0.054*** | (0.01) |
| Highly selective | 0.054*** | (0.01) |
| Work Experience | ||
| 0 years of relevant work experience | Reference | – |
| 1 year of relevant work experience | 0.153*** | (0.01) |
| 2 years of relevant work experience | 0.214*** | (0.01) |
| Level of Experience with Job-Relevant Tools and Software | ||
| Beginner | Reference | – |
| Intermediate | 0.092*** | (0.01) |
| Advanced | 0.159*** | (0.01) |
| Observations | 13,032 | |
| R-squared | 0.069 | |
Standard errors adjusted for clusters at the respondent level are in parentheses. * p <0.05, ** p <0.01, *** p <0.001
Table 25. Average Marginal Component Effects of Candidate Attributes on Selection: In-Person Degrees
| Attribute and Level | Coefficient | Standard Error |
| Match of Field of Study and Job Tasks | ||
| Field of study matches job tasks completely | Reference | – |
| Field of study related to job tasks but not exact match | -0.076*** | (0.02) |
| Field of study unrelated to job tasks | -0.154*** | (0.02) |
| Institution Type | ||
| In-state public | Reference | – |
| In-state private not-for-profit | 0.008 | (0.02) |
| Out-of-state public | 0.006 | (0.02) |
| Out-of-state private not-for-profit | -0.006 | (0.02) |
| Out-of-state for-profit | -0.010 | (0.02) |
| Institutional Selectivity | ||
| Less selective/open admissions | Reference | – |
| Competitive | 0.065*** | (0.02) |
| Very competitive | 0.044** | (0.02) |
| Highly selective | 0.047** | (0.02) |
| Work Experience | ||
| 0 years of relevant work experience | Reference | – |
| 1 year of relevant work experience | 0.175*** | (0.02) |
| 2 years of relevant work experience | 0.228*** | (0.02) |
| Level of Experience with Job-Relevant Tools and Software | ||
| Beginner | Reference | – |
| Intermediate | 0.081*** | (0.02) |
| Advanced | 0.162*** | (0.02) |
| Observations | 6,560 | |
| R-squared | 0.076 | |
Standard errors adjusted for clusters at the respondent level are in parentheses. * p <0.05, ** p <0.01, *** p <0.001
Table 26. Average Marginal Component Effects of Candidate Attributes on Selection: Online Degrees
| Attribute and Level | Coefficient | Standard Error |
| Match of Field of Study and Job Tasks | ||
| Field of study matches job tasks completely | Reference | – |
| Field of study related to job tasks but not exact match | -0.080*** | (0.02) |
| Field of study unrelated to job tasks | -0.148*** | (0.02) |
| Institution Type | ||
| In-state public | Reference | – |
| In-state private not-for-profit | -0.010 | (0.02) |
| Out-of-state public | -0.044* | (0.02) |
| Out-of-state private not-for-profit | -0.015 | (0.02) |
| Out-of-state for-profit | -0.044* | (0.02) |
| Institutional Selectivity | ||
| Less selective/open admissions | Reference | – |
| Competitive | 0.058*** | (0.02) |
| Very competitive | 0.063*** | (0.02) |
| Highly selective | 0.064*** | (0.02) |
| Work Experience | ||
| 0 years of relevant work experience | Reference | – |
| 1 year of relevant work experience | 0.130*** | (0.02) |
| 2 years of relevant work experience | 0.199*** | (0.02) |
| Level of Experience with Job-Relevant Tools and Software | ||
| Beginner | Reference | – |
| Intermediate | 0.104*** | (0.02) |
| Advanced | 0.155*** | (0.02) |
| Observations | 6,472 | |
| R-squared | 0.063 | |
Standard errors adjusted for clusters at the respondent level are in parentheses. * p <0.05, ** p <0.01, *** p <0.001
Table 27. Average Marginal Component Effects of Candidate Attributes on Selection: Limited Online Presence
| Attribute and Level | Coefficient | Standard Error |
| Match of Field of Study and Job Tasks | ||
| Field of study matches job tasks completely | Reference | – |
| Field of study related to job tasks but not exact match | -0.074*** | (0.01) |
| Field of study unrelated to job tasks | -0.142*** | (0.02) |
| Institution Type | ||
| In-state public | Reference | – |
| In-state private not-for-profit | 0.011 | (0.02) |
| Out-of-state public | 0.024 | (0.02) |
| Out-of-state private not-for-profit | 0.003 | (0.02) |
| Out-of-state for-profit | –0.008 | (0.02) |
| Degree Program Modality | ||
| In person | Reference | – |
| Online | -0.040*** | (0.01) |
| Institutional Selectivity | ||
| Less selective/open admissions | Reference | – |
| Competitive | 0.046** | (0.02) |
| Very competitive | 0.040* | (0.02) |
| Highly selective | 0.047** | (0.02) |
| Work Experience | ||
| 0 years of relevant work experience | Reference | – |
| 1 year of relevant work experience | 0.165*** | (0.01) |
| 2 years of relevant work experience | 0.226*** | (0.02) |
| Level of Experience with Job-Relevant Tools and Software | ||
| Beginner | Reference | – |
| Intermediate | 0.089*** | (0.02) |
| Advanced | 0.163*** | (0.02) |
| Observations | 8,352 | |
| R-squared | 0.072 | |
Standard errors adjusted for clusters at the respondent level are in parentheses. * p <0.05, ** p <0.01, *** p <0.001
Table 28. Average Marginal Component Effects of Candidate Attributes on Selection: Strong Online Presence
| Attribute and Level | Coefficient | Standard Error |
| Match of Field of Study and Job Tasks | ||
| Field of study matches job tasks completely | Reference | – |
| Field of study related to job tasks but not exact match | -0.086*** | (0.02) |
| Field of study unrelated to job tasks | -0.170*** | (0.02) |
| Institution Type | ||
| In-state public | Reference | – |
| In-state private not-for-profit | -0.022 | (0.02) |
| Out-of-state public | -0.094*** | (0.02) |
| Out-of-state private not-for-profit | -0.034 | (0.03) |
| Out-of-state for-profit | –0.061* | (0.03) |
| Degree Program Modality | ||
| In person | Reference | – |
| Online | -0.001 | (0.01) |
| Institutional Selectivity | ||
| Less selective/open admissions | Reference | – |
| Competitive | 0.091*** | (0.02) |
| Very competitive | 0.078*** | (0.02) |
| Highly selective | 0.071*** | (0.02) |
| Work Experience | ||
| 0 years of relevant work experience | Reference | – |
| 1 year of relevant work experience | 0.134*** | (0.02) |
| 2 years of relevant work experience | 0.193*** | (0.03) |
| Level of Experience with Job-Relevant Tools and Software | ||
| Beginner | Reference | – |
| Intermediate | 0.099*** | (0.02) |
| Advanced | 0.150*** | (0.02) |
| Observations | 4,680 | |
| R-squared | 0.072 | |
Standard errors adjusted for clusters at the respondent level are in parentheses. * p <0.05, ** p <0.01, *** p <0.001
Endnotes
- Authors’ calculations using IPEDS data. ↑
- “Game Changer: The Value of SARA Participation,” NC-SARA and NCHEMS, April 2021, https://nc-sara.org/wp-content/uploads/files/2021-04/GameChanger_Final_4-13-21.pdf. ↑
- “Our Work,” NC-SARA, accessed March 3, 2026, https://nc-sara.org/mission-history. ↑
- “Know the Facts: The Inaccuracies Surrounding NC-SARA,” The Institute for College Access & Success (TICAS), November 2021, https://ticas.org/wp-content/uploads/2021/11/NC-SARA-November-11.8_700.pdf. ↑
- James D. Ward, Heidi Booth, Elizabeth D. Pisacreta, and Benjamin Weintraut, “Breaking Down Barriers: The Impact of State Authorization Reciprocity on Online Enrollment,” Ithaka S+R, last modified August 3, 2021, https://doi.org/10.18665/sr.315451. ↑
- “Eligibility for Participation,” NC-SARA, accessed March 3, 2026, https://nc-sara.org/eligibility-participation/. ↑
- David J. Deming, Noam Yuchtman, Amira Abulafi, Claudia Goldin, and Lawrence F. Katz, “The Value of Postsecondary Credentials in the Labor Market: An Experimental Study,” American Economic Review 106, no. 3 (2016): 778-806, https://www.aeaweb.org/articles?id=10.1257/aer.20141757. Rajeev Darolia, Cory Koedel, Paco Martorell, Katie Wilson, and Francisco Perez-Arce, “Do Employers Prefer Workers Who Attend For-Profit Colleges? Evidence from a Field Experiment,” Journal of Policy Analysis and Management 34, no. 4 (2015): 881-903, https://doi.org/10.1002/pam.21863. Nicole M. Deterding and David S. Pedulla, “Educational Authority in the ‘Open Door’ Marketplace: Labor Market Consequences of For-Profit, Nonprofit, and Fictional Educational Credentials,” Sociology of Education 89, no. 3 (2016): 155-170, https://doi.org/10.1177/0038040716652455. ↑
- Raj Chetty, David J. Deming, and John N. Friedman, “Diversifying Society’s Leaders? The Determinants and Causal Effects of Admission to Highly Selective Private Colleges,” NBER, 2023, https://doi.org/10.3386/w31492; Ricardo Nogales, Pamela Córdova, and Manuel Urquidi, “The Impact of University Reputation on Employment Opportunities: Experimental Evidence from Bolivia,” The Economic and Labour Relations Review 31, no. 4 (2020): 524–42, https://doi.org/10.1177/1035304620962265. ↑
- This study builds on previous Ithaka S+R research examining the effects of SARA on online enrollments in participating states and institutions. We found that institutions, especially early adopters, experienced growth in online enrollments after joining SARA. See James Ward et al., “Breaking Down Barriers: The Impact of State Authorization Reciprocity on Online Enrollment,” Ithaka S+R, August 3, 2021, https://doi.org/10.18665/sr.315451. In another study, we analyzed enrollment patterns by program modality and how those patterns shifted before and after SARA. We found that students enrolled in out-of-state online degree programs are disproportionately female, Black, lower-income, and older. This suggests that expanding online markets may provide more access to groups of students who have been historically excluded from higher education. See Ini-Abasi Umosen, “Exploring Online Enrollment Trends in the Era of State Authorization Reciprocity,” Ithaka S+R, last modified November 13, 2025, https://doi.org/10.18665/sr.323979. ↑
- Anthony P. Carnevale, Ban Cheah, and Emma Wenzinger, “The College Payoff: More Education Doesn’t Always Mean More Earnings,” Georgetown University Center on Education and the Workforce, 2021, https://cew.georgetown.edu/cew-reports/collegepayoff2021. ↑
- David Card, “The Causal Effect of Education on Earnings,” in Handbook of Labor Economics, vol. 3, ed. Orley Ashenfelter and David Card (Amsterdam: Elsevier, 1999), 1801-1863, https://doi.org/10.1016/S1573-4463(99)03011-4. Louis Jacobson, Robert LaLonde, and Daniel G. Sullivan, “Estimating the Returns to Community College Schooling for Displaced Workers,” Journal of Econometrics 125, nos. 1-2 (2005): 271-304, https://doi.org/10.1016/j.jeconom.2004.04.010. James J. Heckman, John Eric Humphries, and Gregory Veramendi, “Returns to Education: The Causal Effects of Education on Earnings, Health, and Smoking,” Journal of Political Economy 126, no. S1 (2018): S197-S246, https://doi.org/10.1086/698760. ↑
- David A. Jaeger and Marianne E. Page, “Degrees Matter: New Evidence on Sheepskin Effects in the Returns to Education,” Review of Economics and Statistics 78, no. 4 (1996): 733-740, https://doi.org/10.2307/2109960. ↑
- Tim Hyde, “Do Employers Frown on For-Profit Colleges and Online Degrees? Measuring the Labor Market Value of These Increasingly Common Credentials,” American Economic Association, last modified March 23, 2016, https://www.aeaweb.org/research/do-employers-frown-on-for-profit-degrees. ↑
- Zhengren Zhu, “Discrimination against Community College Transfer Students — Evidence from a Labor Market Audit Study,” Economics of Education Review 97 (2023), https://doi.org/10.1016/j.econedurev.2023.102482. ↑
- S. Michael Gaddis, “Discrimination in the Credential Society: An Audit Study of Race and College Selectivity in the Labor Market,” Social Forces 93, no. 4 (2015): 1451-1479, https://doi.org/10.1093/sf/sou111. ↑
- Michael D. Bloem, “Time to Baccalaureate Degree in the Labor Market: Evidence from a Field Experiment,” Journal of Policy Analysis and Management 45, no. 1 (2026): e70010, https://doi.org/10.1002/pam.70010. ↑
- Christopher T. Bennett, “Labor Market Returns to MBAs from Less-Selective Universities: Evidence from a Field Experiment during COVID-19,” Journal of Policy Analysis and Management 42, no. 2 (2023): 525-551, https://doi.org/10.1002/pam.22448. ↑
- Conor Lennon, “How Do Online Degrees Affect Labor Market Prospects? Evidence from a Correspondence Audit Study,” ILR Review 74, no. 4 (August 2021): 920-47, https://doi.org/10.1177/0019793919899943. ↑
- Some studies have addressed this issue by generating incentives for respondents. See for example, Judd B. Kessler, Corinne Low, and Colin D. Sullivan, “Incentivized Resume Rating: Eliciting Employer Preferences without Deception,” American Economic Review 109, no. 11 (2019): 3713-3744, https://doi.org/10.1257/aer.20181714. The authors introduce an incentivized resume rating design, in which employers evaluate resumes they know to be hypothetical, but whose evaluations are used to form a packet of resumes of real job seekers that they receive following participation in the study. ↑
- Although we initially considered including hybrid as a level within degree program modality, we decided against it. First, public discussions and debates typically pit online degrees against in-person degrees. Second, adding a third level would have decreased the frequency that each level appeared in the choice sets, thereby decreasing statistical power. ↑
- This situation could arise if a candidate applies for a job located in their own state but the hiring manager is based outside of it, or if a candidate applies for a job outside of their own state where the hiring manager is located. However, in most cases, a hiring manager is located in the same state as their employer. In our sample, 90.6 percent of respondents’ employers were based in the same state as their residence. Additionally, Kelchen and Webber (2018) found that only 10.4 percent of recent bachelor’s degree recipients moved across state lines in 2015. In other words, most students remained in the same state after graduation, at least in the short term. That said, this finding does not capture the location of the jobs that candidates applied to. Recent graduates may apply to positions in many states but ultimately remain in the state where they went to college. Robert Kelchen and Douglas A. Webber, “Examining the Interstate Mobility of Recent College Graduates,” Educational Researcher 47, no. 3 (2018): 213-215, https://doi.org/10.3102/0013189X17753124. ↑
- “Stay Informed: Data Methodology – Fall 2021,” National Student Clearinghouse, 2021, https://nscresearchcenter.org/wp-content/uploads/StayInformed_DataMethodologyFall2021.pdf. ↑
- Martin Humburg and Rolf K. W. van der Velden, “Skills and the Graduate Recruitment Process: Evidence from Two Discrete Choice Experiments,” Economics of Education Review 49 (2015): 24–41, https://doi.org/10.1016/j.econedurev.2015.07.001. ↑
- “United States Population Growth by Region,” Population Clock, US Census Bureau, https://www.census.gov/popclock/data_tables.php?component=growth. ↑
- The survey presented respondents with 15 industry sectors, as defined by the Commission on Teacher Credentialing, as well as an option to select “other”. ↑
- The 78 respondents who indicated that their highest degree was a high school diploma were not asked this question. ↑
- Jens Hainmueller, Daniel J. Hopkins, and Teppei Yamamoto, “Causal Inference in Conjoint Analysis: Understanding Multidimensional Choices via Stated Preference Experiments,” Political Analysis 22, no. 1 (2014): 1-30, https://doi.org/10.1093/pan/mpt024. ↑
- The 0.1 percentage point discrepancy is due to rounding. ↑
- Because results from prior analyses revealed that hiring managers did not differentiate quality among competitive institutions, we conducted the same regression analysis with the three competitive categories collapsed into one, creating a variable consisting of two categories: less selective/open admissions and competitive. The results are consistent across both approaches. Full regression results for this analysis are not included in the report but are available upon request. ↑
- The three fields of study that make up the online presence category account for 49 percent of undergraduates enrolled in exclusively online out-of-state programs. The remaining 42 fields account for the other 51 percent, with each individual field ranging from zero to six percent of enrollment. ↑
- David J. Deming, Noam Yuchtman, Amira Abulafi, Claudia Goldin, and Lawrence F. Katz, “The Value of Postsecondary Credentials in the Labor Market: An Experimental Study,” American Economic Review 106, no. 3 (2016): 778-806, https://www.aeaweb.org/articles?id=10.1257/aer.20141757. ↑
- Conor Lennon, “How Do Online Degrees Affect Labor Market Prospects? Evidence from a Correspondence Audit Study,” ILR Review 74, no. 4 (August 2021): 920-47, https://doi.org/10.1177/0019793919899943. ↑
- Christopher T. Bennett, “Labor Market Returns to MBAs from Less-Selective Universities: Evidence from a Field Experiment during COVID-19,” Journal of Policy Analysis and Management 42, no. 2 (2023): 525-551, https://doi.org/10.1002/pam.22448. ↑
- At the outset of this project, we intended to conduct a resume audit study, where fictitious resumes are sent to hiring managers who are unaware that call back rates are being measured, to identify how employers respond to online credentials. However, none of the online job platforms which we would have relied on to identify and apply to job openings permitted the use of their sites in such deceptive ways. As a result, we pivoted to a discrete choice experiment instead. ↑
- In Deming et al.’s (2016) resume audit study, they explicitly note that it is rare for resumes to indicate that a degree was earned online. To implicitly indicate that a degree was earned online, they used institutions with a strong online presence and a reputation for conferring online degrees. ↑
- Rich Johnson and Bryan Orme, “Getting the Most from CBC, Sawtooth Software Research Paper Series,” Sawtooth Software, 2003, https://www.sawtoothsoftware.com/resources/technical-papers/getting-the-most-from-cbc. ↑
- In general, as the number of tasks per respondent and number of candidates increase, the sample size needed decreases. But as the number of attribute levels increase, the sample size needed increases. ↑
- Full regression results for these analyses are not included in the report but are available upon request. ↑