Research Data Services in US Higher Education
Introduction
As data-driven research methods proliferate and become more sophisticated across disciplines, supporting researchers who work with data is increasingly a top priority for academic institutions. However, research data services—support offerings which enable and improve data research—are currently provided in an ad hoc manner by a variety of campus units, including libraries, academic departments and institutes, labs, and IT or research computing units. And the provision of research data services varies significantly from campus to campus.
For data-driven research to thrive, stakeholders—including academic libraries, IT departments, research offices, university administrators, and academic department leadership—must have a comprehensive understanding of the current landscape of research data services. Although there is an extensive literature documenting support for research data management, sharing, and other services by academic libraries,[1] there has been much less systematic study of the research data services provided by academic institutions holistically.[2] There is an urgent need for a complete picture of the provision of research data services in US higher education.
This report presents the results of an inventory of research data services offered by US colleges and universities using a systematic web searching process. Our results represent a holistic, quantitative picture of services that support data-driven research across organizational units and institutional types.
In addition to sharing these findings, we have also provided extensive methodological documentation in hopes of inspiring and enabling future research. Until now, there has been no effective methodology for capturing quantitative data about the provision and organization of research data services across diverse institutional structures. Although there are limitations to this type of web-based inventory, the advantages over other research methods, such as surveys, are significant for measuring what research data services are offered and where. We discuss the scope of our study below and provide additional methodological details in the Appendix.
Summary of Findings
Below, we provide an analysis of the results of our inventory applied to 120 US colleges and universities. We begin with a high-level comparison of research data services provided by institutions in three groups: R1 (doctoral institutions with very high research activity), R2 (doctoral institutions with high research activity), and selective baccalaureate colleges (here abbreviated SLACs).[3] Next, we present findings relating to high performance computing and the provision of research services by libraries and IT departments (including research computing) and by academic departments, independent research centers and facilities, and professional schools. Finally, we identify key service gaps which appear across the institutional structure.
The following are our high-level findings:
- Overall, R1 institutions exceed R2s and SLACs by more than double in the number of research data services offered. The average R1 offers 7.6 research data services, while the average R2 offers 2.6 and the average SLAC offers 1.8.
- 100 percent of sampled R1 institutions offered high performance computing facilities, as did 60 percent of R2s and 24 percent of SLACs.
- Libraries are important providers of research data services across all three Carnegie classifications. While the most commonly-offered service is generalist consultation, a small number of R1 and SLAC libraries offer research data services with a variety of disciplinary, methodological, and technical focuses.
- Although IT departments (including research computing units) provide fewer research data services than libraries overall, they are also an important service provider, particularly on campuses where the library does not offer research data services.[4]
- A wide variety of research data services, most focused on specific disciplines or methodologies, can be found in academic departments, independent research centers and facilities, and professional schools. These services most commonly focus on statistics and (at R1 universities) bioinformatics.
- Research data services provided by academic departments, independent centers and facilities, and professional schools can be staffed by faculty, staff, students, or a combination of those groups. Overall, individuals in staff roles most commonly provide these services. But faculty members do frequently provide research data services focused on statistical analysis and methodological support.
- Research data services focused on statistics can be found in academic departments (usually statistics or mathematics), independent centers or institutes, medical schools, other professional schools, and IT departments. Seventy percent of R1s, 60 percent of R2s, and 22.5 percent of SLACs have at least one statistics-focused service.
- The majority of R1 institutions included in our review (72.5 percent) have at least one research data service focused on bioinformatics. R1 medical schools, and to a lesser extent R2 medical schools, are strong providers of research data services overall, and particularly of bioinformatics services.
- While statistics and bioinformatics research data services are common at R1 universities, the picture for other Carnegie classifications and other types of services is very different. More than half of R2 institutions offer at least one statistics-focused service; around half of R1s and one third of R2s and SLACs provide geospatial research data services. Services focused on clinical data, social sciences, business, or the humanities are each found at less than 20 percent of institutions across Carnegie classifications.
The results of this inventory lay a foundation for future study by suggesting needs which may be under-provisioned or inefficiently organized, as well as revealing significant variations in the extent of service provision among different institutions. This inventory also raises important questions about how research data services are best organized, funded, and staffed. And it represents a necessary first step toward evaluating the quality, relevance, capacity, and uptake of current data services and envisioning future offerings.
A New Methodological Approach
In addition to presenting the findings of our research, this report outlines a novel web-based inventory methodology approach which we hope will provide inspiration for similar research. The highly decentralized provision of research data services, particularly in research intensive universities, demands a unique methodological approach if data is to be gathered efficiently for a large number of institutions.
Although surveys and questionnaires have been used effectively to generate significant insights into the provision and development of research data services within academic libraries,[5] they are less well suited to gathering information across institutional structures. Because these methods rely on the local knowledge of select individuals, they are limited in the comprehensiveness and accuracy of the information they can provide: there is rarely one individual who can identify all the research data services offered on any given campus.
For example, a 2019 study by the Australian Research Data Commons attempted to measure the extent to which research IT support is provided by various organizational units within Australian universities by surveying deputy vice chancellors (equivalent to US vice provosts) of research, library leaders, and IT leaders. The researchers reported significant challenges in gathering accurate information:
The most common comment by far came from senior levels in universities, and could be summarized as “frankly, outside of X, we do not know.” No university indicated they had any detailed measures of what happened outside the central areas, i.e. beyond IT, Library and eResearch programs, and this was common from the largest to the smallest institution. They all indicated their estimates were known to be conservative. One senior executive asked if they could be provided with the data submitted by their own institution. Several acknowledged the importance of a better understanding.[6]
A comparable study by the Netherlands’ National Coordination Point Research Data Management (LCRDM) classified research data services tasks using job descriptions for open roles and surveyed “data stewards” at Dutch universities and research organizations. The study similarly faced challenges in capturing the activities of what they call “embedded” data stewards (staff members with domain-specific data management knowledge, often positioned within a research unit): “It could well be that the survey gives less prominence to embedded data stewardship tasks because embedded data stewards active within a department or project are less visible to the rest of the organization.”[7]
It is also important to note the important role of qualitative research methodologies in understanding research services. OCLC’s recent interview-based study of the role of cross-campus relationships in the provision of research support generated rich insights into “on-the-ground experiences” of organizing and providing a variety of research support services, including research data support.[8] Additionally, Ithaka S+R’s series of large-scale qualitative investigations of research support needs has elucidated how faculty in a variety of disciplines conduct their work and leverage, or fail to leverage, campus support resources.[9] However, interview-based studies like these cannot provide generalizable views or quantifiable comparisons.
Although these surveys and interview-based studies have provided important insights into the scoping of research data management roles, particularly in centralized campus structures such as the library, a different approach is needed to reveal a clearer picture of research data services across organizational structures. Our inventory methodology provides a holistic, quantitative picture of the provision and organization of research data services across a range of higher education institutions. The methodology is described in detail in the Appendix.
Defining Research Data Services
There is no universally accepted definition of what counts as a “research data service.” For the purposes of this project, we defined research data services as any concrete, programmatic offering intended to support researchers (including faculty, postdoctoral researchers, and graduate students) in working with data. As described in greater detail below, we focused our inventory on support for research, not support for teaching, and excluded services intended solely to enforce compliance with security standards or legal requirements. We also excluded all data services offered by offices of institutional research. In other words, our definition of research data services focuses on supports that directly help scholars advance their research agendas.
Service providers
We reviewed research data services offered through the following organizational units:
Library. We defined this category as the campus library system, inclusive of professional school libraries.
IT Department. This category included all services offered by both IT and research computing units, whether located within a central office or decentralized at the school or college level.
Independent research centers and facilities not affiliated with an academic department. Webpages of these centers are often indexed by the Office of Research. Included in this category are centers, institutes, and “core” facilities that are not affiliated with a professional school or academic department.
Academic departments. The academic departments most frequently offering research data services were statistics and mathematics departments; services were also offered by geology, economics, and political science departments.
Medical school. On some campuses, several academic units such as medical, nursing, and dental are combined into a health sciences campus. In these cases, services offered centrally by the health sciences campus were assigned to the medical school category. Otherwise, services offered by health science professional schools other than the school of medicine were listed under “other professional school.” We defined a “medical school” as a school or college granting an MD.
Business school or school of management. We defined a “business school” as a school or college granting an MBA.
Other professional school. Within this category, schools of public health were the most commonly identified as offering research data services.
Services within the Library and IT Departments
For the library and IT department, services were classified along two axes: service type (consultations, training events, front end work, and back end work) and broad subject area focus (general, STEM emphasis, social science emphasis, digital humanities emphasis, health sciences, geospatial, statistical, and other). The service types were defined as follows:
Consulting. One-to-one meetings by appointment or during drop-in hours, including paid consulting. Consulting may relate to reference (finding datasets), data management, project design, data analysis (including text mining), software skills or identifying the right software, or statistics.
Training events. Workshops, seminars, and non-credit-bearing classes, whether provided regularly or ad hoc. This does not include subscriptions to online training modules, research seminars or hosted conferences.
Back end work. Data architecture and metadata design; formatting data for analysis; linking or integrating diverse datasets; software development; database development.
Front end work. Web development; data visualization.
Services outside the Library and IT Department
For independent centers and facilities, academic departments, medical schools, business schools, and other professional schools, services fell into eight subcategories: bioinformatics, clinical data, geospatial, statistics, business, social science, business, and visualization. We also collected information about whether these services were staffed by faculty, non-faculty staff members, students, or a combination of these three. The form allowed for multiple service providers to be listed under a single organizational unit (for instance, a medical school might have multiple core facilities which offer research data services). We classified these services using the following categories:
Bioinformatics. Bioinformatics consultations, biostatistics help and consultations, informatics in a health sciences context, sequencing data analysis, statistical genetics, data analysis, biomedical research data management, and so on.
Clinical Data. Management of clinical trials data, imaging in a health sciences context, assisting researchers with creating appropriate data collection instruments for collecting clinical data, clinical data management, and so on.
Geospatial. GIS mapping, GIS database development, ArcGIS, editing spatial data, geoprocessing analysis, GIS consultations, data and research methods consultations, custom cartography and geovisualization consultations, remote sensing, spatial analysis and modeling, and so on.
Statistics. Statistical analysis in a multidisciplinary as opposed to a biology specific context, database development for proper statistical analysis, assistance creating custom software applications in R and Python, statistical project design, training on statistical methods and statistical programming languages, statistical data analysis consultations, survey research and practice, and so on.
Business. External business consultations to companies regarding business like matters, market analysis, business strategy analysis for both external and internal purposes, economic impact and policy analysis studies, business analytics consultations, customized database design, financial data analysis, custom data gathering, and so on.
Social Science. Analysis of data in social science context, analysis of surveys, analysis of interviews, analysis of focus groups, analysis of historical and political data, and so on.
Visualization. Visualization (creation of images and diagrams for the presentation or analysis of data) in a multidisciplinary context, visualization display and software assistance, visualization of data and images, and so on.
Finally, we collected information on whether high performance computing (HPC) was provided by the institution. By high performance computing, we mean resources such as advanced computing hardware, computer clusters, or cloud services like Amazon Web Services that enable intensive computing. For the purposes of this project, we did not consider HPC to be a research data service per se, but rather an important prerequisite for some types of data work. Therefore, we only measured whether or not some form of HPC was directly accessible to researchers of the institution in question, either on campus, virtually (as in cloud resources), or at a regional shared facility.
What Counts as a Research Data Service?
For the purposes of our research, we determined that an organizational unit was providing a research data service if the service was explicitly advertised on an institutional webpage (not, for instance, a press release or news article). The service had to be described, not implied. For instance, a sidebar on a library webpage with the name and email address of someone with the title “Research Data Services Librarian” was not in itself sufficient to indicate that the library offered research data management consultations; but if the sidebar also included the text, “Contact me for help with research data management,” a service was recorded. Another common example involved the provision of software and computing infrastructure. It was not sufficient if an IT department simply listed on its webpage that SPSS and STATA licenses were available for faculty use; but if the department advertised training workshops on using statistical software, a service was recorded. Additional exclusions are listed in the Appendix.
What Our Data Can (and Can’t) Tell Us
The results of the inventory present an aggregated picture of the distribution, location, and nature of research data services across a segment of US higher education academic institutions. In what follows, it is important to bear in mind a few key limitations of this approach. In our increasingly online information environment, the existence of a service description on an official college or university webpage is a reasonable approximation of institutional legitimacy. However, this inventory cannot capture informal research data services which are not advertised online, but which may nevertheless be important to some researchers. These “invisible” services may include expert assistance offered by library, research computing, or core facility staff that is advertised and accessed through personal relationships (“You should email Lisa over in Research Computing—she’s an R whiz”). Second, the inventory cannot capture support or advice that faculty receive from their peers and collaborators, external consultants or learning resources, or their postdocs or students. Finally—and perhaps most importantly—knowing whether a service exists is very different from knowing whether, how, and by whom it is used. We believe our inventory is a necessary first step that will enable further research to address these important questions.
Results
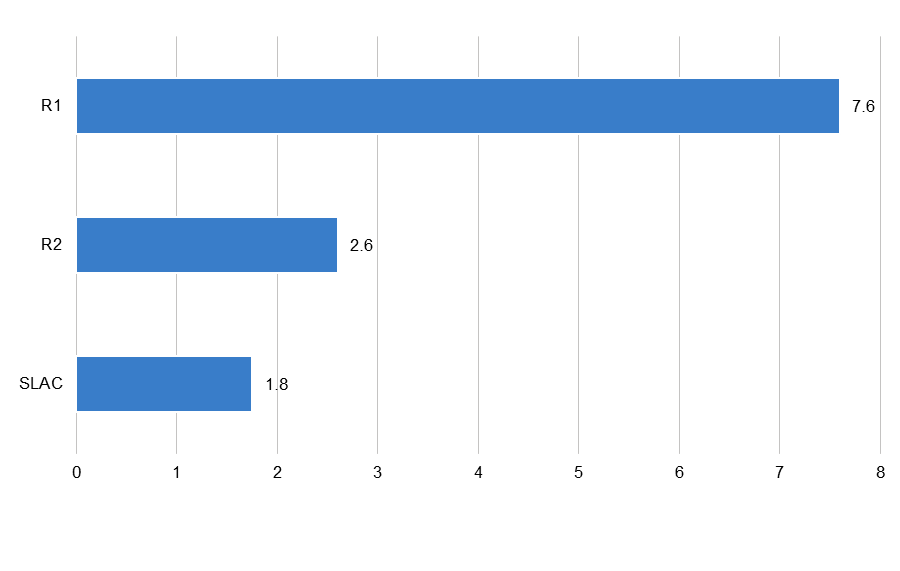
The distribution of research data services across even the relatively well-resourced institutions sampled in this inventory is extremely uneven (see Figure 1). A total of 478 unique research data services were identified across our sample of 40 R1 institutions, 40 R2 institutions, and 40 selective liberal arts colleges (SLACs). Unsurprisingly, the majority of these services—304, or an average of 7.6 services per institution—were found at R1s. Put another way, R1 institutions provide more than two and a half times as many research data services as R2s and more than four times as many as SLACs. By contrast, we found an average of 2.6 research data services per R2 institution and 1.8 services per SLAC. We also identified high performance computing facilities at 40 R1s, 24 R2s, and 11 SLACs (see below).
R1 institutions provide more than two and a half times as many research data services as R2s and more than four times as many as SLACs.
Figure 1. Average number of research data services per institution, by institution type
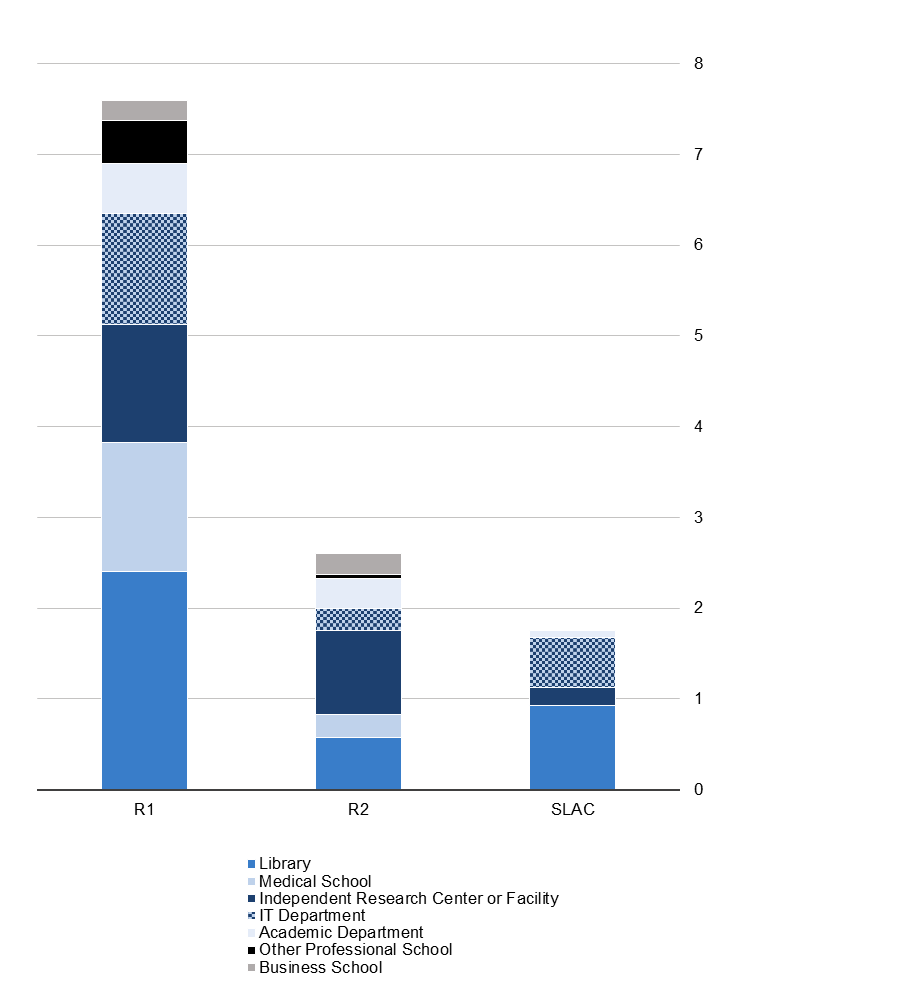
Breaking these results down by organizational location—what part of the college or university is providing the service—helps us to shed some light on the gap between R1s and other institutions (see Figure 2). As discussed below, R1 libraries in particular have made significant investments in offering research data services. Libraries are the largest contributors to research data services on R1 campuses, offering 32 percent of the research data services we identified at R1 institutions. Medical schools and the prevalence of bioinformatics research data services also play a significant role in research data services provision on R1 campuses. However, other professional schools, such as business schools, are not significant contributors of research data services within any Carnegie classification. Finally, research data services are offered more consistently by independent research centers and facilities and IT departments on R1 campuses than on R2 or SLAC campuses.
R2 libraries account for only 22 percent of research data services offered on R2 campuses; by contrast, the library plays an outsize role at SLACs, providing 53 percent of the services offered. Instead, R2 institutions rely on independent centers and facilities to provide 52 percent of their research data services. At SLACs, IT departments are also important service providers, supplying 31 percent of the research data services we located.
Figure 2. Average number of unique research data services per institution, by organizational location and institution type
High Performance Computing
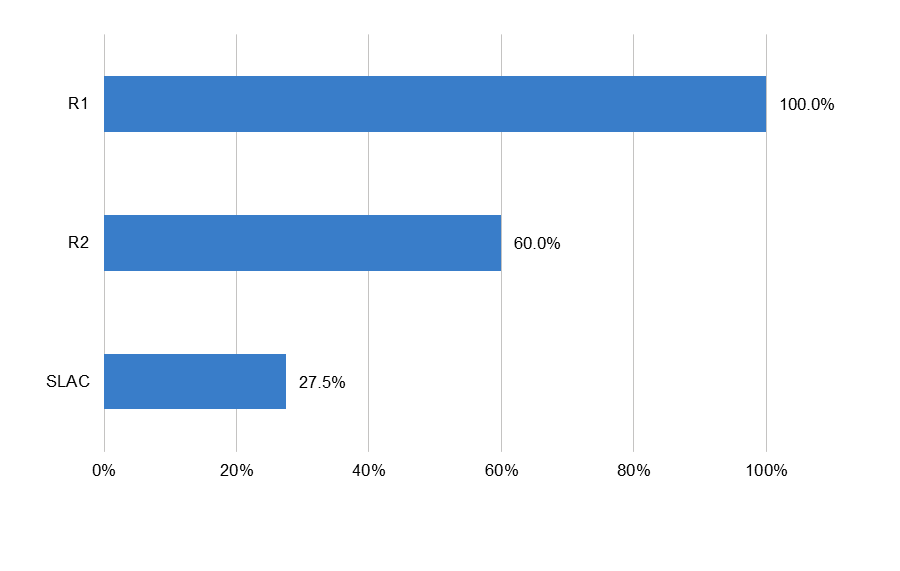
Access to high performance computing is essential or highly desirable for some types of data science research. Although our definition of research data services does not include the provision of high performance computing, we recorded whether each institution sampled supplied faculty with access to at least one high performance computing facility (in some cases, this could be through a local sharing arrangement). There are significant inequities in campus-mediated access to high performance computing across Carnegie classifications (see Figure 3). While 100 percent of the R1 institutions in our sample offered high performance computing, only 60 percent of R2s and 28 percent of SLACs did so. Researchers at these institutions may be limited in the types of resource-intensive computing they can undertake, or they may turn to third-party providers such as AWS or the Open Science Grid.[10]
Figure 3. Percentage of institutions with high performance computing provision, by institution type
Libraries and IT Departments
As centralized campus units, libraries and IT departments (a term which we use to refer to both IT and research computing, as described below) are well positioned to offer research data services to scholars from a wide variety of fields.
Libraries
Figure 4. Average number of research data services offered by the campus library system and IT department, by institution type
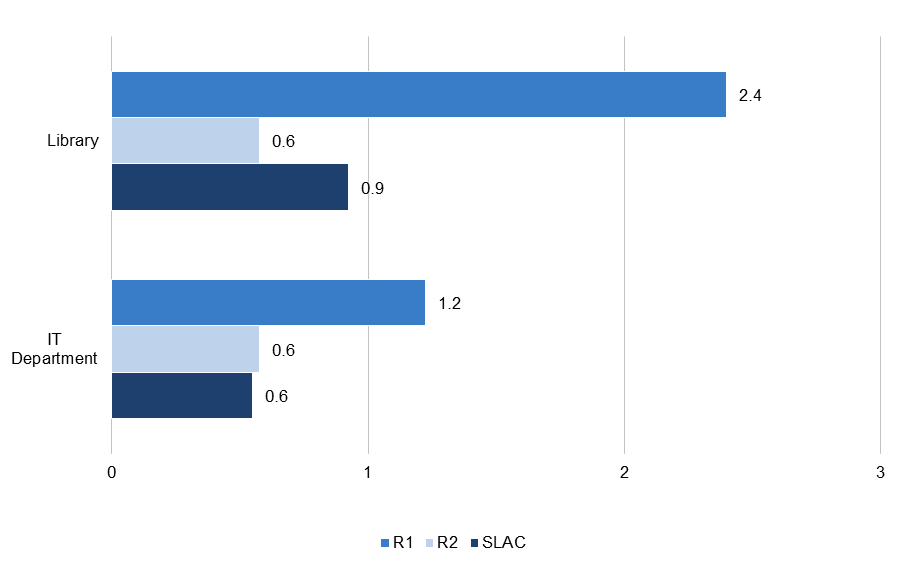
As libraries increasingly shift toward service-oriented models and the very notion of a collection changes, calls abound for academic libraries to step into a leading role in research data services. Our inventory shows that many libraries are heeding that call: libraries are significant providers of research data services across institution types. However, library research data services are significantly more developed at R1 institutions than elsewhere, and slightly more well developed at SLACs than at R2s (See Figure 4). The average R1 library offers 2.4 unique research data services. (Recall that different types and disciplinary or methodological focuses of services were counted separately: if a library offered consulting drop-in hours in geospatial analysis and training workshops in statistics and data management, we counted three services, consultations for geospatial work, training workshops for statistics, and generalist training workshops.) By contrast, the average number of library research data services offered is less than one for both R2s and SLACs.
Libraries are significant providers of research data services across institution types.
Among R1 institutions, it is noteworthy that only 20 percent of libraries in our sample did not offer any research data services at the time of data collection. Comparing these findings with earlier research on data librarianship suggests that the formal provision of research data services may correlate with staffing. In July 2019, the average R1 library had 2.2 dedicated data librarians, while just over a quarter of R1 libraries did not have any.[11] It is probably fair to say that it has become “normal” for an R1 library to have at least one dedicated data librarian and to offer at least one research data service. By contrast, 68 percent of R2 libraries and 60 percent of SLAC libraries do not offer any research data services.
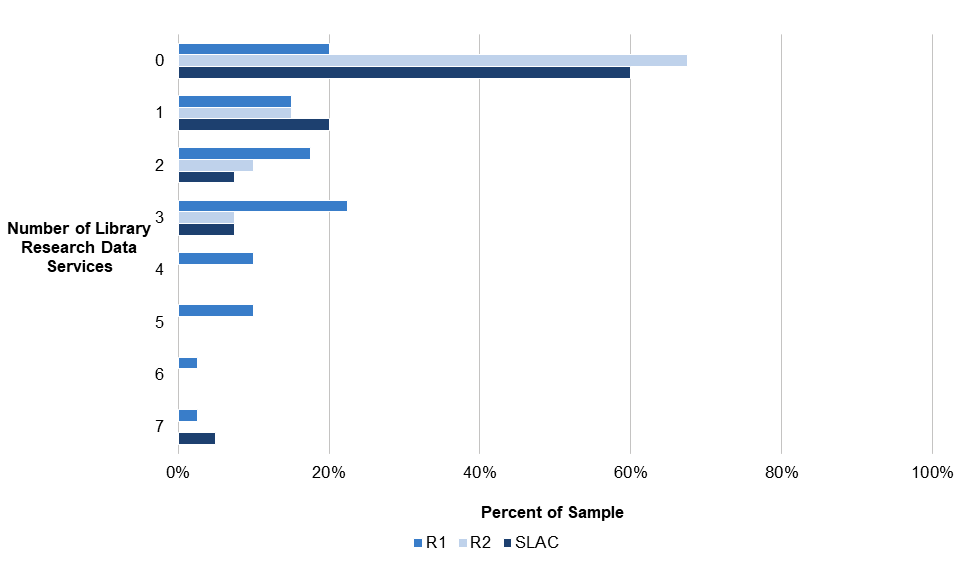
Nevertheless, there is significant variation in the range of research data services offered by libraries, even within Carnegie classifications. Fifty-five percent of R1 libraries, 33 percent of R2 libraries, and 35 percent of SLAC libraries offer between one and three distinct services. An additional 25 percent of R1s have particularly robust offerings of between four and seven services. It is also noteworthy that five percent of SLAC libraries (two in our sample of 40) also offer a high number of research data services, indicating that a few particularly well-resourced baccalaureate institutions are imitating the service offerings found at R1s. As mentioned above, SLACs are heavily reliant on their libraries to provide research data services: library services account for 53 percent of all services found at SLACs. R2 libraries play a relatively less important role, providing 22 percent of services across campus.
Figure 5. Number of research data services per library, by institution type
The profile of types of research data services offered within libraries was roughly consistent across Carnegie classifications. Consulting services—that is, by-appointment or drop-in—are by far the most commonly offered service in libraries, representing 64.7 percent of the research data services offered by libraries across Carnegie classifications (See Figure 6). Common consultation topics include research data management, data reference requests, and research design. Most library consultation services are advertised without a subject focus (34 percent of all service types) or are specifically scoped to geospatial analysis (16.7 percent) or statistics (7.6 percent). Training events, such as workshops and seminars, are also an important way libraries deliver research data services, representing 29.9 percent of all library research data services. Front end work, which includes web development and visualization, and back end work, which includes functions like data architecture and software development, are uncommon in libraries.
Figure 6. Percentage of library research data services identified across R1, R2, and SLAC institutions, by type of service and disciplinary focus
| Consulting | Training Events | Front End Work | Back End Work | Total | |
|---|---|---|---|---|---|
| General | 35.9% | 16.0% | 3.2% | 2.6% | 57.7% |
| Geospatial | 16.7% | 9.0% | 0.0% | 0.0% | 25.6% |
| Statistics | 7.1% | 1.3% | 0.0% | 0.0% | 8.3% |
| Digital Humanities | 2.6% | 1.3% | 0.0% | 0.0% | 3.8% |
| Social Sciences | 0.6% | 0.6% | 0.0% | 0.0% | 1.3% |
| Health Sciences | 0.6% | 0.0% | 0.0% | 0.0% | 0.6% |
| Other | 1.3% | 1.3% | 0.0% | 0.0% | 2.6% |
| Total | 64.7% | 29.5% | 3.2% | 2.6% | 100% |
IT Departments and Research Computing
The organization and remit of IT departments varies significantly among institutions. Some universities house central IT departments which provide both day-to-day hardware, software, networking and telecommunications support for the entire campus in addition to research-specific computing functions, while others break research support into a separate research computing department or house localized research computing units within colleges or schools. For simplicity’s sake, our inventory did not attempt to differentiate among these organizational models. Instead, we sought to identify both IT departments and research computing units (shorthanded as “IT departments”) that offered services to particular research units or the campus as a whole beyond the provision of hardware, software, security guidance and troubleshooting.
While libraries lead in the provision of research data services, some IT departments also offer training in statistical software, research data management consultations, and other services. In some cases, it appears that services offered by the IT department may be filling in the gaps of what the library would typically provide. Of the eight R1 universities (20 percent of our sample) whose libraries did not appear to offer research data services, seven had services available through the IT department instead. (It is also not uncommon for both the library and IT department to offer research data services at the same institution: this was the case for 45 percent of R1s sampled.)
Centers, Facilities, Departments, and Professional Schools
A great deal of research data services provision is decentralized within the university structure. Services can be offered by independent research centers and institutes, “core” facilities, academic departments, and professional schools, often with minimal coordination. Most services offered outside the library and IT department have a specialized disciplinary or methodological focus, although some offer multidisciplinary and generalized support. In many cases, these services are offered to both internal and external clients. As described above, we classified these services using eight categories: bioinformatics, business, clinical data, geospatial, statistics, social sciences, visualization, general (no specific disciplinary/methodological focus), and other.
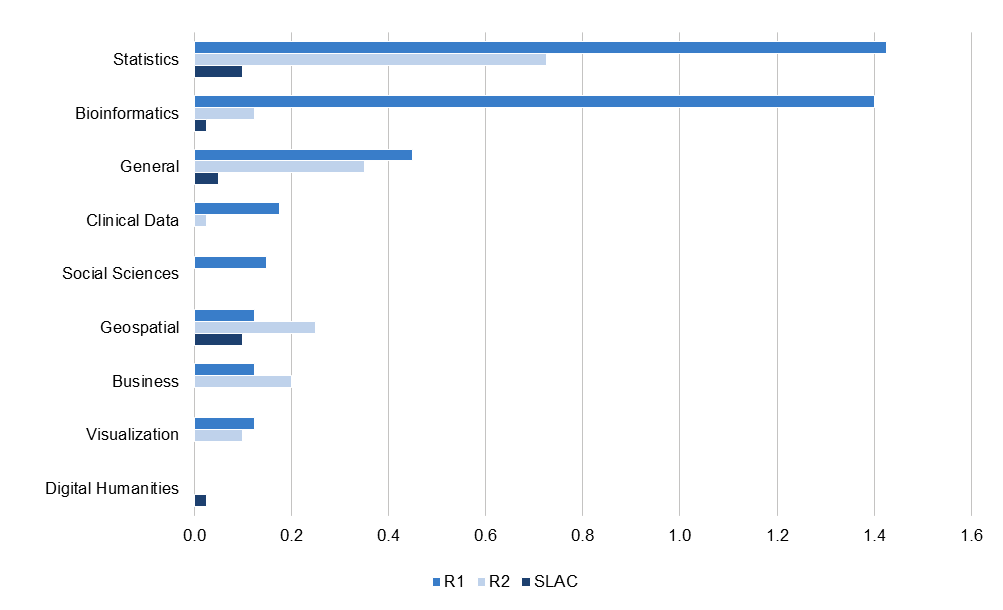
At R1 institutions, statistics and bioinformatics services are by far the most common (see Figure 7): the average R1 has at least one of each. Statistics services are also important at R2 institutions. These service types are discussed in greater detail below. Other service types are represented only in a fraction of institutions across Carnegie classifications.
Figure 7. Average number of research data services per institution offered by independent centers and facilities, departments, and professional schools, by institution type and disciplinary or methodological focus of service
Staffing Models
Research data services housed outside of library and IT departments may be staffed by faculty, staff, or students (see Figure 8). Across Carnegie classifications, nearly half of these services (45.2 percent) were organized and delivered exclusively by staff members. Another 29 percent represented a combined effort by faculty and staff; in many of these cases, a faculty member is designated as the director or otherwise given oversight of a service for a limited period of time, while staff focus on day-to-day operations. A small but significant proportion (12.4 percent) are run exclusively by faculty, while students—usually graduate students—are involved in the delivery of 13.3 percent of services.[12]
A somewhat different picture emerges when we look at statistics services, which represent over a third of research data services offered outside the library and IT department, specifically. These services are frequently located in statistics departments, mathematics departments, and medical schools; they can also be found in political science and economics departments. Perhaps as a result of their organizational location, 66.7 percent of these services are staffed at least in part by faculty members, compared with 42.3 percent of other services. Statistics services are discussed in greater depth below.
Figure 8. Staffing models of 241 research data services offered by independent centers and facilities, departments, and professional schools identified across our sample of 40 R1, 40 R2, and 40 SLAC institutions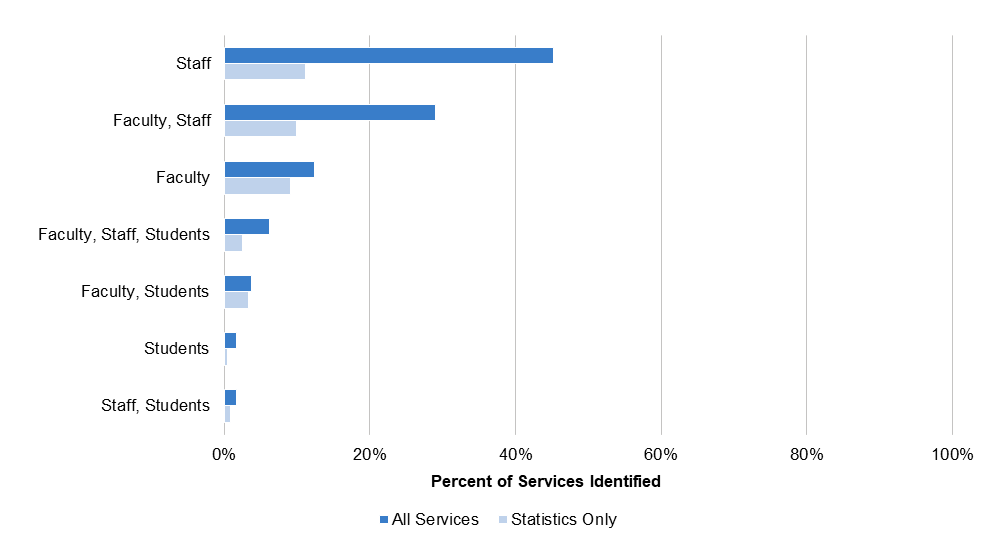 Statistics Services
The most common type of research data service offered outside library and IT departments focuses on providing support for statistical analysis and methodological design. For example, the University of Wisconsin Milwaukee School of Education’s Consulting Office for Research and Evaluation (CORE) offers assistance in research design, statistical analysis, data processing and database design.[13] Research data services focused on statistics are frequently found in academic departments, most commonly the statistics department; independent centers and facilities; medical schools; libraries; IT departments; and other professional schools (see Figure 9). Seventy percent of R1s, 60 percent of R2s, and 22.5 percent of SLACs offer at least one statistics-focused service across the organization (see Figure 10). The prevalence of these services across the university structure suggests strong demand for statistical support across disciplines and user groups. However, as discussed below, many institutions, particularly R2s and SLACs, lack statistics-focused services.
Seventy percent of R1s, 60 percent of R2s, and 22.5 percent of SLACs offer at least one statistics-focused service across the organization.
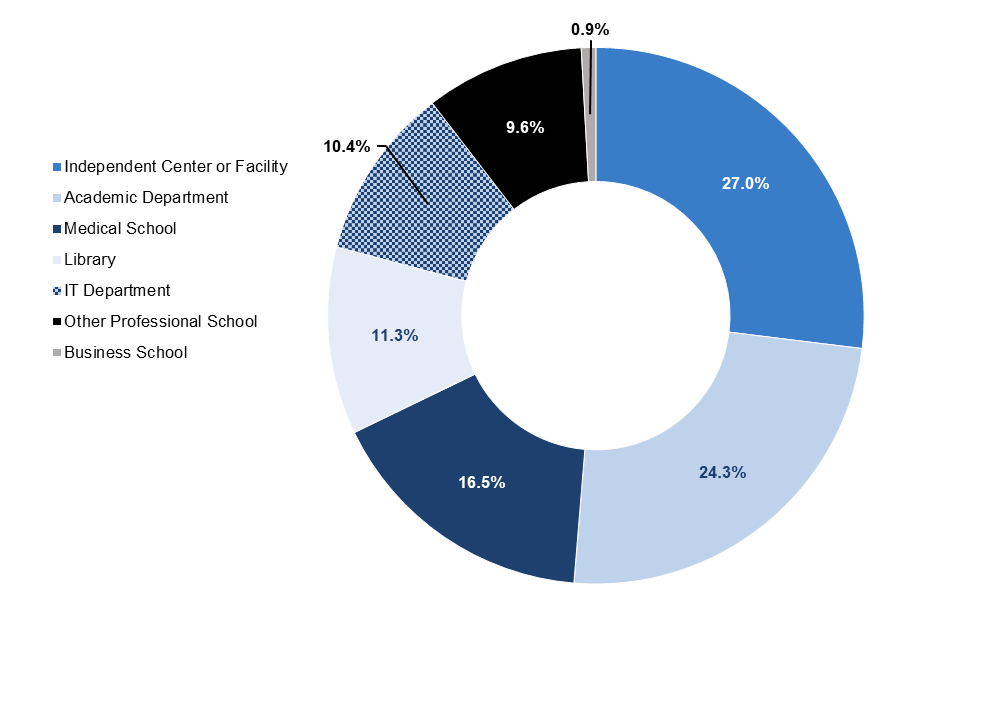
Figure 9. Organizational location of 115 statistics services identified across our sample of 40 R1, 40 R2, and 40 SLAC institutions
Bioinformatics Data Services and Medical Schools
Bioinformatics is an interdisciplinary field involving the application of informatics or data science techniques to understand biological systems.[14] “Rapid advances in molecular technologies during the past two decades” and “an arsenal of bioinformatics databases and software tools” have spurred significant investments in data-related support.[15] As shown in Figure 7 above, research data services focused on bioinformatics are nearly as prevalent as statistics services in R1 institutions, although they are uncommon in R2s and SLACs. This is largely due to the frequency with which medical schools, which are most commonly found in R1 institutions, provide bioinformatics data services.
Thirty-one of the 40 R1 institutions (77.5 percent) and eight of the 40 R2 institutions (20 percent) in our sample have medical schools.[16] R1 medical schools provide more research data services than R2 medical schools: the 31 R1 medical schools sampled offered an average of 1.8 research data services per school, while the eight R2 medical schools averaged 1.3 services each. The 31 R1 medical schools in our sample had an average of 1.03 bioinformatics services per school, accounting for 65 percent of the bioinformatics services at those 31 institutions.
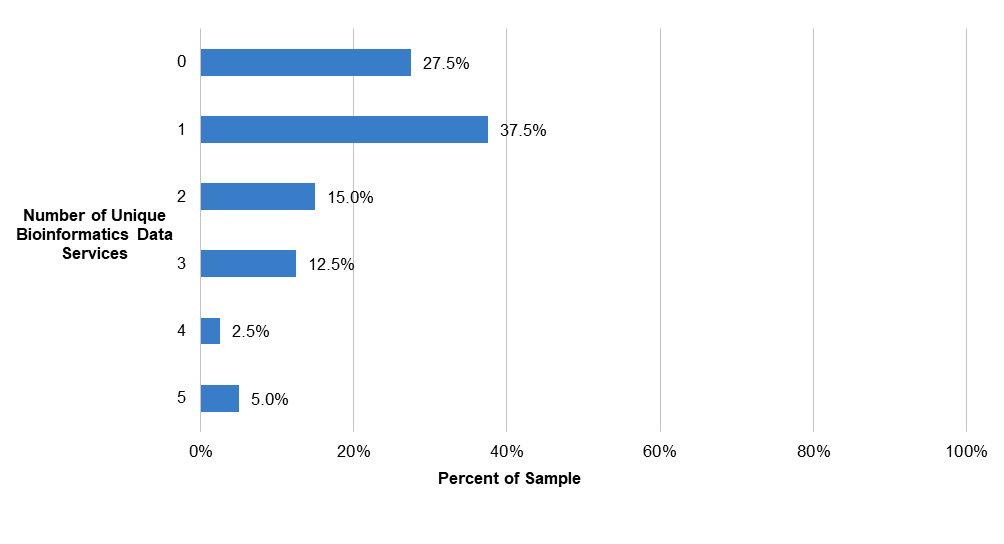
As with libraries’ provision of research data services, the average number of bioinformatics services per institution conceals significant inequality among institutions, even within Carnegie classifications (see Figure 9). Roughly one third of R1 institutions do not offer any bioinformatics services in the medical school or otherwise (27.5 percent); another little over a third offer one (37.5 percent), while another roughly third (35 percent) offer between two and five separate services.
Figure 10. Number of unique bioinformatics data services per R1 institution
Service Gaps
In contrast to the relatively strong provision of statistics and bioinformatics data services, at least at elite institutions, our inventory also revealed several disciplinary and methodological areas which may be under-provisioned with research data services across institution types.
Business Schools
Despite the undeniable importance of data science in business today, business schools appear to be lagging behind in the provision of research data services. The median business school does not offer any research data services to its faculty. Within our sample, 37 R1s, 36 R2s, and four SLACs have a business school,[17] yet we only identified 17 research data services housed in business schools among these institutions—nine housed in R1s and eight in R2s. Examples of research data services offered by business schools include project planning for computing-intensive research and consulting on customized database applications.[18]
Despite the undeniable importance of data science in business today, business schools appear to be lagging behind in the provision of research data services.
It should be noted that some business school webpages, especially among R1s, do advertise the data science consulting services of their own faculty members, graduate students, or even advanced undergraduates to external public- and private-sector clients. We did not count these initiatives in our inventory unless their webpages explicitly offered services to the college or university community. However, there may be an opportunity to expand the focus of these externally-facing consulting programs to provide a structured way for business school faculty and students to support one another’s data-driven research in the manner that many statistics departments already do.
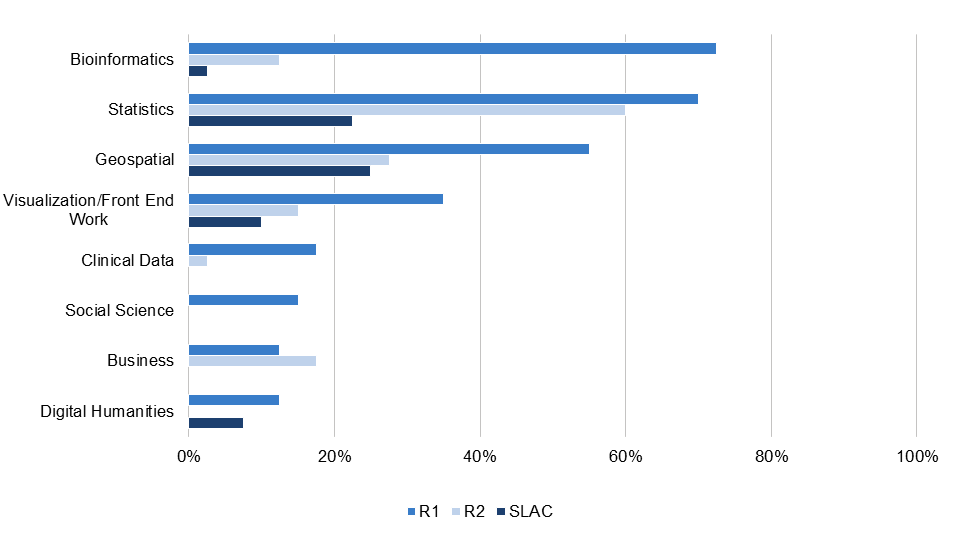
Figure 11. Percentage of institutions with at least one research data service in a disciplinary or thematic area, by institution type
Other Service Gaps
Figure 11 combines data from across libraries, IT departments, academic departments, independent research centers and facilities, and professional schools. At over half of R1s, a researcher seeking help with bioinformatics, statistical, or geospatial data work could theoretically find at least one support service at their own institution. At around one third of R1s they would also find help with creating visualizations or other front end work, such as web development. More than half of R2 institutions offer some form of statistics support; around a third of R2s and SLACs support geospatial data research. By contrast, services that support working with clinical data, or research data services tailored to the social sciences, business, or digital humanities, are hit and miss—less than 20 percent of institutions across Carnegie classifications offer these services.
Conclusion
The results of this inventory suggest that the research data services landscape is decentralized and uneven. While many universities and funders are allocating significant resources to support data-driven research, formal services in all but a few areas remain anomalies. Researchers at well-provisioned R1s can expect to access at least a handful of different services, including high performance computing, generalist consultations through the library or IT department, statistical consulting, at least one bioinformatics support facility, but this is not the case at most institutions.
Do these apparent gaps represent a serious disadvantage for researchers? Our inventory does not attempt to answer this question. Institutions with fewer services may have fewer needs for this kind of support based on the research they conduct. Or, they may have centralized a similar services portfolio in a smaller set of discrete services. Many researchers may be able to access the support they need informally—by asking a colleague or staff member for help personally, assigning the task to a data-savvy graduate student, turning to a third-party service outside the university, or simply searching for answers online. Researchers also unlock data expertise through the collaborations they establish, whether by partnering across disciplinary boundaries or hiring a postdoctoral data scientist to work with their lab. Qualitative research methodologies may be best suited for elucidating these practices; for example, Ithaka S+R is currently collaborating with 21 academic libraries to conduct semi-structured interviews on the workflows and support needs of big data researchers.[19] In cases where an institution does not provide research data services tailored specifically to a particular discipline—for example, if an institution does not offer a research data service tailored to humanists—generalist consultations through the library or IT department may be sufficient for many researchers’ needs. But it is also possible that greater availability of localized, tailored research data support would encourage more faculty members to embark on more, or more technically challenging, data work. Further research is needed to determine the extent of unmet demand for research data services.
This inventory raises a number of questions regarding how the provision of research data services is best organized.
By quantifying the provision of research data services in relation to particular organizational units, this inventory raises a number of questions regarding how the provision of research data services is best organized. The very fact that some universities support five separate bioinformatics services suggests that there may be benefits to providing support to faculty “locally,” that is, close to the researcher’s own academic department in terms of organizational structure or even campus location. Or, by another interpretation, five bioinformatics services represent a serious inefficiency—the byproduct of unwieldy, decentralized university organizational and budget structures and funding sources. These dilemmas are familiar to library and IT leaders, who periodically grapple with the benefits of centralizing service provision as well as the benefits of distributing service provision through departments and schools. Our findings mirror this experience: strategic decisions about the provision of research data services must be retrofitted to legacy organizational tendencies.
Deciding how research data services should best be provided will also require an understanding of how far faculty members are willing to venture outside their own departments for support; whether they will trust someone who is not a subject specialist to give them advice; and, crucially, how discovery mechanisms and outreach efforts can be optimized to make sure that researchers know where to look for help. As centralized points of contact on campus, libraries, IT departments, and research offices may be particularly well positioned to act as dispatchers, connecting scholars to the services that best meet their needs.
Looking ahead, it is also important to determine how research data services should continue to be built out in areas where provision is currently lacking. Given budgetary realities and scholars’ increasingly digital workflows, the best solution may not be for every college and university to offer a full suite of research data services on its own. Collaborative models to share faculty and staff expertise across institutional boundaries, such as the Data Curation Network and Data Science Collaboratory, are promising examples of collaborative research data service provision.[20] There is also an emerging landscape of nonprofit and private-sector third-party providers who offer research data training. Data Carpentry operates a train-the-trainers model to provide programming workshops at member institutions while publishing its curriculum freely online.[21] And Springer Nature has begun offering on-campus research data management workshops.[22]
An additional area for further investigation is staffing models. Some research data services, particularly statistics consultancies, rely on faculty members to provide their expertise for an hourly fee, sometimes with student support. In a few cases, students are the principal consultants working under faculty or staff supervision. It is possible that this service model could be replicated for other types of research data services, but doing so will require an alignment of incentives. Faculty will look for consulting work to yield new collaborations that enhance their research programs, while students seek course credit, tuition support, and experience that will lead to improved job prospects.
Colleges and universities are also working to advance data science—and to produce data-skilled graduates—in ways that go well beyond the provision of research data services. Some strategies include creating online resources to orient faculty to research data resources,[23] developing new degree programs and research centers,[24] facilitating extracurricular activities and networking events for students,[25] and marketing faculty expertise to external private- and public-sector clients.[26] Institutions are also taking concrete steps to encourage the kind of peer-to-peer support among faculty that this inventory does not capture. For example, Howard University’s Research Centers in Minority Institutions program, in addition to operating traditional research facility “cores,” supports a mentorship program for junior faculty.[27]
Providing robust, effective research data services to researchers across disciplines and institutions will require strategic foresight and close collaboration—across campus units that often operate in silos and across institutions. The results of this web-based inventory provide a starting point for viewing the landscape of research data services holistically, and point toward rich areas for further investigation into scholars’ needs and the organizational models that will best support them.
Appendix: Inventory Methodology
Overview
In order to generate a holistic, quantitative picture of the provision and organization of research data services, we inventoried the research data services offered at 120 colleges and universities by examining their web sites. There is an established precedent for conducting research using a systematic review of web content within the field of library and information science. This process has its roots in content analysis, a theory-heavy qualitative methodology originally developed to assess rhetoric and latent meaning in mass media communications.[28] Website reviews have also been used successfully to evaluate the research data services offered by libraries specifically.[29] However, the challenge of generating a holistic picture of research data services across institutional structures—rather than for a single unit with a more or less unified online presence—required the development of a unique methodology. Our approach was informed by a balance between achieving rigor and scope on the one hand and practical considerations, such as time constraints, on the other.
The research data services offered at 120 private and public not-for-profit institutions were inventoried, 40 each from the following Carnegie classification[30] categories:
- R1 (Doctoral Universities: Very High Research Activity)
- R2 (Doctoral Universities: High Research Activity)
- Baccalaureate Colleges: Arts and Sciences Focus, further refined to only those institutions classified as “more selective.” Hereafter these institutions are referred to as selective liberal arts colleges (SLACs).
The inventory process involved randomly selecting a college or university, systematically searching the institution’s webpages for evidence of research data services, and recording the services identified via a Google Forms template (see Appendix), one form per institution. Google Forms was selected as a data entry tool for its ease of use; a future iteration of this methodology might involve using a more sophisticated and customizable tool. The inventory process was extremely labor intensive: on average it took approximately four to five hours to review each R1 institution, approximately two to 3.5 hours to review each R2, and 0.5-1.5 hours to review each baccalaureate liberal arts college. Once the data was collected, a spreadsheet was generated from the inventory results, and the data was cleaned and analyzed.
The project began with an initial proof-of-concept test. Ten private not-for-profit or public academic institutions each were randomly selected from among R1, R2, and selective liberal arts colleges (SLACs), for a total sample of thirty. Initial investigations were made into inventorying institutions from the R3 (Doctoral/Professional Universities) and M1 (Master’s Colleges and Universities: Larger Programs), but it was determined that online evidence of research data services would be extremely limited within these categories. Based on the initial proof-of-concept the research instrument and research data service classifications were refined and detailed process guidelines written. These guidelines were further refined by asking two colleagues to complete inventories of randomly selected institutions, comparing the results, and discussing ambiguities. A future iteration of the methodology would likely include more formal inter-coder reliability testing. See the Appendix for a link to the deposited dataset.
Inventory Process Step-By-Step
Data collection for the inventory was completed by a single researcher (Jane Radecki) using a systematic, yet flexible, search process:
- Using the Google search engine, search for “[Full name of college or university] research data services.” If this search returns many hits from other institutions with similar names, modify the search terms using Boolean operators as required.
- Open as separate tabs within the web browser any relevant or possibly relevant results from the first two pages of search results.
- Examine each open tab in turn, inputting data into the Google Form as relevant services are found. Examining a tab will often involve opening and searching linked pages as additional tabs. Close tabs as they are determined to be irrelevant or once you have finished searching that page.
- If the initial search did not return any results from the library or IT department, navigate to these pages and examine them for relevant services as in step three.
- Navigate to the homepage of the university’s research office (not office of institutional research). Locate any available lists of research centers, institutes, or core facilities. Open links to all research centers, institutes, and core facilities that might be relevant as tabs, and repeat step three. If the research office webpage does not contain a list of research centers, institutes, and core facilities, additional searching may be required to locate this list elsewhere within the institution’s webpages or to identify research centers, institutes, and core facilities in an ad hoc manner.
- Navigate to the webpages of any pertinent professional schools (chiefly the medical school, business school, school of public health, and any other health sciences schools) and search as in step five.
- Navigate to the webpages of any pertinent academic departments (chiefly statistics, mathematics, geology, economics, and political science) and examine them for research data services.
- Additional search queries may be deployed as needed to double-check for any common services that may have been missed, e.g. “[name of institution] bioinformatics.”
Additional guidelines for the search process, including procedures in the event of broken web links and other obstacles to data collection, are detailed in the Appendix.
A few points about this search process are important to note. We recognize that not every research data service will necessarily have a meaningful web presence. While this does introduce the possibility that we may have undercounted research data services, we believe that the vast majority of such services have a web presence, even if skeletal or cursory, and that this risk will have a minimal impact on our findings. As discussed below, we also acknowledge that we are counting a particular type of formalized research data services while excluding other, more informal forms of support.
Extensive variation in the organization and layout of college and university webpages—and the complexity of the webpages themselves—made it necessary to create a process that was sufficiently scaffolded to assist the researcher in achieving thorough coverage, yet sufficiently flexible to allow a degree of discretion in how the researcher conducted the inventory search. We found that through practice, we could begin to identify patterns in the way information was presented online across university webpages; yet deviations from those patterns continued to confront us during the inventory process. These realities precluded us from creating a keyword search and website review process that would be precisely replicable.[31] Our data collection method was intended to yield an aggregate picture of the prevalence and location of different types of research data services, rather than precise profiles of individual institutions’ offerings. Ultimately, the process was designed with the aim of identifying the largest number of research data services as comprehensively and efficiently as possible. The use of Google’s search engine to conduct the inventory is also important to note in light of this point. We believe that Google’s algorithmic prioritization of certain search results in response to the user’s search history and other factors did not materially detract from the inventory process; it may even have assisted the researcher in locating relevant services quickly.
Another possible objection to the process may be that in identifying particular professional schools and academic departments as likely hosts to research data services, we were prejudicing our results in favor of these units. We acknowledge this risk, but believe that the risk of material distortion in our results is low, for the following reasons. First, the inventory process for each institution began and ended with keyword searching, which in many cases helped to identify research data services that may not otherwise have been found. Second, the prioritization of particular schools and departments was only arrived at after an iterative testing process, as described above. Third, the interconnectedness of college and university web pages played to our advantage. Library and IT webpages and the webpages of research centers, institutes, and core facilities—all of which were searched extensively—often hyperlink to services provided by other academic units, and these links were examined as part of the search process.
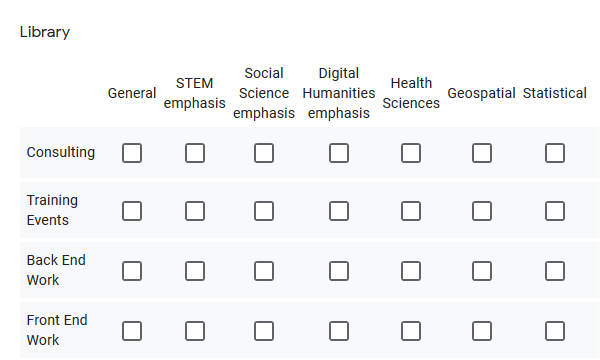
Google Forms Used for Data Collection
The data entry form was structure to record information about the types of services offered based on the organizational unit within each institution offering the service. The Library and IT department form sections used the following format:
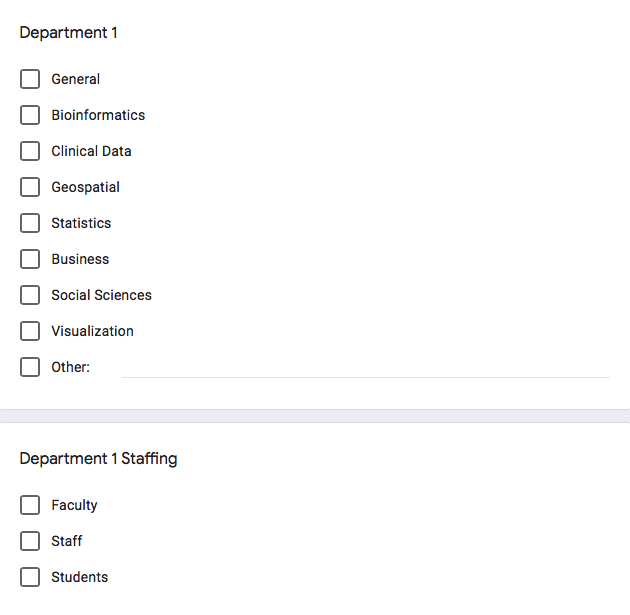
The academic department, independent center/facility, and professional school form sections used the following format:

Additional Search Process Rules and Exclusions
During the data collection process, the following rules were observed in order to improve the consistency of reporting.
Satellite campuses. The degree of integration of resources among campuses within multi-campus university systems varies considerably. If a satellite campus within a multi-campus system was randomly selected for inventorying, and it appeared that resources were shared between the satellite and flagship campus to an extent that it was impossible to distinguish one from the other, the institution was excluded from inventorying and a new institution was randomly selected. This rule resulted in one R1 institution, three R2 institutions, and one selective liberal arts college being excluded from the inventory and subsequently replaced.
Technical problems with webpages. Inevitably, a few webpages intended to represent research data services were unavailable due to technical problems. If a 404 or other web error was encountered during the search process that prevented the researcher from confirming the existence of a research data service, that service was not recorded. However, if a large portion of an institution’s research data services webpages were offline at the time the research was conducted due to a more widespread technical failure, the institution was excluded from inventorying and a new institution was randomly selected.
External webpages. Job postings and news articles regarding the institution’s research data services offerings can sometimes shed light into research support priorities and, in a few instances, actual services. However, for consistency, research data services mentioned in these sources were not recorded unless they could be verified on the university’s webpages. Useful information and links to these sources were recorded in the “notes” section of the data entry form.
The following exclusions were observed in recording research data services.
Affiliated hospitals. Many hospitals employ librarians and other information professionals and offer research data services to clinical researchers. Where these services were offered by university-affiliated hospitals separately from any services offered by the medical school, they were excluded.
Undergraduate research. Research data services offered exclusively to undergraduate students or undergraduate instructional support were excluded.
Academic programs. Statistics, GIS, or data science degree or certificate programs, including any support services offered exclusively to students enrolled in these programs, were excluded.
Affiliation benefits. Some research centers and institutes offer research data services exclusively to their affiliated researchers. These were excluded.
Services offered externally only. Many university research units, especially business schools and core facilities, advertise data-related consultations and services by faculty or staff to clients external to the university, such as private companies and government agencies. If these services appeared to be offered exclusively to external clients, they were not recorded. Services available both to university and external clients were recorded.
Sample analysis. Many core facilities, such as mass spectronomy facilities, offer analysis of biospecimen or material samples using specialized hardware, often for a fee. This type of service was excluded unless the facility also offered assistance in working with the resulting data.
Clinical trials management. Many medical schools offer researchers assistance with managing certain aspects of clinical trials, such as recruiting, obtaining consent, and maintaining patient privacy. These services were excluded unless the unit also offered assistance in working with the resulting data.
IT support. Training in the use of specialized research equipment, such as the kind frequently offered by mass spectronomy facilities as a prerequisite for use of the machinery, was not considered a research data service, since it supports researchers in the process of experimental data collection rather than working with research data. General or specialized IT troubleshooting was also not included. However, as described above, training in data research methods or management offered by IT departments was recorded, including support with designing computing-intensive projects.
Dataset Deposit Information
The complete inventory dataset, with documentation, is available at https://doi.org/10.5281/zenodo.4270332. If you have questions about using this dataset, please contact jane.radecki@ithaka.org and rebecca.springer@ithaka.org
Endnotes
- In addition to the studies cited in notes 5-7, see also the following: Meng Li, “Expanding Roles in a Library-Based Bioinformatics Service Program: A Case Study,” Journal of the Medical Library Association 101:4 (2013), DOI: 10.3163/1536-5050.101.4.012; Stephen Pinfield, Andrew Cox, and Jen Smith, “Research Data Management and Libraries: Relationships, Activities, Drivers and Influences,” PLOS ONE (Dec. 8, 2014), DOI: 10.1371/journal.pone.0114734; Michele P. Claibourn, “Bigger on the Inside: Building Research Data Services at the University of Virginia,” Insights 28:2 (2015), DOI: 10.1629/uksg.239; Shelly L. Knuth, Andrew M. Johnson, and Thomas Hauser, “Research Data Services at the University of Colorado Boulder,” ASIS&T Bulletin 41:6 (Sept. 2015), DOI: 10.1002/bult.2015.1720410614; Cynthia H. Vitale, Brianna Marshall, and Amy Nurnberger, “You’re in Good Company: Unifying Campus Research Data Services,” ASIS&T Bulletin 41:6 (Sept. 2015), DOI: 10.1002/bult.2015.1720410611; Lisa Federer, “Research Data Management in the Age of Big Data: Roles and Opportunities for Librarians,” Information Services and Use 36:1-2 (2016), DOI: 10.3233/ISU-160797; Elizabeth A. Berman, “An Exploratory Sequential Mixed Methods Approach to Understanding Researchers’ Data Management Practices at UVM: Integrated Findings to Develop Research Data Services,” Journal of eScience Librarianship 6:1 (2017), DOI: 10.7191/jeslib.2017.1104; Heather L. Coates, Jake Carlson, Ryan Clement, Margaret Henderson, Lisa R. Johnson, & Yasmeen Shorish, “How Are We Measuring Up? Evaluating Research Data Services in Academic Libraries,” Journal of Librarianship and Scholarly Communication 6:1 (2018), DOI: 10.7710/2162-3309.2226; Nathan Hosburgh, “Developing a Bioinformatics Program and Supporting Infrastructure in a Biomedical Library,” Journal of eScience Librarianship 7:2 (2018), DOI: 10.7191/jeslib.2018.1129; Terrie R. Wheeler, “Developing a Library Bioinformatics Program Fully Integrated into a Medical Research Institution,” Medical Reference Services Quarterly 37:4 (2018), DOI: 10.1080/02763869.2018.1514915; Robin S. Coleman, Edwin L. Brooks, and Jonathan L. Petters, “Geospatial Data Services in the University Libraries: Recommendations for Development,” 2019, http://hdl.handle.net/10919/91397. ↑
- See “A New Methodological Approach” below. ↑
- For additional detail on these categories, see “Inventory Process Overview” below. ↑
- For the purposes of this study, we did not include software provision, data storage provision, or the development of campus security protocols in our definition of research data services. See “Defining Research Data Services” below. ↑
- Carol Tenopir, Ben Birch, and Suzie Allard, “Academic Libraries and Research Data Services: An ACRL White Paper,” ACRL, June 2012, http://www.ala.org/acrl/sites/ala.org.acrl/files/content/publications/whitepapers/Tenopir_Birch_Allard.pdf; Carol Tenopir, Robert J. Sandusky, Suzie Allard, and Ben Birch, “Research Data Management Services in Academic Research Libraries and Perceptions of Librarians,” Library & Information Science Research 36:2 (2014), DOI: 10.1016/j.lisr.2013.11.003; Andrew M. Cox, Mary Anne Kennan, Liz Lyon, and Stephen Pinfield, “Developments in Research Data Management in Academic Libraries: Towards an Understanding of Research Data Service Maturity,” JASIST (Mar. 25, 2017), DOI: 10.1002/asi.23781; Carol Tenopir et al., “Research Data Services in European Academic Research Libraries,” LIBER Quarterly 27:1 (2017), DOI: 10.18352/lq.10180; Andrew M. Cox, Mary Anne Kennan, Liz Lyon, Stephen Pinfield, and Laura Sbaffi, “Maturing Research Data Services and the Transformation of Academic Libraries,” Journal of Documentation 75:6 (2019), DOI: 10.1108/JD-12-2018-0211; Matthew Murray, Megan O’Donnell, Mark J. Laufersweiler, John Novak, Betty Rozum, and Santi Thompson, “A Survey of the State of Research Data Services in 35 U.S. Academic Libraries, or ‘Wow, What a Sweeping Question,’” Research Ideas and Outcomes 5: e48809 (Dec. 27, 2019), DOI: 10.3897/rio.5.e48809. ↑
- Markus Buchhorn, “Surveying the Scale of the Research-IT Support Workforce: A Survey and Report Commissioned by the Australian Research Data Commons (ARDC),” July 2019, https://ardc.edu.au/wp-content/uploads/2019/07/ARDC-National-Workforce-report-final-v3.pdf, 10. ↑
- National Coordination Point Research Data Management (LCRDM), “Data Stewardship on the Map: A Study of Tasks and Roles in Dutch Research Institutes,” April/May 2019, https://www.lcrdm.nl/files/lcrdm/2019-05/LCRDM%20rapport%20datastewardship_EN_online.pdf, 17. ↑
- Rebecca Bryant, Annette Dortmund, and Brian Lavoie, “Social Interoperability in Research Support: Cross-Campus Partnerships and the University Research Enterprise,” OCLC Research, 2020, DOI: 10.25333/wyrd-n586. ↑
- See https://sr.ithaka.org/our-work/research-support/. ↑
- For the Open Science Grid, see https://opensciencegrid.org/. ↑
- Rebecca Springer, “Counting Data Librarians,” Ithaka S+R, July 29, 2019, https://sr.ithaka.org/blog/counting-data-librarians/. ↑
- See Jonathan S. Briganti, Andrea Ogier, and Anne M. Brown, “Piloting a Community of Student Data Consultants that Supports and Enhances Research Data Services,” IJDC 15:1 (2020), DOI: 10.2218/ijdc.v15i1.723. ↑
- https://uwm.edu/education/research/core/. ↑
- N. M. Luscombe, D. Greenbaum, and M. Gerstein, “What Is Bioinformatics? A Proposed Definition and Overview of the Field,” Methods of Information in Medicine 40 (2001), http://binf.gmu.edu/ivaisman/binf630/mim01-luscombe-what-is-bioinf.pdf. ↑
- Li, Chen, and Clintworth, “Expanding Roles,” 303. ↑
- We define “medical school” as a college or school offering MD degrees. Several of the institutions in our sample support MD studies via partnerships with nearby, but institutionally separate medical schools: for example, California Institute of Technology (Cal Tech) offers a joint MD/PhD program with University of Southern California (USC), in which the PhD is awarded by Cal Tech and the MD by USC. In these cases, we considered the sampled institution (e.g. Cal Tech) not to have a medical school, and did not include services offered by the partnered institution (e.g. USC) in our sample. ↑
- We defined a business school as a school or college awarding MBA degrees. ↑
- https://www.ou.edu/price/centersresearch/cemr/cemr_data; http://scrc.scrc.nyu.edu/scrc/?page_id=125. ↑
- Danielle Cooper and Rebecca Springer, “Launching Two Projects on Supporting Data Work,” Ithaka S+R, May 14, 2020, https://sr.ithaka.org/blog/launching-two-projects-on-supporting-data-work. ↑
- See https://www.colgate.edu/about/campus-services-and-resources/data-science-collaboratory; https://datacurationnetwork.org/. ↑
- See https://datacarpentry.org/. ↑
- See https://partnerships.nature.com/product/nature-research-academies-research-data-workshops/. ↑
- See https://guides.nyu.edu/c.php?g=277095&p=1847023. ↑
- See https://ischoolonline.berkeley.edu/data-science/. ↑
- See https://www.mbs-dirpa.org/student-analytics-club. ↑
- See https://www.purdue.edu/data-science/dscs/. ↑
- See https://rcmi.howard.edu/rcmi-services-3/. ↑
- Uwe Flick, Ernst von Kardorff and Ines Steinke, eds., A Companion to Qualitative Research (London, 2004), 266-69. ↑
- Li Si, Wnming Xing, Xiaozhe Zhuang, Xiaoqin Hua, and Limei Zhou, “Investigation and Analysis of Research Data Services in University Libraries,” The Electronic Library 33:3 (2015), DOI: 10.1108/EL-07-2013-0130; Holly H. Yu, “The Role of Academic Libraries in Research Data Service (RDS) Provision: Opportunities and Challenges,” The Electronic Library 35:4 (2017), DOI: 10.1108/EL-10-2016-0233. ↑
- See https://carnegieclassifications.iu.edu. ↑
- However, we have made our dataset available (see Appendix) partly in order to invite discussion and debate around the accuracy and efficiency of our method relative to other approaches. ↑
Attribution/NonCommercial 4.0 International License. To view a copy of the license, please see http://creativecommons.org/licenses/by-nc/4.0/.