Targeted Financial Aid and Workforce Opportunity
Five State Case Studies
Introduction
States play a pivotal role in financing higher education and shaping the pathways that connect learners to opportunity. In an era of federal uncertainty and shifting policy priorities, state leaders face increasing pressure to ensure that public investments in postsecondary education advance both broad attainment goals and more specific workforce needs. Our companion report, “Aligning State Investments with Workforce Opportunity: A Framework for Targeted Higher Education Funding,” describes how states deploy two primary levers, direct institutional support and student financial aid, and how these investments can be targeted toward industry- or occupation-aligned credentials.[1] This paper extends that framework by examining five states—Washington, Virginia, New York, Kentucky, and Ohio—to explore how targeted financial aid fits within each state’s broader investment strategy and labor market context.
This paper is intentionally oriented toward helping states advance policy decisions and understand investment tradeoffs related to their financial aid and workforce alignment strategies. Across the five states, we ask three practical questions. First, where do gaps exist between the credentials states produce and the high-opportunity occupations their labor markets demand? Second, to what extent do state investments—particularly targeted financial aid—align with those gaps? That is, do the fields and pathways supported by appropriations and aid correspond to the high-opportunity occupations where openings exceed current credential production? Third, given the broader funding toolkit available to states, when does targeted aid appear to be a useful mechanism for strengthening alignment, and when might other levers—appropriations, performance-based funding, capacity investments, or student success supports—matter more?
Targeted financial aid can be a precision tool, but it is rarely sufficient on its own.
The cases underscore a consistent theme: targeted financial aid can be a precision tool, but it is rarely sufficient on its own. When a state’s primary constraint is declining enrollment, limited program capacity, or uneven completion, even well-designed targeted aid may have modest effects unless paired with complementary investments. Conversely, when high-opportunity shortages are concentrated in a manageable set of occupations with clear credential linkages, targeted aid can help states steer enrollment toward priority fields and potentially accelerate progress toward workforce and attainment goals.
High-opportunity occupations and targeted aid
States and research organizations define “in-demand” and “good jobs” in different ways. In this work, we focus on “high-opportunity occupations,” which are defined using state-specific indicators of wages, job openings, and projected growth, along with restrictions intended to keep the analysis centered on occupations that can plausibly be reached through short-term credentials, associate degrees, or bachelor’s degrees. The purpose of this definition is not to establish a single national standard, but to support state-relevant comparisons: the occupations that offer strong opportunity, and the credentials that connect learners to those occupations, differ meaningfully across states.
To construct these profiles, we draw on a set of public, state-comparable data sources. Labor market conditions (unemployment rates and job openings) come from the US Bureau of Labor Statistics (BLS), and the lists of high-opportunity occupations are built from BLS state-by-occupation data on wages, annual openings, and projected growth. Measures of postsecondary enrollment, retention, and graduation come from the Integrated Postsecondary Education Data System (IPEDS), and degree production by field and award level is also drawn from IPEDS completions. State attainment rates and “some college, no credential” patterns rely on national household data sources commonly used in state attainment tracking, complemented by National Student Clearinghouse estimates where available. To describe state investments, we use the State Higher Education Executive Officers Association’s (SHEEO) State Higher Education Finance (SHEF) data for appropriations and enrollment denominators, and National Association of State Student Grant and Aid Programs (NASSGAP) survey data to describe state financial aid portfolios and identify which programs are targeted. Where relevant, we supplement these sources with state documentation on performance-based funding formulas and official state workforce dashboards or in-demand occupation lists to describe how states define and communicate workforce priorities.
We use “targeted financial aid” to refer to state financial aid programs that make eligibility contingent on enrollment in specified fields, credentials, or training pathways linked to particular industries or occupations. These programs take many forms, including grants and scholarships, conditional grants, loans, and loan forgiveness or assumption. Some target high economic value fields such as healthcare, engineering, and technology; others prioritize occupations with high social value, such as teaching, even when wages are lower.
To identify targeted aid, we begin with NASSGAP’s program-level survey data and apply the classification approach described in our prior paper. In brief, we reviewed program names and descriptions and categorized each program based on whether eligibility is tied to an explicit field of study, occupation, or industry-aligned pathway. Programs that are broad-based (e.g., need- or merit-based without field restrictions) are treated as non-targeted, while programs that require enrollment in specified majors or credential pathways are coded as targeted; targeted programs are then grouped by the primary field(s) they aim to support (for example, healthcare, education, STEM, CTE/workforce training, or multi-sector “in-demand” programs).
Importantly, targeted aid is only one way states can align investments with workforce needs and credential gaps (the differences between high-opportunity openings and the number of relevant graduates). States also shape alignment through appropriations levels, performance-based funding metrics that reward completions in priority fields, and investments that expand program capacity or improve student success.
State profiles
To select states for deeper case studies, we used our combined postsecondary and labor market data to identify places where targeted aid policy could plausibly matter under different conditions. We selected states to reflect variation in how much targeted aid is used as a share of total state financial aid, evidence of potential skills mismatch in the labor force (for example, unemployment relative to job openings), and geographic diversity to capture different regional contexts. The resulting set—Washington, Virginia, New York, Kentucky, and Ohio—includes states with different investment profiles and different mixes of high-opportunity demand, allowing us to examine how alignment challenges and policy options vary across contexts.
Washington
Labor market context
Washington’s labor market exhibits an unusual combination of overall softness and strong demand for bachelor’s-degree holders. As of June 2025, Washington’s unemployment rate was 4.5 percent[2]—above the national average of 4.1 percent[3]—and, using May 2025 jobs data, the state ranked second to last in job openings per 1,000 working-age residents (32.79 openings, compared to 44.65 nationally).[4] These indicators suggest a labor market with relatively high unemployment and relatively few job openings overall. At the same time, Washington fares much better on high-opportunity job openings that require a bachelor’s degree, ranking third nationally at 20.5 openings per 1,000 residents, well above the national average of 12.9. Taken together, this pattern implies that Washington’s labor market demand is comparatively constrained for workers overall, but demand is relatively strong for workers with bachelor’s-level credentials.
Washington’s most common high-opportunity openings are concentrated in business-related occupations, nursing, and education. The top high-opportunity occupations by openings include business operations specialists and management analysts, registered nurses, accountants and auditors, and market research analysts and marketing specialists (Table WA1). Washington’s comparatively high teacher wages also elevate teaching occupations into the high-opportunity category in ways that are not always observed in other states.
Table WA1. Top Occupations by Job Openings in Washington State
| Occupation | Avg Annual Openings (2023) | Median Salary (2023) | Rate of growth (%, 2022 to 2032) |
| Business Operations Specialists, All Other | 7,110 | $84,380 | 19.5% |
| Management Analysts | 5,370 | $108,700 | 31.3% |
| Registered Nurses | 5,150 | $107,720 | 13.4% |
| Accountants and Auditors | 4,610 | $88,630 | 15.2% |
| Market Research Analysts and Marketing Specialists | 4,210 | $96,960 | 25.8% |
| Teachers and Instructors, All Other* | 4,100 | $68,980 | 13.1% |
| Elementary School Teachers | 3,250 | $87,960 | 13.3% |
| Human Resources Specialists | 2,630 | $81,190 | 16.0% |
| Construction Managers | 2,090 | $129,680 | 18.0% |
| Computer Systems Analysts | 1,920 | $128,710 | 15.8% |
Note: All occupations on this list have a typical education requirement of at least associate’s degree and require less than five years of experience.
* Just short of the median wage, at the 49.4th percentile
Postsecondary performance and credential production
Washington’s postsecondary sector performs strongly once students enroll, but the state’s ability to meet labor market demand may be constrained by steep enrollment declines. Student outcomes exceed national averages in both sectors. In the two-year sector, full-time retention is 61 percent and graduation is 36 percent, compared to national averages of 60 percent and 31 percent. In the four-year sector, full-time retention is 83 percent and graduation is 68 percent, above national benchmarks of 80 percent and 62 percent. These indicators suggest that Washington’s institutions are relatively effective at supporting students through to completion once they enroll.
Enrollment trends, however, represent a significant challenge. From 2017 to 2022, full-time equivalent enrollment declined by 23 percent in the two-year sector, well above the national decline of 15 percent. Four-year institutions experienced a 13 percent decline over the same period, compared to a national average decline of 4 percent. These steeper-than-average declines indicate a contraction in postsecondary participation, particularly in the two-year sector, and raise concerns about whether Washington can sustain the level of credential production needed to meet current and future workforce demand.
Despite these enrollment declines, Washington has one of the highest attainment rates in the nation: 50 percent of working-age adults hold an associate degree or higher, above the national average of 45 percent. The state also converts enrollment into credentials relatively effectively, as reflected in a lower ratio of adults with some college but no credential—approximately 1,500 adults per 1,000 undergraduates in Washington, compared to just over 2,200 nationally. Even so, Washington remains below its stated goal of having 70 percent of adults ages 25 to 44 hold a postsecondary credential.[5]
Washington produces credentials in a range of fields, with the largest volumes in business, health professions, and computer and information sciences. In 2022, Washington’s public institutions produced over 28,000 bachelor’s degrees and over 10,000 associate degrees.[6] Business, management, and marketing accounted for 5,804 bachelor’s degrees and 2,903 associate degrees; health professions accounted for 2,498 bachelor’s degrees and 3,387 associate degrees; and computer and information sciences accounted for 2,842 bachelor’s degrees and 961 associate degrees. Education accounted for 1,572 bachelor’s degrees and 341 associate degrees (Table WA2).
Table WA2. Top Programs by Degree Production in Washington State
| Degree Program | Bachelor’s Degrees Awarded (2022) | Associate’s Degrees Awarded (2022) | Total Annual Degree Production (2022) |
| Business, Management, Marketing, and Related Support Services | 5,804 | 2,903 | 8,707 |
| Health Professions and Related Programs | 2,498 | 3,387 | 5,885 |
| Computer and Information Sciences and Support Services | 2,842 | 961 | 3,803 |
| Biological and Biomedical Sciences | 2,627 | 304 | 2,931 |
| Engineering | 2,253 | 236 | 2,489 |
| Education | 1,572 | 341 | 1,913 |
| Communication, Journalism, and Related Programs | 1,875 | 3 | 1,878 |
| Social Sciences | 1,720 | 12 | 1,732 |
| Visual and Performing Arts | 1,331 | 238 | 1,569 |
| Engineering Technologies and Engineering-Related Fields | 236 | 665 | 901 |
Although the bulk of degrees Washington awards align reasonably well with the fields represented in its most common high-opportunity openings, the state is not producing enough graduates to fill existing vacancies—particularly in education and nursing. For the two education occupations that appear among Washington’s top high-opportunity openings, there are a combined 7,350 average annual openings, while institutions awarded 1,913 education degrees in 2022—about a quarter of those openings. In nursing, Washington awards 3,042 degrees annually, which comprise about 52 percent of the 5,885 health professions and related programs degrees produced, reported in the table above. Those nursing degrees equal approximately 59 percent of the average annual nursing vacancies. In this context, Washington’s high attainment and strong institutional performance coexist with workforce gaps that are likely to persist if enrollment continues to decline.
Alignment between state investment and workforce needs
Washington’s investment patterns are consistent with a state that has prioritized student aid and need-based support, though targeted aid remains a modest share of the overall portfolio. Washington ranks 10th nationally in appropriations per net FTE ($11,319 compared to $8,139 nationally) and 24th in effort per $1,000 of personal income ($3.38 compared to $3.50 nationally).[7] The state directs an extraordinarily high share of aid to need-based programs (97 percent versus 69 percent nationally) and ranks among the top states in total financial aid per net FTE enrollment ($2,504 compared to $1,427 nationally).
Washington operates a performance-based funding model for two-year institutions, but only a small portion of appropriations are allocated based on outcomes ($57.3 million per year, or $556 per two-year net FTE). This represents 5 percent of appropriations to two-year institutions and 2.4 percent of total appropriations. None of this performance funding is targeted to the production of industry-aligned degrees or credentials. Instead, funds are awarded based on achievement and completion milestones such as retention, completion of college-level math and English, and degree or certificate completion.[8]
Washington has 10 targeted financial aid programs—more than most states—and devotes a higher dollar amount to targeted aid than any other state ($42.8 million). Yet the state ranks 11th in the share of total aid that is targeted: targeted programs account for 8 percent of total financial aid. In practical terms, about $200 of Washington’s $2,504 of aid per net FTE is targeted to specific industry-aligned programs (Figure WA1).
Figure WA1. Higher Education Financial Aid and Appropriations per Net FTE Equivalent, Washington
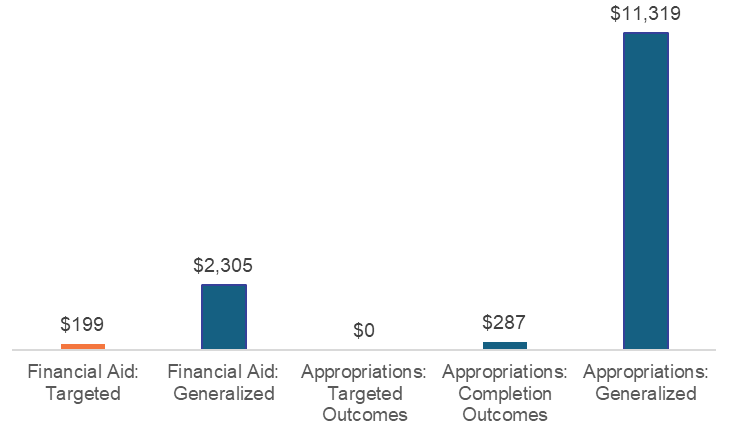
The largest targeted programs include the Opportunity Grant for Community and Technical Colleges ($12.3 million, focused on high-demand, high-wage fields and healthcare), the Opportunity Scholarship for Baccalaureate Students ($11.7 million, focused on STEM and healthcare), and the Worker Retraining Program ($11.3 million, supporting basic skills courses and professional-technical programs). With multiple programs dedicated to healthcare and education, Washington has used targeted aid to support two of its most in-demand areas while also maintaining broader programs that cover a wide range of in-demand pathways (Table WA3).
Table WA3. Targeted Aid Programs in Washington State
| Program | Aid Type | Targeted Fields | Expenditures | Recipients |
| SBCTC Opportunity Grant | Grant or Scholarship | High-demand, high-wage fields + healthcare | $12,267,334 | 4,211 |
| Opportunity Scholarship for Baccalaureate Students | Grant or Scholarship | STEM and healthcare | $11,705,210 | 3,226 |
| Worker Retraining Program | Grant or Scholarship | Basic skills and professional technical programs | $11,334,485 | 6,661 |
| WSOS Career Technical Scholarship Program | Grant or Scholarship | CTE | $4,579,165 | 1504 |
| Teacher Shortage Conditional Grant Program | Conditional grant or loan | Teaching | $1,103,937 | 151 |
| Alternative Routes to Teaching Conditional Scholarship | Conditional grant or loan | Teaching | $704,000 | 88 |
| Washington Award for Vocational Excellence | Grant or Scholarship | CTE | $403,937 | 56 |
| Student Teaching Grant | Grant or Scholarship | Teaching | $370,255 | 48 |
| Educator Retooling Conditional Scholarship | Conditional grant or loan | Teaching | $273,000 | 91 |
| Aerospace Training Student Loan Program | Loan | Engineering | $42,400 | 8 |
Washington also maintains an official, publicly accessible approach to identifying in-demand jobs, defining them as occupations where labor demand exceeds labor supply either statewide or regionally.[9] The state’s tools allow users to explore in-demand status by occupation and geography, although they provide limited ability to sort or rank by openings or education requirements.
What we learn from Washington
Taken together, Washington has a high overall investment in financial aid, an extraordinarily high proportion of aid devoted to need-based programs, and a relatively high level of targeted aid in dollar terms. Yet labor market indicators show overall softness alongside unusually strong high-opportunity demand for bachelor’s-level workers. Because targeted aid still accounts for less than 10 percent of the portfolio, Washington may benefit from increasing the share of aid devoted to targeted programs and revisiting the list of eligible degrees to ensure that Washingtonians have viable pathways into the occupations that offer the strongest opportunity. At the same time, the state’s steep enrollment declines suggest that targeted aid is likely to be most effective when paired with strategies that stabilize enrollment and expand capacity in high-demand programs—particularly in nursing and education, where gaps are most acute.
Virginia
Labor market context
Virginia’s labor market is comparatively strong, and its postsecondary system performs well on standard measures of retention and completion, providing an important backdrop for interpreting how targeted aid functions in the state. As of June 2025, Virginia’s unemployment rate was 3.5 percent[10]—below the national average of 4.1 percent.[11] Using May 2025 jobs data, Virginia ranked 11th in job openings per 1,000 working-age residents (52.32 openings, compared to 44.65 nationally).[12] These indicators suggest a labor market with relatively low unemployment and higher-than-average job openings overall. Virginia ranks eighth nationally for high-opportunity openings requiring a bachelor’s degree, at 16.03 openings per 1,000 residents, above the national average of 12.9.
Virginia’s labor market is comparatively strong, and its postsecondary system performs well on standard measures of retention and completion, providing an important backdrop for interpreting how targeted aid functions in the state.
Virginia’s most common high-opportunity openings are concentrated in software development and related technology occupations, accounting and auditing, and nursing. The top occupations by openings include software developers, accountants and auditors, registered nurses, business operations specialists, and a set of other business and IT-related roles (Table VA1). This pattern underscores the state’s continued demand for workers in technology and professional services, alongside persistent needs in healthcare.
Table VA1. Top Occupations by Job Openings in Virginia
| Occupation | Avg Annual Openings (2023) | Median Salary (2023) | Rate of growth (%, 2022 to 2032) |
| Software Developers | 6,920 | $135,040 | 21.4% |
| Accountants and Auditors | 4,500 | $81,590 | 6.1% |
| Registered Nurses | 4,160 | $84,100 | 4.3% |
| Business Operations Specialists, All Other | 3,780 | $83,840 | 5.6% |
| Managers, All Other | 3,280 | $151,570 | 4% |
| Human Resources Specialists | 2,920 | $76,840 | 8.8% |
| Market Research Analysts and Marketing Specialists | 2,650 | $75,640 | 14.9% |
| Project Management Specialists | 2,490 | $108,750 | 8.0% |
| Information Security Analysts | 1,810 | $133,520 | 30.8% |
| Computer Systems Analysts | 1,690 | $108,350 | 7.6% |
Note: All occupations on this list have a typical education requirement of at least associate’s degree and require less than five years of experience.
Postsecondary performance and credential production
Virginia’s postsecondary sector exhibits strong student outcomes and enrollment trends that reflect, and in some cases outperform, national patterns. In the two-year sector, full-time retention is 63 percent and graduation is 35 percent, above national averages of 60 percent and 31 percent, respectively. In the four-year sector, full-time retention is 86 percent and graduation is 73 percent, exceeding national benchmarks of 80 percent and 62 percent, respectively. These data suggest that institutions in Virginia are relatively effective at supporting students through to completion once they enroll.
Virginia faced enrollment headwinds following the onset of the COVID-19 pandemic, but those declines were generally consistent with national trends and have improved in recent years. From 2017 to 2022, full-time equivalent enrollment declined by 15 percent in the two-year sector, in line with the national average. Four-year institutions experienced only a 2 percent decline over the same period, a relatively strong outcome compared to the national average decline of 4 percent. After 2022, enrollment improved across both sectors.[13]
Virginia has one of the highest postsecondary attainment rates in the nation: 52 percent of working-age adults hold an associate degree or higher, above the national average of 45 percent. It also converts enrollment into credentials relatively effectively. Approximately 1,800 adults per 1,000 undergraduates in Virginia have some college but no credential, compared to just over 2,200 nationally. Even so, Virginia remains below its stated goal of having 70 percent of adults ages 25 to 44 hold a postsecondary credential by 2030.[14]
Virginia has one of the highest postsecondary attainment rates in the nation: 52 percent of working-age adults hold an associate degree or higher, above the national average of 45 percent.
Virginia produces credentials in a range of fields, with the largest volumes in business, health professions, and computer and information sciences. In 2022, Virginia’s public institutions produced over 43,000 bachelor’s degrees and over 12,000 associate degrees.[15] Business, management, and marketing accounted for 10,331 bachelor’s degrees and 2,751 associate degrees; health professions accounted for 4,671 bachelor’s degrees and 4,650 associate degrees; and computer and information sciences accounted for 2,991 bachelor’s degrees and 1,885 associate degrees (Table VA2).
Table VA2. Top Programs by Degree Production in Virginia
| Degree Program | Bachelor’s Degrees Awarded (2022) | Associate’s Degrees Awarded (2022) | Total Annual Degree Production (2022) |
| Business, Management, Marketing, and Related Support Services | 10,331 | 2,751 | 13,082 |
| Health Professions and Related Programs | 4,671 | 4,650 | 9,321 |
| Computer and Information Sciences and Support Services | 2,991 | 1,885 | 4,876 |
| Social Sciences | 2,031 | 1,535 | 3,566 |
| Biological and Biomedical Sciences | 3,432 | 1 | 3,433 |
| Engineering | 3,194 | 0 | 3,194 |
| Visual and Performing Arts | 2,451 | 288 | 2,739 |
| Homeland Security, Law Enforcement, Firefighting, and Related Protective Services | 1,802 | 534 | 2,336 |
| Communication, Journalism, and Related Programs | 1,975 | 7 | 1,982 |
| Education | 1,780 | 136 | 1,916 |
The degrees Virginia produces generally align well with its most common high-opportunity openings, although there is evidence of a shortfall in computer science-related graduates relative to openings. Across the top occupations list, Virginia has a combined 10,420 average annual openings in computer science-related occupations and 9,321 qualified annual graduates. Unlike many states, Virginia shows no shortage of nursing graduates: institutions award 5,433 nursing degrees annually relative to 4,160 average annual nursing vacancies. Nursing degrees comprise about 58 percent of the 9,321 health professions and related programs degrees produced, referenced in the table above.
Alignment between state investment and workforce needs
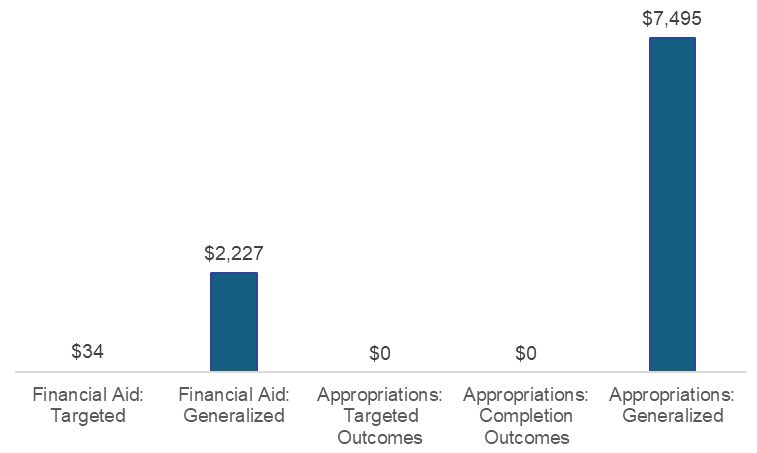
Virginia’s investment profile combines comparatively moderate appropriations with high financial aid levels, alongside a small targeted aid share. Virginia ranks 27th nationally in appropriations per net FTE ($7,495 compared to $8,139 nationally) and 28th in effort per $1,000 of personal income ($3.27 compared to $3.50 nationally). The share of aid directed to need-based programs is below average (63 percent versus 69 percent nationally), but the state ranks highly in total financial aid per net FTE enrollment ($2,261 compared to $1,427 nationally). Unlike several other states in this report, Virginia does not use performance-based funding.
Virginia has six targeted aid programs and ranks ninth in total dollars dedicated to targeted aid ($18.0 million). Yet targeted aid accounts for only 1.5 percent of total financial aid. In practical terms, about $34 of Virginia’s $2,261 of aid per net FTE is targeted to specific industry-aligned programs (Figure VA1).
Figure VA1. Higher Education Financial Aid and Appropriations per Net FTE Equivalent, Virginia
Most targeted dollars are concentrated in one program: G3—Get Skilled, Get a Job, Get Ahead—which expended $16.7 million and served 8,573 recipients (about $1,951 per recipient). G3 focuses on high-demand, high-wage jobs in healthcare, information technology, manufacturing and skilled trades, public safety, and early childhood education. This design connects directly to Virginia’s high levels of openings in IT and healthcare. Other targeted programs are much smaller but provide larger average awards, including the Virginia Teacher Scholarship Loan Program ($627,779; $9,658 per recipient) and the Space Grant Consortium ($357,800; $4,311 per recipient). Virginia also supports nursing and engineering through smaller conditional grant programs (Table VA3).
Table VA3. Targeted Aid Programs in Virginia
| Program | Aid Type | Targeted Fields | Expenditures | Recipients |
| G3: Get Skilled, Get a Job, Get Ahead Program | Grant or Scholarship | Healthcare, information technology, manufacturing and skilled trades, public safety, and early childhood education | $16,725,606 | 8,573 |
| Virginia Teacher Scholarship Loan Program | Conditional grant or loan | Teaching | $627,779 | 65 |
| Space Grant Consortium | Grant or Scholarship | STEM | $357,800 | 83 |
| Mary Marshall Nursing Scholarship | Conditional grant or loan | Nursing | $158,000 | 79 |
| Shipyard Workers Scholarship Loan Program | Conditional grant or loan | Transportation | $145,997 | 73 |
| VDOT – Civil Engineering Scholarship Program | Conditional grant or loan | Engineering | $7,000 | 1 |
Virginia’s targeted aid choices suggest a deliberate prioritization of information technology and high social value occupations such as healthcare, education, public safety, and early childhood education, even though management and business occupations are also in high demand. This approach is reinforced by the state’s governance infrastructure for defining high-demand occupations. Virginia uses four core criteria—wage at the 50th percentile or higher, no more than a bachelor’s degree requirement, at least 100 openings statewide, and at least one percent projected growth over five years—along with an additional pathway for registered apprenticeships. The state maintains a public website with an updated list of high-demand occupations, which provides a transparent basis for revising eligibility and evaluating whether targeted programs reflect current workforce needs.[16]
What we learn from Virginia
Taken together, Virginia combines strong labor market conditions, high attainment, and high overall financial aid investment with a comparatively low targeted aid share. Given its relatively low unemployment rate, high job openings, and above-average high-opportunity openings, Virginia may have already identified an appropriate scale of targeted aid. Its commitment to a broadly targeted, high-volume program (G3: Get Skilled, Get a Job, Get Ahead Program) and its clear definition and monitoring of high-demand occupations provide a model for states that want to align aid with workforce needs while retaining flexibility to update priorities over time.
New York
Labor market context
New York’s profile combines a strong overall labor market with a notably weak demand signal for high-opportunity bachelor’s-level jobs, alongside substantial challenges in the performance and enrollment trends of the state’s public postsecondary sector—particularly at two-year institutions. As of June 2025, New York’s unemployment rate was 4.0 percent,[17] just below the national average of 4.1 percent.[18] Using May 2025 jobs data, New York ranked fifth in job openings per 1,000 working-age residents (55.86 openings, compared to 44.65 nationally).[19] These indicators suggest a labor market with relatively low unemployment and higher-than-average job openings overall. However, New York ranks last in high-opportunity job openings requiring a bachelor’s degree, at 2.02 per 1,000 residents, far below the national average of 12.9. This pattern suggests weaker demand for bachelor’s-degree holders in New York’s high-opportunity labor market relative to other states.
New York ranks last in high-opportunity job openings requiring a bachelor’s degree, at 2.02 per 1,000 residents, far below the national average of 12.9.
New York’s most common high-opportunity openings are concentrated in nursing, accounting and auditing, and education. Registered nurses and accountants and auditors account for the top two occupations by openings. Teaching occupations also feature prominently, reflecting relatively high teacher wages compared to other states (Table NY1).
Table NY1. Top Occupations by Job Openings in New York
| Occupation | Avg Annual Openings (2023) | Median Salary (2023) | Rate of growth (%, 2022 to 2032) |
| Registered Nurses | 17,134 | $108,470 | 25.5% |
| Accountants and Auditors | 12,694 | $103,671 | 8.3% |
| Elementary School Teachers | 9,093 | $84,721 | 18.2% |
| Secondary School Teachers | 7,028 | $101,041 | 18.2% |
| Human Resources Specialists | 5,833 | $82,643 | 12.8% |
| Middle School Teachers | 3,434 | $84,868 | 18.2% |
| Public Relations Specialists | 3,323 | $80,644 | 14.2% |
| Training and Development Specialists | 2,958 | $74,911 | 14.8% |
| Medical and Health Services Managers | 2,936 | $152,599 | 23.5% |
| Computer Systems Analysts | 2,394 | $108,477 | 11.4% |
Note: All occupations on this list have a typical education requirement of at least associate’s degree and require less than five years of experience.
Postsecondary performance and credential production
New York’s postsecondary sector exhibits stratified outcomes by sector. Two-year institutions perform below national averages on retention and graduation: full-time retention is 58 percent and graduation is 26 percent, compared to national averages of 60 percent and 31 percent. Four-year institutions perform at or slightly above national benchmarks: full-time retention is 80 percent and graduation is 64 percent, compared to national averages of 80 percent and 62 percent. These patterns indicate that student success outcomes vary significantly depending on where students enroll.
New York has also experienced substantial enrollment declines. From 2017 to 2022, full-time equivalent enrollment declined by 32 percent in the two-year sector—more than double the national average decline—and four-year enrollment declined by 11 percent, substantially worse than the national average decline of 4 percent. Enrollment improved beginning in 2023,[20] but sustaining that improvement will be essential for rebuilding the credential pipeline.
Despite these challenges, New York has one of the highest attainment rates in the nation: 52 percent of working-age adults hold an associate degree or higher, above the national average of 45 percent. However, the state struggles to convert enrollment into credentials at the scale implied by its enrollment base. Approximately 2,800 adults per 1,000 undergraduates in New York have some college but no credential, compared to just over 2,200 nationally. New York has improved attainment substantially over time, but it does not have an official statewide attainment goal.[21]
Approximately 2,800 adults per 1,000 undergraduates in New York have some college but no credential, compared to just over 2,200 nationally.
New York produces large numbers of credentials across fields. In 2022, New York’s public institutions produced over 108,000 bachelor’s degrees and over 36,000 associate degrees.[22] Business, management, and marketing accounted for 23,714 bachelor’s degrees and 8,899 associate degrees; health professions accounted for 12,594 bachelor’s degrees and 11,037 associate degrees; and education accounted for 4,553 bachelor’s degrees and 512 associate degrees (Table NY2).
Table NY2. Top Programs by Degree Production in New York
| Degree Program | Bachelor’s Degrees Awarded (2022) | Associate’s Degrees Awarded (2022) | Total Annual Degree Production (2022) |
| Business, Management, Marketing, and Related Support Services | 23,714 | 8,899 | 32,613 |
| Health Professions and Related Programs | 12,594 | 11,037 | 23,631 |
| Visual and Performing Arts | 10,289 | 2,958 | 13,247 |
| Computer and Information Sciences and Support Services | 6,651 | 1,736 | 8,387 |
| Communication, Journalism, and Related Programs | 7,198 | 905 | 8,103 |
| Homeland Security, Law Enforcement, Firefighting, and Related Protective Services | 3,881 | 3,630 | 7,511 |
| Biological and Biomedical Sciences | 7,185 | 220 | 7,405 |
| Engineering | 6,759 | 128 | 6,887 |
| Social Sciences | 6,573 | 165 | 6,738 |
| Education | 4,553 | 512 | 5,065 |
Comparisons between New York’s most common high-opportunity openings and its credential production reveal a meaningful mismatch. The state produces very large numbers of business credentials while underproducing in nursing and education relative to openings. New York awards 13,772 nursing degrees annually, which comprises about 58 percent of the 23,631 health professions and related programs degrees produced (Table NY2) and represents about 80 percent of average annual registered nursing openings (Table NY1). By contrast, New York’s institutions award 5,065 education degrees annually, representing about 26 percent of average annual openings for grade-school teaching occupations, all of which are among the most in-demand high-opportunity occupations in the state. Both nursing and education are projected to grow rapidly through 2032, strengthening the case for increasing production in these fields.
Alignment between state investment and workforce needs
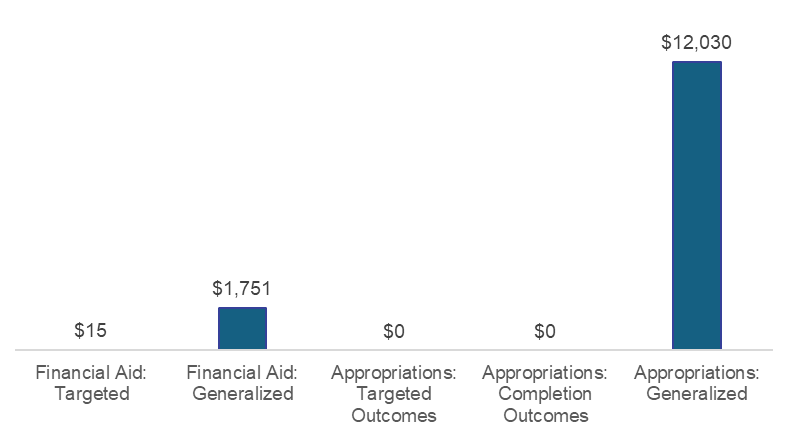
New York’s investment patterns reflect high overall spending and a strong emphasis on need-based aid, but targeted aid remains extremely small in the context of the full portfolio. New York ranks eighth nationally in appropriations per net FTE ($12,030 compared to $8,139 nationally) but ranks 31st in effort per $1,000 of personal income ($3.23 compared to $3.50 nationally). The state directs an extraordinarily high share of aid to need-based programs (96 percent versus 69 percent nationally) and ranks above average in total financial aid per net FTE enrollment ($1,766 compared to $1,427 nationally). New York does not use performance-based funding.
In FY23, New York had three targeted programs, near the median among states using targeted aid. Two additional programs were introduced in subsequent fiscal years. In FY23, New York ranked 17th in dollars dedicated to targeted aid ($9.0 million), but targeted aid accounted for just under 1 percent of total financial aid. In practical terms, about $15 of New York’s $1,766 of aid per net FTE was targeted to industry-aligned programs (Figure NY1).
Figure NY1. Higher Education Financial Aid and Appropriations per Net FTE Equivalent, New York
Most targeted dollars support the NYS STEM Incentive Program ($8.3 million; $6,282 per recipient). New York has recently introduced healthcare-focused targeted aid, including Healthcare Workers for Our Future ($3.214 million; $15,911 per recipient), awarded through a lottery system, and a nursing-specific program (Nurses for Our Future) that remains small in scale ($98,000; 28 recipients). The state also supports future STEM educators through a math and science teacher incentive scholarship. These newer programs represent a positive development for addressing shortages in healthcare and nursing, but the amounts are not yet large enough to materially shift credential production at the scale implied by New York’s workforce needs. Similar logic applies to education: given the scale of teaching openings, targeted investments in education pathways remain comparatively limited (Table NY3).
More recently, New York has begun to scale targeted aid through a statewide community college initiative (SUNY and CUNY Reconnect).[23] Adopted through the FY 2026 budget, the program covers remaining tuition and fee costs—along with books and required supplies—for New Yorkers ages 25–55 who do not already hold a degree and who enroll in approved, high-demand associate programs at SUNY and CUNY community colleges. The eligible fields include nursing and allied health, technology and engineering, and pathways into teaching in shortage areas, among others. In contrast to smaller, field-specific pilots, Reconnect represents a broader, associate-level approach that could matter for New York’s workforce pipeline precisely because it operates through community colleges and targets adults returning to education.
New York lacks a single, clearly articulated definition of high-demand or high-opportunity occupations comparable to states that maintain criteria-based, regularly updated lists. The Department of Labor provides information on in-demand jobs and expected hiring by region,[24] but limitations in data transparency and filtering make it difficult to generate a clear statewide rank-ordered list comparable to the approach used in this analysis.
What we learn from New York
Taken together, New York’s labor market is strong overall, but the state’s low rate of high-opportunity bachelor’s-level openings is a concern, and the mismatch between credential production and high-demand openings in nursing and education is pronounced. New York already dedicates substantial resources to financial aid, particularly need-based aid. Given the scale of its system and its labor market needs, New York will likely need to be selective and strategic in expanding targeted aid, pairing targeted pilots—such as the Nurses for Our Future and Healthcare Workers for Our Future programs—with broader strategies to improve retention and completion (especially in the two-year sector) and to coordinate postsecondary and economic development policy so that residents can access high-quality opportunity and the state can maintain competitiveness.
Kentucky
Labor market context
Kentucky’s labor market presents a mixed picture: job openings are relatively strong, but unemployment is above average and demand for high-opportunity bachelor’s-level jobs is comparatively weak. As of June 2025, Kentucky’s unemployment rate was 4.9 percent,[25] above the national average of 4.1 percent.[26] Using May 2025 jobs data, Kentucky ranked 17th in job openings per 1,000 working-age residents (50.67 openings, compared to 44.65 nationally),[27] suggesting better-than-average opportunities overall. However, Kentucky ranks near the bottom in high-opportunity openings requiring a bachelor’s degree, at 10.27 per 1,000 residents, below the national average of 12.9. This pattern indicates that while the state offers a relatively dense set of openings
overall, high-opportunity demand for bachelor’s-degree holders is weaker than in many other states.
Kentucky’s most common high-opportunity openings are concentrated in nursing and accounting and auditing, with additional roles in healthcare management and business-related occupations (Table KY1).
Table KY1. Top Occupations by Job Openings in Kentucky
| Occupation | Avg Annual Openings (2023) | Median Salary (2023) | Rate of growth (%, 2022 to 2032) |
| Registered Nurses | 2,940 | $77,830 | 6.6% |
| Accountants and Auditors | 1,080 | $67,210 | 4.9% |
| Medical and Health Services Managers | 1,040 | $97,550 | 28.8% |
| Human Resources Specialists | 890 | $61.650 | 5.5% |
| Market Research Analysts and Marketing Specialists | 730 | $59,630 | 14.1% |
| Business Operations Specialists, All Other | 720 | $70,430 | 1.3% |
| Sales Managers | 650 | $109,300 | 5% |
| Project Management Specialists | 580 | $81,180 | 6% |
| Managers, All Other | 570 | $113,100 | 4.3% |
| Software Developers | 560 | $103,030 | 24.2% |
Note: All occupations on this list have a typical education requirement of at least associate’s degree and require less than five years of experience.
Postsecondary performance and credential production
Kentucky’s higher education outcomes differ meaningfully by sector, with stronger outcomes in the two-year sector than in the four-year sector. In the two-year sector, full-time retention is 63 percent and graduation is 42 percent, above national averages of 60 percent and 31 percent. In the four-year sector, full-time retention is 79 percent and graduation is 59 percent, somewhat below national averages of 80 percent and 62 percent. Kentucky’s enrollment trends also vary by sector. From 2017 to 2022, two-year enrollment declined by 7 percent—about half the national decline—while four-year enrollment declined by 9 percent, substantially
worse than the national decline of 4 percent. Enrollment improved after 2022–23.[28]
Kentucky’s overall attainment remains below national averages. Among working-age adults, 38 percent hold an associate degree or higher, compared to 45 percent nationally. Kentucky also has a high share of adults with some college but no credential—approximately 2,700 adults per 1,000 undergraduates, compared to just over 2,200 nationally. The state’s official attainment goal (“60×30”) seeks to reach at least 60 percent of residents holding a postsecondary certificate or credential by 2030; the state reports being on track, with at least 57 percent currently holding at least a postsecondary certificate.[29]
Kentucky produces credentials across fields, with the largest volumes in health professions and business. In 2022, Kentucky’s public institutions produced over 20,000 bachelor’s degrees and over 5,000 associate degrees.[30] Business, management, and marketing accounted for 4,553 bachelor’s degrees and 624 associate degrees; health professions accounted for 3,505 bachelor’s degrees and 2,945 associate degrees; and education accounted for 1,881 bachelor’s degrees and 93 associate degrees (Table KY2).
Table KY2. Top Programs by Degree Production in Kentucky
| Degree Program | Bachelor’s Degrees Awarded (2022) | Associate’s Degrees Awarded (2022) | Total Annual Degree Production (2022) |
| Health Professions and Related Programs | 3,505 | 2,945 | 6,450 |
| Business, Management, Marketing, and Related Support Services | 4,553 | 624 | 5,177 |
| Education | 1,881 | 93 | 1,974 |
| Communication, Journalism, and Related Programs | 1,519 | 0 | 1,519 |
| Biological and Biomedical Sciences | 1,117 | 0 | 1,117 |
| Computer and Information Sciences and Support Services | 642 | 392 | 1,034 |
| Engineering | 1,016 | 0 | 1,016 |
| Public Administration and Social Service Professions | 868 | 128 | 996 |
| Visual and Performing Arts | 908 | 36 | 944 |
| Homeland Security, Law Enforcement, Firefighting, and Related Protective Services | 646 | 244 | 890 |
Relative to the state’s most common high-opportunity openings, Kentucky produces sufficient numbers of graduates in healthcare and business fields, but teacher supply challenges persist even though K–12 teaching occupations do not meet the high-opportunity wage threshold in Kentucky. Nursing is the high-opportunity occupation with the highest number of openings (2,940), yet Kentucky awards 4,357 nursing degrees annually. By contrast, teaching occupations appear among the occupations with the most openings that require at least an associate degree—elementary teachers (1,150), secondary teachers (740), and middle school teachers (530)—and the state may not be producing enough qualified teachers each year despite education being among the more commonly awarded degree areas.
Alignment between state investment and workforce needs
Kentucky’s investment strategy combines relatively low appropriations with very high financial aid levels and extensive use of performance-based funding. Kentucky ranks 37th nationally in appropriations per net FTE ($6,221 compared to $8,139 nationally) and 26th in effort per $1,000 of personal income ($3.29 compared to $3.50 nationally). About 56 percent of Kentucky’s financial aid is need-based, below the national average of 69 percent. Kentucky ranks fourth nationally in total financial aid per net FTE enrollment ($2,793 compared to $1,427 nationally).
Kentucky incorporated performance-based funding into its formula beginning in 2016. As of FY 2024, the state allocated $825.6 million—the vast majority of appropriations—through performance-based funding, representing 93 percent of appropriations for the four-year sector and 100 percent for the two-year sector. On average, performance-based funds amount to $5,911 per net FTE. The formula allocates five percent of performance-based funding to production of STEM and healthcare degrees (about $41.3 million, or $296 per net FTE). About 70 percent of the funding formula is tied to student outcomes (progression, completion, credit-hour milestones), with the remaining 30 percent allocated for facilities, instructional support and student services, and enrollment.
Kentucky maintains four targeted aid programs and ranks sixth in dollars dedicated to targeted aid ($23.8 million). Targeted aid accounts for about 6.5 percent of total financial aid, which equates to roughly $181 of Kentucky’s $2,793 of aid per net FTE being targeted to industry-aligned programs (Figure KY1).
Figure KY1. Higher Education Financial Aid and Appropriations per Net FTE Equivalent, Kentucky
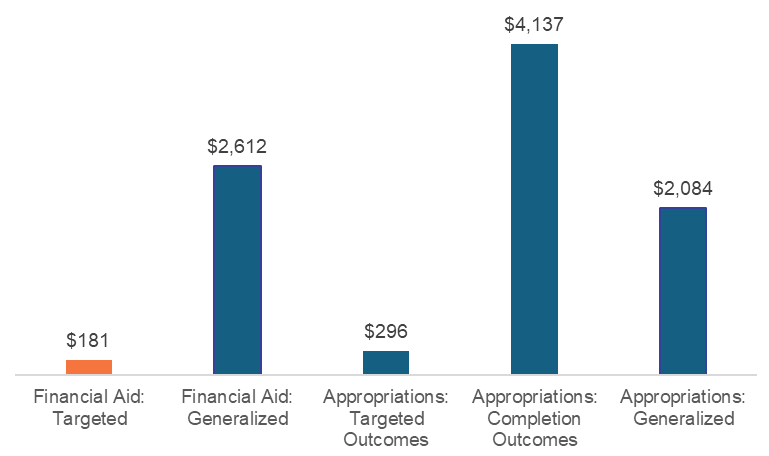
Most targeted aid spending flows through Work Ready KY. The Work Ready KY Scholarship ($13.4 million; $2,920 per recipient) targets the state’s top five high-demand sectors: construction, education, healthcare, manufacturing and logistics, and professional, scientific, and technical services. The Work Ready KY Dual Credit Scholarship ($8.2 million; $387 per recipient) supports dual-enrolled high school students pursuing CTE credentials and serves by far the largest number of recipients. The remaining targeted programs support early childhood development and education and a teacher scholarship/loan program (Table KY3).
Table KY3. Targeted Aid Programs in Kentucky
| Program | Aid Type | Targeted Fields | Expenditures | Recipients |
| Work Ready KY Scholarship | Grant or Scholarship | Construction, education, healthcare, manufacturing and logistics, and professional, scientific, and technical services. | $13,394,297 | 4,587 |
| Work Ready KY Dual Credit Scholarship | Grant or Scholarship | CTE | $8,165,068 | 21,085 |
| Early Childhood Development Scholarship | Grant or Scholarship | Early childhood | $1,624,530 | 445 |
| Kentucky Teacher Scholarship/Loan | Conditional grant or loan | Teaching | $617,808 | 157 |
Kentucky’s Workforce Innovation Board identifies top in-demand jobs using a weighted score based on demand (50 percent), entry or median wages (25 percent), and growth (25 percent). Because the state’s in-demand sectors are broad, there is substantial overlap between Kentucky’s official list and the high-opportunity occupations identified in this analysis. By tying eligibility for its largest targeted aid program to the state’s officially recognized in-demand priorities, Kentucky aligns a meaningful share of targeted spending with workforce needs while also dedicating targeted resources to high social value occupations in education and early childhood.
What we learn from Kentucky
Overall, Kentucky illustrates how a state can combine performance-based funding and targeted aid to support alignment. The state directly supports institutions less per net FTE than most states but allocates substantial resources to financial aid. Its performance-based funding model signals priority outcomes, while targeted aid—especially Work Ready KY and dual credit—connects student eligibility to workforce sectors the state has identified as in demand. The case also highlights a practical tradeoff: when targeted aid eligibility is broad, states may need additional mechanisms to ensure that resources are concentrated where shortages are most acute and where targeted investments can measurably increase credential production.
Ohio
Labor market context
Ohio’s labor market reflects mixed conditions: job openings are modestly above average, unemployment is above average, and demand for high-opportunity bachelor’s-level jobs is slightly stronger than national patterns. As of June 2025, Ohio’s unemployment rate was 4.9 percent,[31] above the national average of 4.1 percent.[32] Using May 2025 jobs data, Ohio ranked 24th in job openings per 1,000 working-age residents (48.67 openings, compared to 44.65 nationally),[33] indicating slightly better-than-average opportunities overall but some labor market weakness given elevated unemployment. Ohio has more high-opportunity openings requiring a bachelor’s degree, at 13.85 per 1,000 residents compared to the national average of 12.9 per 1,000 residents.
Ohio’s most common high-opportunity openings are concentrated in nursing and accounting and auditing, with additional demand in K-12 teaching roles, market research, business operations, and health services management (Table OH1).
Table OH1. Top Occupations by Job Openings in Ohio
| Occupation | Avg Annual Openings (2023) | Median Salary (2023) | Rate of growth (%, 2022 to 2032) |
| Registered Nurses | 7,630 | $79,940 | 3.4% |
| Accountants and Auditors | 4,230 | $75,550 | 3.3% |
| Secondary School Teachers | 3,620 | $78,010 | 2.8% |
| Market Research Analysts and Marketing Specialists | 3,340 | $65,340 | 10.9% |
| Elementary School Teachers, Except Special Education | 3,280 | $74,530 | 1.8% |
| Business Operations Specialists, All Other | 3,130 | $71,460 | 3.1% |
| Human Resources Specialists | 2,880 | $62,640 | 3.4% |
| Management Analysts | 2,740 | $84,080 | 7.9% |
| Project Management Specialists | 2,240 | $87,130 | 4.6% |
| Medical and Health Services Managers | 1,910 | $103,690 | 24.5% |
Note: All occupations on this list have a typical education requirement of at least associate’s degree and require less than five years of experience.
Postsecondary performance and credential production
Ohio’s higher education performance is sharply stratified by sector. Student outcomes are substantially stronger in the four-year sector than in the two-year sector. In the two-year sector, full-time retention is 53 percent and graduation is 26 percent—both below national averages of 60 percent and 31 percent. In the four-year sector, full-time retention is 82 percent and graduation is 66 percent, above national averages of 80 percent and 62 percent.
Enrollment declines have affected both sectors, although the two-year sector has fared better historically. From 2017 to 2022, full-time equivalent enrollment declined by 8 percent in the two-year sector, compared to 15 percent nationally. Four-year enrollment declined by 12 percent over the same period, around triple the national average decline of 4 percent. Unlike most other states, Ohio’s enrollment has continued to lag across both sectors since the 2022–23 academic year.[34]
Ohio’s attainment is slightly below national averages. Among working-age adults, 43 percent hold an associate degree or higher, compared to 45 percent nationally. At the same time, Ohio converts enrollment into credentials relatively effectively: about 1,500 adults per 1,000 undergraduates have some college but no credential, compared to just over 2,200 nationally. Ohio’s official attainment goal aimed for 65 percent of Ohioans to hold a postsecondary certificate or credential by 2025.[35] The state has made substantial gains but remains well short of that target: as of 2023, 53 percent of Ohioans held at least a postsecondary certificate or credential.[36]
Ohio produces credentials across fields, with large volumes in business and health. In 2022, Ohio’s public institutions produced over 59,000 bachelor’s degrees and over 17,000 associate degrees.[37] Business, management, and marketing accounted for 14,372 bachelor’s degrees and 3,876 associate degrees; health professions accounted for 10,131 bachelor’s degrees and 7,047 associate degrees; engineering accounted for 5,894 bachelor’s degrees; and education accounted for 4,273 bachelor’s degrees and 730 associate degrees (Table OH2).
Table OH2. Top Programs by Degree Production in Ohio
| Degree Program | Bachelor’s Degrees Awarded (2022) | Associate’s Degrees Awarded (2022) | Total Annual Degree Production (2022) |
| Business, Management, Marketing, and Related Support Services | 14,372 | 3,876 | 18,248 |
| Health Professions and Related Programs | 10,131 | 7,047 | 17,178 |
| Engineering | 5,894 | 37 | 5,931 |
| Education | 4,273 | 730 | 5,003 |
| Biological and Biomedical Sciences | 3,776 | 105 | 3,881 |
| Communication, Journalism, and Related Programs | 3,628 | 113 | 3,741 |
| Visual and Performing Arts | 3,274 | 383 | 3,657 |
| Homeland Security, Law Enforcement, Firefighting, and Related Protective Services | 1,163 | 1,077 | 2,240 |
| Engineering Technologies and Engineering-Related Fields | 1,500 | 706 | 2,206 |
| Parks, Recreation, Leisure, and Fitness Studies | 1,908 | 127 | 2,035 |
Similar to Kentucky, Ohio produces sufficient numbers of graduates in healthcare and business fields, but does not produce enough graduates to fill K-12 teaching vacancies. Unlike Kentucky, however, elementary and secondary school teachers both appear on the list of Ohio’s high-opportunity occupations. The 5,003 education degrees awarded represent about 73 percent of openings in those two K-12 occupations alone (Table OH1). Overall, Ohio’s four-year institutions show relatively strong outcomes, but the two-year sector lags and continued enrollment declines present a persistent challenge. While Ohio has improved attainment meaningfully over time, it remains below national levels and far from the state’s 2025 target.
Alignment between state investment and workforce needs
Ohio’s investment profile is defined by comparatively low appropriations and low financial aid per net FTE. Ohio ranks 39th nationally in appropriations per net FTE ($5,963 compared to $8,139 nationally) and 40th in effort per $1,000 of personal income ($2.67 compared to $3.50 nationally). About 67 percent of Ohio’s financial aid is need-based, near the national average of 69 percent. However, Ohio’s total financial aid per net FTE is $714, ranking 33rd nationally (compared to $1,427 nationally).
Ohio’s appropriations are distributed primarily through performance-based funding. The state introduced its model, the State Share of Instruction, in FY 2013 and fully implemented it in FY 2015. [38] As of FY 2024, Ohio allocated $1.964 billion—95 percent of appropriations for the four-year sector and 100 percent for the two-year sector—through performance-based finding, amounting to $5,746 per net FTE. Although the model applies cost weights by discipline, it does not explicitly incentivize particular fields; instead, weights adjust for program delivery costs.[39] The two-year formula allocates funds based on course completions, success milestones (including early completion of college-level math and English and credit-hour thresholds), and completions and transfers.[40] The four-year formula places the largest weight on degree completions, with additional weight on course completions and set-asides for medical and doctoral programs.[41]
Ohio maintains three targeted aid programs and ranks eighth in total dollars dedicated to targeted aid ($21.5 million). Targeted aid represents approximately 12.7 percent of total financial aid, which translates to about $90 of Ohio’s $714 of aid per net FTE being targeted to specific industry-aligned programs (Figure OH1).
Figure OH1. Higher Education Financial Aid and Appropriations per Net FTE Equivalent, Ohio
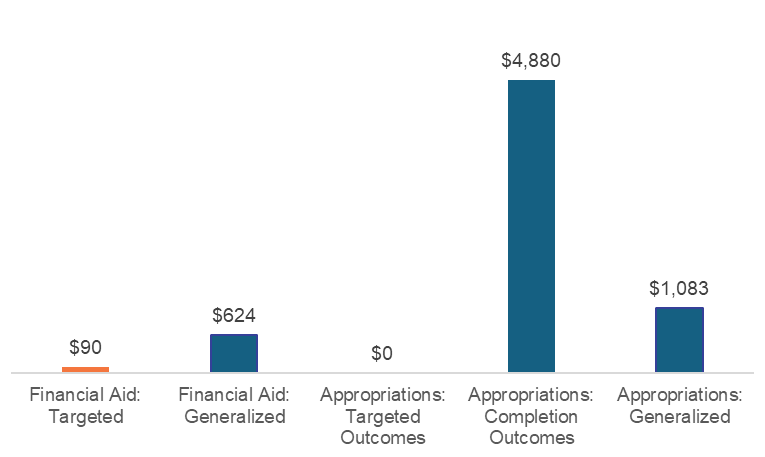
Most targeted aid spending supports the Choose Ohio First Scholarship Program ($17.0 million; $3,858 per recipient), which focuses on STEM and STEM education. This longstanding program has been adjusted over time, including periods when eligibility expanded to certain medical, nursing, and dental programs and later eliminated those pathways.[42] Ohio also supports a Commercial Truck Driver Student Aid Program ($3.8 million; $4,927 per recipient), introduced in 2021,[43] and a Nurse Education Assistance Loan Program ($647,023; $1,354 per recipient). Ohio has demonstrated some flexibility in its targeted aid program design while also maintaining a commitment to targeting STEM and nursing degrees. (Table OH3).
Table OH3. Targeted Aid Programs in Ohio
| Program | Aid Type | Targeted Fields | Expenditures | Recipients |
| Choose Ohio First Scholarship Program | Grant or Scholarship | STEM, STEM education | $17,007,838 | 4,409 |
| Commercial Truck Driver Student Aid Program | Conditional Grant or Loan | Transportation | $3,813,157 | 774 |
| Nurse Education Assistance Loan Program | Conditional Grant or Loan | Nursing | $647,023 | 478 |
Ohio’s workforce information infrastructure provides additional context for these targeting choices. The state maintains a “Top Jobs” list that allows users to filter by region, education requirements, experience, job category, and whether an occupation is considered critical or in demand.[44] The state defines an in-demand job as one that offers “a sustainable wage and a promising future based on the projected number of openings,” and it identifies a set of critical jobs tied to health and well-being across career clusters such as early childhood education, first responders, mental and behavioral health, nurses, physicians, and wellness research and technology.[45] Some of these priorities overlap with the state’s targeted aid programs, particularly through STEM-related support and nursing loans. Ohio’s explicit support for truck drivers reflects the state’s own labor market evidence: heavy and tractor-trailer truck driving ranks among the highest-opening occupations under the state’s definitions, even though it does not meet the stricter education and wage thresholds used for identifying high-opportunity occupations in this analysis.
What we learn from Ohio
Taken together, Ohio’s labor market and postsecondary context suggest multiple needs: stronger two-year outcomes, sustained enrollment recovery, and improved progress toward ambitious attainment goals. On a per-FTE basis, Ohio invests less than most states in both institutional support and financial aid. Targeted aid is used to advance strategic priorities in STEM, transportation, and nursing, and the state has demonstrated willingness to adjust program eligibility over time in response to perceived workforce needs. However, Ohio would likely benefit from increased overall investment in institutions and student aid, alongside continued refinement of how performance-based funding and targeted aid interact to support evolving labor market demands.
Cross-state themes
Across the five states, three patterns recur that complicate simple narratives about “targeting more” or “targeting less.” First, the largest gaps between workforce need and credential production are not always concentrated in the same set of fields that dominate targeted aid portfolios. Even when states have robust lists of in-demand occupations, targeted aid programs often reflect a combination of long-standing policy priorities (such as broad STEM initiatives), administrative feasibility, and political considerations. This can produce a persistent mismatch between the occupations where shortages are most acute and the fields where aid incentives are strongest.
Second, in several states the binding constraint is not whether students choose a particular major, but whether enough students enroll and complete in the first place—and whether institutions have capacity in high-demand programs. Washington illustrates this dynamic most clearly: institutions perform strongly on retention and completion, yet steep enrollment declines and large gaps in nursing and education suggest that the credential pipeline is constrained even before questions of targeting arise. New York highlights a different version of the same problem. The state has high attainment overall, but below-average outcomes in the two-year sector and a large “some college, no credential” population. In such contexts, targeted aid may be most effective when paired with investments that improve persistence and completion and that address capacity constraints in programs where shortages are substantial.
Third, broad targeting can dilute the policy signal and make evaluation difficult. Kentucky’s largest programs, for example, tie eligibility to broad sector priorities and workforce definitions that overlap substantially with many high-opportunity occupations. This breadth can be an asset, especially when states want flexibility across regions or when they are pursuing both economic and social goals. But the broader a program’s eligibility list becomes, the harder it is to identify whether targeted dollars are actually increasing credential production in the specific occupations where gaps are largest.
How states should decide what to invest in
The case studies underscore that states rarely face a single, clean choice between “targeted aid” and “everything else.” Instead, states make a series of interrelated decisions about what they want their investments to accomplish, which constraints are most binding, and which spending vehicles can plausibly move outcomes. In practice, “alignment” can mean several things at once: maximizing residents’ earnings and economic mobility; meeting labor market needs where openings outpace available workers; prioritizing occupations with recognized high social value (even when wages are modest); and increasing overall attainment. A state’s preferred balance among these goals should be made explicit, because it shapes which fields are prioritized, what kinds of credentials are supported, and how success is measured. Below, we outline a set of considerations as states evaluate their targeted investments, both appropriations and financial aid. Then, we introduce a framework for considering the advantages and disadvantages of specific investments, depending on the states’ primary policy objective.
Clarify the objective
Targeted financial aid and performance-based funding targeted at credentials of value are typically deployed to advance a mix of enrollment, attainment, economic, workforce, and public service goals. For policymakers, the starting point therefore is to clarify the objective: what problem is the state trying to solve, and what kind of impact or return matters most? We summarize the complementary policy objectives below, the actions to address them, and the tradeoffs associated with each in Appendix A.
What problem is the state trying to solve, and what kind of impact or return matters most?
One objective is maximizing returns to individuals and, in some cases, to the state. Under this lens, targeted aid is most compelling when it is aimed at high-paying occupations with clear labor supply shortages because this is likely to return the highest fiscal payoff per dollar of aid. The risks are also clear: states can overcorrect in certain degree programs, potentially saturating the market, and may divert resources away from lower-wage but socially essential programs. Because wages, enrollments, and shortages change over time, an ROI-oriented strategy requires flexibility and responsiveness in responding to those changes and often works best when targeted support is paired with careful guardrails and ongoing review.
A second objective emphasizes credentials with high social value—fields like education, healthcare, childcare, social work, and public safety. These programs may not top earnings-based rankings, but they sustain essential services and can reduce long-term public costs when shortages are alleviated. The trade-off is that states are unlikely to recoup financial aid costs through tax benefits from graduates’ increased wages, and many high social value fields have high turnover rates due to low or static wages. As a result, states often structure these programs with service-linked designs—such as conditional grants or loan forgiveness—to encourage graduates to enter and remain in shortage roles.
Some states may focus targeted aid on filling occupation-specific labor force needs (regardless of relative earnings or social value) or on building a future competitive advantage. Targeting shortage occupations can yield high impact per dollar when it complements industries where employers have already invested and where graduates have a high likelihood of employment; the challenge is that shortages are widespread and prioritization can be subject to political whims. A more future-oriented strategy targets emerging or fast-growing industries to attract firms and shape the economy, but it carries “brain drain” risk if job creation lags behind credential production—making coordination with employers and workforce development agencies essential. To mitigate against such a risk, states may consider implementing targeted financial aid through a matching fund with private industry.
Across all strategies, states should consider the extent to which targeted aid should sit alongside a foundational commitment to broad, generalized aid, since increasing overall attainment remains a core state interest and generalized aid is typically the most administratively simple and reliable tool for expanding access and completion. At the same time, generalized aid is unlikely to resolve occupation-specific shortages on its own, and most states’ aid portfolios include programs targeted to student populations or policy priorities that are not explicitly workforce-oriented (for example, merit awards, place-based scholarships, or aid for students with particular characteristics).[46] States should therefore assess the portfolio as a whole—clarifying what each program is meant to accomplish and ensuring that workforce-aligned targeting complements, rather than unintentionally displaces, aid strategies designed to promote overall access and completion.
Diagnose the problem
In some contexts the constraint to addressing workforce gaps may be student access and affordability; in others it may be enrollment and completion; and in others it may be capacity in specific programs (e.g., clinical placement limits in nursing). Targeted aid can be an effective lever when student choice and affordability are central constraints and when the pathway from credential to occupation is clear. When the binding constraints are capacity, persistence, or completion, targeted aid is unlikely to be sufficient on its own and should be paired with investments that expand seats in high-demand programs, strengthen advising and basic needs supports, or improve transfer and re‑enrollment pathways—particularly for adult learners.
Another question is the extent to which students already have access to other aid and how much additional aid they need to change behavior. In practice, this means assessing students’ net price after Pell and existing state/institutional aid, and identifying whether a targeted award would meaningfully reduce remaining tuition and fees, or whether their decisions about enrollment and completion are shaped by non-tuition expenses like housing, childcare, transportation, and lost wages. States should also consider which students the policy is meant to influence (new entrants, adult learners returning, students near completion, or students choosing among majors) and whether the award is structured and timed to reach them. These considerations often point to different designs—for example, last-dollar support to fill remaining gaps, front-loaded aid to influence program choice early, or layered supports that combine tuition assistance with wraparound aid where basic needs are the primary constraint.
Select the levers
States should also consider the full menu of workforce-aligned investments beyond degree programs. Many of the occupations states are trying to fill can be reached through non-degree credentials, short-term certificates, industry certifications, and “earn while you learn” models such as paid work-based learning and registered apprenticeships. In some fields, these options can expand opportunity more quickly than degree-based pathways; in others, they can serve as on-ramps that stack into longer-term credentials. Decisions about targeted aid for degrees are therefore best made alongside decisions about how the state supports workforce-aligned non-degree pathways, and how those pathways connect back to attainment goals and to further education.
The investment strategy matters as much as design. The least expensive approach is often to reallocate existing dollars toward targeted programs—either within financial aid or by reconsidering other higher education spending vehicles—although reallocation requires careful attention to how the funds are distributed across different groups of students and institutions. States can also implement targeted aid as a last-dollar program so that other state and federal aid is applied first, reducing state costs while still lowering net price for eligible students. The most expensive and, perhaps, politically challenging option is to add new funding. In practice, states may combine these approaches, especially when attempting to scale targeted aid in fields where program costs are high.
States should consider the potential return on investment (ROI) across different options, and, in particular, the trade-offs between investing in student aid and investing in performance-based funding incentives. The ROI on generalized financial aid is often difficult to isolate, because aid interacts with tuition levels, existing federal and state support, and student enrollment and completion patterns. In general, financial aid is most likely to “pay off” when it changes students’ behavior—bringing new students into postsecondary education, improving persistence and completion, or shifting program choice toward high-opportunity pathways.[47] Appropriations, by contrast, tend to influence ROI through institutional capacity and quality: stabilizing tuition pressures, expanding seats in high-cost programs (e.g., nursing), improving advising and student supports, and strengthening completion.[48]
Targeted aid and performance-based funding for credentials of value may offer additional economic benefits beyond general aid. However, the research literature offers mixed evidence on whether performance-based funding achieves its intended effects: studies consistently find limited or no sustained impacts on increasing degree completion, with any positive effects tending to be small and short-lived, and with potential unintended consequences, such as increased selectivity or shifts toward lower-cost, short-term credentials. One synthesis of the grant aid literature suggests that an additional $1,000 in annual grant aid per student increases degree completion by roughly 2.0–2.5 percentage points, while another finds that each additional $1,000 in grant aid is associated with about a 1.2 percentage point increase in year-to-year persistence and a smaller (0.8 percentage point) increase in completion (not statistically significant).[49] While these effects are relatively small, targeted aid may be a better lever than PBF for influencing students’ enrollment and completion in specific high-need fields, although more research is needed to understand these tradeoffs and effects.
In practice, the appropriate ROI lens depends on the state’s goals and constraints, and a program that yields modest direct fiscal returns may still be justified if it materially increases completion in high-need fields, relieves capacity constraints, reduces reliance on expensive stopgap strategies, or improves mobility for underserved learners. To make ROI usable for policy, states should define outcome metrics up front, specify the counterfactual (what would have happened without the investment), and track both intended effects (enrollment, completion, credential production, employment, earnings) and implementation realities (uptake, capacity bottlenecks, and who benefits).
Design the intervention
Targeting itself involves a set of trade-offs. More precise targeting (for example, a narrow set of majors tied to clear shortage occupations) can strengthen the policy signal and make outcomes easier to track, but it can also increase administrative complexity, reduce flexibility across regions, and create the risk of misalignment if labor market conditions change. Broader targeting (for example, “high-demand” umbrellas spanning many fields) can be easier to administer and more resilient to change, but it can dilute resources and make it harder to determine whether aid is increasing production in the occupations where gaps are most acute. States should also consider unintended consequences: shifting dollars toward targeted programs can reduce the flexibility of general aid, potentially affecting overall attainment if students are steered away from programs where they are most likely to persist and complete.
States typically use grants to award targeted aid, but there are viable alternatives—conventional loans, conditional grants (that convert to loans if service requirements are not met), and loan forgiveness or assumption models. Each approach reflects a different balance between simplicity, upfront cost, and the extent to which the state is willing to concentrate risk in a small number of targeted industries. States also face design choices about whether targeted aid should be need-based, non-need-based, or layered with need-based aid; in our broader scan, most targeted programs have no need-based component, potentially reflecting policymakers’ interest in maximizing the pool of potential recipients and influencing program choice.
States should explicitly account for high social value credentials when deciding what to target. Many of the occupations that are most essential to communities—such as teaching, nursing and allied health roles, early childhood education, and other public service and caregiving occupations—may not always rise to the top of a purely earnings-based ROI ranking, even when the labor supply gap is large and the public need is acute. In these cases, states can treat “return” more broadly by incorporating measures such as persistent vacancy rates, service coverage (e.g., staffing ratios), downstream public costs of shortages (e.g., substitute teacher spending, delayed care, turnover), and equity goals tied to access to high-quality public services. They can also consider other investments and policy changes that lower the costs of a relevant degree or increase the wages of high social-value careers. Practically, this can imply a two-pronged approach to financial aid: one track that prioritizes high-opportunity, high-earnings pathways, and a second that prioritizes high social value pathways where shortages undermine community well-being. For high social value credentials, targeted aid is often most effective when paired with complementary investments—such as appropriations to expand program capacity, paid residencies or stipends, and service-linked designs (e.g., conditional grants or loan forgiveness) that reduce risk for students while strengthening the likelihood that graduates enter and remain in shortage roles.
Monitor and adapt
Because targeted aid is designed to respond to labor market demand, it works best when states treat it as an adaptive policy tool rather than a one-time program design choice. States need transparent criteria for identifying priority occupations and eligible programs, regular processes for updating those lists as labor market conditions change, and feedback loops that connect program participation to outcomes. Over time, states should expect to adjust eligibility rules, award amounts, and program conditions—especially when early evidence points to low uptake, limited effects on completion, or capacity bottlenecks (for example, clinical placement constraints) that prevent programs from expanding credential production.
Because targeted aid is designed to respond to labor market demand, it works best when states treat it as an adaptive policy tool rather than a one-time program design choice.
Effective governance also requires monitoring how programs operate in practice. To realize their full return on investment, states should verify that targeted awards are actually reaching students enrolled in eligible credentials and that institutional administrative processes are not inadvertently routing funds to ineligible programs. Similarly, policymakers should track gaps between financial aid appropriations and expenditures: the amount allocated to a program is often not the amount disbursed, and pervasive underspending may signal design barriers, confusing eligibility rules, limited awareness, or implementation challenges that reduce participation.
Finally, strong monitoring should extend beyond credential counts to employment outcomes. To assess whether targeted investments are strengthening workforce pipelines, states should track whether graduates enter the industries the state is prioritizing, whether they remain employed in-state, and how quickly or reliably they achieve family-sustaining wages. Evidence from PSEO underscores that earnings vary meaningfully by field of study and institutional geography, that some programs lead to concentrated employment in a single industry while others lead to more diffuse outcomes, and that wage growth unfolds over time.[50] Incorporating these measures helps states determine whether targeted aid and other incentives are simply increasing completions, or whether they are producing the workforce and economic security outcomes the state intends.
Taken together, the case studies suggest that the most durable targeted aid strategies are embedded in a broader alignment approach: they coordinate student-facing incentives with institutional capacity, aid from other sources that students can already access, student success supports, and workforce systems, and they rely on governance structures that enable ongoing monitoring, learning, and adjustment.
Conclusion
These five cases demonstrate that targeted financial aid can strengthen alignment between postsecondary investment and workforce opportunity, but only when deployed as part of a broader strategy. Washington state highlights how substantial targeted aid can coexist with large workforce gaps when enrollment declines and program capacity limit the supply of graduates. Virginia shows how a scaled, well-governed targeted program—anchored in clear criteria for defining demand—can be purposeful even when targeted aid represents a small share of total aid. New York underscores that small targeted pilots are unlikely to shift a large system unless the state clarifies priorities and coordinates targeting with improvements in completion, especially in the two-year sector. Kentucky illustrates how targeted aid and performance-based funding can work together to align investments with state-defined workforce needs, while also raising questions about how broad eligibility can be before it becomes difficult to measure impact. Ohio suggests that precision tools have limited reach when total investment is low and when targeted programs do not consistently address the highest-gap occupations.
For policymakers, the implication is not simply to create more targeted aid programs. It is to make targeting decisions as part of an integrated portfolio. States should use targeted aid where it can credibly change enrollment choices in programs that lead to shortage occupations; use appropriations, capacity investments, and student success supports where completion and throughput are the binding constraints; and refine performance incentives where they can reinforce state goals without destabilizing institutions. Above all, states should treat “demand” as a transparent and revisable basis for policy—one that is updated routinely and linked directly to the design of financial aid programs and other investments intended to advance attainment and workforce goals.
Appendix A
| Primary Policy Objective | Industries/Majors to Target | Key Advantages | Risks | Other Considerations |
| Maximize return-on-investment | Majors that 1) have a high wage premium and 2) strong potential for increasing the number of graduates | – Highest fiscal payoff per dollar of targeted aid | – Over-saturation of students in targeted majors
– May divert aid from lower-wage but socially essential programs |
– Will require periodic assessment of earnings by occupation and enrollment/completion trends
– Potential for greatest ROI if aid is need-based |
| Increase production of credentials of high social value | Education, healthcare, social work, public health, public safety | – Expands workforce in sectors that improve quality of life and reduce long-term public service costs | – Costly to the state
– Potential for high turnover in some fields, further increasing costs to the state |
– Pair aid with service commitment agreements to disincentivize turnover |
| Fill occupation-specific labor force needs | Majors leading to occupations with critical labor force shortages | – Directly addresses state job market needs | – Diversion of non-targeted aid, which could reduce overall attainment | – Must prioritize which shortages to address (size of labor shortage, criticality of occupations, etc.) |
| Obtain or maintain a competitive economic advantage | Emerging or fast-growing industries | – Strategically attracts high-value firms | – Risk of “brain drain” if local job creation lags behind graduate output | – Consider a matching fund from private industry |
| Increase overall attainment | Broad non-targeted aid | – Raises overall postsecondary enrollment and completion
– Simplest to administer |
– Unlikely to address labor shortages for some occupations | – Track enrollment and completion rates by demographic groups |
Endnotes
- Elizabeth Davidson Pisacreta, Jonathan Barefield, Ini-Abasi Umosen, Ifeatu Oliobi, “Aligning State Investments with Workforce Opportunity: A Framework for Targeted Higher Education Funding,” Ithaka S+R, March 12, 2026, https://sr.ithaka.org/publications/aligning-state-investments-with-workforce-opportunity. ↑
- “Table 1. Civilian Labor Force and Unemployment by State, Seasonally Adjusted,” US Bureau of Labor Statistics, September 19, 2025, https://www.bls.gov/news.release/laus.t01.htm. ↑
- “Unemployment Rate Little Changed at 4.1 Percent in June 2025,” TED: The Economics Daily, US Bureau of Labor Statistics, July 10, 2025, https://www.bls.gov/opub/ted/2025/unemployment-rate-little-changed-at-4-1-percent-in-june-2025.htm. ↑
- “Job Openings and Labor Turnover Survey,” US Bureau of Labor Statistics, retrieved September 19, 2025, https://www.bls.gov/jlt/data.htm. ↑
- “Attainment Goal Dashboard,” Washington Student Achievement Council, last updated February 10, 2025, https://wsac.wa.gov/attainment-dashboard. ↑
- “College Scorecard: Institutional Data Files (2022–23 release),” US Department of Higher Education, last updated November 17, 2025, https://collegescorecard.ed.gov/data/. ↑
- From the SHEF dataset, appropriations per net FTE were calculated using the sum of two-year and four-year public operating appropriations, which excludes agency funding, state financial aid, and research, agriculture, medical, and hospital appropriations. For the national figures, we used a per-FTE rate aggregated across all states. ↑
- “Student Achievement Initiative,” Washington State Board for Community and Technical Colleges, retrieved November 17, 2025, https://www.sbctc.edu/about/agency/initiatives-projects/student-achievement-initiative. ↑
- “Learn about an Occupation,” Employment Security Department, Washington State, last updated November 7, 2025, https://esd.wa.gov/jobs-and-training/labor-market-information/learn-about-occupation. ↑
- “Table 1. Civilian Labor Force and Unemployment by State, Seasonally Adjusted,” Economic News Release, US Bureau of Labor Statistics, September 19, 2025, https://www.bls.gov/news.release/laus.t01.htm. ↑
- “Unemployment Rate Little Changed at 4.1 Percent in June 2025,” TED: The Economics Daily, US Bureau of Labor Statistics, July 10, 2025, https://www.bls.gov/opub/ted/2025/unemployment-rate-little-changed-at-4-1-percent-in-june-2025.htm. ↑
- “Job Openings and Labor Turnover Survey,” US Bureau of Labor Statistics, retrieved September 19, 2025, https://www.bls.gov/jlt/data.htm. ↑
- “Higher Education in Virginia: Update and Emerging Issues,” Senate Finance and Appropriations Committee, State of Virginia, November 21, 2025, https://sfac.virginia.gov/pdf/committee_meeting_presentations/2025/Annual%20Meeting%202025/No9_11212025_Higher%20Education.pdf. ↑
- “Pathways to Opportunity: The Virgina Plan for Higher Education,” State Council of Higher Education for Virginia, January 2021, https://www.schev.edu/home/showpublisheddocument/1044/637811987952970000 ↑
- “College Scorecard: Institutional Data Files (2022–23 release),” US Department of Education, last updated November 17, 2025, https://collegescorecard.ed.gov/data/. ↑
- “Virginia 2024 High Demand Occupations,” Virginia Office of Data Governance and Analytics, April 17, 2024, https://data.virginia.gov/dataset/virginia-2024-high-demand-occupations. ↑
- “Table 1. Civilian Labor Force and Unemployment by State, Seasonally Adjusted,” Economic News Release, US Bureau of Labor Statistics, September 19, 2025, https://www.bls.gov/news.release/laus.t01.htm. ↑
- “Unemployment Rate Little Changed at 4.1 Percent in June 2025,” TED: The Economics Daily, US Bureau of Labor Statistics, July 10, 2025, https://www.bls.gov/opub/ted/2025/unemployment-rate-little-changed-at-4-1-percent-in-june-2025.htm. ↑
- “Job Openings and Labor Turnover Survey,” US Bureau of Labor Statistics, retrieved September 19, 2025, https://www.bls.gov/jlt/data.htm. ↑
- Governor Kathy Hochul, “Governor Hochul Announces Boost in Student Enrollment at State University of New York for Second Consecutive Year,” New York State Governor, November 13, 2024, https://www.governor.ny.gov/news/governor-hochul-announces-boost-student-enrollment-state-university-new-york-second. ↑
- “Educational Attainment in New York,” Lumina Foundation, 2023, https://strongernation.luminafoundation.org/attainment/new-york. ↑
- “College Scorecard: Institutional Data Files (2022–23 release),” US Department of Education, last updated November 17, 2025, https://collegescorecard.ed.gov/data/. ↑
- “Apply for Free Community College at SUNY or CUNY,” New York State, retrieved January 18, 2026, from https://www.ny.gov/services/apply-free-community-college-suny-or-cuny. ↑
- “Occupations with the Most Expected Hiring in New York State,” New York Department of Labor, last updated January 2026, https://dol.ny.gov/occupations-most-expected-hiring-new-york-state. ↑
- “Table 1. Civilian Labor Force and Unemployment by State, Seasonally Adjusted,” US Bureau of Labor Statistics, September 19, 2025, https://www.bls.gov/news.release/laus.t01.htm. ↑
- “Unemployment Rate Little Changed at 4.1 Percent in June 2025,” TED: The Economics Daily, US Bureau of Labor Statistics, July 10, 2025, https://www.bls.gov/opub/ted/2025/unemployment-rate-little-changed-at-4-1-percent-in-june-2025.htm. ↑
- “Job Openings and Labor Turnover Survey,” US Bureau of Labor Statistics, retrieved September 19, 2025, https://www.bls.gov/jlt/data.htm. ↑
- “KY Colleges and Universities Increase Enrollment and Graduation Rates,” Kentucky Council on Postsecondary Education, June 16, 2025, https://cpe.ky.gov/news/stories/ky-colleges-increase-enrollment-graduation-rates.html. ↑
- “Kentucky’s 60×30 Goal,” Kentucky Council on Postsecondary Education, last updated June, 25, 2025, https://cpe.ky.gov/ourwork/60×30. ↑
- “College Scorecard: Institutional Data Files (2022–23 release),” US Department of Education, last updated November 17, 2025, https://collegescorecard.ed.gov/data/. ↑
- “Table 1. Civilian Labor Force and Unemployment by State, Seasonally Adjusted,” US Bureau of Labor Statistics, September 19, 2025, https://www.bls.gov/news.release/laus.t01.htm. ↑
- “Unemployment Rate Little Changed at 4.1 Percent in June 2025,” TED: The Economics Daily, US Bureau of Labor Statistics, July 10, 2025, https://www.bls.gov/opub/ted/2025/unemployment-rate-little-changed-at-4-1-percent-in-june-2025.htm. ↑
- “Job Openings and Labor Turnover Survey,” US Bureau of Labor Statistics, retrieved September 19, 2025, https://www.bls.gov/jlt/data.htm. ↑
- “Full-Time Equivalent Enrollment Trends by Ohio Public Institutions (2005-2025),” Ohio Department of Higher Education, December 12, 2025, https://highered.ohio.gov/data-reports/data-and-reports-sa/enrollment/headcount-enrollment/enrollment-trends-fy-2005-2025. ↑
- “Degree & Credential Attainment,” Ohio Department of Higher Education, retrieved December 18, 2025, from https://highered.ohio.gov/initiatives/success-completion/degree-and-credential-attainment. ↑
- “Ohio Attainment – 2024 Annual Report,” Ohio Department of Higher Education, retrieved December 18, 2025, https://highered.ohio.gov/data-reports/data-and-reports-sa/reports/2024-attainment-report. ↑
- “College Scorecard: Institutional Data Files (2022–23 release),” US Department of Education, last updated November 17, 2025, https://collegescorecard.ed.gov/data/. ↑
- “State Share of Instruction Handbook: Methodology for Allocating State Share of Instruction Funds for Fiscal Year 2025,” Ohio Department of Higher Education, May 2025, https://dam.assets.ohio.gov/image/upload/v1747144388/highered.ohio.gov/financial/FY2025_SSIHandbookUniversity_final_05122025.pdf. ↑
- Ibid. ↑
- “Base State Share of Instruction Handbook: Methodology for Allocating Base State Share of Instruction Funds for Fiscal Year 2026, for Use by Community and Technical Colleges,” Ohio Department of Higher Education, January 2026, https://dam.assets.ohio.gov/image/upload/highered.ohio.gov/financial/ssi/FY2025_SSIHandbookCollege_final_01132026.pdf. ↑
- “Base State Share of Instruction Handbook: Methodology for Allocating Base State Share of Instruction Funds for Fiscal Year 2026, for Use by University Regional & Main Campuses,” Ohio Department of Higher Education, January 2026, https://dam.assets.ohio.gov/image/upload/highered.ohio.gov/financial/ssi/FY2025_SSIHandbookUniversity_final_01132026.pdf. ↑
- “Section 3333.615 | Elimination of Certain Choose Ohio First Scholarship Components,” Ohio Legislative Service Commission, September 30, 2021, https://codes.ohio.gov/ohio-revised-code/section-3333.615. ↑
- “Section 3333.125 | Commercial Truck Driver Student Aid Program,” Ohio Legislative Service Commission, December 22, 2021, https://codes.ohio.gov/ohio-revised-code/section-3333.125. ↑
- “Ohio’s Top Jobs List,” Ohio Governor’s Office of Workforce Transformation, retrieved December 18, 2025, https://topjobs.ohio.gov/top-jobs-list/ohios-top-jobs-list. ↑
- “Top Jobs in Ohio,” Ohio Governor’s Office of Workforce Transformation, retrieved December 18, 2025, from https://topjobs.ohio.gov/top-jobs-list/overview;“Ohio’s Top Jobs List,” Ohio Governor’s Office of Workforce Transformation, June 2024, https://topjobs.ohio.gov/wps/wcm/connect/gov/1acfda35-e4ea-433e-9055-8d5758cc9326/TopJobs+flyer+2024.pdf?MOD=AJPERES&CONVERT_TO=url&CACHEID=ROOTWORKSPACE.Z18_79GCH8013HMOA06A2E16IV2082-1acfda35-e4ea-433e-9055-8d5758cc9326-p1bR82w. ↑
- For example, 16 states—Alabama, Arkansas, California, Colorado, Delaware, Idaho, Illinois, Michigan, Minnesota, Missouri, New Jersey, New Mexico, New York, Ohio, Tennessee, and Utah—report a grant or scholarship for surviving dependents of police officers and/or firefighters in the NASSGAP survey. ↑
- Tuan D. Nguyen, Jenna W. Kramer, and Brent J. Evans, “The Effects of Grant Aid on Student Persistence and Degree Attainment: A Systematic Review and Meta-Analysis of the Causal Evidence,” Review of Educational Research 89, no. 6 (2019), https://doi.org/10.3102/0034654319877156. ↑
- Kristen Cummings et al., “Investigating the Impacts of State Higher Education Appropriations and Financial Aid,” State Higher Education Executive Officers Association (SHEEO), May 2021, https://files.eric.ed.gov/fulltext/ED614983.pdf. ↑
- Tuan D. Nguyen, Jenna W. Kramer, and Brent J. Evans, “The Effects of Grant Aid on Student Persistence and Degree Attainment: A Systematic Review and Meta-Analysis of the Causal Evidence,” Review of Educational Research 89, no. 6 (2019), https://doi.org/10.3102/0034654319877156; Robin R. LaSota, Joshua R. Polanin, and Megan J. Austin, “Does Aid Matter? A Systematic Review and Meta-Analysis of the Effects of Grant Aid on College Student Outcomes,” Review of Educational Research 95, no. 3 (2024): 464-504, https://doi.org/10.3102/00346543241239955. ↑
- Elizabeth Davidson Pisacreta, Cameron Childress, and Kyle Gray, “What Postsecondary Employment Outcomes Data Can Teach States About Workforce Alignment and Public Value,” Ithaka S+R, February 18, 2026, https://sr.ithaka.org/blog/what-postsecondary-employment-outcomes-data-can-teach-states-about-workforce-alignment-and-public-value/. ↑