What Is a Research Core?
A Primer on a Critical Component of the Research Enterprise
Introduction
Notwithstanding the disruptions caused by the pandemic, the global academic research enterprise continues to grow. In the US, pandemic-related funding provided by the National Institutes of Health (NIH) has already provided a boost for academic medical research, while the funding provided for the National Science Foundation (NSF) and other agencies through general pandemic relief bills is expected to have a similar effect for research activities in other science, technology, and engineering fields that were stalled in 2020.[1] Ongoing trends to improve research support for academic science therefore are taking on renewed significance and the importance of research support services is gaining more traction.
Against this background, research cores—shared research enablement facilities that are used on a cross-department if not institutional basis—merit special attention. As clusters of state-of-the-art instruments and research enablement services, research cores are not only the cornerstone of research activities at university campuses but also critical assets that provide competitive differentiation for their host institutions. However, these research cores are highly expensive for academic institutions to manage.[2] Despite the growing recognition and impact of these research cores, there are few studies that describe the business models for sustaining and funding research cores or their increasing significance to the larger academic community. In this paper, we offer a landscape overview of research cores at large public and private institutions in the US, with the objective to reflect on the best practices and ongoing challenges for these universities to operate them efficiently.
What Are Research Cores?
Research cores are centralized, shared resources that provide access to advanced instruments, such as nuclear magnetic resonance (NMR) and cryogenic electron microscopy (cryo-EM), and specialized services to scientific and clinical investigators.[3] Most have been founded to address the urgent research needs of STEM programs, medical schools, and biomedical research centers. The office of research tends to provide financial oversight, but most operate as discrete campus units. In this paper, we adopt the term “research cores” to denote the phenomenon that has been frequently referred to as “core facilities,”[4] “shared core facilities,”[5] “shared research resources,”[6] and “advanced research instrumentation and facilities,”[7] among others.
In the higher education context, there are five features of research cores that differentiate them from traditional research labs and facilities.[8]
- Instrumentation: Research cores contain advanced equipment such as NMR and cryo-EM for shared use across an academic school or college, academic institution, or beyond, that are financially difficult if not impossible for individual investigators to obtain and maintain, as opposed to essential instruments for day-to-day research in traditional research labs.[9]
- Expertise: Compared to traditional research labs that rely on graduate students and technicians, research cores normally recruit managers and technical staff with PhD training to provide highly specialized services to a wide community of researchers.[10]
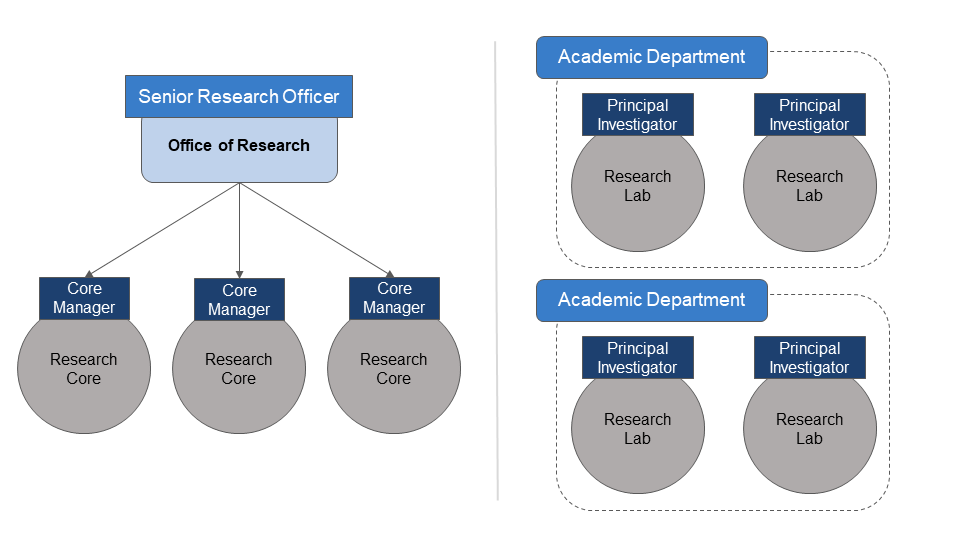
- Management: Most research cores are established through high-level decision makers at their institutions. They are often managed centrally by the office of research and receive oversight from the senior research officer, a structure necessitated by multiple factors including economic constraints, increasing research costs, and the need to maximize the value and accessibility of research facilities.[11] Every year, managers of research cores submit a detailed report that includes key financial metrics to the office of research. This distinguishes them from most research labs that are managed discretely by their principal investigators, sometimes under departmental supervision (see Figure 1).
- User: Sharing is the central feature of all research cores. In many places, they are also called “shared core facilities,” a name that highlights their accessibility to researchers across different academic departments, schools, and sometimes even institutions. This is opposed to traditional labs that are normally exclusively used by people affiliated with one research group or department.
- Fee: Most research cores operate under the fee-for-service model, which means users are charged service fees based on instrument service time and other services provided. A multi-tier rate structure is adopted, which charges external users (especially those from for-profit sectors) more than internal university users.[12] A substantial share of these fees is paid at the discretion of researchers, ultimately derived by their research grant funding.
Figure 1: Different management models between research cores and research labs.
This figure depicts that while there is only one office of research in a university there are many academic departments. The dashed lines surrounding the academic departments are meant to show the individual departments that may or may not directly manage individual research labs.
Not all research resources on campus fall under the definition of a research core. Examples of the type of resources excluded from our study include:
- A research lab with advanced microscopy purchased and managed by a PI and exclusively used by members of their research group.
- Chemical purification equipment managed by the chemistry department and only accessible to research groups associated with the department.
- A 3D printing cluster established by the school of architecture and currently maintained by their master’s students.
- An on-campus machine shop outsourced to a local service provider.
In these examples, the research facilities in question are not research cores because they are exclusively accessible to members of a given research community or because they fail to demonstrate an institution-level commitment to their acquisition and maintenance. The ad hoc sharing practice normally takes place within the confines of personal networks.[13] However, once these resources are available to outside users or scale up with the support of their host institutions, they have the potential to transform into research cores.
For colleges, universities, and research centers around the world, research cores have been playing an increasingly critical role over the last two decades in supporting their mission to conduct cutting-edge research, recruit and retain faculty members, and secure external funding support.
For colleges, universities, and research centers around the world, research cores have been playing an increasingly critical role over the last two decades in supporting their mission to conduct cutting-edge research, recruit and retain faculty members, and secure external funding support.[14] For example, there are currently around 700 research cores registered on eagle-i, a platform for sharing biomedical research resources in the United States.[15] The University of Pennsylvania, one of eagle-i’s participating institutions, alone operates 172 research cores.[16] There are also an increasing number of professionals working for research cores. The Association of Biomolecular Resource Facilities (ABRF), one of the growing organizations for professional workers at research cores, now has over 1,500 members representing over 340 research cores globally.[17] The “research core phenomenon” has attracted an increasing amount of attention from the federal government as well. In 2015, the NIH, in conjunction with the ABRF, hosted a workshop that brought together government leaders, institutional directors, and scientists to address the challenge of improving the efficiencies of research cores, resulting in several major recommendations for the NIH and universities to consider.[18] In short, research cores have become critical players in the ecosystem of the research enterprise.
Methodology
To better understand the similarities and differences among US universities in their approaches to research cores, our research was guided by two questions:
- Does a university’s funding source impact the types of research cores it sets up?
- Are there patterns in the ways universities with varied levels of commitment to research acquire research cores?
We looked at 20 research institutions, randomly selecting five each from the following four categories[19]:
- R1 private not-for-profit four-year (“R1 private”)
- R1 public four-year (“R1 public”)
- R2 private not-for-profit four-year (“R2 private”)
- R2 public four-year (“R2 public”)
On top of these 20 research universities, we also looked at three liberal arts colleges and college consortia (“Liberal arts college/consortium”) to compare these liberal arts colleges that invest heavily in STEM research with traditional research universities.[20] This gives us a total sample size of 23 institutions.
Table 1: List of the 23 institutions in our sample
| Institution Name | Category |
|---|---|
| Princeton University | R1 private |
| University of Pennsylvania | R1 private |
| New York University | R1 private |
| Carnegie Mellon University | R1 private |
| Brandeis University | R1 private |
| University of California, Santa Cruz | R1 public |
| University of Maryland | R1 public |
| Oklahoma State University | R1 public |
| University of California, Riverside | R1 public |
| Oregon State University | RI public |
| University of Tulsa | R2 private |
| Brigham Young University | R2 private |
| Loyola Marymount University | R2 private |
| Howard University | R2 private |
| Wake Forest University | R2 private |
| Cleveland State University | R2 public |
| New Mexico State University | R2 public |
| Boise State University | R2 public |
| Arkansas State University | R2 public |
| Bowling Green State University | R2 public |
| The Claremont Colleges | Liberal arts college/consortium |
| Williams College | Liberal arts college/consortium |
| Tri-College Consortium | Liberal arts college/consortium |
We attempted to identify in these 23 institutions the following 14 types of commonly seen research cores:
- Nuclear magnetic resonance (NMR)
- Confocal laser scanning microscopy (CLSM)
- Scanning electron microscopy (SEM)
- Transmission electron microscopy (TEM)
- Cryogenic electron microscopy (cryo-EM)
- Genomics core
- Cytometry and cell sorting
- Proteomics core
- Nanotechnology core
- Observatory / telescope
- Spectrometer
- Fabrication core / machine shop
- 3D printing
- Animal facility
Combined, these 14 types provide us a fuller landscape of different types of research cores, including those defined by a central piece of instruments, as well as those dedicated to a specific research field or research procedure.[21]
The dataset that we were able to generate is by no means comprehensive as it only reflects the information on shared facilities and equipment that these institutions made publicly available online. The public accessibility of information regarding research cores varies extensively. While a 2019 whitepaper reported that over 63.6 percent of institutions in their survey maintained a list of core facilities,[22] in our sample only 26 percent made such lists available online. Especially for R2 institutions, information about research cores is typically decentralized, located in different academic departments and research labs but not in institution-wide resources.
Table 2: Presence of the 14 instruments in research cores within our study
| Institution | NMR | CLSM | SEM | TEM | Cryo-EM | Genomics core | Cytometry and cell sorting | Proteomics core | Nanotechnology core | Observatory / telescope | Spectrometer | Fabrication core / machine shop | 3D printing | Animal facility |
|---|---|---|---|---|---|---|---|---|---|---|---|---|---|---|
| R1 Private | ||||||||||||||
| Princeton | X | X | X | X | X | X | X | X | X | X | X | X | X | X |
| University of Pennsylvania | X | X | X | X | X | X | X | X | X | X | X | X | X | X |
| New York University | X | X | X | X | X | X | X | X | X | X | X | X | X | X |
| Carnegie Mellon University | X | X | X | X | X | X | X | X | X | X | X | X | X | |
| Brandeis | X | X | X | X | X | X | X | X | X | X | ||||
| R1 Public | ||||||||||||||
| University of California Santa Cruz | X | X | X | X | X | X | X | X | X | X | X | X | X | |
| University of Maryland | X | X | X | X | X | X | X | X | X | X | X | X | X | X |
| Oklahoma State | X | X | X | X | X | X | X | X | X | X | X | X | X | |
| University of California Riverside | X | X | X | X | X | X | X | X | X | X | X | X | X | |
| Oregon State | X | X | X | X | X | X | X | X | X | X | X | |||
| R2 Private | ||||||||||||||
| University of Tulsa | X | X | X | X | X | X | X | X | X | X | X | |||
| Brigham Young University | X | X | X | X | X | X | X | X | X | X | X | |||
| Loyola Marymount | X | X | X | X | X | X | ||||||||
| Howard | X | X | X | X | X | X | X | X | X | X | X | X | ||
| Wake Forest | X | X | X | X | X | X | X | X | X | X | X | |||
| R2 Public | ||||||||||||||
| Cleveland State | X | X | X | X | X | X | X | |||||||
| New Mexico State | X | X | X | X | X | X | X | X | X | X | ||||
| Boise State | X | X | X | X | X | X | X | X | X | X | X | X | ||
| Arkansas State | X | X | X | X | X | X | X | X | ||||||
| Bowling Green State University | X | X | X | X | X | X | X | |||||||
| Liberal Arts Colleges | ||||||||||||||
| The Claremont Colleges | X | X | X | X | X | X | X | X | ||||||
| Williams | X | X | X | X | X | X | X | X | X | |||||
| Tri-College Consortium | X | X | X | X | X | X | X | X | X | |||||
An X it indicates the presence of this instrument at the institution, blank cells mean that there was no publicly available information to confirm the presence of this instrument.
How Are Research Cores Distributed?
Institutions host different types of research cores based on whether they are primarily motivated by competitiveness or affordability. R1 institutions, both public and private, pursue a larger variety of more advanced instruments as they have a wider range of research priorities that enable them to recruit top faculty and attract grants. Public R2 institutions and liberal arts colleges, on the other hand, tend to devote their resources to research cores essential to research and teaching activities.
Researchers at R1 institutions, according to our sample, tend to have access to a more comprehensive set of research cores. As Table 2 shows, most R1 institutions provide 13 or 14 out of the 14 types of common research cores that we investigated, demonstrating a very high level of commitment to offering advanced technologies and services to their researchers. Private not-for-profit and public institutions at the R1 level here are similarly well-equipped. Both R1 private institutions and public institutions on average include roughly 13 of the 14 research cores. R1 institutions also tend to establish research cores dedicated to certain subfields of research that benefit from having a specific set of instruments in one place, such as genomics, proteomics, and nanotechnology.
Seven out of the 10 R1 institutions in our sample have cryo-EM, the most sought after item by senior research officers at the moment.[23] By far the most advanced tool for scientists to observe macromolecules in atomic detail and determine their structures, cryo-EM is transforming multiple theoretical and translation fields of research and is predicted to replace x-ray crystallography in just a few years.[24] The three inventors of this technology received the Nobel Prize for Chemistry in 2017.[25] One challenge associated with this technology is its high cost. A top-rated machine costs approximately $7 million, not including the additional amount of investment needed for renovating the lab space, which typically includes building special footings and heightened ceilings to handle the load and height of the equipment. The average operation cost of a cryo-EM is estimated to be as high as $10,000 per day, which easily amounts to over $3 million dollars per year.[26] In 2018, the NIH announced $130 million in grants to establish three national cryo-EM centers in New York, California, and Oregon.[27] However, researchers are currently stuck on waitlists for weeks.[28] It is therefore unsurprising that for R1 institutions, in order to boost research outputs and attract top scientists, running their own cryo-EMs has become a top priority.[29]
We did observe a small but visible gap between private and public R2 universities in our sample: the private institutions typically hosted 10 out of the 14 research cores, whereas the number dropped to nine for the publics. In general, R2 public universities do not provide cores dedicated to more specialized fields of research. Similar to the research-heavy liberal arts colleges, R2 public institutions seem to prioritize research cores that serve students in multiple disciplines. Many of these cores, such as SEM, spectrometer, 3D printing, and animal facility, are also more critical to teaching and research activities at the undergraduate level.
Our analysis shows that R1 universities are the leaders in hosting a large variety of state-of-the-art instrumentation that gives them the competitive edge. On the other hand, R2 public schools and the few liberal arts colleges in our sample seem to prioritize having research cores that are essential to their day-to-day research and teaching needs.
Business Model
Research cores can bring tremendous value to universities. At the same time they carry high operating and administrative costs. To operate a research core, significant financial commitments are required in both the short- and long-term.
Setting up a research core requires a large upfront cost, consisting of both the purchase of instrumentation and those expenses associated with acquiring a proper space, setting up the equipment and needed materials, and other capital expenditures. These upfront costs are normally paid by a combination of external and internal funding. According to a recent survey of senior research officers at US universities, the funds for purchasing new equipment in research cores typically come from external grants (87 percent), central institutional funds (83 percent), departmental funds (73 percent), user fees (50 percent), facilities and administrative resources (50 percent),[30] and donations (27 percent).[31] NIH has established a special category—P30 Center Core Grants—dedicated to funding shared resources and facilities. It has also been actively incentivizing institutions to collaborate with them on absorbing the upfront costs. For example, NIH’s Office of Research Infrastructure Programs (ORIP) provides an S10 instrumentation grant that funds research instruments that cost up to $2 million that would be shared by at least three principal investigators at an institution.[32] Although the grant does not require the applicant’s institutions to match this funding, NIH does pay special attention to the financial commitment from the institutions to hosting new instruments in the reviewing process.[33]
Once a research core is set up, it normally operates under a cost recovery model with additional subsidy provided by internal and external funds. Most research cores use a fee-for-service model for cost recovery.[34] Users of research cores pay fees at a rate determined by the net costs of services provided. In some cases, the net costs can be reduced by federal grants that provide direct cost support.[35] Overall, the business goal of a typical research core is to generate enough revenue to break even, rather than to create surplus. Ideally, a successful core accomplishes its mission of advancing science, enabling research, and improving access to technology while maintaining a stable income stream and operating in a cost-neutral fashion. In reality, however, recovering the operational costs entirely through revenue generated from user fees is very challenging for many research cores. It is not uncommon for them to resort to various external and internal sources of subsidy that help them pay for salaries of their staff and other expenses incurred by their daily operations.
Expenses
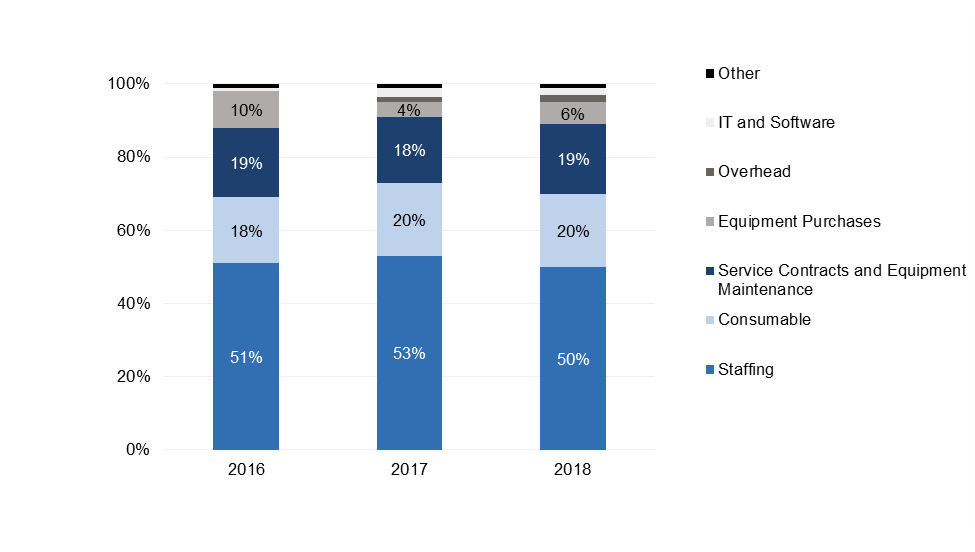
There are various types of costs that research cores need to recover. A 2019 study on the research core market, which surveyed over 100 institutions across the United States, revealed that labor costs (over 50 percent of overall costs) and service contracts and equipment maintenance (around 20 percent) account for over two thirds of research cores’ operating expenses.[36] Consumables, or the raw materials used to perform experiments, are another expense, making up roughly 20 percent of a research core’s operating expenses. IT, software, and overhead costs do not constitute significant portions of the overall operation cost of research cores (Figure 2).
Figure 2: Percentage of expense by type for research cores (2016-18)[37]
Revenue
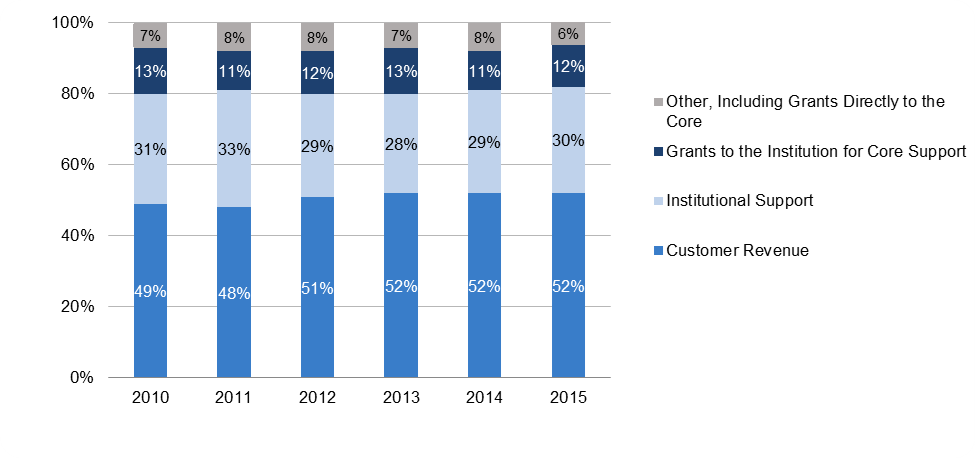
Service fees (around 50 percent), internal subsidies (around 30 percent), and external grants (over 12 percent) constitute the three main sources of revenue for research cores in the US (Figure 3).[38] Internal users remain the lifelines for most research cores. According to a 2018 survey, the amount of service fees generated from internal users was six times as much as that from external academic users, and 11 times as much as that from external corporate users.[39] Internal or external subsidies are also significant sources of income to research cores. Institutions subsidize research cores by actively allocating funds directly to them and passively allowing deficits to accrue at cores.[40]
Figure 3: Percentage of revenue by source from 2010 to 2015[41]
Key Considerations
In the United States, the majority of research cores at universities have operated for more than 10 years.[42] For university administrators and core directors to maximize the investment return and prolong their shelf lives, it is critical to create sustainable portfolios and constantly review their financial standings.[43] There are three factors that are most critical to the financial sustainability of a research core over the course of its operation:
- Ability to attract clients. Because research cores directly serve researchers, their financial conditions are always fundamentally shaped by the needs of their users. A research core that fails to keep up with the state of the art technologically or provide high-quality in-demand services will face a significant decrease in its use among researchers, which can prompt the central administration to consider closure as the most sound financial option.[44] Research cores also compete with one another for internal clients if there is some overlap in functions. To avoid this, institutions carefully design research cores to establish their distinctive focuses and maximize their synergy and consider consolidating existing facilities before setting up new cores.
- Ability to secure funding. Currently, the competition among research cores for resources is heightened both on a national level and within individual institutions. As the percentage of federal funding in academic research and development has continued to shrink in the past decade, institutions are increasingly embracing the responsibility to finance research themselves (Table 3). This means research cores also rely heavily on internal financial support. One study reported that over 80 percent of the surveyed institutions (mostly public) provide active or passive internal subsidization for their research cores.[45] However, over half of senior research officers in an earlier study believe that the resources provided to their offices are not adequate compared to other budgetary units on campus. Moreover, 74 percent agreed that core facilities at their universities were not provided with adequate resources for their given mission and responsibilities.[46] Therefore, research cores that can secure external and internal funding opportunities are in a better financial position to survive.
- Alignment with institutional priorities, policies, and cultures. Institutional priorities could fundamentally determine which research cores receive more internal investment. As our previous analysis has shown, there are certain types of research cores (such as cyro-EMs) that are getting more attention from R1 institutions right now. Research also suggests that institutional policies and cultures shape almost every aspect of a research core.[47] For instance, a growing set of institutions maintain their shared cores centrally whereas others do not.[48] For those who do, senior research officers normally hold a certain level of budget autonomy. This means research cores at different institutions are dependent on the central administration (and the financial judgment of individual senior research officers) to varying degrees.[49]
Table 3: Percentage of academic R&D expenditures by revenue source from 2010 – 2019.[50]
| Survey form and fiscal year | Federal government | State and local government | Institution funds - total | Institutionally financed research | Cost sharing | Unrecovered indirect costs | Business | Nonprofit orgs | All other sources |
|---|---|---|---|---|---|---|---|---|---|
| 2010 | 61.15% | 6.34% | 19.49% | 10.11% | 1.77% | 7.61% | 5.22% | 6.09% | 1.71% |
| 2011 | 62.46% | 5.90% | 19.27% | 10.44% | 1.77% | 7.06% | 4.88% | 5.90% | 1.59% |
| 2012 | 61.05% | 5.68% | 20.68% | 11.73% | 1.96% | 7.00% | 4.98% | 6.13% | 1.47% |
| 2013 | 58.84% | 5.52% | 22.30% | 13.27% | 2.03% | 7.01% | 5.23% | 5.81% | 2.29% |
| 2014 | 56.47% | 5.81% | 23.43% | 14.31% | 2.05% | 7.07% | 5.54% | 5.91% | 2.84% |
| 2015 | 55.19% | 5.63% | 24.22% | 15.21% | 1.97% | 7.05% | 5.84% | 6.17% | 2.97% |
| 2016 | 54.04% | 5.62% | 24.97% | 15.93% | 2.04% | 7.00% | 5.87% | 6.44% | 3.07% |
| 2017 | 53.53% | 5.55% | 25.13% | 16.15% | 2.09% | 6.89% | 5.89% | 6.85% | 3.06% |
| 2018 | 52.94% | 5.45% | 25.58% | 16.70% | 1.93% | 6.95% | 5.96% | 6.89% | 3.17% |
| 2019 | 53.24% | 5.39% | 25.29% | 16.79% | 1.88% | 6.61% | 6.05% | 6.81% | 3.23% |
| Change (2010-19) | -7.91% | -0.95% | +5.80% | +6.68% | +0.11% | -1.00% | +0.83% | +0.72% | +1.52% |
Impacts of COVID-19
The COVID-19 pandemic has posed a significant challenge to research cores and their cost recovery business model. During the pandemic, universities either paused or limited their research activities, leading to the underutilization of their research capacities.[51] The low throughput made it nearly impossible for research cores to generate enough user fees for cost recovery. At one point, it was not clear if research cores would be able to utilize their external funding, as their personnel and overhead costs could not be subsidized if they were not providing services.[52]
To address this, among many other unprecedented challenges, organizations such as the American Council on Education (ACE), the Association of American Universities (AAU), and the Association of Public and Land-Grant Universities (APLU) co-signed several petitions to the federal government. In an open letter released in September 2020, these organizations estimated that to address the immediate impact of the pandemic on higher education, at least $120 billion dollars would be needed.[53] However, to date the three Higher Education Emergency Relief Funds (HEERF I/II/III) that have been approved by Congress offer only around $76 billion dollars.[54] The RISE Act of 2021, introduced in the Senate this February, contains a $25 billion relief bill to support federal funding agencies for science and provides “flexibility on awards to account for facility closures or other limitations during the COVID-19 public health emergency.” However, little progress has been made.[55] Overall, these relief bills are inadequate to relieve the financial hardships that have strained research institutions and to meet the needs of their research cores.[56] As research activities gradually go back to normal at universities, research cores will have to address the aftermath of the pandemic and perhaps reflect on their business model in preparation for the next crisis.[57]
Cross-Institutional Coordination
Cross-institutional coordination on the shared use of advanced instruments is key to building a feasible and sustainable path for research cores to maximize their impact. In this section, we highlight three important strategies that are shaping resource sharing practices within the science community.
The use of scheduling systems helps research cores better coordinate instrument use with efficiency and fairness. Agilent’s iLab system offers a core facility management solution used by many research cores to manage service requests. For example, all researchers in the Greater Philadelphia area can make reservations for many of the University of Pennsylvania’s research cores via their individual iLab pages.[58] There is also Science Exchange, an online marketplace that boasts over 3,300 registered experimental service providers.[59] On top of helping researchers search and book facilities, it also allows them to post public reviews.[60] A more sophisticated model exists at the W. M. Keck Observatory, which maintains 10-meter telescopes for researchers from several universities across different states. To manage requests by users from a variety of communities, it has adopted a scheduling system in which several Time Allocation Committees are established to assign time to users based on semi-annual review of their proposals.[61] For all research cores, regardless of their size and function, having a system that helps them manage requests efficiently is the starting point of opening up to users from various places.
The formation of national and regional alliances helps different institutions combine their strengths and improve the visibility and efficiency of their research cores. On the national level, there is eagle-i, built upon a $15-million-dollar NIH grant in 2009.[62] It offers a search engine that allows users to access information about the many types of resources for biomedical research across over 40 participating research institutions, including research cores, software, and specimens.[63] On the regional level, research alliances can activate the shared use of key infrastructure and instrumentation as well as enable new degree programs.[64] University alliances sometimes carry the additional benefit of diversifying the student body, such as in the case of the Georgetown-Howard Universities Center for Clinical and Translational Science.[65]
Data sharing on public databases can reduce waste of research cores by helping researchers make better plans for their instrument usage. Protein Data Bank (PDB), a public database that hosts information of over 180,000 protein structures, allows all researchers to search, view, and download experimental results generated in labs all over the world.[66] Based on the estimation by the Rutgers Office of Research Analytics in 2017, PDB helped the global science community save at least $12 billion by cutting unnecessary duplication of effort.[67] More recently, DeepMind released its AlphaFold Protein Structure Database in collaboration with the European Bioinformatics Institute, which promises to cover over 130 million proteins in its future updates.[68] It is based on DeepMind’s AI algorithm that could revolutionize the field of structural biology, including replacing some of the need for conducting laboratory observations of macromolecules through expensive devices such as cryo-EMs.[69]
The common theme across these strategies is to promote transparency of information and reduce invisibility of assets. The business of individual cores benefits from being within reach for a wider group of users, if the latter can easily identify and reserve their services. For universities and research organizations, strengthened partnerships with peer institutions could bring tremendous benefits, including improved efficacy of their research cores. Last but not least, improved access to information about others’ research progress helps individual investigators make more informed decisions on instrument usage. For research cores to maximize their impact, and for researchers to get the most out of them, it is essential to explore new technologies and arrangements to facilitate congeniality and collaboration among researchers, and among research institutions.
Staffing and Expertise
Research cores are also key service providers to the research enterprise, and the expertise that research core employees bring can be just as important as its equipment. This is especially true for research cores as all-inclusive service providers that have experts conduct experiments on behalf of researchers.[70] According to a 2019 study, around 55 percent of research cores in the US have a service element.[71]
Managers, staff scientists, and technicians working at research cores provide a variety of services to their institutions and the research community on top of ensuring the day-to-day operation of the research cores. Their responsibilities could include technology consulting, experimental design, funding applications, data analysis, and user training, all of which require highly specialized skills. Maintaining a staff with high levels of expertise is therefore critical to service quality, which is decisive to the popularity, the operational excellence, and the financial sustainability of a research core. In short, as research cores become indispensable service providers for cutting-edge research at not-for-profit research institutions, talent acquisition and retention also become critical.
Research cores are a relatively new phenomenon that differ from individual research labs, which remain the dominant way of organizing scientific research at universities. Research core staff collaborate on research projects across different research groups, unlike staff members and graduate students who work at individual research labs organized by faculty members. As a result, research core staff do not have the same level of support as their peers in the more traditional lab environment, who work under specific faculty members and belong to certain academic programs, where many resources for career development are located. In this emerging community of scientific workers, large-scale reports and individual case studies have consistently shown that they are not getting adequate support from their employers.[72] In particular, staff members of research cores expressed three types of frustrations:
- Lack of job security and well-established career paths. Research cores as a recent phenomenon in the research enterprise have not been incorporated into the traditional tenure-track model, which, despite its decline, still defines the professional culture at research universities.[73] A 2018 survey shows less than 40 percent of core heads in the US were on permanent working contracts, with many of them working on a contract that renews annually subject to funding availability, whereas 80 percent of their peers in Europe were employed on a permanent basis.[74] The lack of a well-established professional path has been cited by many research core directors as a major challenge for retaining highly skilled workers.[75] In the long run, high turnover of staff will negatively impact the quality of service and further prevent research cores and the institutions to maximize the return of their investments.
- Lack of professional development resources. As service providers, research cores can greatly benefit from staff members with strong business and managerial skills on top of their technical expertise. In a recent study, over 97 percent of surveyed staff at research cores believed they needed to improve on their managerial skills in performance evaluation, project management, user relations, among other areas.[76] However, there are not enough resources, especially dedicated training programs sponsored by their employers, available to them. Over the last decade, professional organizations such as ABRF and FASEB have been calling for a better professionalization of the staff members of research cores at institutions.[77] The National Cancer Institute (NCI) has created a special award for Research Specialist (Core-based Scientist), seeking to facilitate “the development of stable research career opportunities for exceptional scientists” working at research cores.[78] However, there remains a general lack of support both on the national and institutional levels on this front, which can further impede the quality of service and the retention of talents for research cores.
- Lack of established mechanisms to recognize their contributions. Managers and staff scientists at research cores are typically highly skilled researchers.[79] Their contributions to research projects sometimes go beyond basic technical training and facility stewardship. In those cases, appropriately recognizing them as co-authors or naming them individually in acknowledgements in publications and patents should become part of the academic code of conduct.[80] In reality, however, it can be tricky for research core staff to demand credits for their contributions, as that can drive certain customers away from using their service.[81]
Harmony and synergy between research cores and the more traditional research labs will help both types of research facilities realize their full potential, thus maximizing the return of investments by internal and external sources. For that to happen, the research community and individual institutions need to invest more in the staff at research cores and come up with equitable ways to professionalize their career track.[82] For universities, they can create more long-term employment opportunities for research core staff to provide security and stability. The scaling of dedicated professional development resources and programs for research core professionals also helps professionalize the career track. Last but not least, members of the science community can facilitate this process by pushing for a culture change towards giving proper credits and recognitions to research core staff, whose service and expertise bring tremendous value to scientific advancement.
Reflections
The emergence of research cores as a key component in the research enterprise presents a valuable lesson. Their success reflects the momentum that centralizing efforts to facilitate collaboration have gained at research institutions in recent years. On the other hand, their ongoing struggles to achieve financial sustainability and to professionalize their workers find resonances in other parts of the research enterprise. We reflect on the future of the research enterprise that build on the case of research cores in three areas:
Distribution, Centralization, and Collaboration. In recent years, IT departments have been going through a period of increasing centralization, as the strategic role of IT and the commensurate risks that security breaches can pose have grown exponentially.[83] University libraries had earlier been centralized from the original array of largely independent departmental libraries that once proliferated on many university campuses. Many universities have similarly been centralizing the organization and management of their research cores under an increasingly organized university research office. Today, an increasing number of universities are considering new models for cross-institutional sharing of certain research cores, which may end up reflecting certain aspects of library consortia. From our perspective, the strategies that research cores have developed to facilitate cross-institutional coordination, including forming regional alliances, adopting user-friendly interfaces, and encouraging open access of critical resources and data, offer not only valuable lessons to other research enablement services but also common grounds for conversations and collaborations.
Cost Recovery. The operating business model of research cores, like that of many university presses, relies on cost recovery with some amount of subsidization. For research cores, this has had the advantage of imposing discipline on whether the particular facility is still valuable, and an incentive to sunset it when that is no longer the case. Moreover, the ability to provide a substantial share of the cost recovery through external research grants is a validation of the vital role of research cores in scientific research success. Indeed, while this landscape focused on the US, in the EU, the ability of research cores to secure international, governmental, and other forms of public funds is a pivotal metric of their success.[84] While there may not be direct applicability to other university research enablement and support services, such as the library, IT, or the scientific communications, there may be elements of this approach, including its emphasis on sharing and access, as well as its adaptivity to user needs driven by multiple financial incentives, that could help to strengthen their connections with the research enterprise.
Professionalization. Research cores are transforming the workforce of the research enterprise in important ways. They have not only created new sets of professional roles, tracks, and areas of responsibilities, but also instilled new organizational forms and principles into the existing system.[85] However, many research cores struggle to maintain a stabilized workforce of PhD-trained scientists, who must perform a wide array of critical tasks that have been assigned to tenured and tenure-track faculty in research universities, including research, project management, funding application, and mentoring, without enjoying the same level of job security, professional resources, and career prospect. Amidst the slow yet steady decline of the tenure track, perspectives of research core professionals should be included in our ongoing reflection on the future of the academic workforce.[86]
Endnotes
- For instance, see “ASM Endorses RISE Act of 2021 to Support Research,” American Society of Microbiology, February 9, 2021, https://asm.org/Articles/Policy/2021/Feb-21/ASM-Endorses-RISE-Act-of-2021-to-Support-Research; “AUA Joins Partners in Supporting Supplemental Funding for the National Institutes of Health (NIH),” American Urological Association, May 11, 2021, https://community.auanet.org/blogs/policy-brief/2021/05/11/aua-joins-partners-in-supporting-supplemental-fund ↑
- Jane Radecki, Oya Y. Rieger, and Roger C. Schonfeld, “What Is the Academic Research Enterprise?,” Ithaka S+R, December 17, 2020, https://sr.ithaka.org/blog/what-is-the-academic-research-enterprise/. ↑
- Adapted from “Frequently Asked Questions (FAQs): Core Facilities,” National Institutes of Health, https://grants.nih.gov/faqs#/core-facilities.htm?anchor=question53273 ↑
- Julie Gould, “Core Facilities: Shared Support,” Nature 519, no. 7544 (March 25, 2015): 495–496, https://doi.org/10.1038/nj7544-495a. ↑
- “Shared and Core Facilities,” National Institute of Environmental Health Sciences, June 22, 2021, https://www.niehs.nih.gov/research/atniehs/facilities/index.cfm. ↑
- “Maximizing Shared Research Resources Part I: Recommendations from the Federation of American Societies for Experimental Biology,” Federation of American Societies for Experimental Biology (FASEB), October 3, 2017, https://www.faseb.org/Portals/2/PDFs/opa/2017/Maximizing%20Shared%20Research%20Resources%20-%20Part%20I.pdf. ↑
- National Academy of Sciences, National Academy of Engineering, and Institute of Medicine of the National Academies, Advanced Research Instrumentation and Facilities (Washington, DC: The National Academies Press, 2006), https://doi.org/10.17226/11520. ↑
- In reality, not all research cores conform to our definition. Institutions such as the Johns Hopkins School of Medicine have adopted a broader definition of research cores that includes research facilities shared among an exclusive group of researchers, which have the potential to transform into full-fledged research cores. These days, it is common for universities to regularly evaluate existing facilities and their unrealized potentials for financial planning purposes. In that sense, a broader definition of research cores can be useful in helping a university keep track of all the available resources across administrative units. See “Types of Cores,” John Hopkins Medicine, https://www.hopkinsmedicine.org/research/resources/synergy/core-in-a-box/setup/types.html; G. K. Farber and L. Weiss, “Core Facilities: Maximizing the Return on Investment,” Science Translational Medicine 3, no. 95 (August 10, 2011): 2, https://doi.org/10.1126/scitranslmed.3002421. ↑
- For instance, a lot of biology labs have their own centrifuges and polymerase chain reaction (PCR) machines. ↑
- See Table 1, “Job Descriptions for Nonexempt and Exempt Staff Positions in Core Facilities,” in Philip Hockberger et al., “Building a Sustainable Portfolio of Core Facilities: A Case Study,” Journal of Biomolecular Techniques 29, no. 3 (September 29, 2018): 79–92, https://doi.org/10.7171/jbt.18-2903-003. ↑
- G. K. Farber and L. Weiss, “Core Facilities: Maximizing the Return on Investment,” Science Translational Medicine 3, no. 95 (August 10, 2011): 1–3, https://doi.org/10.1126/scitranslmed.3002421. ↑
- For example, see “Pricing,” University of Pennsylvania Chemical and Nanoparticle Synthesis Core, https://www.med.upenn.edu/cnsc/pricing.html. ↑
- Luke Georghiou, “N8 Research Partnership, Sharing for Excellence and Growth: Synthesis Report,” June 2012, https://www.n8research.org.uk/media/14137-N8-Sharing-for-Excellence-and-Growth-Report_web.pdf. For a framework of analysis, see Danielle Cooper and Rebecca Springer, “Data Communities: A New Model for Supporting STEM Data Sharing,” Ithaka S+R, May 13, 2019, https://sr.ithaka.org/publications/data-communities/. ↑
- Rand Haley, “A Framework for Managing Core Facilities within the Research Enterprise,” Journal of Biomolecular Techniques 20, no. 4 (September 2009): 226–30, https://www.ncbi.nlm.nih.gov/pmc/articles/PMC2729482/. ↑
- Based on the number of search results of “core laboratory” on the eagle-i database on November 12, 2021. See https://search.eagle-i.net/central/#results?t=http://vivoweb.org/ontology/core%23CoreLaboratory&of=score. ↑
- “Core Laboratories at University of Pennsylvania,” accessed on November 12, 2021, eagle-i, http://eagle-i.itmat.upenn.edu/sweet/cores/. ↑
- “About Us,” Association of Biomolecular Resources Facilities, https://www.abrf.org/mission. ↑
- Sally Rockey, “Core Facts About Core Facilities,” Extramural Nexus, September 10, 2015, https://nexus.od.nih.gov/all/2015/09/10/core-facts-about-core-facilities/; National Institutes of Health and Association of Biomolecular Research Facilities, “Workshop on Enhancing Efficiency of Research Core Facilities: Workshop Report,” March 28, 2015, https://dpcpsi.nih.gov/sites/default/files/NIH-ABRF%20Workshop%20Report_Complete_06-22-15.pdf. ↑
- The R1 Carnegie Classification denotes doctoral institutions with very high research activity while the R2 classification refers to doctoral institutions with high research activity. We obtained the lists of R1 and R2 universities and sorted both using an online randomizer. Then, we picked the first five private and public universities that appeared on each list. See “Standard Listings,” Carnegie Classification of Institutions of Higher Education, https://carnegieclassifications.iu.edu/lookup/standard.php#standard_basic2005_list. ↑
- These three liberal arts colleges/consortia provide a considerable amount of resources to support cutting-edge research, despite not being research universities. For example, see “Research,” Williams College, https://www.williams.edu/academics/research/. ↑
- Currently, there is no consensus regarding how to best categorize research cores. In published studies, they are organized sometimes by technology, and sometimes by academic discipline. See Noelle Strubczewski, “Shared Resource Facility Market Analysis,” Agilent, December 2, 2019, https://www.agilent.com/cs/library/whitepaper/public/whitepaper-led-ilab-core-facility-shared-resources-5994-1620en-agilent.pdf; National Academy of Sciences, National Academy of Engineering, and Institute of Medicine of the National Academies, Advanced Research Instrumentation and Facilities (Washington, DC: The National Academies Press, 2006): 20, https://doi.org/10.17226/11520. ↑
- Noelle Strubczewski, “Shared Resource Facility Market Analysis,” Agilent, December 2, 2019, https://www.agilent.com/cs/library/whitepaper/public/whitepaper-led-ilab-core-facility-shared-resources-5994-1620en-agilent.pdf. ↑
- Oya Y. Rieger and Roger C. Schonfeld, “The Senior Research Officer: Experience, Role, Organizational Structure, Strategic Directions, and Challenges,” Ithaka S+R, December 1, 2020, https://sr.ithaka.org/publications/the-senior-research-officer/. ↑
- Yifan Cheng, Robert M. Glaeser, and Eva Nogales, “How Cryo-EM Became So Hot,” Cell 171, no. 6 (November 30, 2017): 1229-1231, https://doi.org/10.1016/j.cell.2017.11.016; Eric Han, “‘We Need a People’s Cryo-EM.’ Scientists Hope to Bring Revolutionary Microscope to the Masses,” Science Magazine (January 23, 2020), https://doi.org/10.1126/science.aba9954; Elle Callaway, “Revolutionary Cryo-EM Is Taking Over Structural Biology,” Nature 578 (February 10, 2020), https://doi.org/10.1038/d41586-020-00341-9. ↑
- “The Nobel Prize in Chemistry 2017,” The Royal Swedish Academy of Sciences, October 4, 2017, https://www.nobelprize.org/prizes/chemistry/2017/press-release/. ↑
- Eric Han, “‘We Need a People’s Cryo-EM.’ Scientists Hope to Bring Revolutionary Microscope to the Masses,” Science Magazine (January 23, 2020), https://doi.org/10.1126/science.aba9954. ↑
- “NIH Funds Three National Cryo-EM Service Centers and Training for New Microscopists,” National Institutes of Health, May 15, 2018, https://www.nih.gov/news-events/news-releases/nih-funds-three-national-cryo-em-service-centers-training-new-microscopists; “Transformative High Resolution Cryo-Electron Microscopy (CryoEM) Service Centers & Training,” National Institutes of Health, October 6, 2021, https://commonfund.nih.gov/cryoem/sites. ↑
- Eric Han, “‘We Need a People’s Cryo-EM.’ Scientists Hope to Bring Revolutionary Microscope to the Masses,” Science Magazine (January 23, 2020), https://doi.org/10.1126/science.aba9954. ↑
- Oya Y. Rieger and Roger C. Schonfeld, “The Senior Research Officer: Experience, Role, Organizational Structure, Strategic Directions, and Challenges,” Ithaka S+R, December 1, 2020, https://sr.ithaka.org/publications/the-senior-research-officer/. ↑
- The facilities and administrative (F&A) costs are also known to be the indirect costs. They cover the costs associated with the operation, maintenance, and depreciation of the research facilities, as well as the costs of paying for accounting, payroll, and administrative personnel and services. The federal government reimburses the F&A expenses at a different rate for each university. This rate is determined by the costs incurred by the university in a previous year and by negotiations between the university and the federal government. See “Explanation of Facilities and Administrative Costs,” Wayne State University Office of the Vice Provost for Research and Innovation, https://www.wright.edu/research/research-and-sponsored-programs/explanation-of-facilities-and-administrative-costs. ↑
- The survey is based on 58 respondents, of whom 95 percent work at public universities. Fifty-two percent of their institutions are recognized as R1s, and 47 percent are R2s. See Jason R. Carter, Douglas L. Delahanty, Jane E. Strasser, Alicia J. Knoedler, Gillian Wilson, Ralph K. Davis, and Don Engel, “Operational and Fiscal Management of Core Facilities: A Survey of Chief Research Officers,” Journal of Research Administration 50, no. 3 (Fall 2019): 24, https://eric.ed.gov/?id=EJ1237833. ↑
- For a list of “Shared and High-End Instrumentation” funded by NIH’s S10 grant, see https://orip.nih.gov/construction-and-instruments/s10-instrumentation-programs/filterable-awards-table. According to its selection criteria, it is available to “domestic public and private institutions of higher education, and non-profit domestic institutions such as hospitals, health professional schools, and research organizations” and requires the institution to identify at least three “Principal Investigators with active NIH research awards who demonstrate the substantial need for the requested instrument.” ↑
- “The S10 Instrumentation Programs,” National Institutes of Health, August 31, 2021, https://orip.nih.gov/construction-and-instruments/s10-instrumentation-programs; “Frequently Asked Questions: Shared and High-End Instrumentation Grant Programs,” National Institutes of Health, August 31, 2021, https://orip.nih.gov/construction-and-instruments/s10-instrumentation-programs/frequently-asked-questions-shared-and-high. ↑
- Ninety-six percent of the SROs identified user fees as a funding source used to support their research cores. See Jason R. Carter, Douglas L. Delahanty, Jane E. Strasser, Alicia J. Knoedler, Gillian Wilson, Ralph K. Davis, and Don Engel, “Operational and Fiscal Management of Core Facilities: A Survey of Chief Research Officers,” Journal of Research Administration 50, no. 3 (Fall 2019): 19–20, https://eric.ed.gov/?id=EJ1237833. ↑
- See A.2 in: “Frequently Asked Questions (FAQs): Core Facilities,” National Institutes of Health, https://grants.nih.gov/faqs#/core-facilities.htm?anchor=question53273. ↑
- Noelle Strubczewski, “Shared Resource Facility Market Analysis,” Agilent, December 2, 2019, https://www.agilent.com/cs/library/whitepaper/public/whitepaper-led-ilab-core-facility-shared-resources-5994-1620en-agilent.pdf. ↑
- Ibid. ↑
- “The 2015 Core Facility Benchmarking Study,” Agilent, September 16, 2015, https://www.agilent.com/cs/library/whitepaper/public/2015_Benchmarking_Study.pdf. ↑
- Noelle Strubczewski, “Shared Resource Facility Market Analysis,” Agilent, December 2, 2019, https://www.agilent.com/cs/library/whitepaper/public/whitepaper-led-ilab-core-facility-shared-resources-5994-1620en-agilent.pdf. ↑
- Ibid. ↑
- “The 2015 Core Facility Benchmarking Study,” Agilent, September 16, 2015, https://www.agilent.com/cs/library/whitepaper/public/2015_Benchmarking_Study.pdf; “The 2016 Core Facility Benchmarking Study,” Agilent, September 22, 2016, https://www.agilent.com/cs/library/whitepaper/public/2016_Benchmarking_Study.pdf. ↑
- Around 72.8 percent of the surveyed research cores had operated for 10 or more years as of 2018. See Noelle Strubczewski, “Shared Resource Facility Market Analysis,” Agilent, December 2, 2019, https://www.agilent.com/cs/library/whitepaper/public/whitepaper-led-ilab-core-facility-shared-resources-5994-1620en-agilent.pdf. ↑
- Philip Hockberger, Jeffrey Weiss, Aaron Rosen, and Andrew Ott, “Building a Sustainable Portfolio of Core Facilities: A Case Study,” Journal of Biomolecular Techniques 29, no. 3 (August 6, 2018): 79–92, https://doi.org/10.7171%2Fjbt.18-2903-003. ↑
- Fifty-four percent of the surveyed senior research officers reported that there is a formal evaluation and/or renewal process for research cores, managed either centrally by themselves or the Provost Office or by the administrative unit they reported to. See Jason R. Carter, Douglas L. Delahanty, Jane E. Strasser, Alicia J. Knoedler, Gillian Wilson, Ralph K. Davis, and Don Engel, “Operational and Fiscal Management of Core Facilities: A Survey of Chief Research Officers,” Journal of Research Administration 50, no. 3 (Fall 2019): 19, https://eric.ed.gov/?id=EJ1237833. ↑
- Noelle Strubczewski, “Shared Resource Facility Market Analysis,” Agilent, December 2, 2019, https://www.agilent.com/cs/library/whitepaper/public/whitepaper-led-ilab-core-facility-shared-resources-5994-1620en-agilent.pdf. ↑
- Jason R. Carter, Douglas L. Delahanty, Jane E. Strasser, Alicia J. Knoedler, Gillian Wilson, Ralph K. Davis, and Don Engel, “Operational and Fiscal Management of Core Facilities: A Survey of Chief Research Officers,” Journal of Research Administration 50, no. 3 (Fall 2019): 18–22, https://eric.ed.gov/?id=EJ1237833. ↑
- Rand Haley, “A Framework for Managing Core Facilities within the Research Enterprise,” Journal of Biomolecular Techniques 20, no. 4 (September 2009): 228–29, https://www.ncbi.nlm.nih.gov/pmc/articles/PMC2729482/. ↑
- Sixty-six percent of the institutions reported that their shared resource facilities were structured with an overarching central administration. See Noelle Strubczewski, “Shared Resource Facility Market Analysis,” Agilent, December 2, 2019, https://www.agilent.com/cs/library/whitepaper/public/whitepaper-led-ilab-core-facility-shared-resources-5994-1620en-agilent.pdf. ↑
- Eighty percent of the respondents agreed that they had moderate to complete levels of flexibility over budgetary matters. See Jason R. Carter, Douglas L. Delahanty, Jane E. Strasser, Alicia J. Knoedler, Gillian Wilson, Ralph K. Davis, and Don Engel, “Operational and Fiscal Management of Core Facilities: A Survey of Chief Research Officers,” Journal of Research Administration 50, no. 3 (Fall 2019): 16, https://eric.ed.gov/?id=EJ1237833. ↑
- Data from “Higher Education Research and Development Survey (HERD),” National Science Foundation, January 2021, https://www.nsf.gov/statistics/srvyherd/; “Higher Education Research and Development: Fiscal Year 2019,” National Science Foundation, January 29, 2021, https://ncses.nsf.gov/pubs/nsf21314#data-tables. ↑
- Jane Radecki and Roger C. Schonfeld, “The Impacts of COVID-19 on the Research Enterprise: A Landscape Review,” Ithaka S+R, October 26, 2020, https://sr.ithaka.org/publications/the-impacts-of-covid-19-on-the-research-enterprise/. ↑
- Federal funding agencies including NSF and NIH later temporarily allowed research cores to use their grants to pay out salaries even when no service had been provided due to the pandemic. See “NSF Implementation of OMB Memorandum M-20-26, ‘Extension of Administrative Relief for Recipients and Applicants of Federal Financial Assistance Directly Impacted by the Novel Coronavirus (COVID-19) Due to Loss of Operations’ Dated June 18, 2020,” National Science Foundation, June 25, 2020, https://www.nsf.gov/bfa/dias/policy/covid19/covid19_nsfomb2026implementation.pdf; “NIH Implementation of OMB Memorandum M-20-26 Extension of Administrative Relief for Recipients and Applicants of Federal Financial Assistance Directly Impacted by the Novel Coronavirus (COVID-19) due to Loss of Operations” Dated June 18, 2020,” National Institutes of Health, July 2, 2020, https://grants.nih.gov/policy/natural-disasters/corona-virus/nih-omb-memo.htm. ↑
- “COVID Relief Negotiation Restart; Associations Ask for Additional Funds for Colleges and Universities,” American Council on Education, September 28, 2020, https://www.acenet.edu/News-Room/Pages/COVID-Relief-Negotiations-Restart-Associations-Ask-for-Additional-Funds-for-Colleges-and-Universities.aspx; “AAU, Associations Request at Least $120B in Pandemic Aid for Higher Education,” Association of American Universities, October 21, 2020, https://www.aau.edu/key-issues/aau-associations-request-least-120b-pandemic-aid-higher-education. ↑
- “U.S. Department of Education Announces $3.2 Billion in Additional Higher Education Emergency Relief Funds to Support Students at Historic and Under-Resourced Institutions,” US Department of Education, July 29, 2021, https://www.ed.gov/news/press-releases/us-department-education-announces-32-billion-additional-higher-education-emergency-relief-funds-support-students-historic-and-under-resourced-institutions. For information on the three HEERFs, see “Higher Education Emergency Relief Fund,” US Department of Education, August 25, 2021, https://www2.ed.gov/programs/heerf/index.html. ↑
- “S.289 – RISE Act of 2021,” 117th Congress (2021-2022), https://www.congress.gov/bill/117th-congress/senate-bill/289. ↑
- For example, in an open statement in December 2020, the ACE president described HEERF II as “disappointing” and “wholly inadequate to meet the needs of students and colleges and universities.” See “Statement by ACE President Ted Mitchell on COVID-19 Relief Package Higher Education Funding,” American Council on Education, December 21, 2020, https://www.acenet.edu/News-Room/Pages/Statement-by-ACE-President-Ted-Mitchell-on-COVID-19-Relief-Package-Higher-Education-Funding.aspx. ↑
- Currently, some universities are venturing into a new business model that might solve some of the problems. This new model is founded upon the outsourcing of lab experiments to external lab service providers. Some providers allow researchers (both academic and corporate ones) to conduct experiments remotely on a cloud lab platform, which gives commands to highly automated facilities equipped with instruments and technical personnel. The platform also automatically archives, processes, and analyzes the experiment results for researchers. It promises to help institutions cut their financial investments of acquiring instruments and hiring technicians, thus allowing researchers to publish at a faster pace and a cheaper rate. See “Publish Faster & Cheaper with a Cloud Lab,” Emerald Cloud Lab, https://www.emeraldcloudlab.com/why-cloud-labs/efficiency/academia; “Beyond the Pandemic: The Future of the Research Enterprise in Academic Year 2021-22 and Beyond: Report of a CNI Executive Roundtable Held June 2021,” Coalition for Networked Information, August 2021, https://www.cni.org/wp-content/uploads/2021/08/report-CNI-X-RT-Research-June-2021-FINAL.pdf. ↑
- “iLab Cores at University of Pennsylvania,” Penn Medicine, https://med-upenn.corefacilities.org/landing/264#/cores; “About Us,” University of Pennsylvania Electron Microscopy Resource Lab, https://www.med.upenn.edu/electronmicroscopyresourcelab/about-us.html. ↑
- “Home,” ScienceExchange, https://ww2.scienceexchange.com/s/. ↑
- For example: “Electron Microscopy Core Facility,” Bowling Green State University, https://www.scienceexchange.com/labs/electron-microscopy-core-facility-bgsu ↑
- “Observing,” W. M. Keck Observatory, https://keckobservatory.org/about/observing/; “Keck Operations Daily Schedule,” W. M. Keck Observatory, https://www2.keck.hawaii.edu/observing/keckSchedule/keckSchedule.php. ↑
- “About,” eagle-i, https://www.eagle-i.net/about/. ↑
- “Browse eagle-i Network Resources,” eagle-i, https://www.eagle-i.net/browse/. ↑
- For example, the long-term collaboration of Cleveland State University with Lerner Research Institute has led to better utility of many state-of-the-art technologies and a new joint PhD program. See “Lerner to Extend Decades-Long Collaboration with Cleveland State University,” Lerner Research Institute, September 28, 2017, https://www.lerner.ccf.org/news/details/?Lerner+to+Extend+Decades-Long+Collaboration+with+Cleveland+State+University&bf18bdb1eab07417da736cba88dbd748d5441f44&7ef94f0619015516293f62a51ec177bb82551efa; “Research Technology & Services,” Lerner Research Institute, http://www.lerner.ccf.org/cores/; “Graduate Programs: Cleveland State University,” Lerner Research Institute, https://www.lerner.ccf.org/education/grad/csu/. ↑
- “Community,” Georgetown-Howard Universities Center for Clinical and Translational Science, http://www.georgetownhowardctsa.org/community. ↑
- “About RCSB PDB: Enabling Breakthroughs in Scientific and Biomedical Research and Education,” RCSB Protein Data Bank, https://www.rcsb.org/pages/about-us/index. ↑
- Kevin P. Sullivan, Peggy Brennan-Tonetta, and Lucas J. Marxen, “Economic Impacts of the Research Collaboratory for Structural Bioinformatics (RCSB) Protein Data Bank,” Rutgers Office of Research Analytics, May 2017, https://cdn.rcsb.org/rcsb-pdb/general_information/about_pdb/Economic%20Impacts%20of%20the%20PDB.pdf. ↑
- “AlphaFold Protein Structure Database,” DeepMind, July 22, 2021, https://deepmind.com/research/open-source/alphafold-protein-structure-database; Ewen Callaway, “DeepMind’s AI Predicts Structures for a Vast Trove of Proteins,” Nature 595, no. 7869 (July 29, 2021): 635, https://doi.org/10.1038/d41586-021-02025-4. ↑
- “Will AlphaFold Change Bioscience Research?” The Biologist (December 4, 2020), https://thebiologist.rsb.org.uk/biologist-features/how-will-alphafold-change-bioscience-research; Stephen Cusack, Sebastian Eustermann, Gerard Kleywegt, Jan Kosinski, Julia Mahamid, José Antonio Marquez, Christoph Müller, Thomas Schneider, Janet Thornton, Jessica Vamathevan, Sameer Velankar, and Matthias Wilmanns, “Great Expectations – The Potential Impacts of AlphaFold DB,” EMBL-EBI, July 22, 2021, https://www.ebi.ac.uk/about/news/opinion/alphafold-potential-impacts. ↑
- For the difference between “user laboratories” and “all-inclusive services,” see Doris Meder, Mònica Morales, Rainer Pepperkok, Ralph Schlapbach, Andreas Tiran, and Geert Van Minnebruggen, “Institutional Core Facilities: Prerequisite for Breakthroughs in the Life Sciences,” EMBO Reports 17, no. 8 (August 1, 2016): 1089, https://doi.org/10.15252/embr.201642857. ↑
- Noelle Strubczewski, “Shared Resource Facility Market Analysis,” Agilent, December 2, 2019, https://www.agilent.com/cs/library/whitepaper/public/whitepaper-led-ilab-core-facility-shared-resources-5994-1620en-agilent.pdf. ↑
- “Maximizing Shared Research Resources Part I: Recommendations from the Federation of American Societies for Experimental Biology,” Federation of American Societies for Experimental Biology (FASEB), October 3, 2017: 11–12, https://www.faseb.org/Portals/2/PDFs/opa/2017/Maximizing%20Shared%20Research%20Resources%20-%20Part%20I.pdf; Takashi Onoda and Yasunobu Ito, “Pathways for the Co-creation of Service in Academia: An Ethnographic Analysis of Epistemic Cultures in Japanese Public Shared Core facilities,” 2018 Portland International Conference on Management of Engineering and Technology (2018): 1–9, https://doi.org/10.23919/PICMET.2018.8481761; Valentina Adami, Natalie Homer, Nadine Utz, Saskia Lippens, Joshua Z Rappoport, and Julia Fernandez-Rodriguez, “An International Survey of Training Needs and Career Paths of Core Facility Staff,” Journal of Biomolecular Techniques 32 (November 20, 2020): 1–9, https://doi.org/10.7171/jbt.2021-3201-002. ↑
- Colleen Flaherty, “A Non-Tenure-Track Profession?” Inside Higher Ed, October 12, 2018, https://www.insidehighered.com/news/2018/10/12/about-three-quarters-all-faculty-positions-are-tenure-track-according-new-aaup. ↑
- Valentina Adami, Natalie Homer, Nadine Utz, Saskia Lippens, Joshua Z Rappoport, and Julia Fernandez-Rodriguez, “An International Survey of Training Needs and Career Paths of Core Facility Staff,” Journal of Biomolecular Techniques 32 (November 20, 2020): 7, https://doi.org/10.7171/jbt.2021-3201-002; “Maximizing Shared Research Resources Part I: Recommendations from the Federation of American Societies for Experimental Biology,” Federation of American Societies for Experimental Biology (FASEB), October 3, 2017: 11, https://www.faseb.org/Portals/2/PDFs/opa/2017/Maximizing%20Shared%20Research%20Resources%20-%20Part%20I.pdf. ↑
- “Maximizing Shared Research Resources Part I: Recommendations from the Federation of American Societies for Experimental Biology,” Federation of American Societies for Experimental Biology (FASEB), October 3, 2017: 11, https://www.faseb.org/Portals/2/PDFs/opa/2017/Maximizing%20Shared%20Research%20Resources%20-%20Part%20I.pdf. ↑
- Valentina Adami, Natalie Homer, Nadine Utz, Saskia Lippens, Joshua Z Rappoport, and Julia Fernandez-Rodriguez, “An International Survey of Training Needs and Career Paths of Core Facility Staff,” Journal of Biomolecular Techniques 32 (November 20, 2020): 4, https://doi.org/10.7171/jbt.2021-3201-002. ↑
- “ABRF 2020 Annual Report: Overcoming Extraordinary Challenges Together,” Association of Biomolecular Resource Facilities, March 2021: 29, https://756d070e.flowpaper.com/ABRFAnnualReport/#page=1; “Maximizing Shared Research Resources Part I: Recommendations from the Federation of American Societies for Experimental Biology,” Federation of American Societies for Experimental Biology (FASEB), October 3, 2017: 7–8, https://www.faseb.org/Portals/2/PDFs/opa/2017/Maximizing%20Shared%20Research%20Resources%20-%20Part%20I.pdf. ↑
- “NCI Research Specialist Award (R50),” National Center Institute, https://www.cancer.gov/grants-training/grants-funding/funding-opportunities/r50. ↑
- A recent global study revealed that 80 percent of core heads hold a PhD degree (87 percent for US). The percentage of PhD degree holders is 74 percent for staff scientists. See Valentina Adami, Natalie Homer, Nadine Utz, Saskia Lippens, Joshua Z Rappoport, and Julia Fernandez-Rodriguez, “An International Survey of Training Needs and Career Paths of Core Facility Staff,” Journal of Biomolecular Techniques 32 (November 20, 2020): 4–6, https://doi.org/10.7171/jbt.2021-3201-002. ↑
- T. Amanda Strom, Greg Haugstad, Jonathan Shu, and Ram Seshadri, “Shared Instrumentation Facilities: Benefiting Researchers and Universities, and Sustaining Research Excellence.” MRS Bulletin 45, no. 5 (May 7, 2020): 334, https://doi.org/10.1557/mrs.2020.130. ↑
- Takashi Onoda and Yasunobu Ito, “Pathways for the Co-creation of Service in Academia: An Ethnographic Analysis of Epistemic Cultures in Japanese Public Shared Core facilities,” 2018 Portland International Conference on Management of Engineering and Technology (2018): 4, https://doi.org/10.23919/PICMET.2018.8481761 ↑
- Steven Hyman, “Biology Needs More Staff Scientists,” Nature 545 (May 18, 2017): 283–84, https://doi.org/10.1038/545283a. ↑
- Janet Crum, “IT Centralization: Impact on Academic Libraries,” LITA Blog (December 13, 2018), https://litablog.org/2018/12/it-centralization-impact-on-academic-libraries/; Janet Crum, “IT Centralization: Impact on Academic Libraries, Part 2,” LITA Blog (January 23, 2019), https://litablog.org/2019/01/it-centralization-impact-on-academic-libraries-part-2/. ↑
- While this current review focuses on research cores in the US, it is worth noting that this business model is shared by research cores at the EU, despite that the latter relies more heavily on various forms of external financial support from governments, private sectors, charity funds, and the EU than the former. For instance, in the UK, over 63 percent of the research income of universities was from public sources in 2013-14. In contrast, this number in the US is only around 46 percent. The gap was likely filled by internal funds provided by the US universities, which was around 20 percent of the overall academic R&D costs in 2019. See “UK Research and the European Union: The Role of the EU in Funding UK Research,” The Royal Society, December 2015: 19, https://royalsociety.org/-/media/policy/projects/eu-uk-funding/uk-membership-of-eu.pdf; Josh Trapani and Michael Gibbons, “Academic R&D in the United States,” National Science Foundation, January 15, 2020, https://ncses.nsf.gov/pubs/nsb20202/academic-r-d-in-the-united-states. ↑
- Steven Hyman, “Biology Needs More Staff Scientists,” Nature 545 (May 18, 2017): 283–84, https://doi.org/10.1038/545283a. ↑
- Robin Wilson, “Tenure, RIP: What the Vanishing Status Means for the Future of Education,” The Chronicle of Higher Education, July 4, 2010, https://www.chronicle.com/article/tenure-rip-what-the-vanishing-status-means-for-the-future-of-education/; John Warner, “Tenure Is Already Dead,” Inside Higher Ed, June 20, 2018, https://www.insidehighered.com/blogs/just-visiting/tenure-already-dead ↑