Art Museum Staff Demographic Survey 2018
Foreword
In 2014, the Andrew W. Mellon Foundation, Ithaka S+R, the Association of Art Museum Directors, and the American Alliance of Museums undertook an effort to measure the demographics of the staff of US art museums. The report, published in 2015, found that the museum population was about ten percentage points more racially and ethnically homogenous than the US population, and that in the positions of curators, educators, conservators, and museum leadership there were further barriers to entry for people of color; people holding those positions were 84 percent white non-Hispanic, four percent African American, six percent Asian, three percent Hispanic, and three percent two or more races.[1] Current census projections predict that the US population will no longer have a white majority in 2045, as multiracial, Asian, and Hispanic populations will continue to grow.[2] While the US population is growing increasingly diverse, the positions that are most directly responsible for presenting, interpreting, and caring for art objects from all the world’s cultures over time are not yet reflecting that diversity. We saw a bright spot in gender balance, as women made up a significant proportion of art museum staff, though we saw a higher proportion of male curators and museum leaders in relation to other intellectual leadership positions.
Since the 2015 study the Mellon Foundation has invested in several initiatives that can help us understand better the challenges museums face when working to diversify their staff and to make their museums more welcoming and accessible to people of color, whether they be trustees, staff members, or museum users. The foundation partnered with Ithaka S+R to conduct a series of case studies investigating the inner practices of eight art museums as they work towards realizing the values of equity, diversity and inclusion internally and with the communities they serve.[3] We continued and expanded an undergraduate curatorial fellowship program that is coordinated by the Los Angeles County Museum of Art and operates in six cities, where students of color and others dedicated to making museums more open and inclusive are exposed to curatorial and other museum functions. These undergraduate fellows are then encouraged to pursue graduate education in preparation of potential art museum careers. We also strengthened our investment in Spelman College Museum’s curatorial studies program, and have embarked on an initiative with the Ford Foundation, the Walton Foundation, and the American Alliance of Museums to work towards increasing board diversity in the sector.[4] A field-specific initiative across the country to strengthen the curatorship and conservation of Native American art is growing the pool of Native art museum specialists.
In order to gauge the extent to which progress has been made since 2015 towards increasing staff diversity in art museums, in 2018 we undertook a second iteration of the demographic survey, partnering again with AAMD, AAM and Ithaka S+R. The aggregate findings are presented in this report. We are extremely grateful to the 332 art museums that responded to the survey. It is especially helpful to have received responses from 136 institutions that had also submitted their data in 2015, allowing for direct comparisons over time for that cohort.
At a high level, the study has found some meaningful progress in the representation of people of color in a number of different museum functions, including the curatorial. We also found an increase in the number of women in museum leadership positions from 2015 to 2018. Nevertheless, the data also shows that progress has been uneven. While trends in recent hiring are encouraging, certain parts of the museum appear not as quick to change, especially the most senior leadership positions.
This second demographic survey of art museums offers a snapshot of change that is overdue, slow, but also real and welcome. These results show that diverse hiring is entirely possible, and encourage all of us to do more to realize that potential. The Mellon Foundation looks forward to continuing to work with our many partners across the field on the great task of making American art museums representative and inclusive of the rich diversity of our country, so that their collections and programs may be a significant and joyful resource for all.
— Mariët Westermann
Methodology
In 2014, Ithaka S+R partnered with The Andrew W. Mellon Foundation, the Association of Art Museum Directors (AAMD), and the American Alliance of Museums (AAM) to study the representational diversity within art museums through quantitative means. To collect this data, Ithaka S+R developed a survey instrument which was administered to directors of AAMD and AAM member art museums.
Four years later, we have administered a similar instrument to these museum directors in order to gauge the extent to which museum staff have changed demographically in recent years. The instrument was slightly expanded, affording new insights into the composition of art museum employees.[5] Many thanks to the members of our advisory committee for helping to guide these revisions:
- Christine Anagnos – Association of Art Museum Directors, Executive Director
- George Bassi – Lauren Rogers Museum of Art, Director
- Brent Benjamin – St. Louis Art Museum, Director
- Rod Bigelow – Crystal Bridges, Executive Director and Chief Diversity and Inclusion Officer
- Johnnetta Cole – The Andrew W. Mellon Foundation, Senior Consulting Fellow
- Lori Fogarty – Oakland Museum of California, Director and CEO
- Alison Gilchrest – The Andrew W. Mellon Foundation, Program Officer – Arts and Cultural Heritage
- Madeleine Grynsztejn – Museum of Contemporary Art, Chicago, Director
- Nicole Ivy – George Washington University, Assistant Professor, American Studies. Previously Director of Inclusion at the American Alliance of Museums
- Laura Lott – American Alliance of Museums, President and CEO
- Glenn Lowry – Museum of Modern Art, Director
- Joe Schenk – Art Museum of South Texas, Director
- Belinda Tate – Kalamazoo Institute of Arts, Director
- Susan Taylor – New Orleans Museum of Art, Director
- Mariët Westermann – The Andrew W. Mellon Foundation, Executive Vice President for Programs and Research
An email message inviting museum directors to participate in the study was sent in July 2018. This email was sent from Mariët Westermann in addition to, in the case of AAMD members, its executive director Christine Anagnos or, in the case of other museums AAM executive director Laura Lott. Targeted reminder messages were sent during the data collection period, which closed in September 2018.
To participate, museum directors were directed to download an Excel spreadsheet template and access associated instructions. They or their designee was asked to fill the spreadsheet with relevant data for all current employees at the museum and submit the completed spreadsheet to Ithaka S+R. Fields included the following: Job Title; Job Type; EEO Job Category; Exemption Status; Employment Type; Full Time/Part Time; Education; Race; Ethnicity; Gender; Protected Veteran Status; Disability Status; Year of Birth; Year of Hire. A single record was logged for each employee in the museum. In cases where data was unavailable or not able to be shared, Decline to State was selected. Certain variables were not used in our analysis because of inconsistent reporting, such as education, veteran status, and disability status.
We received responses from 80 percent of AAMD members, 179 out of 223 museums. Additionally, 153 AAM, non-AAMD members participated, out of a population of 648, a substantial increase in participation over the first cycle of this project. This encouraging response rate is an indication of the commitment museums have to bringing data to bear on questions of representational diversity in the field. As a result, we have recorded demographic and employment data for over 30,000 museum employees. About 27,000 of these are employed at AAMD museums, and roughly 3,000 are from (non-AAMD) AAM member museums. This is an increase of 8,000 records over what we collected in 2015.
Once the administration period had concluded, data in the spreadsheets were normalized and appended into a single text file, which was then analyzed using Tableau. The findings below analyze the data in two distinct ways. When reporting findings of 2018 demographics alone, we use all data collected in this cycle of the project (that is to say, both AAMD and AAM members). However, in some cases we compare 2015 and 2018 demographics to illustrate change over time. In these cases, we are comparing solely those 136 AAMD members that participated both in 2015 and in 2018. We chose to focus on repeat AAMD museums to control for demographic change that may have come from new museums participating in the study; all museums in this comparison group were included in the 2015 Mellon Museum Demographic report.
Key Findings
- Gender remains majority female; museum leadership positions have grown five percentage points more female in last four years.
- In curatorial roles, management positions are about 15 percentage points more male than non-management roles.
- Museum staff have become more racially and ethnically diverse over the last four years.
- Among intellectual leadership positions, education and curatorial departments have grown more diverse in terms of race/ethnicity, while conservation and museum leadership have not changed.
The demographic analysis first focuses on gender, which is being reported in a binary way because over 99 percent of the records submitted to Ithaka S+R recorded staff as male or female. The second part of the report focuses on race/ethnicity, which is reported in some cases as a binary analysis between white non-Hispanic staff (hereafter written simply as white) and people of color (hereafter written as POC). In other cases, race/ethnicity is analyzed in a way that includes each category in that variable.
The analysis also frequently refers to “intellectual leadership” positions in the museum, which include museum leadership, education, curatorial, and conservation. The purpose of analyzing this subset of staff derives from feedback from certain advisors who recognized these positions as potential pathways to directorships.[6]
Executive Summary: Gender
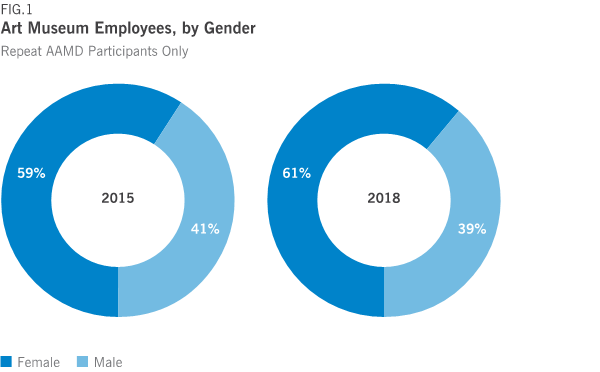
The gender composition of museum employees has hardly changed between 2015 and 2018. In 2018, museum staff were 61 percent female, 39 percent male, whereas in 2015 they were 59 percent female and 41 percent male, as shown in Figure 1.
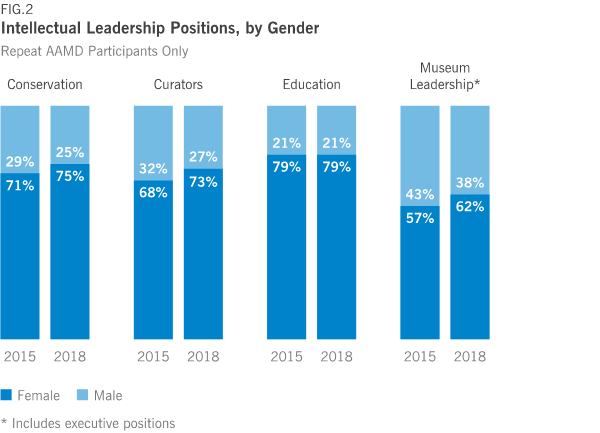
Most intellectual leadership positions became four to five percentage points more female, as illustrated in Figure 2, with education, the most female dominated of these roles and also the largest of them (more than double the number of staff recorded as curators, conservators and museum leaders, respectively), remaining stable at 79 percent female. Museum leadership positions, while still majority female, are much more male than the other intellectual leadership positions. They have become five percentage points more female since 2015. The category of “Museum Leadership” includes all executive level positions in the museum. AAMD’s analysis of the gender of their membership reveals that, out of 215 responding directors, 46 percent were female and 54 percent were male. While museums are staffed primarily by women, the most senior leadership position is still most likely to be held by men.
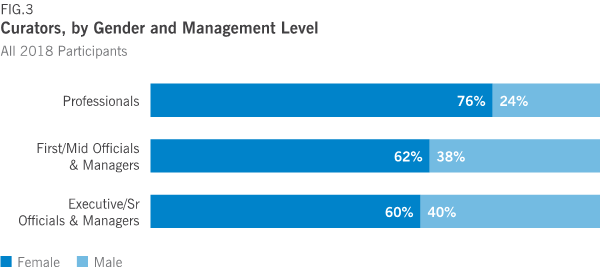
Curatorial roles among all 2018 AAM and AAMD participants in aggregate were 74 percent female. By introducing the EEO Job Category variable, we can see the gender ratios for curatorial staff categorized as “Professional,” “First/Mid Officials & Managers” and “Executive/Senior Officials & Managers.” Using these categories as a proxy for seniority and management responsibility, we can see that curatorial staff who do not have direct reports are significantly more female, over three-quarters. This category reflects more than 75 percent of the curatorial positions recorded in 2018. Curatorial positions with direct reports are fourteen to sixteen percentage points more male, as seen in Figure 3.
Education positions follow the opposite pattern. Educators categorized in the “Professionals” EEO Job Category classification are 77 percent female, in “First/Mid Officials & Managers” they are 85 percent female, and at the Executive/ Senior Officials and Managers level they are 91 percent female.
When analyzing the year of hire with respect to gender, there is a clear pattern of an increasingly female presence among staff. Over the last three years, hiring has hovered between 64 percent and 67 percent female, whereas staff hired at the museum before 2014 who are still working there as of 2018 were 57 percent female.
Executive Summary: Race/Ethnicity
Among all staff recorded for repeat participants, the population has grown more diverse by four percentage points since 2015, as shown in Figure 4.

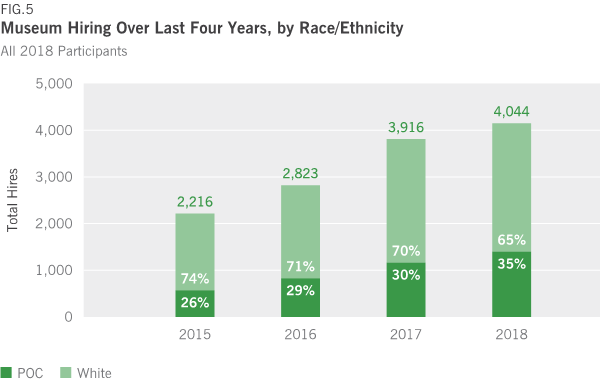
Museums in our sample hired people of color at a more rapid rate over the past four years than they did previously, as illustrated in Figure 5. Staff hired in the last four years have grown incrementally more diverse, from 26 percent to 35 percent from 2015 to 2018.
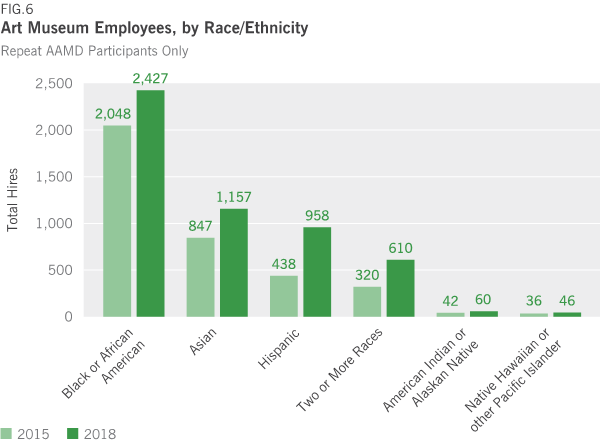
As a result of this hiring, staff at the museums in our sample have become more diverse in 2018 as compared to 2015. Figure 6 shows the growth in number of employees for each of the race/ethnicity categories from 2015 to 2018.
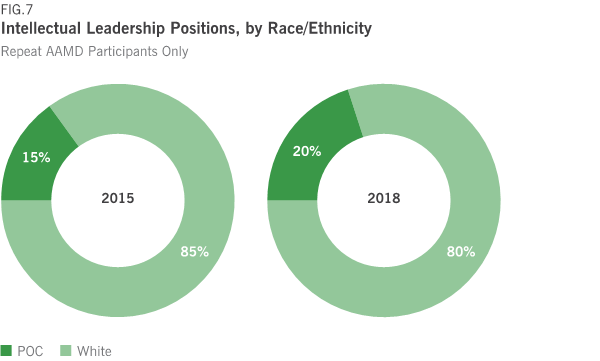
This trend was also observed in conservation, curatorial, education and museum leadership positions. As Figure 7 shows, among repeat AAMD participants, employees in these positions are five percentage points more diverse in 2018 than they were in 2015.
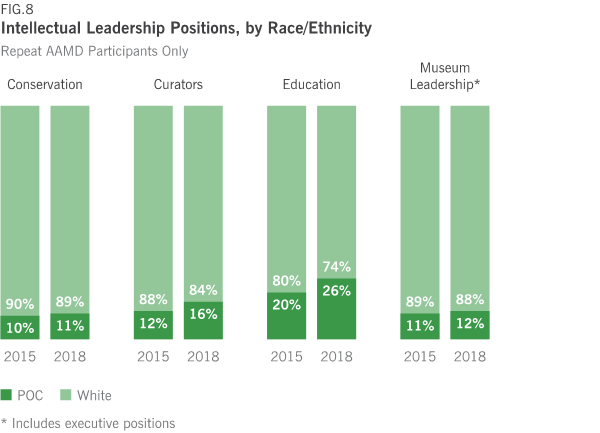
Most of this change occurred in education and curatorial departments, as seen in Figure 8. Conservation and museum leadership departments showed a comparative lack of diversification over the same period, in part because there was less new hiring and more longevity in employees of these departments. Whether it is a result of growth or turnover in curatorial and especially education departments, these departments’ more recent hiring correlates to the increased diversity in those positions.
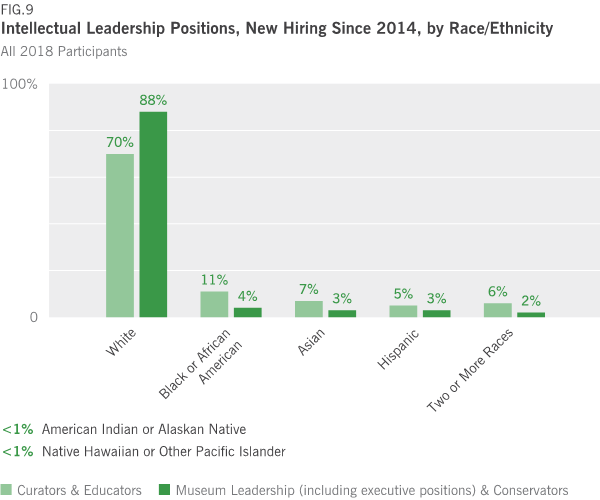
An analysis of hiring in the last four years shows that the difference between the two sets of intellectual leadership positions is not however simply explained by differences in turnover. Figure 9 illustrates that among curators and educators a notably greater share of new hires over the past four years are people of color than is the case among conservators and museum leaders. Less new hiring is thus exacerbated by less diversity in new hiring among conservators and museum leaders. Conservation and museum leadership roles are not keeping pace with education and curatorial departments towards diversifying their ranks.
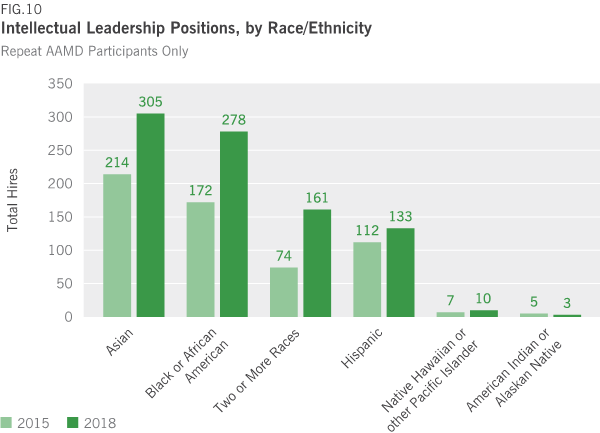
As a result of the incremental shift in hiring over the last four years, the intellectual leadership of museums in our sample added approximately 300 people of color relative to POC staff who were recorded in the 2015 survey, as seen in Figure 10. Most people of color hired into positions of intellectual leadership have been in education departments, which are quite large (constituting 12 percent of all positions recorded in 2018, as opposed to curatorial, conservation, and museum leadership, which are six percent, four percent and two percent of the sample). Education positions are now 26 percent POC. However, POC compose only 17 percent of management roles in these education departments.
When intersecting gender and race/ethnicity variables, very few men of color are in museum leadership positions in 2018. White women comprise 56 percent of museum leadership positions, white men 33 percent, POC women seven percent and POC men four percent.
Certain racial/ethnic groups made substantial gains in a number of roles in museums in our sample. African American curators in our sample doubled from 2015 to 2018. African American educators increased by one and a half times, as did educators who identify as two or more races. In retail/store positions, African American representation increased by 40 percent and Hispanic representation more than doubled.
***
The 2018 demographic survey of art museum employees reveals more detail about the presence or absence of diversity in museums than was previously available. While the overall gender composition remained static, a higher percentage of women now hold executive level positions than in 2015. Directorships remain majority male, and curatorial roles with management responsibilities are more likely to be staffed by men than those without management responsibilities.
There has been a substantial increase in hiring people of color in the last four years, particularly in curatorial and education departments. Conservation and museum leadership roles have not made this shift in hiring. We hope this report can inform strategy as leaders in the field work towards a more equitable and representative workforce.
Endnotes
- Roger C. Schonfeld, Mariët Westermann, and Liam Sweeney, “Art Museum Staff Demographic Survey,” The Andrew W. Mellon Foundation, July 28, 2015. ↑
- William H. Frey, “The US Will Become ‘Minority White’ in 2045, Census Projects,” Brookings.edu, September 10, 2018, https://www.brookings.edu/blog/the-avenue/2018/03/14/the-us-will-become-minority-white-in-2045-census-projects/. ↑
- Liam Sweeney and Roger Schonfeld, “Interrogating Institutional Practices in Equity, Diversity, and Inclusion: Lessons and Recommendations from Case Studies in Eight Art Museums,” Ithaka S+R, September 20, 2018. https://doi.org/10.18665/sr.309173. ↑
- Nicole Wallace, “$4 Million From Ford, Mellon, and Alice Walton Fund Goes to Promote Diversity on Museum Boards,” The Chronicle of Philanthropy, January 15, 2019, https://www.philanthropy.com/article/4-Million-From-Ford-Mellon/245471. ↑
- These changes included collecting variables such as Job Title, EEO Job Category, Exemption Status, Employment Type, Full Time/Part Time, Education, Protected Veteran Status, Disability Status, Year of Birth, and Year of Hire. Some but not all of these variables are used in this analysis. ↑
- We acknowledge that this is a blunt way of categorizing staff and that there are many cases where directors have different trajectories. ↑
Attribution/NonCommercial 4.0 International License. To view a copy of the license, please see http://creativecommons.org/licenses/by-nc/4.0/.