Using Data to Uncover Barriers to Student Success and Increase Retention
One of the most significant challenges that higher education institutions are currently facing is shrinking undergraduate enrollment, a trend accelerated by the disruptions of the pandemic. Among four-year institutions, enrollment declines have been particularly acute for those institutions that admit a relatively large percentage of their applicants and are dependent on tuition for a significant share of their revenue.[1] Between fall 2020 and 2022, colleges and universities that admit between 75 and 85 percent of applicants experienced an enrollment decline of 5.5 percent, while those that admit more than 85 percent experienced a 6.6 percent decline. This is in sharp contrast to highly selective four-year institutions, which saw a 3.5 percent enrollment increase over the same period.[2] Included in the enrollment declines are large numbers of students leaving college without a degree, a circumstance that is incredibly challenging for both students and institutions.
Against this backdrop, access-oriented, tuition-dependent colleges and universities are grappling with ways to enroll more new students and retain those already enrolled. An important step is to collect timely and data-driven insights on the student characteristics and behaviors associated with attrition, in order to examine the policies that might impede or support progression, and ultimately better meet the needs of students and increase student retention and graduation.
In 2022, Ithaka S+R partnered with a private not-for-profit, four-year institution undergoing an internal review of its programming, policies, and practices, to identify and remove the main barriers to retention and increase its six-year graduation rate from 60 percent to 70 percent. Ithaka S+R aimed to help the institution answer the following research questions:
- What student characteristics, actions, and behaviors are most predictive of attrition?
- Are there particular institutional programs, policies, and practices that may be playing a role?
- Given the main drivers of attrition among the student subgroups most affected, what strategies can the institution employ to address the most significant obstacles to retention and ultimately improve its retention and graduation rates?
- What key performance indicators can the institution regularly monitor to track progress?
Through a thorough and systematic analysis of de-identified undergraduates enrolled at the institution between 2014 and 2022, we uncovered several key drivers of attrition and offered recommendations for addressing them. For example, one of the largest drivers of attrition among first-year students was financial difficulty, measured by their level of unmet need—the gap between the price of college and all financial aid that does not need to be repaid. The graph below shows the share of full-time, first-year students in good academic standing who persisted through their first year grouped by the dollar amount of their unmet need.
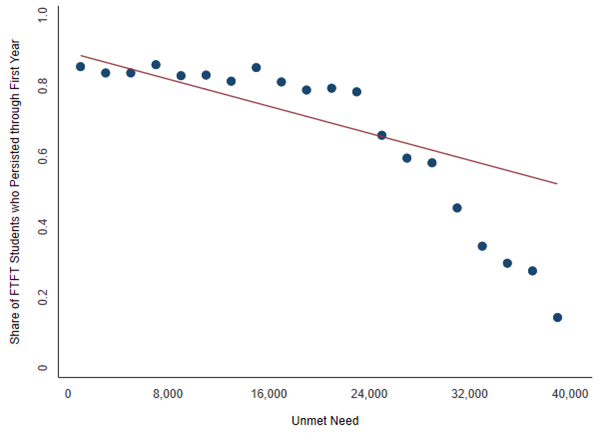
Although the relationship between unmet financial need and attrition was generally understood, this analysis revealed a previously unrecognized nuance: persistence rates began to drop once unmet need surpassed $24,000. This drop increased as unmet need increased. In fact, students with a financial gap of $24,000 or more were nearly half as likely to persist to their second year (45 percent) as students with an unmet need under $24,000 (82 percent). Discussing these findings with institutional leaders yielded important insights about potential shifts in financial aid and admission policies that could significantly lower the number of students facing a financial gap of $24,000 or more, putting more enrolled students on a solid financial footing.
The six-month engagement included several components:
- Data Collection: we identified the appropriate student data to request and developed resources to guide the institution through the data collection process.
- Analysis: we conducted descriptive, correlational, and multivariate regression analyses that revealed insightful trends and associations, produced graphs that presented changes over time, and identified critical cutoffs or inflection points in the data that were not apparent in the correlational analyses.
- Strategic Advising: we delivered several reports and presentations on the key takeaways, offered actionable recommendations, and facilitated discussions among institutional leaders with different perspectives.
We worked closely with institutional administrators and other stakeholders throughout the project to provide progress updates, collect feedback on the analyses to inform future analyses, and contextualize the findings to ensure that our recommendations were feasible, practical, and could be easily implemented. We also provided general guidance and documentation on how the institution could continue this work on a regular basis in the years ahead without us, including a set of indicators that could be used to track interim progress towards its longer-term goals of higher retention and graduation rates.
Uncovering barriers to retention and developing strategies to address them is a service that other institutions might benefit from, and Ithaka S+R is ready to help. If you’re interested in learning more, please contact daniel.rossman@ithaka.org.
Endnotes
[1] While a much larger share of private institutions are tuition-dependent, nearly 52 percent of revenue at public four-year institutions comes from tuition (as opposed to state funding). This share has steadily increased over time as a result of declines in education appropriations.
[2] For this analysis, the National Student Clearinghouse (NSC) used Barron’s 2016 selectivity index, which bases competitiveness on several admission factors. The four main categories that NSC used to group institutions are highly selective; very competitive; competitive; and less selective.