Library Acquisition Patterns
Acknowledgements
This report is the culmination of several years of work and the generosity of a number of people and organizations in both their time and their financial resources.
We are first and foremost grateful to Donald J. Waters and The Andrew W. Mellon Foundation for seeing the potential for taking a different methodological approach to these questions and for providing the funding to bring this project to life.
Our sincere thanks also goes out to Jon Blackburn, Betsy Friesen, Michael Johnson, and Amy Pemble for creating (and recreating) templates and queries, answering innumerable questions, providing instructions, and extracting data. This project would not have been possible without their support.
We also thank the individual libraries and consortia that agreed to participate in the LAP project and took the time to provide their acquisitions data. We made every effort to minimize the burdens of participating, but we recognize that it would have been impossible for this project to proceed without the agreement and, in many cases, real work of more than 150 libraries. We are deeply grateful to ITHAKA’s own Daniel Shackelford and Marlon Palha for very patiently working with us to build the database that made it possible to work with all these data.
Finally, we are grateful for the comments we have received along the way, including those from Jon Blackburn, Jon Elwell, Betsy Friesen, Steve Smith, and Michael Zeoli, which have helped guide our research in the final report.
Executive Summary
The Library Acquisition Patterns (LAP) project was undertaken with the support of The Andrew W. Mellon Foundation with the aim of examining trends in US academic libraries’ book purchasing. The project utilizes data supplied by libraries that record their acquisitions in either Ex Libris’s integrated library system, Alma, or OCLC’s WorldShare Management Services (WMS). The sample of acquisition items is limited to print and electronic books acquired on a one-time, title-by-title basis within a specified price range to mitigate the inclusion of miscategorized items. This is in contrast to information materials acquired via subscription and/or grouped together within a package, which may also be important mechanisms for acquiring book content in many academic libraries.
The findings of this report consist of two distinct areas: 1) an analysis of library book acquisitions within the specified sample for fiscal year 2017 at 124 US academic institutions, and 2) a trend line analysis of print and e-books acquired within the specified sample, the university press presence in these libraries, and the leading vendors of books at 51 US academic institutions for fiscal years 2014 through 2017. While these samples are not representative, they afford a broader overview of the acquisitions patterns and practices of US academic libraries than we believe has ever been conducted to date.
The key findings from the review of 2017 acquisitions include:
- On average, the libraries in this study spent $3.61 million in 2017 and added 4,750 print books and 345 e-books acquired on a one-time, title-by-title basis within our sample
- Ongoing resource expenditures account for three-quarters of total materials expenditures, while only a fifth go toward one-time resource expenditures
- Serials and other continuing resources, which fall under ongoing resource expenditures, account for more than 60 percent of total materials expenditures; books, many of which are one-time resource expenditures, constitute 24.5 percent of materials expenditures
- Libraries spend 42.6 percent of their print book budgets on humanities titles. Forty-nine percent of books added by libraries to their collections were in the humanities
- Social science titles accounted for 32 percent of both the total e-book expenditures and the number of e-books obtained, making this field the largest for e-book acquisitions
- University presses held 23.6 percent of the print book market and 18.5 percent of the e-book market. Oxford and Cambridge unsurprisingly made up the largest share of the university press market
- GOBI Library Solutions is the dominant vendor of both print and e-books within our sample. Amazon is the second largest print book vendor but trails by a wide margin, and has no meaningful presence in the e-book market
- The majority of university press book acquisitions are made through GOBI and Amazon
The key findings for the 2014 to 2017 trend line analysis include:
- Library material expenditures increased in real terms, with more than 70 percent of expenditures going toward ongoing resources and between 16 and 21 percent going toward one-time resources
- Expenditures made for print books obtained on a one-time, title-by-title basis decreased year to year, while e-book expenditures obtained in the same way experienced a net increase; however, within this sample of books, expenditures for these e-books were not increasing enough to offset the drop in spending on print books
- The average cost of an e-book in our sample rose by 35 percent between 2014 and 2017, while the cost of print books remained stable
- Print book expenditures in each disciplinary field declined, with humanities titles seeing the smallest drop and STEM the highest
- The social sciences accounted for the highest expenditures in any field for e-books, and e-book expenditures in the social sciences and humanities increased
- All degree-granting institutional types experienced a decline in their average print book expenditures, but have more varied spending on e-books. Only master’s degree-granting institutions saw a decline in e-book expenditures
- One-time expenditures for university press print books fell by 17.7 percent between 2014 and 2017. However, the proportion of university press titles being acquired compared to commercial press titles has remained relatively stable, with the former accounting for approximately 20 percent of one-time print book expenditures across all four years
- While expenditures for university press e-books saw wide fluctuations from year to year, there was effectively no net change in spending
- GOBI and Amazon were the leading vendors of print books in our sample, but libraries acquired print books from a variety of specialized vendors to meet their collection needs. GOBI was the leading vendor of e-books
Introduction
Academic books have traditionally been an integral part of scholarship; they are often written by scholars as a tenure requirement and published by a university press (UP). As such, the academic library would seem to be a natural home for these books, where they could be used by students and other scholars in the pursuit of advancing knowledge. However, speculation surrounds the extent to which libraries contribute to university press sales. Rick Anderson has even noted that there is “a commonplace assertion that, contrary to longstanding belief, libraries are not in fact the primary customers of university presses.” In Anderson and Dean Blobaum’s analysis of the University of Chicago Press, they found that only 22.34 percent of the press’s 2012 book sales were to academic libraries, based on WorldCat holdings. These findings align with a commonly-held view that academic libraries account for 20-25 percent of university press sales.[1]
Still, libraries constitute an important, if not the only, market for monographs published by UPs. But as more students and scholars gravitate toward STEM and social science disciplines, publishers in the US and UK are concerned that the number of individuals in traditionally book-oriented fields like the humanities will shrink, driving down demand for these books.[2] University presses and other organizations associated with publishing have already sounded the alarm about their declining sales—in 2016, Inside Higher Ed described the University of Michigan Press’s core business of print book sales as “crumbling away,”[3] while a 2017 study conducted by the Arts and Humanities Research Council and the British Library showed that retail sales of academic books in the UK dropped by 13 percent from 2005 to 2014.[4] ARL metrics similarly indicate that up to 2015, their most recent year for data, ongoing resource expenditures have skyrocketed amid an increase in average library materials expenditures, even as expenditures for one-time resources like academic books have been in decline since 2012. [5]
Part of this decline has been attributed to libraries’ decreasing print book expenditures for university press titles, measured as a function of sales through traditional wholesale vendors like GOBI Library Solutions or Baker & Taylor.[6] However, a growing body of evidence suggests that “[Amazon] is now by far the world’s most important retailer of academic books of all kinds,”[7] including sales to not just students, scholars, and the general public, but to libraries as well. Given Amazon’s purportedly prominent role in the book-selling business, is it possible that libraries might not actually be obtaining fewer books published by university presses, so much as their acquisitions are not being tracked because they are being made through Amazon instead?
This was the guiding question behind the Library Acquisition Patterns (LAP) project as originally voiced by Joseph Esposito in 2014. Ithaka S+R, with support from The Andrew W. Mellon Foundation, piloted a data collection methodology that assessed university press and vendor sales through libraries’ own acquisitions data as entered into Ex Libris’ integrated library system (ILS), Alma.[8] Ithaka S+R then expanded the project to include acquisitions data from OCLC’s WorldShare Management Services (WMS), as well as to examine broader trends within libraries’ acquisitions:
- What share of libraries’ total materials expenditures go toward ongoing and one-time resources?
- How have expenditures for print and e-books changed over time?
- How are different disciplinary areas performing?
- Who are the largest university presses and vendors by share of expenditure?
In the following report, we first discuss the methodology used to build our database and conduct the analysis, before turning to the findings and discussion of the results. The findings section is divided into two separate sections: 1) an examination of book acquisitions at 124 academic libraries for fiscal year 2017; and 2) a trend line analysis of book acquisitions and the leading university presses and vendors at the same 51 academic libraries from fiscal years 2014 to 2017. The report closes with a summary of key results, what this means for libraries, and future areas of study to pursue.
Methodology
Building the Infrastructure
After the original question was posed by Joseph Esposito as to the extent that academic libraries were buying books through Amazon, Roger Schonfeld and Liam Sweeney developed a strategy to obtain acquisitions data by going through integrated library systems (ILS). They believed this method would ideally afford a level of data standardization across different academic institutions that use the same system to organize their acquisitions. In the first stage of the project, Ithaka S+R conducted a pilot in 2016 using data from four institutions that use Ex Libris’s ILS, Alma. Working with members of the Alma Product Working Group (PWG), Ithaka S+R created a query that would allow participating institutions to easily extract their library’s acquisitions for the given years based on a standardized report template. The results of the pilot showed that Alma was a viable source of acquisitions data, and one that could be scaled to include a greater number of academic libraries.[9]
The second stage of the Library Acquisition Patterns (LAP) project commenced in 2017 with additional support from The Andrew W. Mellon Foundation and incorporated data not only from Alma but from OCLC’s ILS, WorldShare Management Services (WMS). These two systems to do not permit users to create their own customized fields of data, making Alma and WMS ideal for our study among the available integrated library systems because of the standardized information its users record. To be eligible for participation in the study, academic libraries needed to meet the following criteria: 1) operate at a higher education institution with an emphasis on granting baccalaureate, masters, or doctoral-level degrees in the United States; and 2) record their library acquisitions in either Alma or WMS. Roughly 400 US academic institutions met these criteria according to information gathered at Library Technology Guides (see Table 1),[10] and of these, 154 institutions agreed to participate in and supplied data to the LAP project.
Table 1. ILS breakdown by institutional type
| Institutional type | Total US Institutions | Alma users | WMS users | Percent using Alma & WMS |
|---|---|---|---|---|
| Baccalaureate – general | 296 | 21 | 53 | 25% |
| Baccalaureate – liberal arts | 216 | 22 | 51 | 34% |
| Masters I | 482 | 136 | 61 | 41% |
| Masters II | 104 | 16 | 21 | 36% |
| Doctoral – Intensive | 106 | 19 | 7 | 25% |
| Doctoral – Extensive | 152 | 59 | 6 | 43% |
| Total | 1,204 | 214 | 193 | 34% |
Working off the template established by the Alma Product Working Group, Ex Libris’s and OCLC’s product teams provided updated report templates, and in the case of the latter, extracted WMS libraries’ acquisitions data with their permission in lieu of each library performing the extraction individually. We asked for institutions to provide data on all information materials acquired for as many years as they had data between fiscal years 2013 to 2018. While both WMS and Alma have a pre-existing set of values that librarians must use to populate fields in each system, the two systems do not match each other in many instances, warranting a significant degree of normalization across data from both systems. Ithaka S+R with the help of ITHAKA’s data engineering team built a database to perform the normalization process and house the data. The database additionally included data on institutional characteristics as recorded at the Integrated Postsecondary Education Data System (IPEDS).[11]
For the purpose of this analysis, fiscal years were coded as the year when the fiscal period ends, as start and end dates vary by institution.[12] Disciplines associated with each record in the database were captured in Alma using Library of Congress classifications, while disciplines were captured in WMS using both the Library of Congress classification system as well as the Dewey Decimal system. As each institution’s acquisitions data was imported into the LAP database, disciplines were translated from both classification systems using their main letter or numeric classes.[13]
Publisher information was standardized using ISBN information provided for each record. This information was then linked to a universal ISBN dataset with each ISBN’s affiliated publisher and translated into the LAP database upon import. Special attention was paid to identifying members of the Association of University Presses (AUP)[14] and their ISBN and ISBN prefix information using the International ISBN Agency’s Global Register of Publishers.[15]
Final Dataset and Analysis
The final datasets in the analysis include 124 institutions that provided data for fiscal year 2017 and 51 institutions that were able to provide continuous data from 2014 to 2017. This reflects the choice that many libraries have been making not to import very much, if any, of their historical acquisitions information into new library systems as they migrate. Institutions with fewer than 30 total acquisitions for a given year were not included in the dataset, nor were consortia that grouped data from various institutions together with no means to delineate between acquisitions made by different institutions. The breakdown by degree-granting institutional type is included in Table 2, with more granular categories within each Carnegie class collapsed into the three broad categories seen below.
Table 2. Library sample breakdown by institutional type
| Institutional Type | Library Acquisition Patterns: 2017 Overview | Trend Line Analysis: 2014 to 2017 |
|---|---|---|
| Baccalaureate | 38 | 8 |
| Master’s | 42 | 14 |
| Doctoral | 44 | 29 |
| Total | 124 | 51 |
Records showing zero or negative quantities of an acquired title were removed. Titles showing negative costs associated with them were likewise removed, although in this case titles that cost $0 remained in the dataset as some acquisitions were given as gifts or donations. All acquisitions acquired as standing orders were assigned to a subscription acquisition type, essentially identifying them as ongoing resource expenditures. This is in keeping with instructions provided by the Association of College & Research Libraries (ACRL) for its annual survey, which states that “[a] standing order is an ongoing commitment as opposed to a one-time purchase because if the library cancels the standing order it would no longer receive the content.”[16]
Broader disciplinary fields were constructed from the disciplines in the LAP database to facilitate analysis. As seen in Table 3, disciplines were reassigned into the fields Arts, Humanities, Law, Medicine, Social Sciences, STEM, Other, and Unknown. These fields draw from other Ithaka S+R reports for guidance on collapsing individual disciplines into broader fields.[17]
Table 3. Mapping discipline to field
| Field | Discipline |
|---|---|
| Arts | Fine Arts Music |
| Humanities | American History Auxiliary Sciences History of the Americas Language and Literature Philosophy (includes Psychology and Religion) World History |
| Law | Law |
| Medicine | Medicine |
| Social Sciences | Education Geography (includes Anthropology) Political Science Social Sciences |
| STEM | Agriculture Science Technology |
| Other | General Library Science Military Science Naval Science |
| Unknown | (No Library of Congress or Dewey Decimal classification system provided by academic institution) |
Various subsets were created to identify different resource and material types based on categories provided by the integrated library systems, in order to determine their proportional share of libraries’ material expenditures. WMS allows librarians to categorize their acquired materials according to one field, while Alma utilizes two fields for categorization. While the latter allows for greater granularity, it also introduces a greater level of miscategorization into the data that required significant reassignment of materials.
Subsets were created with the aim of narrowing the focus of this analysis to one-time, title-by-title acquisitions of academic books (in contrast to ongoing expenditures that require a subscription and/or book packages). To limit our analysis to these items, we set parameters on expenditure amounts to exclude items miscategorized as books and to remove books with exorbitant price tags that would have skewed our results. These parameters, drawn from data compiled by the Library Materials Price Index (LMPI) Editorial Board of ALA’s Association for Library Collections and Technical Services’ (ALCTS) Publications Committee, take the average cost of North American academic books by discipline and by format from 2013 to 2017 and allow for the maximum cost of a book to be roughly three times the average.[18] In this way, print books are limited at $215 and e-books at $350. Our sample includes monographs, which are often viewed as “books which are written by scholars and researchers and which are intended primarily for other scholars and researchers.”[19] Because the Alma and WMS systems do not delineate between monographs and other types of books, our sample also includes items like textbooks, handbooks, guidebooks, trade books, and other books with prices that fall within our parameters. Print books can include new, used, paperback, and hardcover versions.
We use the following definitions throughout this report:
- Print books: Monographs and other books in physical format that were obtained on a one-time, title-by-title basis with an expenditure less than or equal to $215. Throughout the report these items will be referred to as “print books.”
- E-books: Monographs and other books in digital format that were obtained on a one-time, title-by-title basis with an expenditure less than or equal to $350. Throughout the report these items will be referred to as “e-books” or “electronic books.”
- One-time resource expenditure: Total materials expenditure associated with any acquisition obtained on a one-time basis.
- Ongoing resource expenditure: Total materials expenditure associated with any acquisition obtained on a subscription basis.
- Title: The name of an acquisition as listed in the ILS. More than one copy of a title can be acquired (see “volume”). A title can refer to an individual item such as a book, video, or sound recording. A title can also refer to a package that contains any number of books or other materials within itself.
- Volume: The total number of copies acquired of a particular title.
Limitations
The acquisitions data we received was, in a word, messy. Alma and WMS integrated library systems have pre-set values that librarians can select from when entering their acquisitions data, allowing for some level of standardization in data input across each ILS’s users. However, librarians still have leeway to categorize their acquisitions in idiosyncratic ways, which may work for an individual institution’s needs but which present significant difficulties in a cross-institutional analysis because of the inconsistent categorization of the same materials. We reassigned acquisitions to our own subsets in order to assess different material types’ share of expenditures, but because these subsets are drawn from the existing categorizations, they include acquisitions that are miscategorized.
Alma and WMS list packages of books as one item, masking the potentially substantial number of individual titles within each package, and furthermore does not distinguish between packages and individual acquisitions. Our pricing parameters exclude these packages, which tend to cost thousands of dollars, but we consequently have to exclude the books in these packages from our analysis. Additionally, e-books can cost upwards of $350 depending on the licenses associated with them, and while our breakdown of different book acquisitions in the coming sections alludes to the presence of these electronic items, we do not explore this subset in this analysis.
When it comes to disciplines, the process of translating Library of Congress and Dewey Decimal classification systems into the LAP database based on their main letter or numeric class means that the granularity provided by sub-classes was subsumed into larger categories. Additionally, some institutions included their law and health science libraries within their data, while other institutions view these libraries as administratively separate from their main libraries and did not include them with their data. Law and medicine have been pulled into their own disciplinary fields to help account for this, but it is possible that the inconsistent inclusion of acquisitions in these fields could skew results.
Books are sold from a variety of places at a variety of prices. For instance, Alibris is one of the top vendors of print books, but as a secondhand book vendor their prices are likely lower than other vendors. Similarly, if individual institutions tend to favor some vendors over others, this could skew results toward those vendors. Some libraries also listed some of their acquisitions’ vendors as credit card payments or institution-specific payments, effectively removing acquisitions associated with these from being included in calculations to assess leading book vendors. Libraries entered vendor names into their integrated library systems idiosyncratically. Vendor names therefore had to be manually standardized, and while great care was given to finding every possible variant of a given vendor within the LAP database, it is possible that some were overlooked or mislabeled. Vendors not only provide content by selling it to libraries, but also distribute their content through other vendors’ platforms, just as vendors will distribute others’ content through their own platforms. This can obscure expenditure data on vendors by introducing ambiguity into who received payment for a given item.
While Alma and WMS advise that items obtained through DDA only be entered as acquisitions once they have been invoiced, it is possible that these items can reside in a library’s catalog before their acquisition has been triggered, making them appear as though the library has made an expenditure for them. Our ILS data does not allow us to delineate between DDA records and records acquired through other means, making it impossible to understand to what extent they reside in the acquisitions data.
Findings
Library Acquisition Patterns in 2017
Information Materials by Share of Expenditure
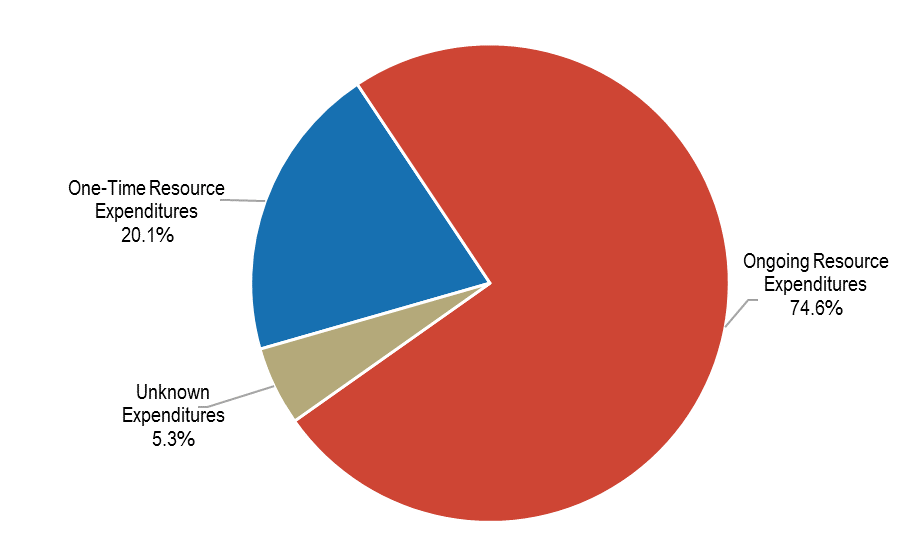
For fiscal year 2017, 124 academic institutions provided data on their library acquisitions. These institutions aggregately spent approximately $448 million on information materials and added 857,829 titles to their collections. On average, institutions spent $3.61 million on information materials and added 7,136 titles to their collections. At 74.6 percent, nearly three-quarters of libraries’ expenditures on information materials were for ongoing expenses, including but not limited to journals, while 20.1 percent were for items obtained on a one-time basis (see Figure 1).
Figure 1. Percentage share of resource expenditures by acquisition type
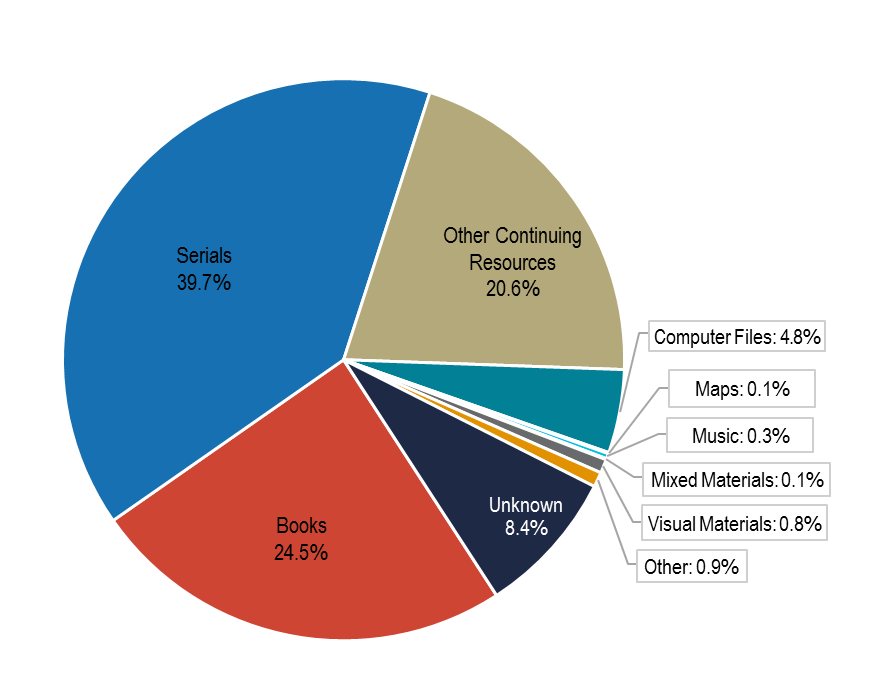
By material type, serials and other continuing resources accounted for a combined 60.3 percent of expenditures, while books accounted for 24.5 percent. As Figure 2 shows, libraries, to a much lesser degree, also acquired a range of materials beyond books, serials, and ongoing resources.
Figure 2. Percentage share of resource expenditures by material type
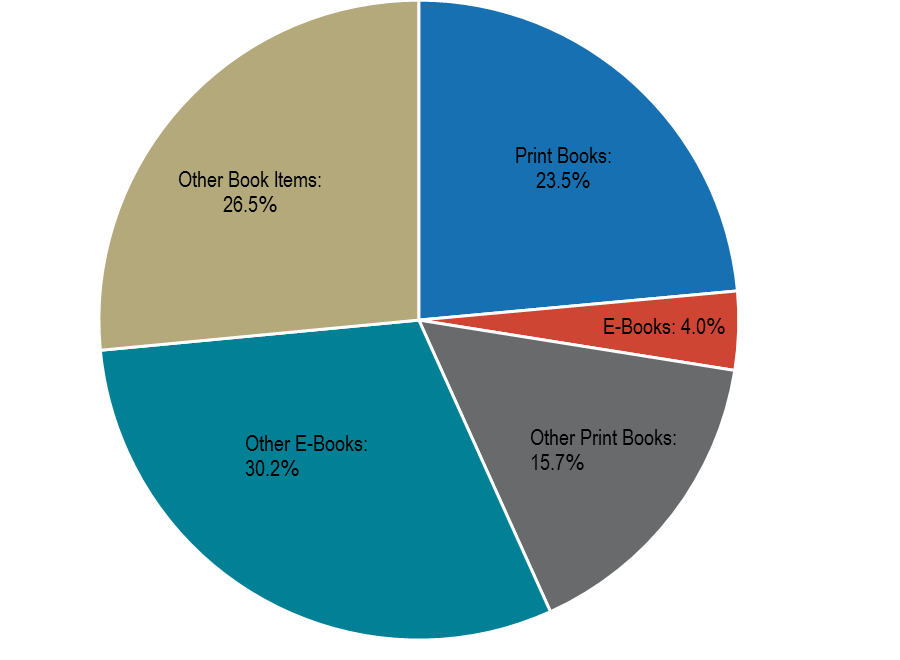
At 24.5 percent of total material expenditures in FY2017, books come in several combinations of material formats and acquisition types. These items can be acquired in print or electronic format, or even as another material type altogether, such as an audiobook; they can be acquired on a one-time or ongoing basis, including via subscription; and by individual title or as part of a package deal. This analysis will primarily focus on what we will refer to as print and electronic books. We define these as items obtained on a one-time, title-by-title basis and falling below $215 for print books and $350 for e-books.
As seen in Figure 3, which describes the different types of books found in libraries’ acquisitions data, print books account for 23.5 percent and e-books 4 percent of total book expenditures. Out of total material expenditures, these print book acquisitions account for only 5.8 percent of libraries’ spending and e-books 1 percent. On average, the libraries in our sample spent $208,147 to obtain 4,748 print books and $35,107 to obtain 345 e-books.
Figure 3. Breakdown by book type[20]
Institutional Types
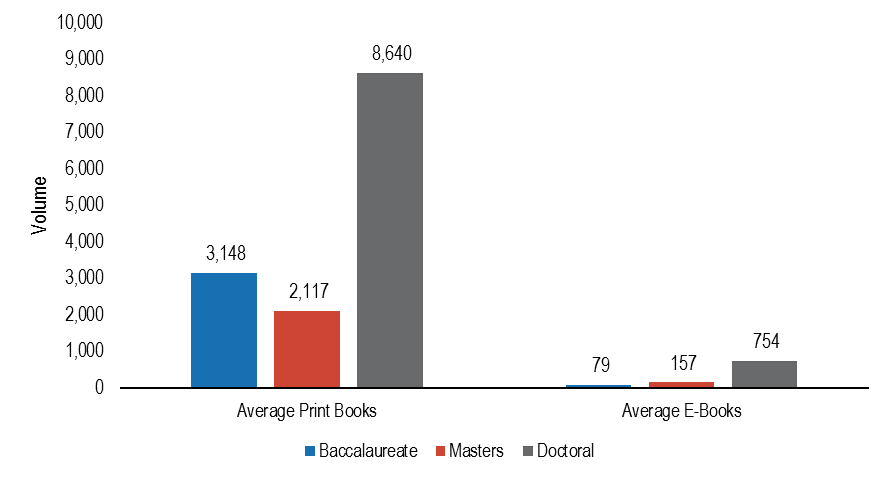
When examined by institutional type, doctoral institutions added the highest volume of books to their collections in 2017 with an average of 8,640 print books and 754 e-books acquired on a one-time, title-by-title basis that excludes packages. Doctoral degree-granting institutions on average acquired roughly three times as many print books and nearly ten times as many e-books as baccalaureate degree-granting institutions, and between four to five times as many print and e-books as master’s degree-granting institutions (see Figure 4).
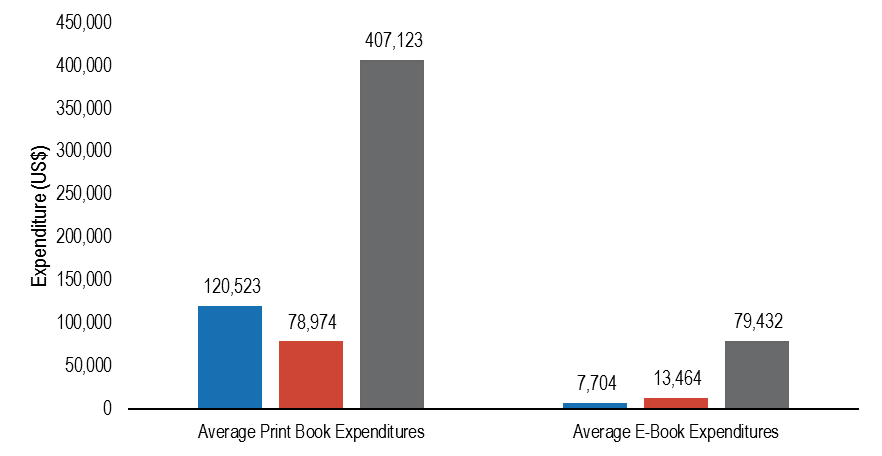
Figure 4. Average number of books acquired by institutional type in FY2017
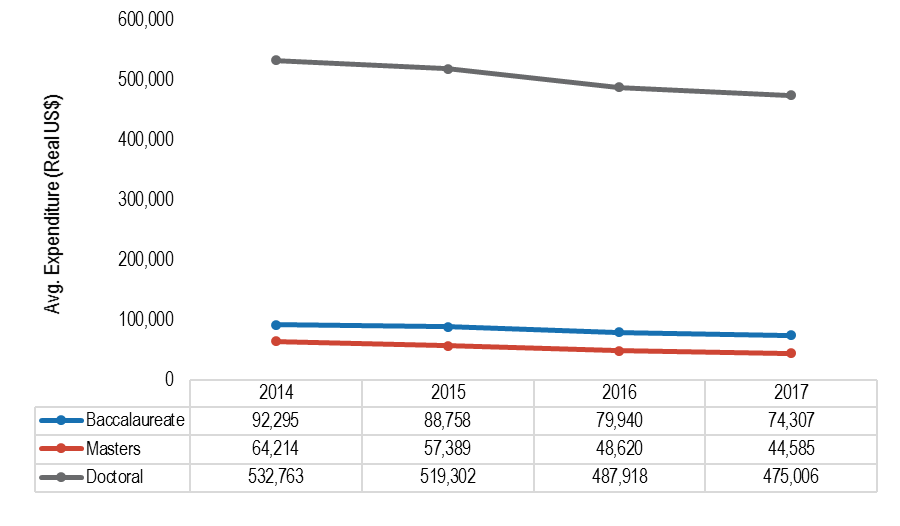
Doctoral institutions had commensurately higher expenditures for print and e-books as well. Average print book expenditures were 3.4 times higher than at baccalaureate degree-granting institutions and 5.2 times higher than at master’s degree-granting institutions. Average e-book expenditures were 10.3 times higher at baccalaureate degree-granting institutions but only 5.9 times higher than at master’s degree-granting institutions (see Figure 5).
Figure 5. Average expenditure by institutional type in FY2017
University presses and vendors
University press titles constituted 23.6 percent of print book expenditures and 18.5 percent of e-book expenditures. With both material formats combined, university presses held 22.9 percent of the academic book market, in contrast to the 77.1 percent held by commercial presses. Oxford and Cambridge had the greatest share of university press expenditures. Oxford’s publications hold a quarter of the university press print book market and 6 percent of the total print book market, while Cambridge holds 18.3 percent and 4.3 percent, respectively. For e-book expenditures, this is reversed. Cambridge leads with 27 percent of the UP e-book market and accounts for 5 percent of the total e-book market, whereas Oxford trails with 15.7 percent of the UP market for e-books and only holds 2.9 percent of the total e-book market (see Table 4).
Table 4. Top 10 university presses FY2017
| Print Books | |||
|---|---|---|---|
| University Press | Sales (US$) | UP Print Books (%) | Total Print Books (%) |
| Oxford | 1,539,611 | 25.3% | 6.0% |
| Cambridge | 1,117,564 | 18.3% | 4.3% |
| Yale | 264,620 | 4.3% | 1.0% |
| Princeton | 222,056 | 3.6% | 0.9% |
| Harvard | 162,172 | 2.7% | 0.6% |
| Columbia | 156,857 | 2.6% | 0.6% |
| University of California | 137,526 | 2.3% | 0.5% |
| Manchester | 122,912 | 2.0% | 0.5% |
| University of Chicago | 117,708 | 1.9% | 0.5% |
| State University of New York | 107,543 | 1.8% | 0.4% |
| Total UP Print Book Sales | 6,093,824 | 23.6% | |
| Total Print Book Sales | 25,810,243 | ||
| E-Books | |||
| University Press | Sales (US$) | UP E-Books (%) | Total E-Books (%) |
| Cambridge | 217,904 | 27.0% | 5.0% |
| Oxford | 127,127 | 15.7% | 2.9% |
| Duke | 44,082 | 5.5% | 1.0% |
| New York University | 40,853 | 5.1% | 0.9% |
| University of California | 39,557 | 4.9% | 0.9% |
| Princeton | 38,930 | 4.8% | 0.9% |
| Yale | 19,455 | 2.4% | 0.4% |
| University of Chicago | 16,036 | 2.0% | 0.4% |
| Columbia | 15,450 | 1.9% | 0.4% |
| State University of New York | 14,370 | 1.8% | 0.3% |
| Total UP E-Book Sales | 807,167 | 18.5% | |
| Total E-Book Sales | 4,353,256 | ||
However, print and e-books obtained on a one-time, title-by-title basis are not the only publications that libraries acquire from university presses. Print books continue to be acquired at a higher rate than e-books, as shown in Table 5 where the percentage share of print books out of total press sales is greater than it is for e-books at each of the leading university presses. But while books—particularly print books—constitute the majority of some presses’ sales to libraries, at other presses like the University of Chicago, Oxford, Cambridge, and Duke, they are only a small share of the materials that the libraries in our sample are buying from these presses.
Table 5. Percentage share of print and e-book expenditures out of total UP expenditures by press
| University Press | Total Press Sales ($) | Print Books | E-Books | P & E-Books |
|---|---|---|---|---|
| Oxford | 4,477,106 | 34.4% | 2.8% | 37.2% |
| Cambridge | 3,031,738 | 36.9% | 7.2% | 44.0% |
| University of Chicago | 480,161 | 24.5% | 3.4% | 27.9% |
| Princeton | 330,324 | 67.2% | 11.8% | 79.0% |
| Duke | 329,846 | 25.7% | 13.4% | 39.0% |
| Yale | 317,829 | 83.3% | 6.1% | 89.4% |
| University of California | 311,804 | 44.1% | 12.7% | 56.8% |
| Harvard | 206,744 | 78.4% | 6.4% | 84.8% |
| Columbia | 189,027 | 83.0% | 8.2% | 91.2% |
| New York University | 146,582 | 61.6% | 27.9% | 89.5% |
| Manchester | 136,023 | 90.4% | 3.0% | 93.4% |
| State University of New York | 123,665 | 87.0% | 11.6% | 98.6% |
GOBI Library Solutions accounts for 68.7 percent of print book sales and 86.4 percent of e-book sales in our sample. Amazon is the second largest vendor of print books to academic libraries, but trails by a wide margin with only 11 percent of sales. Amazon is not a large vendor of e-books as other well-known vendors like ProQuest/Coutts, JSTOR, Taylor & Francis, and Gale-Cengage take the top spots in e-book distribution after GOBI (see Table 6).[21]
Table 6. Top vendors FY2017
| Print Books | ||
|---|---|---|
| Vendor | Sales (US$) | Total Print Books (%) |
| GOBI Library Solutions | 17,723,709 | 68.7% |
| Amazon | 2,825,396 | 10.9% |
| ProQuest/Coutts | 648,416 | 2.5% |
| Midwest Library Service | 528,330 | 2.0% |
| Harrassowitz | 347,360 | 1.3% |
| Eastern Book Company | 260,995 | 1.0% |
| Ingram | 222,749 | 0.9% |
| Amalivre | 215,646 | 0.8% |
| Casalini Libri | 205,213 | 0.8% |
| Emery-Pratt Company | 185,872 | 0.7% |
| Total Print Book Sales | 25,810,243 | |
| E-Books | ||
| Vendor | Sales (US$) | Total E-Books (%) |
| GOBI Library Solutions | 3,762,635 | 86.4% |
| ProQuest/Coutts | 300,782 | 6.9% |
| JSTOR | 53,001 | 1.2% |
| Taylor & Francis | 46,099 | 1.1% |
| Gale-Cengage | 37,731 | 0.9% |
| Rittenhouse | 24,430 | 0.6% |
| Matthews Book Company | 23,372 | 0.5% |
| Credo Reference | 20,083 | 0.5% |
| Cambridge University Press | 16,497 | 0.4% |
| Ebrary | 10,102 | 0.2% |
| Total E-Book Sales | 4,353,256 | |
The majority of print books published by university presses and acquired by academic libraries in this sample are sold and distributed through GOBI and Amazon. The former accounts for, on average, 74.2 percent of university press print book sales, while the latter accounts for an average of 11.7 percent. Together, these two vendors sell and distribute between 76 percent and 95 percent of the university press titles purchased by academic libraries. When it comes to e-books, GOBI remains the lead vendor with a minimum market share of 80 percent of the acquired titles published by leading university presses. Only a handful of other vendors compete for these titles’ distribution, with ProQuest/Coutts and JSTOR holding between roughly 3 to 15 percent (see Table 7).
Table 7. Top 10 university presses by top vendor FY 2017
| Print Books | |||||
|---|---|---|---|---|---|
| University Press | Primary Vendor | Market Share (%) | Secondary Vendor | Market Share (%) | |
| Oxford | GOBI Library Solutions | 78.1% | Amazon | 10.6% | |
| Cambridge | GOBI Library Solutions | 79.5% | Amazon | 9.2% | |
| Yale | GOBI Library Solutions | 71.4% | Amazon | 12.9% | |
| Princeton | GOBI Library Solutions | 69.5% | Amazon | 13.8% | |
| Harvard | GOBI Library Solutions | 68.3% | Amazon | 14.0% | |
| Columbia | GOBI Library Solutions | 70.8% | Amazon | 12.1% | |
| University of California | GOBI Library Solutions | 70.7% | Amazon | 13.1% | |
| Manchester | GOBI Library Solutions | 90.2% | Amazon | 4.8% | |
| University of Chicago | GOBI Library Solutions | 55.6% | Amazon | 20.5% | |
| State University of New York | GOBI Library Solutions | 87.6% | Amazon | 6.0% | |
| Average | 74.2% | 11.7% | |||
| E-Books | |||||
| University Press | Primary Vendor | Market Share (%) | Secondary Vendor | Market Share (%) | |
| Cambridge | GOBI Library Solutions | 87.3% | Cambridge | 7.5% | |
| Oxford | GOBI Library Solutions | 89.2% | ProQuest/Coutts | 7.8% | |
| Duke | GOBI Library Solutions | 92.4% | ProQuest/Coutts | 7.3% | |
| New York University | GOBI Library Solutions | 79.9% | JSTOR | 15.2% | |
| University of California | GOBI Library Solutions | 92.8% | JSTOR | 3.2% | |
| Princeton | GOBI Library Solutions | 81.6% | JSTOR | 10.3% | |
| Yale | GOBI Library Solutions | 89.5% | JSTOR | 6.1% | |
| University of Chicago | GOBI Library Solutions | 84.8% | ProQuest/Coutts | 14.3% | |
| Columbia | GOBI Library Solutions | 84.5% | JSTOR | 10.0% | |
| State University of New York | GOBI Library Solutions | 90.8% | ProQuest/Coutts | 9.2% | |
| Average | 87.3% | 9.1% | |||
Disciplinary Field
The humanities were the primary field in which libraries acquired print books: 49.1 percent of the print books (42.6 percent of print book expenditures) added on a title-by-title basis in fiscal year 2017 were in the humanities. The social sciences followed with 22.3 percent of print book acquisitions and 23.4 percent of print book expenditures. Perhaps owing to humanists’ preference to read long-form materials physically, electronic humanities titles only constituted 21.1 percent of e-books added in FY2017, coming in below the social sciences which accounted for 31.7 percent of e-book acquisitions but 32.1 percent of expenditures. Another factor is the availability of titles in digital format, as different disciplines within the humanities are offered electronically more so than others. For instance, literature has a lower availability rate than philosophy or history titles. The number of electronic books with no associated discipline is relatively high at 22.7 percent, suggesting that e-books obtained on an individual basis lack the same metadata that is regularly provided with print book acquisitions. Additionally, significant differences exist between the cost of a print book and an e-book: the average cost of an e-book is often more than double that of a print book. This is due to pricing models and licenses that differ from their print counterparts as they take into account how many individuals can have access to an electronic item (see Table 8).
Table 8. Print and e-books by discipline FY2017
| Print Books | |||
|---|---|---|---|
| Discipline | Expenditure Share (%) | Volume Share (%) | Average Cost/Item (US$) |
| Arts | 8.5% | 7.6% | 49.10 |
| Humanities | 42.6% | 49.1% | 38.03 |
| Law | 4.7% | 3.0% | 67.72 |
| Medicine | 3.2% | 2.6% | 54.80 |
| Other | 1.7% | 1.6% | 46.62 |
| Social Sciences | 23.4% | 22.3% | 45.90 |
| STEM | 12.6% | 9.6% | 57.63 |
| Unknown | 3.4% | 4.2% | 35.04 |
| Totals | $25,810,243 | 588,724 | |
| E-Books | |||
| Discipline | Expenditure Share (%) | Volume Share (%) | Average Cost/Item (US$) |
| Arts | 2.3% | 2.3% | 104.77 |
| Humanities | 20.6% | 21.1% | 99.37 |
| Law | 2.3% | 2.0% | 115.87 |
| Medicine | 6.9% | 6.1% | 115.01 |
| Other | 1.3% | 1.3% | 101.87 |
| Social Sciences | 32.1% | 31.7% | 103.12 |
| STEM | 15.4% | 12.8% | 122.12 |
| Unknown | 19.1% | 22.7% | 85.60 |
| Totals | $ 4,353,256 | 42,765 | |
Trend Line Analysis: 2014 to 2017
One-Time and Ongoing Resources
Total material expenditures increased by 8.2 percent in real terms from fiscal years 2014 to 2017 (see Figure 7).[22] As a subset of information materials, expenditures for one-time resources and ongoing resources likewise increased; aggregately, participating libraries saw an increase in spending of $16.2 million on the former and $14.1 million on the latter (see Figure 2.2). For one-time resource expenditures, there is a distinct increase in expenditures in fiscal year 2015, before spending drops the following year. This trend does not occur with ongoing resource expenditures, but it has enough of an effect to manifest the same pattern in spending when considering total material expenditures.
Figure 7. Total material expenditures 2014-2017
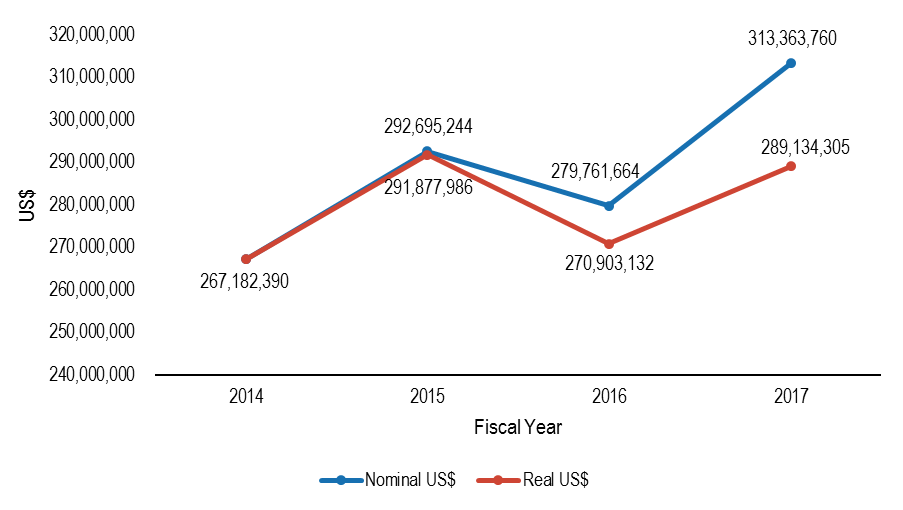
Figure 8. One-time vs. ongoing resource expenditures 2014-2017
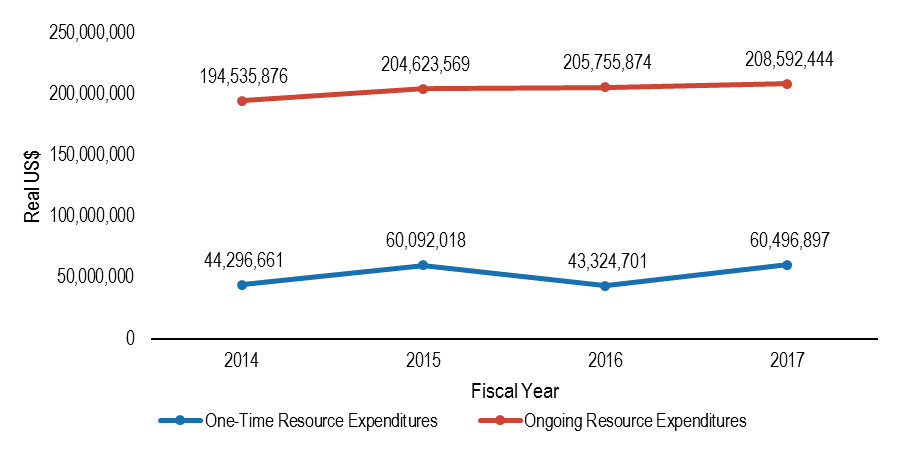
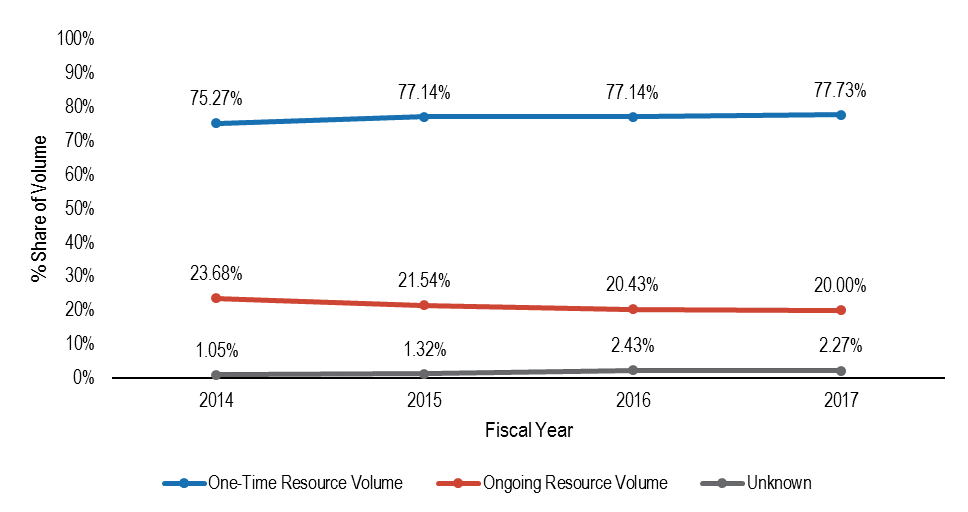
However, each resource type consumes a vastly different proportional share of expenditures, with one-time resources accounting for between 16 and 21 percent of information materials expenditures and ongoing resources accounting for between 70 and 76 percent (see Figure 9). While libraries have raised their spending on these two resource types by a relatively similar dollar amount since 2014, for one-time resources this represents a 36.6 percent increase in spending, but only a 7.2 percent increase in spending for ongoing resources. By proportional share of volume, the inverse is true. One-time resources constitute at least three-quarters of acquisitions with a growing share, while ongoing resources account for less than a quarter and have seen a 3.7 percent decline from 2014 (see Figure 10).
Figure 9. Share of expenditures by resource type (%)
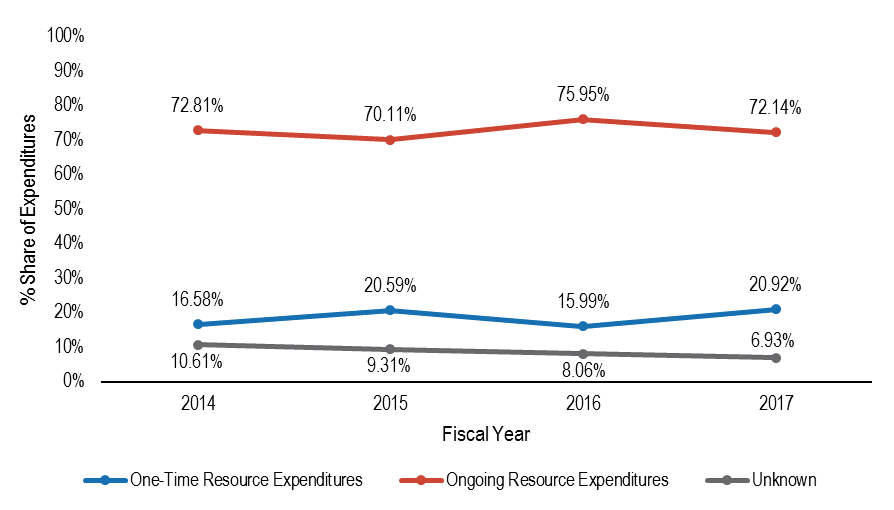
Figure 10. Share of volume by resource type
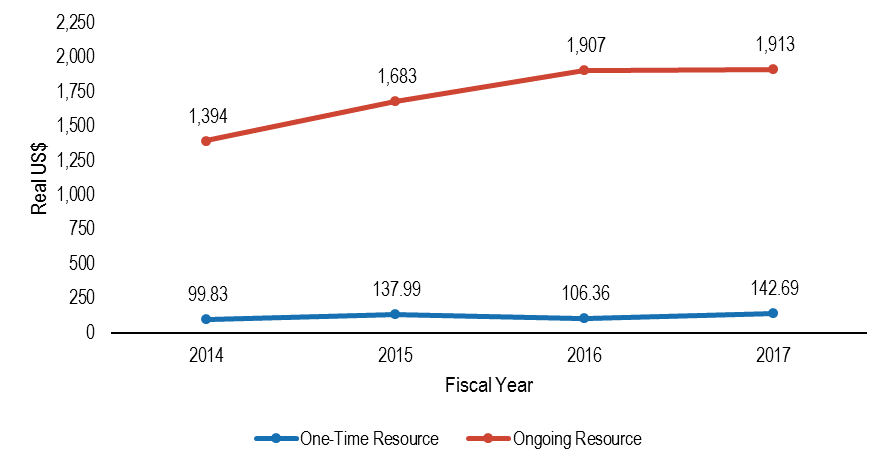
The steady rise in ongoing resource expenditures as the number of these acquired items simultaneously falls indicates that the cost to obtain these items is increasing. In fact, the average cost per ongoing resource item was 37.2 percent higher in 2017 than in 2014, increasing from roughly $1,400 to $1,900 in real dollars (see Figure 11).[23] Among one-time resources, the real cost per item also appears to be increasing, but as we will show in the next sections as we explore trends in print and e-book acquisition, this increase is likely driven by differences in pricing among these two different formats.
Figure 11. Average cost per item by resource type
One-Time Print and Electronic Books
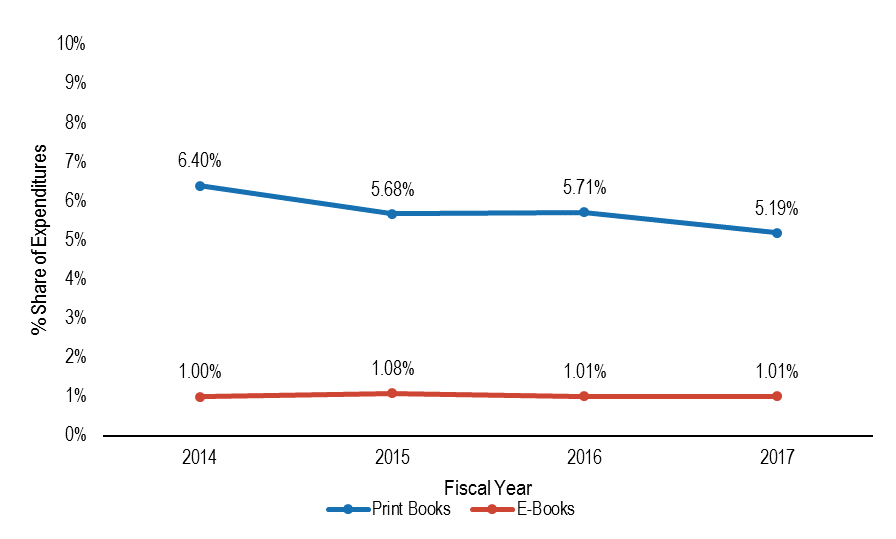
Over the four fiscal years tracked in this study, print book expenditures within our sample saw a steady decline in real terms, with 2017 expenditures 12.3 percent lower than in 2014. E-book expenditures during the same period of time rose by 9 percent (see Figure 12). These print and e-books combined account for less than a tenth of library material expenditures in each fiscal year—the share of print book expenditures out of total material expenditures ranges between 5 and 7 percent, while e-books hover around 1 percent across all four years (see Figure 13). Along with decreased spending to obtain print books, these items’ proportional share has also decreased slightly since 2014, by a little more than one percentage point.
Figure 12. Print vs. e-book real expenditures
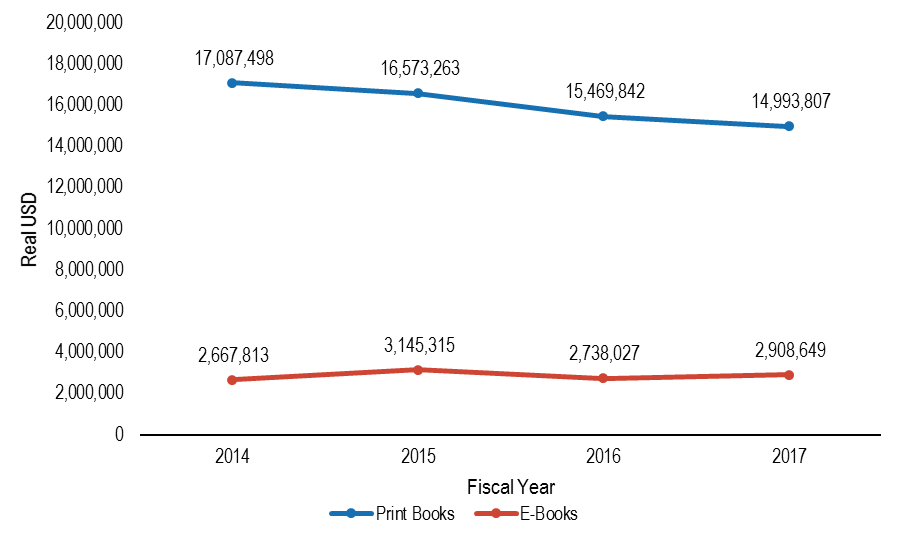
Figure 13. Print and e-book share of material expenditures
Institutional Types
Average print book expenditures have gone down on a yearly basis since 2014 for all degree-granting types. Master’s degree-granting institutions saw the largest drop in print book expenditures, falling by 30.6 percent in real terms, followed by baccalaureate degree-granting schools by 19.5 percent and doctoral degree-granting schools by 10.8 percent (see Figure 14).[24]
Figure 14. Average print book expenditures by institutional type
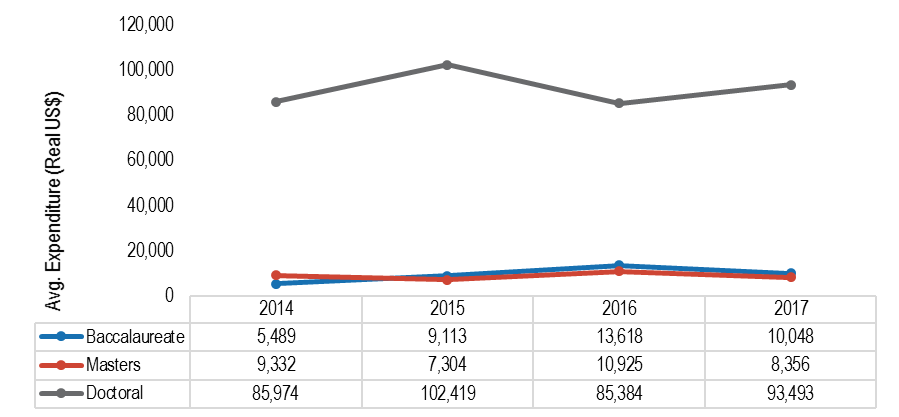
Average e-book expenditures have fluctuated from year to year to a greater degree. Baccalaureate degree-granting institutions saw an average increase in spending of 83.1 percent, while doctoral degree-granting institutions increased their average spending by a net 8.7 percent. Master’s degree-granting institutions saw a net decline of 10.5 percent (see Figure 15).
Figure 15. Average e-book expenditures by institutional type
Disciplinary Field
As print book expenditures decline in real terms, having fallen by 12.3 percent between 2014 and 2017, spending for print books in each field has experienced a similar decline as well. This reduction in spending is most prominent among print books in the STEM disciplines, which saw a 24.7 percent drop in the same four-year period. Conversely, print books in the humanities and social sciences saw the lowest drop in spending with a decrease of 6.9 percent and 8.4 percent, respectively (see Figure 16).
Figure 16. Print book expenditure by 3 major fields
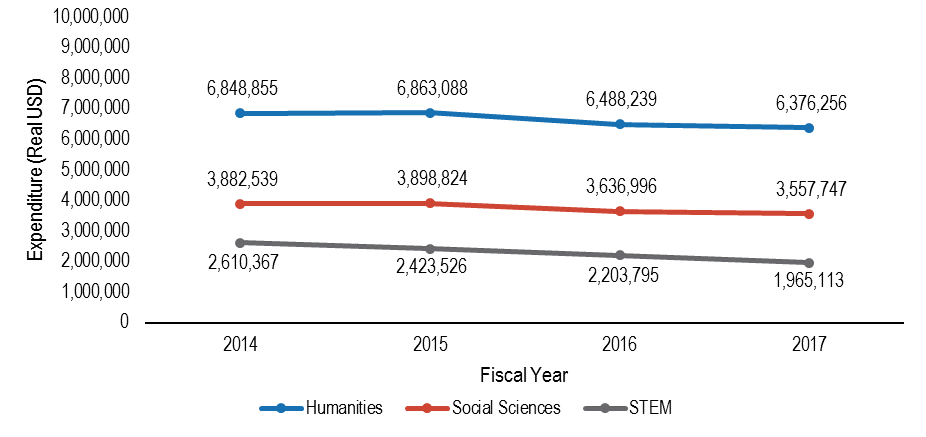
Expenditures in these two fields make up more than 60 percent of libraries’ print book budgets, and as expenditures decrease overall each year, libraries are funneling a slight but nevertheless larger proportion of each year’s budget toward obtaining print books in the humanities and social sciences to the detriment of other fields (see Table 1A in Appendix A).
In contrast, one-time expenditures on e-books have increased overall by 9 percent. However, growth in e-book expenditures has been uneven from year to year, and some fields have seen their expenditures increase while others have decreased from 2014 to 2017. STEM, humanities, and the social sciences consume the largest share of libraries’ e-book budgets each year. In 2014, social scientific e-book acquisitions accounted for 28.3 percent of that year’s total e-book expenditure, while the humanities and STEM fields accounted for 19.2 and 21 percent, respectively. Like with print books, STEM and other fields are seeing a shrinking proportion of book budgets put toward them, while libraries are directing a larger share of their book budgets toward acquiring e-books in the humanities and social sciences. The humanities’ share of total spending on e-books grew by 2.2 percent and the social sciences by 7 percent (see Figure 17).
Figure 17. E-book expenditure by 3 major fields
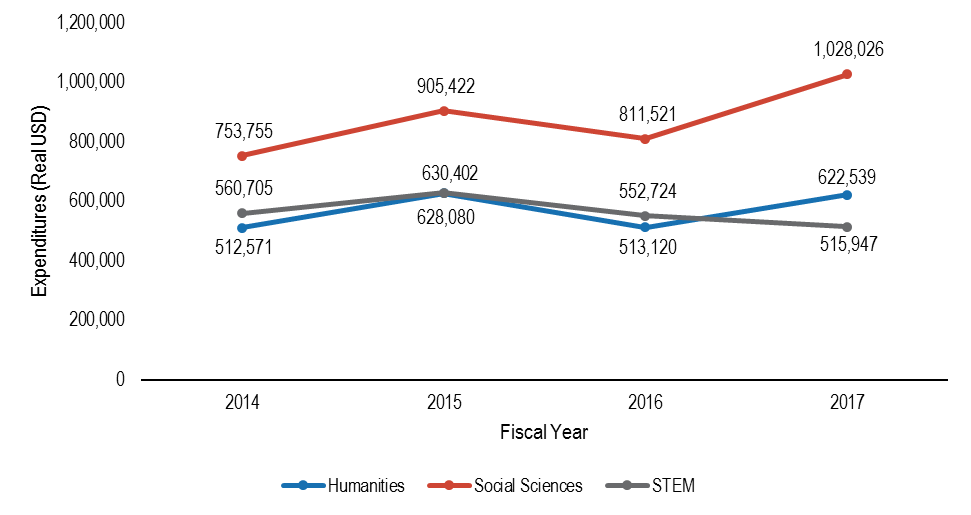
In real dollar amounts, the libraries in our sample collectively spent nearly $110,000 more on humanities e-book titles in 2017 than in 2014, an increase of 21.5 percent, and $274,270 more on social scientific e-books, an increase of 36.4 percent. Expenditures for STEM e-book titles slipped by 8 percent (see Table 2A in Appendix A). Despite overall increased expenditures for e-books, this has not led to a significant increase in the number of e-books being acquired as the average cost of an e-book has risen.
Average cost per print and electronic book
Between 2014 and 2017, libraries in our sample spent on average the same nominal amount to obtain a print book: $46, with this average cost fluctuating by no more than a dollar in either direction. In real terms, libraries are in fact paying less per print book over time. At the same time, however, libraries are paying more on average for an e-book. The average cost of an e-book in our sample was $39 higher in 2014 than a print book, and the cost has only risen since then and at a faster rate than the declining real cost of a print book is able to offset. In 2017, the average cost per e-book had risen to $57 higher than a print book, representing a 35 percent increase in the average cost of an e-book in real terms.
These trends largely hold true by disciplinary field as well. In real terms, the average dollar amount spent per print book fell by between 5.3 and 11.2 percent, depending on the field. The average real dollar amount spent per e-book rose in all disciplines, excepting STEM and law, by between 17.2 and 26.3 percent (see Tables 1A and 2A in Appendix A).
University Press Market Share
In real terms, library expenditures for print books published by a university press fell steadily between 2014 and 2017 within our sample. Year-on-year expenditures declined by 5.7-6.7 percent, with a net total decline of 17.7 percent relative to 2014 expenditures. By contrast, electronic books purchased on a title-by-title basis saw much greater fluctuation from year to year, increasing 14.6 percent in 2015 compared to the previous year’s expenditures, before dropping by more than $100,000 (-17 percent) in 2016 and then seeing a modest increase of $27,619 (5.6 percent) the following year. Participating libraries overall had a net increase in one-time e-book expenditures of 0.4 percent over the four-year period (see Figure 21).
Figure 21. Library expenditure on university press publications (real US$)
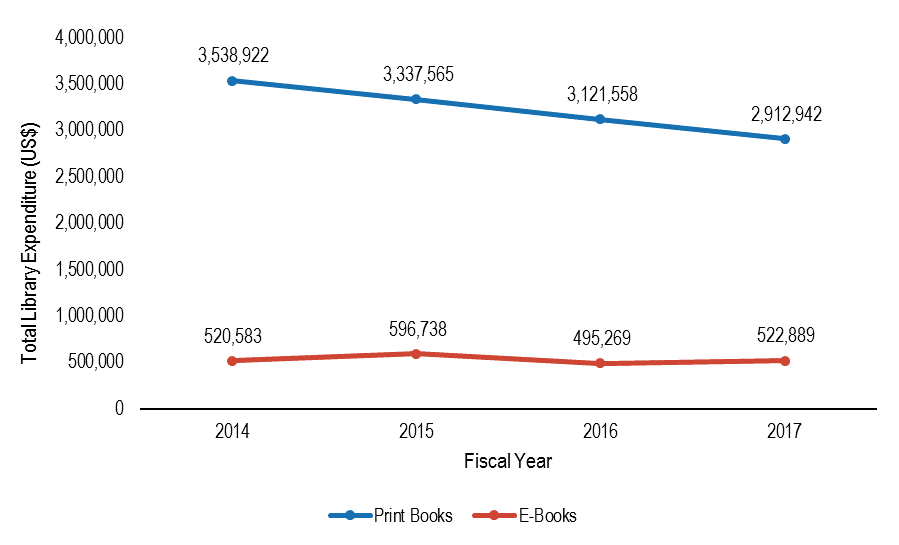
Figure 22. Quantity of university press publications obtained
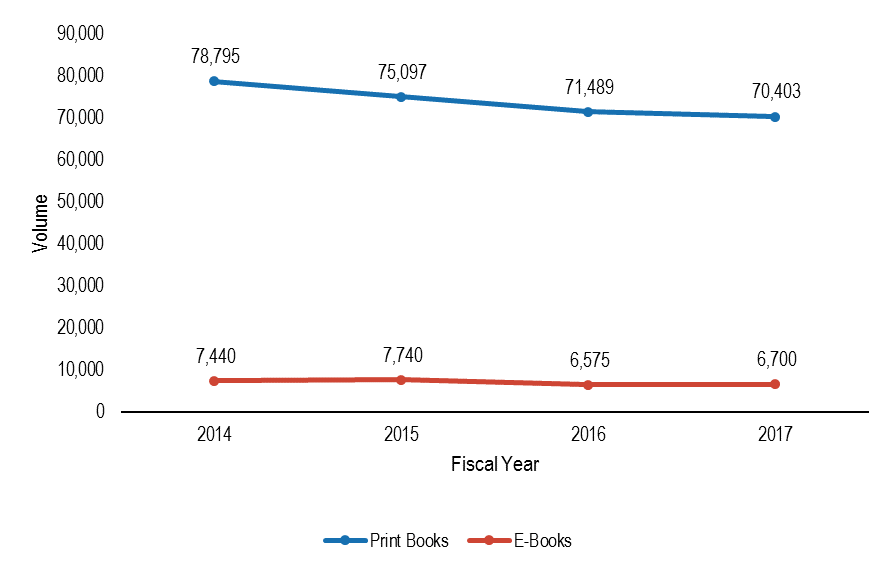
The number of print and e-books published by university presses and acquired by libraries follows a similar trend line as expenditures. The 17.7 percent decrease in real print book expenditures corresponds to a 10.7 percent drop in the volume of print books acquired. As seen in Figure 23, the average cost that libraries spend to obtain one print book has remained stable, varying by less than fifty cents in nominal terms and, as seen in Figure 24, actually decreasing in real terms.
Figure 23. Average nominal cost per university press title by format
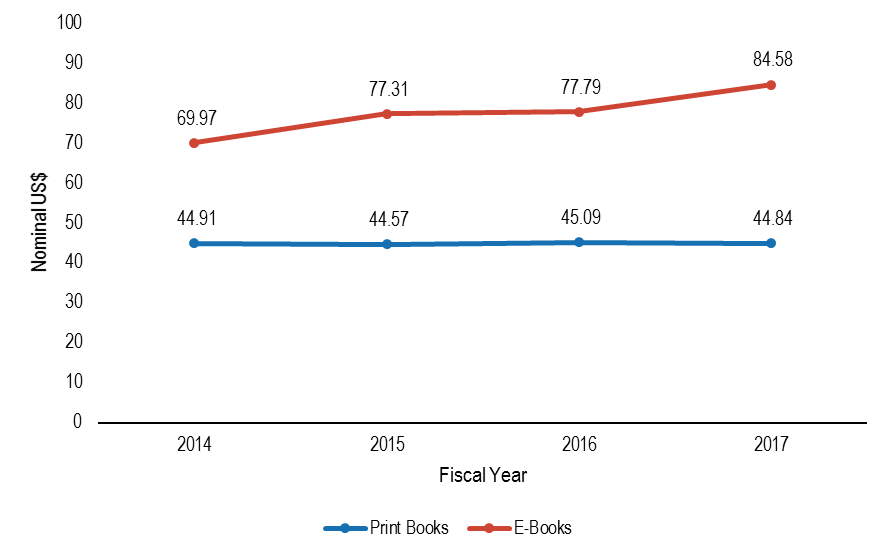
Figure 24. Average real cost per university press title by format
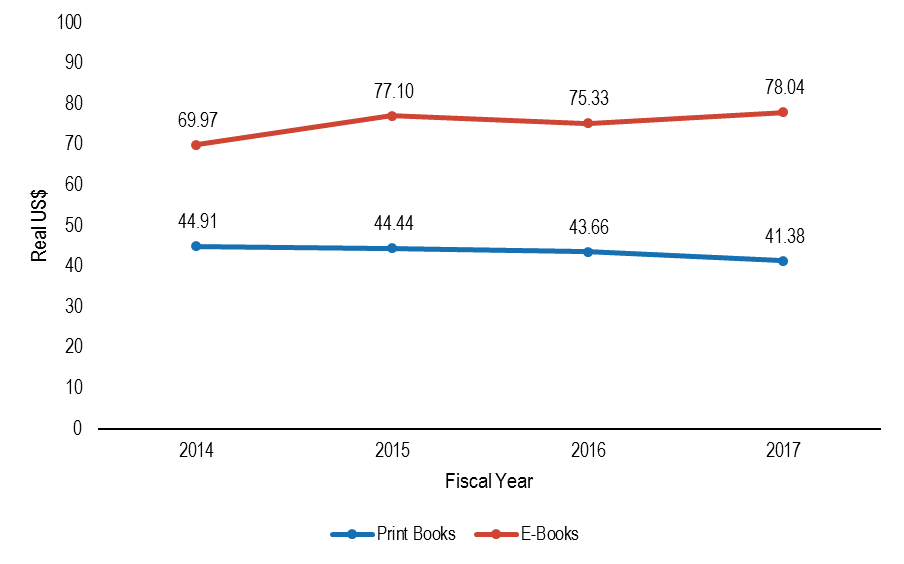
Although e-books published by university presses and obtained on a title-by-title basis follow the same pattern, increasing in quantity as expenditures go up and decreasing as expenditures go down, the average cost per e-book has simultaneously risen. In 2017, this cost was on average $8.07 higher in real terms than in 2014. While libraries are only seeing small fluctuations in their e-book expenditures and volume—0.4 percent higher spending to obtain 0.1 percent fewer e-books—the increasing cost to acquire one e-book means that libraries will have to spend more to acquire the same number of books in digital format.
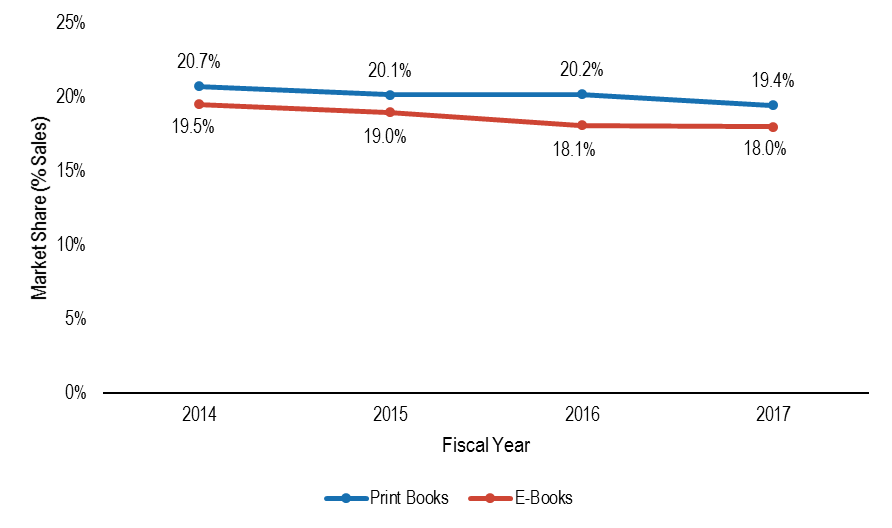
Expenditures on both print and electronic university press books fell by 15.4 percent in real terms from 2014 to 2017, a decline largely driven by the steadily decreasing print book expenditures in our sample. But in spite of falling expenditures for these items, university press titles continue to occupy approximately 20 percent of the library market for books purchased on a one-time, title-by-title basis (see Figure 25). While this is on par with previous estimates from 2014 that posited that university presses hold 20-25 percent of the library market,[25] our findings indicate that this share is trending downward and has now fallen below the estimated range. Moreover, the university press shares of both print and e-book expenditures have been decreasing since at least 2014 (see Figure 26).
Figure 25. University press vs. commercial press market share
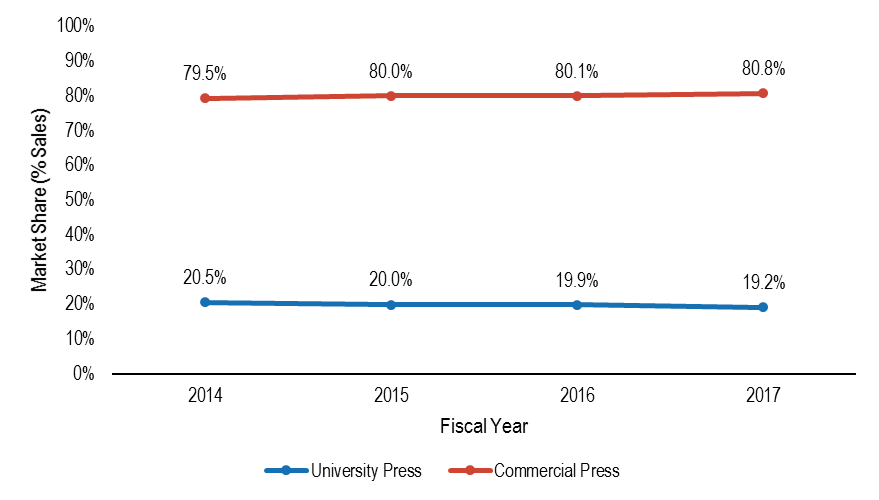
Figure 26. University press share of market by format
Top University Presses
Oxford and Cambridge each lead with upwards of 20 percent of university press print book sales to participating libraries (see Figure 27), far outstripping sales by other university presses—for example, as the third leading university press, Yale’s highest share between 2014 and 2017 is only 3.8 percent. Other top presses for print book sales include Princeton, Harvard, Manchester, Columbia, the University of California, the University of Pennsylvania, the University of Toronto, and the State University of New York with between 1.5-3.2 percent of university press print book sales (see Table 3A in Appendix A).
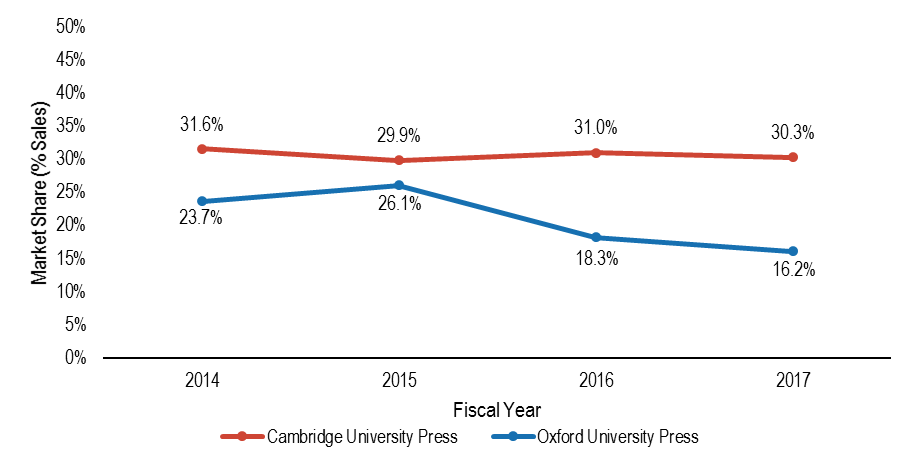
As seen in Figure 28, Oxford and Cambridge switch positions concerning university press sales of e-books in our sample. Cambridge holds nearly a third of the market, followed by Oxford. There is greater variation in the list of university presses rounding out the top ten for e-book sales to libraries. Some presses with a large presence in print books, such as Princeton, the University of California, Yale, Columbia, and SUNY, also had comparatively large percentage shares of e-book sales; however, other presses like Duke, the University of Chicago, Stanford, and NYU performed relatively stronger with their e-books (see Table 4A in Appendix A).
Amid declining university press print book sales and stagnant title-by-title e-book sales, even Oxford and Cambridge are experiencing declines in the amount that libraries spend to acquire their publications on a title-by-title basis. Among print books, Oxford University Press saw a net decline in sales of 16.3 percent in 2017 relative to 2014, while Cambridge saw a 21.1 percent net decline. With e-book acquisitions, Cambridge only saw a 3.7 percent net decline, but Oxford’s decline was a precipitous 31.4 percent. However, these two presses, and other UPs, may be making up for these declines with the sales of other products, such as e-collections and other packages sales.
Figure 27. Oxford and Cambridge UP share of print book sales
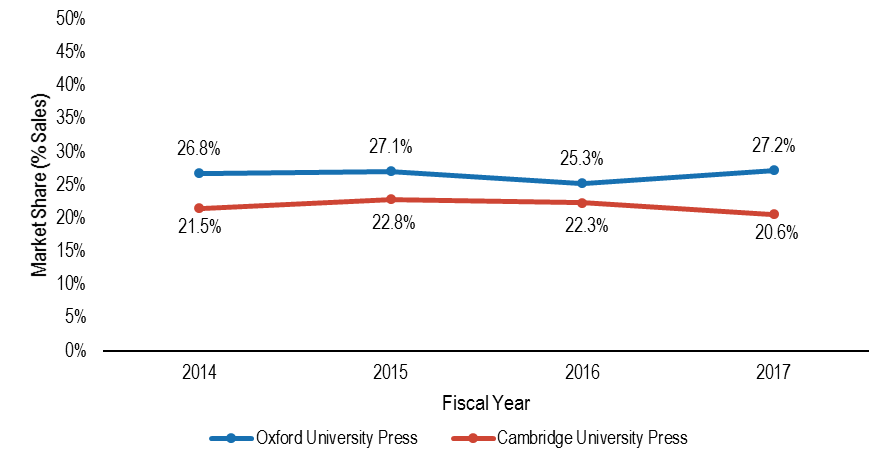
Figure 28. Oxford and Cambridge UP share of e-book sales
Top Vendors
Much has been made of Amazon’s position as a leading vendor of print and electronic books, but the extent of their share in the library market has only been the subject of speculation without any sales figures to act as evidence. With acquisitions data from 51 libraries, however, we can begin to form a picture of where Amazon sits in relation to more established book vendors in the academic library space.
Figure 29. Percentage share of print book expenditures by top vendor
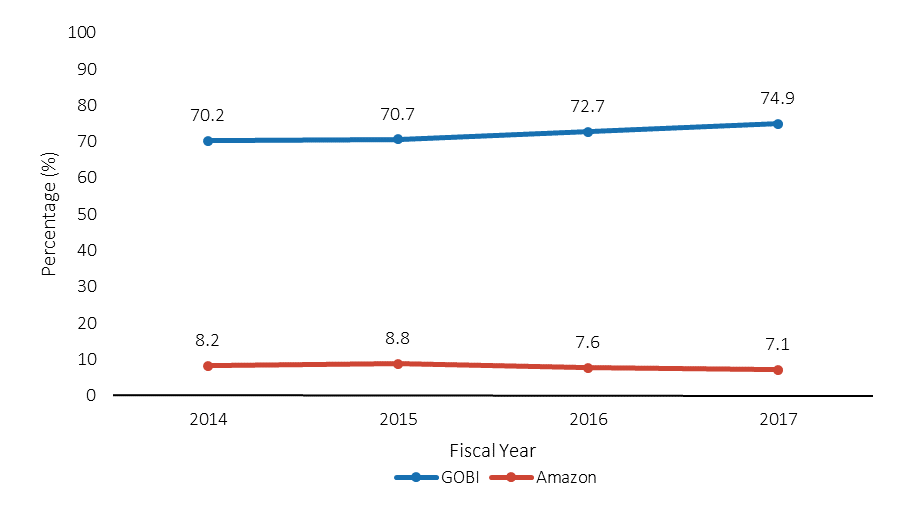
For fiscal years 2014 through 2017, Amazon has been comfortably ensconced as the second largest vendor of print books, accounting for roughly 7-9 percent of print book expenditures at participating libraries. But, while the assertion has been made that two-thirds of total e-book sales go through Amazon,[26] the company accounts for a far more modest portion of e-book sales to academic libraries.[27] Instead, within this sample GOBI is the dominant vendor of both print and e-books obtained by the libraries in our sample. GOBI accounts for more than 70 percent of print book sales made to academic libraries in our sample—with e-books, this jumps to more than 90 percent. The second highest vendors of e-books in our analysis are Springer, with 1.8 percent of the market in 2014, and ProQuest/Coutts, who takes second spot for the remaining years of our analysis with between 1.5 percent and 4 percent of the market. However, as mentioned earlier in the report, vendors sell their own content as well as distribute others’ content through their platforms, which could make expenditures for some vendors appear lower than their actual figures.
Despite GOBI and Amazon’s share of the print book market, libraries continue to go through specialized vendors to obtain specific types of books. These vendors include Harrassowitz, Amalivre, and Casalini Libri for European print publications or rare and antiquarian titles, and Alibris for second-hand books. Although these vendors hold relatively small shares of the market, accounting for little more than 2 percent of print book sales at best, their stable presence among the top ten print book vendors suggests that they are still considered to be valuable scholarly resources (see Tables 5A and 6A in Appendix A).
Conclusion
The Library Acquisition Patterns project was spurred on by the question of whether libraries were buying fewer books as indicated by metrics from traditional wholesale vendors, or if libraries’ book expenditures only looked depressed because they were buying books from newer vendors like Amazon. This question led to acquiring acquisitions data from Ex Libris’s and OCLC’s integrated library systems, respectively called Alma and WMS, and building the data infrastructure that would allow us to combine both sets of data for analysis.
Ithaka S+R examined acquisitions at 124 US higher education institutions in fiscal year 2017 and 51 institutions with data on their acquisitions from FY 2014 to 2017. The results show that while Amazon has become the second largest print book vendor to academic libraries, they actually are buying fewer books individually and below a certain price point, as measured by lower overall book expenditures within our sample. The slight increase in spending to acquire e-books is not high enough to offset the decline in spending to acquire print books. Nor does the increase in e-book expenditures necessarily mean that libraries are acquiring more books in digital format. Rather, e-books appear to be becoming more expensive (including e-books costing more than $350), making it costlier for libraries to acquire the same number of digital materials.
What do lower book expenditures overall mean for university presses? As predicted by others in the industry, only a fifth of library book expenditures are for university press titles. The academic library really is not the university press’s sole or even top customer, but the nearly 20 percent fall in spending for university press titles over the four-year period doesn’t bode well for the health of these presses, especially if they continue to rely on one-time print book sales as their main source of revenue. One positive is that the demand still exists for humanities and social science titles. Despite falling print expenditures for titles in these fields, libraries continued to spend relatively more on these fields than others, and for e-books, expenditures actually grew in these fields where they shrank in others.
Although the findings in this report are indicative of trends in acquisitions based on the data provided by a large sample of academic libraries, these findings should not be viewed as conclusive or generalizable to every library at a US higher education institution. For one thing, while the integrated library systems from which we drew our data are a useful organizational tool for libraries, they are not optimized for certain types of acquisitions, such as book packages or databases, or for acquisition methods and e-book access and licensing models as they become more sophisticated. Nor are they optimized to serve as a source of data for cross-institutional analyses. For another, each library is unique with different budgets and different needs that it must meet. As Michael Jubb noted concerning RLUK members, “even within the different groups of libraries, there are huge variations in expenditures, stock, acquisitions, level of usage, the balance between physical and e-books, and trends in all those variables. Just as there is no typical publisher, there is no typical library,”[28] and the same certainly applies to US higher education institutions.
But LAP does provide evidence of trends where before we just had speculation, and it points toward a number of potential pathways for future studies that would deepen our understanding of how libraries acquire information materials and how they co-exist in the broader ecosystem with publishers and vendors. For instance, what other non-book UP items are academic libraries acquiring and what does this mean for the future of university presses? Do package deals offset the decline in individual book expenditures, and if so, what are the greater implications for libraries, vendors, and publishers as the ways in which information is accessed evolve? Why are book expenditures so varied across the different degree-granting institutional types? Is it merely that institutions with a doctoral focus must meet the intensified research needs of their candidates, or are there other underlying reasons?
LAP makes use of buy-side data pulled from libraries’ own acquisitions records. As the community continues to explore these trends, greater sharing and management of data by the libraries, vendors, and publishers could prove to be a key factor in ensuring that each has the necessary information to effectively navigate this shifting landscape.
Appendix A. Tables
Table 1A. Print books by disciplinary field
| 2014 | 2015 | 2016 | 2017 | % Change | ||
|---|---|---|---|---|---|---|
| Arts | Expenditure | 1,507,802 | 1,404,820 | 1,329,992 | 1,270,026 | -15.8% |
| Share of Expenditures | 8.8% | 8.5% | 8.6% | 8.5% | -0.4% | |
| Volume | 30,475 | 28,328 | 27,479 | 27,478 | -9.8% | |
| Average Cost | 49.48 | 49.59 | 48.40 | 46.22 | -6.6% | |
| Humanities | Expenditure | 6,848,855 | 6,863,088 | 6,488,239 | 6,376,256 | -6.9% |
| Share of Expenditures | 40.1% | 41.4% | 41.9% | 42.5% | 2.4% | |
| Volume | 176,959 | 179,849 | 173,717 | 174,811 | -1.2% | |
| Average Cost | 38.70 | 38.16 | 37.35 | 36.48 | -5.8% | |
| Law | Expenditure | 977,210 | 900,228 | 874,971 | 889,440 | -9.0% |
| Share of Expenditures | 5.7% | 5.4% | 5.7% | 5.9% | 0.2% | |
| Volume | 13,530 | 12,658 | 12,727 | 13,420 | -0.8% | |
| Average Cost | 72.23 | 71.12 | 68.75 | 66.28 | -8.2% | |
| Medicine | Expenditure | 538,871 | 518,622 | 472,323 | 450,856 | -16.3% |
| Share of Expenditures | 3.2% | 3.1% | 3.1% | 3.0% | -0.1% | |
| Volume | 9,356 | 8,946 | 8,392 | 8,266 | -11.7% | |
| Average Cost | 57.60 | 57.97 | 56.28 | 54.54 | -5.3% | |
| Social Sciences | Expenditure | 3,882,539 | 3,898,824 | 3,636,996 | 3,557,747 | -8.4% |
| Share of Expenditures | 22.7% | 23.5% | 23.5% | 23.7% | 1.0% | |
| Volume | 81,248 | 81,114 | 78,495 | 79,718 | -1.9% | |
| Average Cost | 47.79 | 48.07 | 46.33 | 44.63 | -6.6% | |
| STEM | Expenditure | 2,610,367 | 2,423,526 | 2,203,795 | 1,965,113 | -24.7% |
| Share of Expenditures | 15.3% | 14.6% | 14.2% | 13.1% | -2.2% | |
| Volume | 39,319 | 36,778 | 34,481 | 32,884 | -16.4% | |
| Average Cost | 66.39 | 65.90 | 63.91 | 59.76 | -10.0% | |
| Other | Expenditure | 292,771 | 261,687 | 239,196 | 237,210 | -19.0% |
| Share of Expenditures | 1.7% | 1.6% | 1.5% | 1.6% | -0.1% | |
| Volume | 5,734 | 5,454 | 5,146 | 5,232 | -8.8% | |
| Average Cost | 51.06 | 47.98 | 46.48 | 45.34 | -11.2% | |
| Unknown | Expenditure | 429,084 | 302,466 | 224,331 | 247,159 | -42.4% |
| Share of Expenditures | 2.5% | 1.8% | 1.5% | 1.6% | -0.9% | |
| Volume | 11,896 | 9,098 | 6,698 | 7,082 | -40.5% | |
| Average Cost | 36.07 | 33.25 | 33.49 | 34.90 | -3.2% | |
| Total Expenditures | 17,087,499 | 16,573,262 | 15,469,842 | 14,993,807 | -12.3% | |
| Total Volume | 368,517 | 362,225 | 347,135 | 348,891 | -5.3% |
Table 2A. Electronic books by disciplinary field
| 2014 | 2015 | 2016 | 2017 | % Change | ||
|---|---|---|---|---|---|---|
| Arts | Expenditure | 59,463 | 63,906 | 57,339 | 69,494 | 16.9% |
| Share of Expenditures | 2.2% | 2.0% | 2.1% | 2.4% | 0.2% | |
| Volume | 791 | 750 | 642 | 732 | -7.5% | |
| Average Cost | 75.17 | 85.21 | 89.31 | 94.94 | 26.3% | |
| Humanities | Expenditure | 512,571 | 628,080 | 513,120 | 622,539 | 21.5% |
| Share of Expenditures | 19.2% | 20.0% | 18.7% | 21.4% | 2.2% | |
| Volume | 6,867 | 7,777 | 6,065 | 6,809 | -0.8% | |
| Average Cost | 74.64 | 80.76 | 84.60 | 91.43 | 22.5% | |
| Law | Expenditure | 124,998 | 164,918 | 69,472 | 78,510 | -37.2% |
| Share of Expenditures | 4.7% | 5.2% | 2.5% | 2.7% | -2.0% | |
| Volume | 949 | 1,456 | 646 | 729 | -23.2% | |
| Average Cost | 131.72 | 113.27 | 107.54 | 107.70 | -18.2% | |
| Medicine | Expenditure | 228,793 | 256,091 | 214,588 | 216,049 | -5.6% |
| Share of Expenditures | 8.6% | 8.1% | 7.8% | 7.4% | -1.1% | |
| Volume | 2,531 | 2,479 | 1,999 | 2,040 | -19.4% | |
| Average Cost | 90.40 | 103.30 | 107.35 | 105.91 | 17.2% | |
| Social Sciences | Expenditure | 753,755 | 905,422 | 811,521 | 1,028,026 | 36.4% |
| Share of Expenditures | 28.3% | 28.8% | 29.6% | 35.3% | 7.1% | |
| Volume | 9,488 | 10,347 | 9,042 | 10,940 | 15.3% | |
| Average Cost | 79.44 | 87.51 | 89.75 | 93.97 | 18.3% | |
| STEM | Expenditure | 560,705 | 630,402 | 552,724 | 515,947 | -8.0% |
| Share of Expenditures | 21.0% | 20.0% | 20.2% | 17.7% | -3.3% | |
| Volume | 4,867 | 5,283 | 4,561 | 4,540 | -6.7% | |
| Average Cost | 115.21 | 119.33 | 121.18 | 113.64 | -1.4% | |
| Other | Expenditure | 27,380 | 33,875 | 36,010 | 38,128 | 39.3% |
| Share of Expenditures | 1.0% | 1.1% | 1.3% | 1.3% | 0.3% | |
| Volume | 365 | 466 | 454 | 414 | 13.4% | |
| Average Cost | 75.01 | 72.69 | 79.32 | 92.10 | 22.8% | |
| Unknown | Expenditure | 400,148 | 462,621 | 483,253 | 339,957 | -15.0% |
| Share of Expenditures | 15.0% | 14.7% | 17.6% | 11.7% | -3.3% | |
| Volume | 5,357 | 5,264 | 6,301 | 4,231 | -21.0% | |
| Average Cost | 74.70 | 87.88 | 76.69 | 80.35 | 7.6% | |
| Total Expenditures | 2,667,813 | 3,145,315 | 2,738,027 | 2,908,650 | 9.0% | |
| Total Volume | 31,215 | 33,822 | 29,710 | 30,435 | -2.5% |
Table 3A. PRINT BOOKS: Top 10 university presses and percentage market share 2014-2017
| 2014 | 2015 | |||
|---|---|---|---|---|
| Total UP print book sales[29] | $3,538,922 | Total UP print book sales | $3,346,910 | |
| Top 10 University Presses | Share (%) | Top 10 University Presses | Share (%) | |
| 1. | Oxford University Press | 26.8% | Oxford University Press | 27.1% |
| 2. | Cambridge University Press | 21.5% | Cambridge University Press | 22.8% |
| 3. | Yale University Press | 3.7% | Yale University Press | 3.7% |
| 4. | Princeton University Press | 2.6% | Princeton University Press | 2.4% |
| 5. | Harvard University Press | 2.1% | Harvard University Press | 2.2% |
| 6. | Manchester University Press | 2.0% | Columbia University Press | 1.9% |
| 7. | University of Toronto Press | 1.9% | University of Toronto Press | 1.8% |
| 8. | University of California Press | 1.7% | University of California Press | 1.7% |
| 9. | Columbia University Press | 1.7% | University of Pennsylvania Press | 1.6% |
| 10. | University of Pennsylvania Press | 1.7% | Manchester University Press | 1.5% |
| 2016 | 2017 | |||
|---|---|---|---|---|
| Total UP print book sales | $3,223,633 | Total UP print book sales | $3,157,046 | |
| Top 10 University Presses | Share (%) | Top 10 University Presses | Share (%) | |
| 1. | Oxford University Press | 25.3% | Oxford University Press | 27.2% |
| 2. | Cambridge University Press | 22.3% | Cambridge University Press | 20.6% |
| 3. | Yale University Press | 3.5% | Yale University Press | 3.8% |
| 4. | Princeton University Press | 2.7% | Princeton University Press | 3.2% |
| 5. | Columbia University Press | 2.3% | Manchester University Press | 2.7% |
| 6. | Manchester University Press | 2.2% | Columbia University Press | 2.2% |
| 7. | Harvard University Press | 2.1% | Harvard University Press | 2.2% |
| 8. | University of California Press | 2.0% | University of California Press | 2.0% |
| 9. | State University of New York Press | 1.8% | State University of New York Press | 1.9% |
| 10. | University of Toronto Press | 1.6% | University of Pennsylvania Press | 1.6% |
Table 4A. ELECTRONIC BOOKS: Top 10 university presses and percentage market share 2014-2017
| 2014 | 2015 | ||||||
|---|---|---|---|---|---|---|---|
| Total UP e-book sales | $520,583 | Total UP e-book sales | $598,409 | ||||
| Top 10 University Presses | Share (%) | Top 10 University Presses | Share (%) | ||||
| 1. | Cambridge University Press | 31.6% | Cambridge University Press | 29.9% | |||
| 2. | Oxford University Press | 23.7% | Oxford University Press | 26.1% | |||
| 3. | Princeton University Press | 4.0% | Princeton University Press | 4.1% | |||
| 4. | University of California Press | 2.9% | University of California Press | 3.1% | |||
| 5. | Duke University Press | 2.9% | Duke University Press | 2.8% | |||
| 6. | University of Chicago Press | 2.2% | State University of New York Press | 2.2% | |||
| 7. | Stanford University Press | 1.9% | University of Toronto Press | 2.0% | |||
| 8. | New York University Press | 1.8% | Columbia University Press | 2.0% | |||
| 9. | Yale University Press | 1.5% | New York University Press | 1.9% | |||
| 10. | Columbia University Press | 1.5% | Yale University Press | 1.8% | |||
| 2016 | 2017 | ||||||
| Total UP e-book sales | $511,465 | Total UP e-book sales | $566,707 | ||||
| Top 10 University Presses | Share (%) | Top 10 University Presses | Share (%) | ||||
| 1. | Cambridge University Press | 31.0% | Cambridge University Press | 30.3% | |||
| 2. | Oxford University Press | 18.3% | Oxford University Press | 16.2% | |||
| 3. | Duke University Press | 4.6% | Duke University Press | 5.3% | |||
| 4. | Princeton University Press | 4.5% | Princeton University Press | 5.1% | |||
| 5. | New York University Press | 3.7% | New York University Press | 4.3% | |||
| 6. | University of California Press | 3.1% | Yale University Press | 2.3% | |||
| 7. | Yale University Press | 2.3% | State University of New York Press | 1.9% | |||
| 8. | Columbia University Press | 2.1% | Columbia University Press | 1.7% | |||
| 9. | State University of New York Press | 1.9% | Harvard University Press | 1.7% | |||
| 10. | Harvard University Press | 1.6% | University of Chicago Press | 1.6% | |||
Table 5A. PRINT BOOKS: Top 10 vendors and percentage market share 2014-2017
| 2014 | 2015 | ||||||
|---|---|---|---|---|---|---|---|
| Total vendor print book sales | $17,087,498 | Total vendor print book sales | $16,619,668 | ||||
| Top 10 Vendors | Share (%) | Top 10 Vendors | Share (%) | ||||
| 1. | GOBI Library Solutions | 70.2% | GOBI Library Solutions | 70.7% | |||
| 2. | Amazon | 8.2% | Amazon | 8.8% | |||
| 3. | Harrassowitz | 2.3% | Harrassowitz | 1.8% | |||
| 4. | Book House | 1.3% | Amalivre | 1.3% | |||
| 5. | Ingram-Coutts | 1.2% | Alibris | 1.0% | |||
| 6. | Amalivre | 1.0% | ProQuest/Coutts | 0.8% | |||
| 7. | Alibris | 0.9% | Casalini Libri | 0.8% | |||
| 8. | Worldwide Books | 0.8% | Worldwide Books | 0.8% | |||
| 9. | Casalini Libri | 0.8% | Book House | 0.7% | |||
| 10. | Midwest Library Service | 0.8% | Midwest Library Service | 0.7% | |||
| 2016 | 2017 | ||||||
| Total vendor print book sales | $15,975,706 | Total vendor print book sales | $16,250,288 | ||||
| Top 10 Vendors | Share (%) | Top 10 Vendors | Share (%) | ||||
| 1. | GOBI Library Solutions | 72.7% | GOBI Library Solutions | 74.9% | |||
| 2. | Amazon | 7.6% | Amazon | 7.1% | |||
| 3. | Harrassowitz | 1.9% | Harrassowitz | 2.0% | |||
| 4. | Amalivre | 1.2% | Amalivre | 1.2% | |||
| 5. | Alibris | 0.9% | Casalini Libri | 0.9% | |||
| 6. | Casalini Libri | 0.8% | Alibris | 0.9% | |||
| 7. | Worldwide Books | 0.8% | Worldwide Books | 0.7% | |||
| 8. | Midwest Library Service | 0.7% | Eastern Book Company | 0.7% | |||
| 9. | ProQuest/Coutts | 0.6% | Ingram | 0.6% | |||
| 10. | Ingram | 0.6% | Midwest Library Service | 0.6% | |||
Table 6A. ELECTRONIC BOOKS: Top 10 vendors and percentage market share 2014-2017
| 2014 | 2015 | ||||||
|---|---|---|---|---|---|---|---|
| Total vendor e-book sales | $2,667,813 | Total vendor e-book sales | $3,154,122 | ||||
| Top 10 Vendors | Share (%) | Top 10 Vendors | Share (%) | ||||
| 1. | GOBI Library Solutions | 91.9% | GOBI Library Solutions | 94.6% | |||
| 2. | Springer | 1.8% | ProQuest/Coutts | 1.6% | |||
| 3. | Ingram-Coutts | 1.7% | Taylor & Francis | 1.1% | |||
| 4. | Sage | 1.3% | Matthews Book Company | 0.8% | |||
| 5. | Matthews Book Company | 1.2% | Gale-Cengage | 0.4% | |||
| 6. | Gale-Cengage | 0.6% | Sage | 0.2% | |||
| 7. | Ovid Technologies | 0.3% | Ovid Technologies | 0.1% | |||
| 8. | Elsevier | 0.2% | Oxford University Press | 0.1% | |||
| 9. | Rittenhouse | 0.1% | Elsevier | 0.1% | |||
| 10. | ProQuest | 0.1% | Rittenhouse | 0.1% | |||
| 2016 | 2017 | ||||||
| Total vendor e-book sales | $2,827,560 | Total vendor e-book sales | $3,152,394 | ||||
| Top 10 Vendors | Share (%) | Top 10 Vendors | Share (%) | ||||
| 1. | GOBI Library Solutions | 93.0% | GOBI Library Solutions | 91.5% | |||
| 2. | ProQuest/Coutts | 1.5% | ProQuest/Coutts | 4.0% | |||
| 3. | Sage | 1.2% | Matthews Book Company | 0.7% | |||
| 4. | Gale-Cengage | 1.0% | Gale-Cengage | 0.5% | |||
| 5. | JSTOR | 0.8% | Rittenhouse | 0.5% | |||
| 6. | Matthews Book Company | 0.8% | Credo Reference | 0.4% | |||
| 7. | Rittenhouse | 0.6% | Cambridge University Press | 0.4% | |||
| 8. | Cambridge University Press | 0.3% | Ebrary | 0.3% | |||
| 9. | OverDrive | 0.2% | Taylor & Francis | 0.3% | |||
| 10. | Oxford University Press | 0.2% | Sage | 0.2% | |||
Endnotes
- Rick Anderson, “How Important Are Library Sales to the University Press? One Case Study,” The Scholarly Kitchen, 2014, https://scholarlykitchen.sspnet.org/2014/06/23/how-important-are-library-sales-to-the-university-press-one-case-study/. ↑
- Michael Jubb, “Academic Books and Their Futures: A Report to the AHRC and the British Library,” 2017, https://academicbookfuture.files.wordpress.com/2017/06/academic-books-and-their-futures_jubb1.pdf. ↑
- Carl Straumsheim, “Pressing Challenges,” Inside Higher Ed, 2016, https://www.insidehighered.com/news/2016/08/01/amid-declining-book-sales-university-presses-search-new-ways-measure-success. ↑
- Jubb 2017, p.134 ↑
- “Graph 4 Expenditure Trends in ARL Libraries, 1986-2015,” Chart, https://www.arl.org/storage/documents/expenditure-trends.pdf. ↑
- Joseph Esposito, “Researching Amazon and Libraries,” The Scholarly Kitchen, 2014, https://scholarlykitchen.sspnet.org/2014/11/12/researching-amazon-and-libraries/. ↑
- Jubb 2017, p.90 ↑
- Roger C. Schonfeld and Liam Sweeney, “Analyzing Library Acquisitions: Vendors, Publishers and Integrated Library Systems,” Ithaka S+R, 2016, http://www.sr.ithaka.org/blog/analyzing-library-acquisitions/. ↑
- Liam Sweeney, “Library Acquisitions Pilot: Looking at the Data,” Ithaka S+R, 2016, http://www.sr.ithaka.org/blog/library-acquisitions-pilot-looking-at-the-data/. ↑
- See https://librarytechnology.org/. ↑
- See https://nces.ed.gov/ipeds/. ↑
- The LAP database also includes data for other fiscal years not used for this analysis, including 2018. It should be noted that 2018 data from WMS users is not viable as this data was extracted prior to the end of their 2018 fiscal year. ↑
- For more information on the Library of Congress classification system, see https://www.loc.gov/catdir/cpso/lcco/; for information on the Dewey Decimal system, see https://www.oclc.org/en/dewey/features/summaries.html. ↑
- For a list of AUP members, see http://www.aupresses.org/aaup-members/membership-list. ↑
- The Global Register of Publishers is available at https://www.isbn-international.org/content/global-register-publishers. ↑
- “ACRL Academic Library Trends and Statistics Annual Survey Instructions and Definitions,” ACRL, 2017, https://acrl.countingopinions.com/docs/acrl/2017Instructions_8_24_17.pdf. ↑
- See the Ithaka S+R US Faculty Survey 2015, p.80 at https://doi.org/10.18665/sr.277685. ↑
- ALCTS LMPI Board and Narda Tafuri, “Prices of U.S. and Foreign Published Materials.” In The Library and Book Trade Almanac 2017, 62nd ed., 2017, https://alair.ala.org/bitstream/handle/11213/8099/LMPI Article 2017.pdf?sequence=1&isAllowed=y. ↑
- John B. Thompson, Books in the Digital Age: The Transformation of Academic and Higher Education Publishing in Britain and the United States (Cambridge: Polity Press, 2005), 103. ↑
- “Print Books” and “E-Books” are the primary focus of this analysis. “Other Print Books” and “Other E-Books” contain items costing in excess of $215 for print books and $350 for e-books and obtained on a one-time, title-by-title basis. An additional category, “Other Book Items,” contains books purchased on either a one-time or subscription basis and/or which have not been classified as being in either print or electronic format. ↑
- JSTOR is a service of ITHAKA, and Ithaka S+R is also a service of ITHAKA. No information was shared between Ithaka S+R and other parts of the ITHAKA organization as part of this project. ↑
- Real expenditures are calculated based on an average of the monthly change in consumer prices over the course of a given year and re-indexed relative to 2014, the first fiscal year of our analysis. In 2015, the CPI-U was on average 1.0028 times higher than in 2014; in 2016, it was 1.0327 times higher, and in 2017, it was 1.0838 times higher. The Bureau of Labor Statistics’ Historical Consumer Price Index for All Urban Consumers (CPI-U) is available at https://www.bls.gov/cpi/tables/supplemental-files/historical-cpi-u-201810.pdf ↑
- Resource types contain both titles acquired as individual items and titles that are packages or which provide access to a number of individual items. Even though the average cost per item does not take into account the individual items that may be masked within packages, this calculation provides an overview of what libraries pay on average to acquire a title in either resource type. ↑
- Institutions in each degree-granting institutional type that did not acquire any e-books in our sample were still included in calculations for average e-book expenditures. ↑
- Anderson 2014 ↑
- Dan Cohen, “What’s the matter with ebooks? In our praise for print, we forget the great virtues of digital formats,” 2015, The London School of Economics and Political Science, http://blogs.lse.ac.uk/impactofsocialsciences/2015/03/30/whats-the-matter-with-ebooks/. ↑
- Kindle, the Amazon e-book platform, is intended for the retail market and is not an ‘institutional’ platform as are EBSCOhost, ProQuest Ebook Central, Cambridge Core, Oxford UPSO, JSTOR and Project MUSE. Until such time as Amazon has an institutional platform, it will always be an outlier in e-book supply to university libraries. ↑
- Jubb 2017, 65-66. ↑
- Dollar amounts provided in nominal terms. ↑