Comparing Public Institution-Level Data on Students’ Family Income and Financial Aid
Introduction and Summary
In a recent research report titled “Better Than We Thought,” our team at Ithaka S+R compared Integrated Postsecondary Education System (IPEDS) data on the parental income distribution of entering college students with two other public sources of socioeconomic information on that population. In the report, we first checked the consistency of the income distributions reported by IPEDS with a more comprehensive dataset of tax records collected by researchers Opportunity Insights. Finding that, at the level of aggregate groups of institutions with similar control and selectivity (“selectivity tiers”), IPEDS data are reasonably consistent with the Opportunity Insights data, we combined IPEDS data with data on institutional financial aid from the Common Data Set (CDS) to better understand how the allocation of financial aid lines up with student financial backgrounds. The previous report provided some evidence of a potentially concerning trend in the US higher education system: the share of college students from high-income households has increased over the past decade, as has the share of such students who receive need-based institutional aid.
In this second report, we extend our analysis to tackle a number of remaining open questions. As the earlier analysis was conducted at the aggregated selectivity tier level, we were unable to comment on the consistency of IPEDS and Opportunity Insights data for individual institutions.[1] Using an imputation strategy, we are now able to compare IPEDS and Opportunity Insights data on student income distributions at the institutional level. This allows us to test whether the results we found at the selectivity tier level were driven by subsets of institutions as well as identify whether there are particular features of institutions associated with consistency across the datasets.[2] In our assessment of how institutional financial aid allocations line up with student financial backgrounds, we also incorporate more detailed information from the CDS. In addition to updating our estimates of the share of students from high income backgrounds who received need-based financial aid, we also report on gaps in financial aid that leave students identified as having financial need either un- or under-funded. Finally, we conduct a more thorough analysis of the trend in the share of students coming from high income backgrounds.[3]
Consistent with our earlier selectivity tier level analysis, we find that IPEDS and Opportunity Insights are most consistent in their reported shares of students with parental incomes under $48,000, although even in that income range there are institutions for which the datasets are highly divergent. We also observe that reported shares of students by parental incomes tend to be more consistent across the datasets for private institutions relative to public institutions and for more-selective institutions relative to less selective institutions. In our analysis of IPEDS and CDS data, we find that private institutions and more selective institutions are more likely to designate students with parental incomes above $110,000 as having financial need and are much more likely to provide need-based aid to these students. We also identify significant gaps across selectivity tiers in the share of students identified as having financial need that received need-based financial aid, with private and more selective institutions more likely to provide institutional aid than public and less selective institutions.
Findings
Comparing IPEDS Data and Opportunity Insights Data on Student Income Distributions
As in our previous paper, our first analytical step is to compare IPEDS data on student income distributions to a similar dataset collected by researchers at Opportunity Insights.[4] The sample reported in IPEDS includes only first-time, full-time students who received federal financial aid and excludes both non-resident aliens and, for public institutions, students who pay out-of-state tuition. In contrast, the sample underlying Opportunity Insights data includes all students (and the parents or guardians who identify them as dependents) who file US tax returns. Since the sample underlying the Opportunity Insights data is broader, covering more of the entering student body at any given institution, and is sourced from a third party rather than from institutions themselves, we expect the income distribution reported by Opportunity Insights to be more comprehensive than that reported by IPEDS. In a sense, then, we can check the accuracy of the IPEDS data by assessing how it aligns with Opportunity Insights. Since IPEDS only reports the income distribution of students who receive federal financial aid, we assume that all students whose parental income is unknown belong to the highest income group, representing incomes greater than $110,000. Since Opportunity Insights data only covers students born between 1980 and 1991, we focus our analysis on students in the latest birth cohort, who likely would have enrolled in college in the fall of 2009.[5]
An empirical challenge arises when comparing the distributions reported by the two datasets. While IPEDS reports shares of students in fixed income groups ($0-30,000, $30,001-48,000, $48,001-$75,000, $75,001-110,000, and $110,001 and above), Opportunity Insights reports shares in income ventiles (at the selectivity tier level) or quintiles (at the institution level) based on a birth cohort-specific income distribution.[6] In order to construct the most direct comparison, we use an imputation procedure to map the shares reported by Opportunity Insights to the fixed IPEDS income groups.[7]
With this mapping in place, we can compare IPEDS and Opportunity Insights imputed shares across both institutions and selectivity tiers.[8] Figure 1 shows the tier-level deviations between IPEDS and Opportunity Insights by income group for each of the eight selectivity tiers consisting of four-year institutions. Positive (negative) values indicate that the IPEDS reported student share for a particular IPEDS income group is larger (smaller) than that reported by Opportunity Insights. A number of takeaways emerge from this figure. First, for six of the eight tiers, the deviation is highest for Group 5 (representing student incomes of $110,001 and above). This is likely due in large part to our inclusion of all students whose income is unknown according to IPEDS into Group 5, producing an overestimate of the IPEDS share in this income group. Second, for six of the eight tiers, Groups 1 and 2 have the two lowest deviations. These income groups roughly represent the population of students eligible for Pell grants, as the vast majority of Pell grant recipients had family income of $50,000 or less in 2009 while the upper limit for Group 2 is $48,000.[9] Although not all students in this income range would have received Pell grants, those who did would be federal financial aid recipients and thus be represented in the IPEDS data. Third, within the Highly Selective, Selective, and Non Selective tiers, private institutions exhibit lower deviations than public institutions for most income groups. This is due in part to the fact that the IPEDS sample does not include out-of-state paying students at public institutions, and thus introduces some bias to its reported income distribution.
Figure 1: Mean difference (OI vs. IPEDS) in student share by IPEDS income group
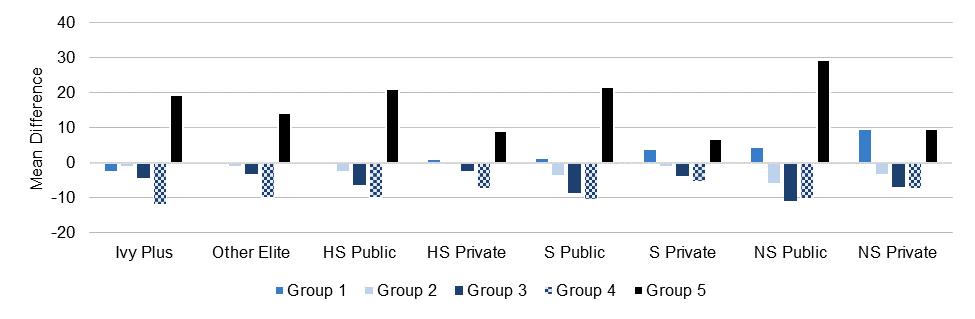
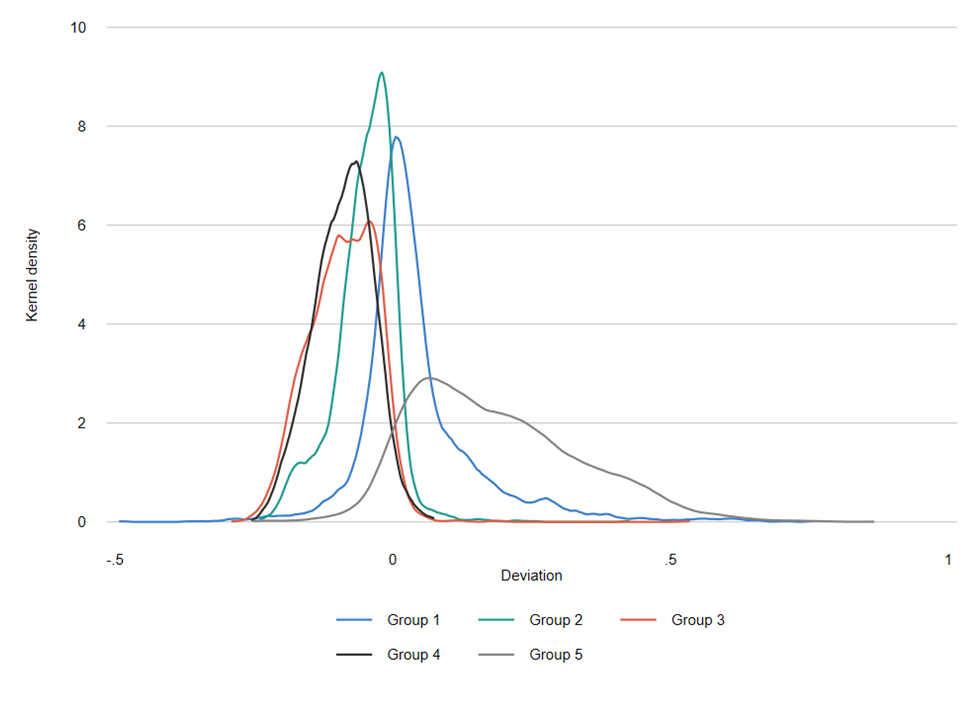
Figure 2a shows the distribution of institutional deviations by income group across all tiers.[10] Group 1 is tightly clustered around 0 and has fairly symmetric tails, indicating an average deviation of zero. The distribution for Groups 2, 3, and 4 have distributions that shift progressively toward the left, indicating both that IPEDS becomes less and less accurate as one moves up the income groups and that this inaccuracy tends to be due to understating student shares. Group 5 exhibits a much wider distribution, indicating more variance in institution level deviations and a heavy right tail extending into over-reporting territory.
Figure 2a: Distribution of IPEDS deviations from Opportunity Insights by income group, all institutions
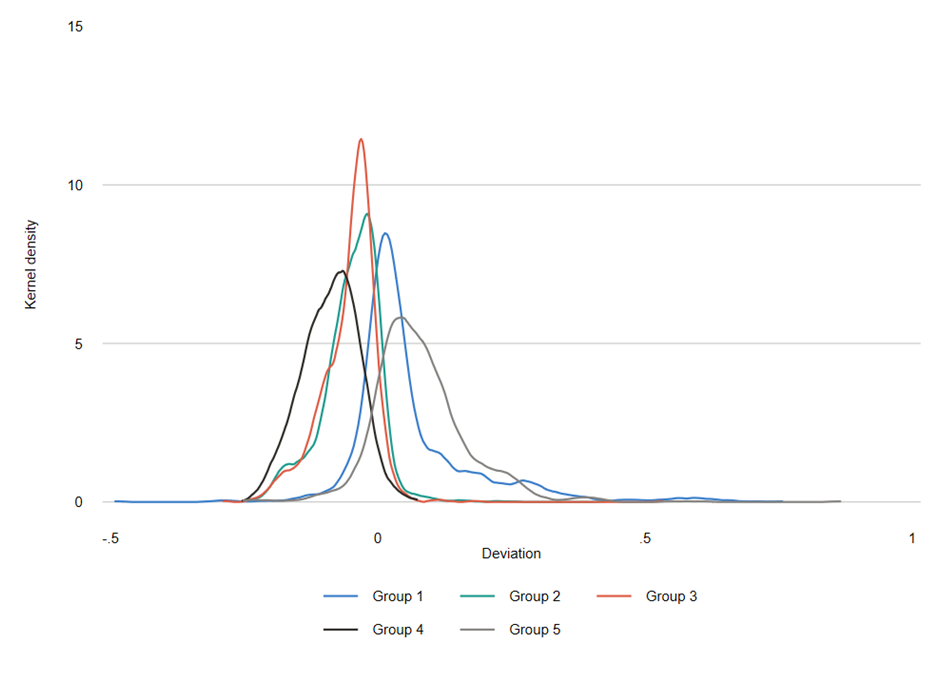
Figures 2b and 2c separate out the distributions for public and private institutions. From these, we see that the distributions for private institutions are more closely clustered around 0. Additionally, the Group 5 distribution is more closely clustered around 0 among private institutions than among publics. While 36 percent of private institutions have a deviation in Group 5 above 10 percentage points in absolute value, 96 percent of public institutions do.
Figure 2b: Distribution of IPEDS deviations from Opportunity Insights by income group, public institutions
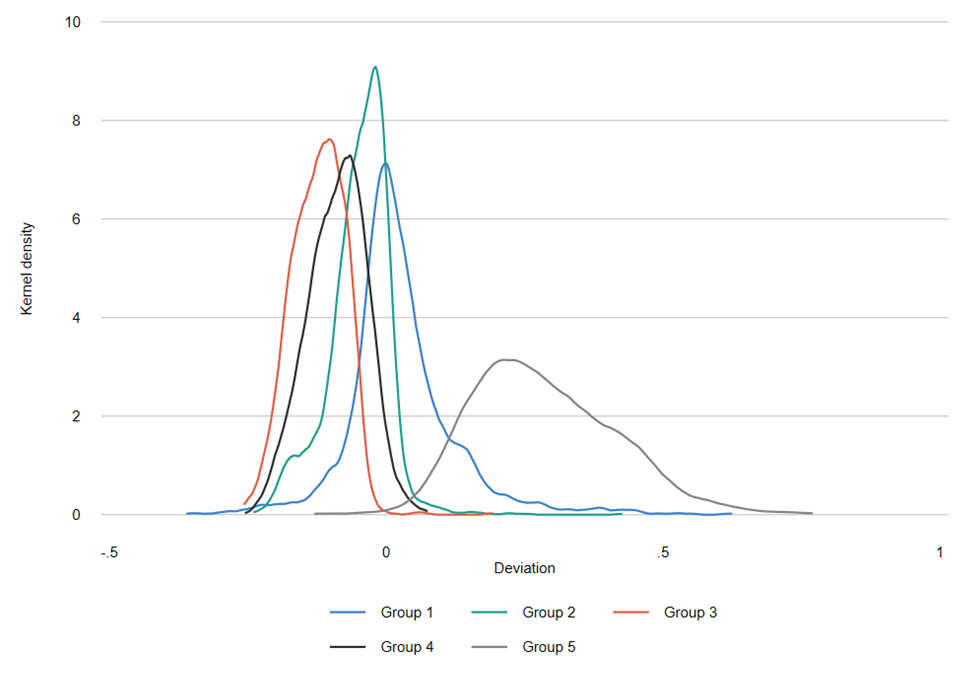
Figure 2c: Distribution of IPEDS deviations from Opportunity Insights by income group, private institutions
The five income groupings above are not the only policy-relevant divisions in the income distribution. For example, in rating the “economic diversity” of institutions, U.S. News & World Report uses the IPEDS reported percent of undergraduate students receiving Pell grants, which are awarded predominantly to students with family income below $60,000.[11] It is also possible to determine the consistency across the two datasets for any combination of income groupings, and we turn next to that analysis.
Given that the deviations reported in the figures above were lowest for Groups 1 and 2, it would not be surprising to find that this range (representing incomes of $48,000 and below) is the most consistent across the two datasets. Indeed, in our last report we found that no tier had a deviation greater than 3 percentage points for the combination of Groups 1 and 2.
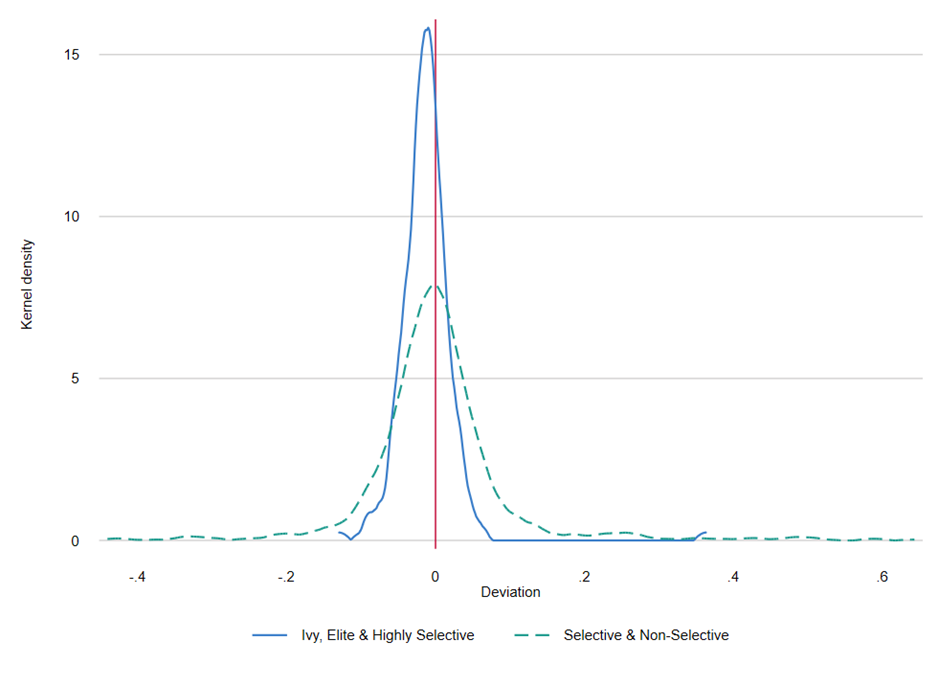
Figure 3a plots the distribution of deviations of Groups 1 and 2 combined for all institutions in all selectivity tiers. The mean and median deviations (0.07 and -0.48 percentage points, respectively) are each approximately zero, indicating that for both the average and typical institution IPEDS matches Opportunity Insights quite well. Yet there is considerable variation in deviations across institutions. Thirty-three percent of all institutions have a deviation greater than 5 percentage points in absolute value, and 13 percent have a deviation greater than 10 percentage points in absolute value. This suggests that while IPEDS data on student financial backgrounds is consistent with Opportunity Insights for Groups 1 and 2 for most institutions, there are many institutions for which the data sets provide different results. Figure 3b, broken out by selectivity tier groupings, indicates that IPEDS data tends to be more consistent with Opportunity Insights for more selective institutions, as the distribution for those institutions is clustered more tightly around a deviation of zero.
Figure 3a: Distribution of IPEDS deviations from Opportunity Insights, Groups 1 and 2, all institutions
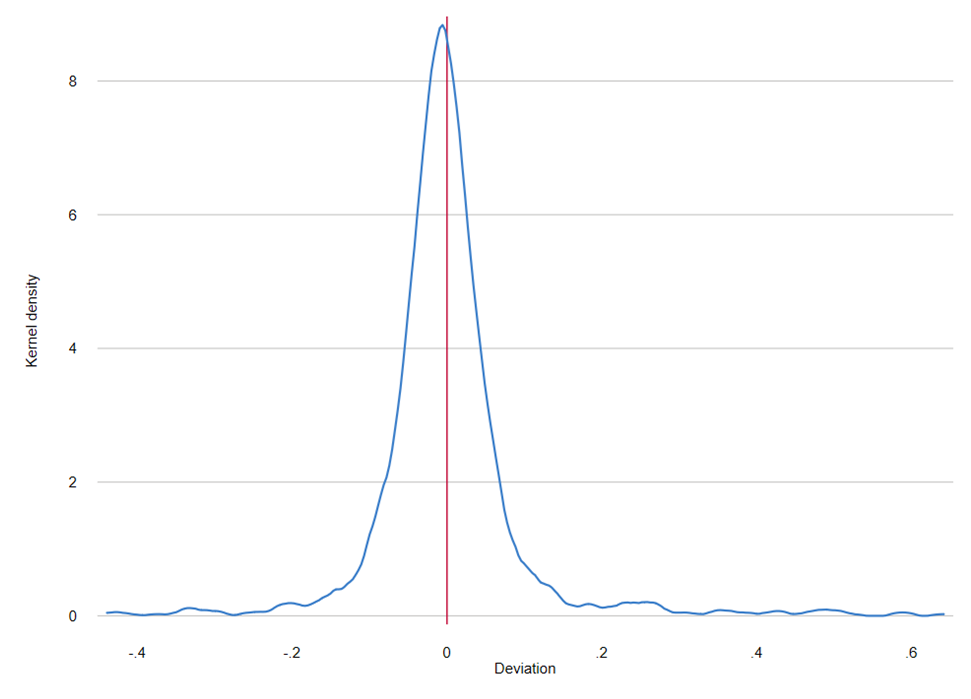
Figure 3b: Distribution of IPEDS deviations from Opportunity Insights, Groups 1 and 2, by selectivity tier grouping
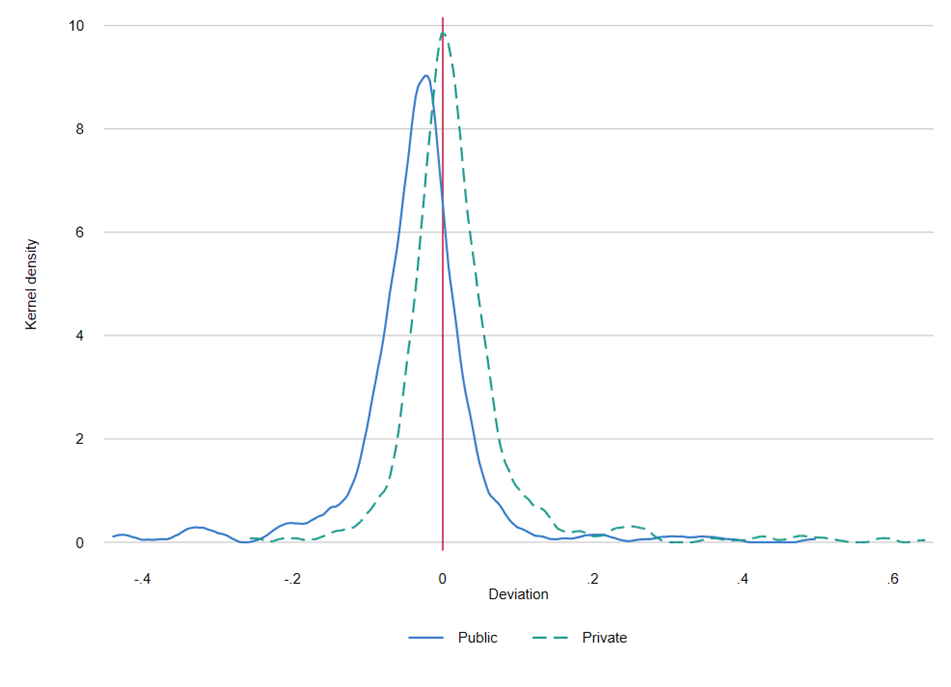
Which institutional features are associated with more or less consistency between IPEDS and Opportunity Insights data? One dimension that might matter is whether the institution is public or private. IPEDS reported shares do not include students paying out-of-state tuition for public institutions, and while we assume that these students belong to Group 5, it is likely that some share of these students actually fall into Groups 1 through 4. Figure 3c shows the distribution of deviations separately for public and private institutions. The mean and median deviations for public institutions are both -3 percentage points, indicating that for these income groups IPEDS tends to underestimate student shares relative to Opportunity Insights. The mean and median deviations for private institutions are 2 and 1 percentage points, respectively, indicating a slightly better fit to the Opportunity Insights data on average.
Figure 3c: Distribution of IPEDS deviations from Opportunity Insights, Groups 1 and 2, public vs. private
Of course, the differences we observe by institutional type can be influenced by other factors that vary by institutional type. One factor that might matter is the degree of selectivity of an institution. Figures 3d and 3e show the distribution of deviations for private and public institutions at selectivity tiers Highly Selective, Selective, and Non-Selective. For both public and private institutions, the Non-Selective tier has a distribution that is noticeably wider than the Highly Selective and Selective tiers. Since we see this among private institutions which would not be affected by shares of students paying out-of-state tuition, the inconsistency of the Non-Selective tier cannot be attributed to differences in student body composition alone. One hypothesis that could explain this result is the extent to which institutions actively support students in the process of applying for federal financial aid. That is, these differentials could be explained by higher shares of eligible students not applying for Title IV aid in the Non Selective class than in the Highly Selective or Selective classes.
Figure 3d: Distribution of IPEDS deviations from Opportunity Insights, Groups 1 and 2, public institutions
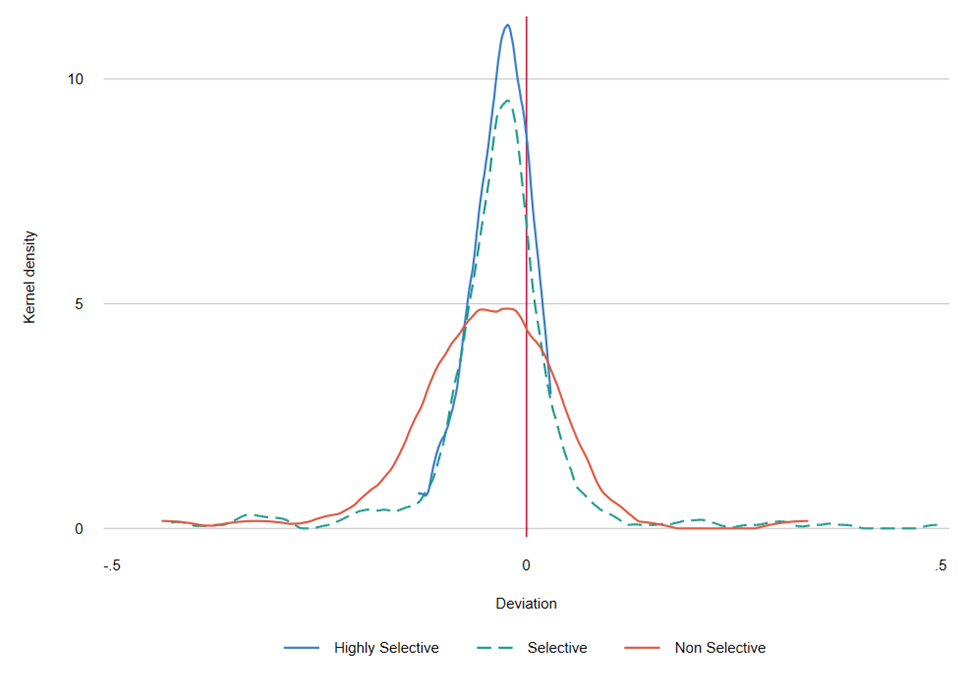
Figure 3e: Distribution of IPEDS deviations from Opportunity Insights, Groups 1 and 2, private institutions
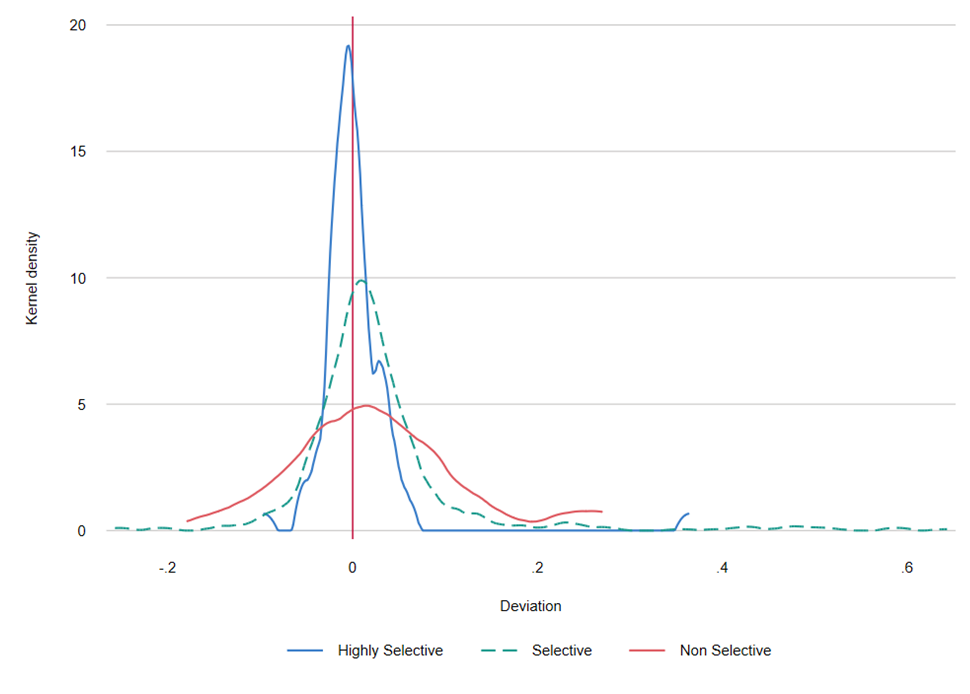
By comparing deviations across school types within selectivity tiers, another pattern emerges. Within every selectivity tier, the average deviation in absolute value of private institutions is less than or equal to that for publics. In the Highly Selective tier, private schools had an average deviation of -0.2 percentage points while public schools had an average deviation of -3.1 percentage points. In the Selective tier, private schools had an average deviation of 2.6 percentage points while public schools had an average deviation of -3.2 percentage points. In the Nonselective tier, private schools had an average deviation of 2.6 percentage points while public schools had an average deviation of -4.9 percentage points.
The above discussion has focused on deviations for the combination of Groups 1 and 2 representing incomes under $48,000 in 2008 dollars. This grouping was chosen because of the findings of our earlier report, which found that this range exhibited the lowest deviation at the tier level, and because these income groups individually are typically more consistent between IPEDS and Opportunity Insights than Groups 3, 4 and 5. However, we can apply the same methodology to other combinations of income groupings to further explore the data. Table 1 presents the mean and median deviations for four separate income ranges ($0 – $30,000; $0 – $48,000; $0 – $75,000; $0 – $110,000) for all institutions and for each of the eight selectivity tiers. This yields additional interesting findings. For example, although the average deviation for the income range $0 to $75,000 is just -2.4 percentage points for private institutions in the Highly Selective tier, it is -9.6 percentage points for public institutions within the same selectivity tier. In all but two tiers, the $0-$30,000 and $0-$48,000 income ranges each present smaller average deviations than the two broader income ranges, understandable given that higher shares of students in these lower income ranges receive federal financial aid. It is also notable that, for the most part, the mean and median deviations are approximately equal to one another. This suggests that the distribution of deviations is approximately symmetrical, i.e. for every institution whose IPEDS reported share is greater than the OI reported share, there is likely to be another institution for which the OI reported share is greater than the IPEDS reported share by a similar order of magnitude. Hence, the low deviation at the tier level.
Table 1
| Income group | |||||
|---|---|---|---|---|---|
| Tier | Statistic | $0 - $30,000 | $0 - $48,000 | $0 - $75,000 | $0 - $110,000 |
| 1 | Mean | -0.02 | -0.03 | -0.08 | -0.20 |
| Median | -0.02 | -0.04 | -0.08 | -0.22 | |
| 2 | Mean | -0.01 | -0.02 | -0.05 | -0.14 |
| Median | -0.01 | -0.02 | -0.04 | -0.14 | |
| 3 | Mean | 0.00 | -0.03 | -0.10 | -0.20 |
| Median | 0.00 | -0.03 | -0.09 | -0.20 | |
| 4 | Mean | 0.01 | 0.00 | -0.02 | -0.10 |
| Median | 0.00 | 0.00 | -0.03 | -0.10 | |
| 5 | Mean | 0.01 | -0.03 | -0.12 | -0.22 |
| Median | 0.00 | -0.03 | -0.11 | -0.21 | |
| 6 | Mean | 0.04 | 0.03 | -0.01 | -0.06 |
| Median | 0.02 | 0.01 | -0.02 | -0.05 | |
| 7 | Mean | 0.02 | -0.05 | -0.18 | -0.30 |
| Median | 0.02 | -0.05 | -0.18 | -0.29 | |
| 8 | Mean | 0.05 | 0.03 | -0.03 | -0.09 |
| Median | 0.04 | 0.01 | -0.04 | -0.07 | |
| Total | Mean | 0.03 | 0.00 | -0.06 | -0.13 |
| Median | 0.01 | 0.00 | -0.05 | -0.11 | |
IPEDS vs. CDS
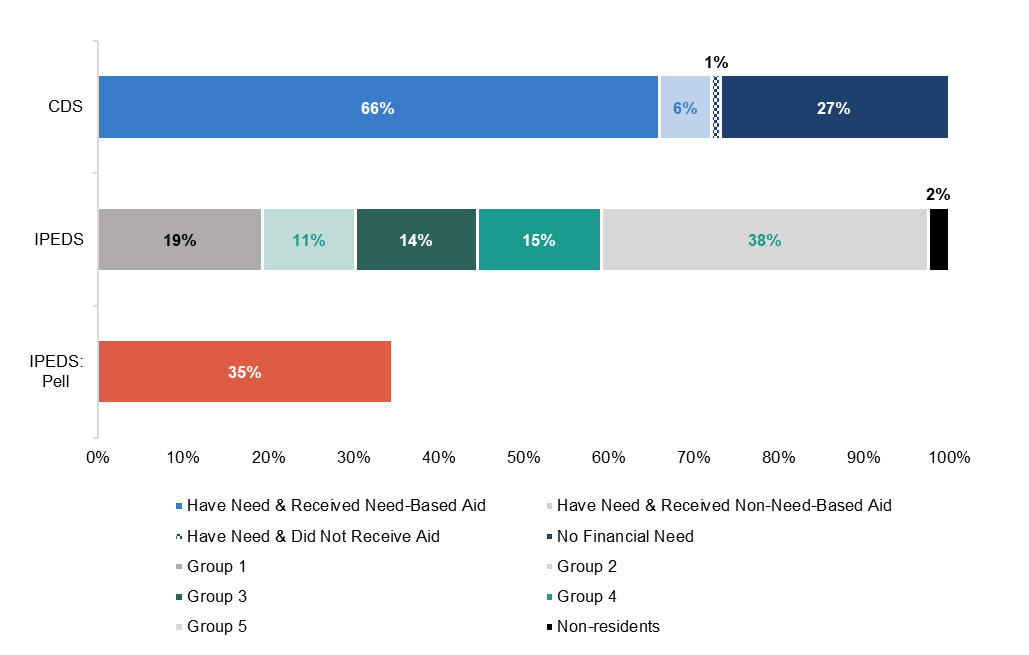
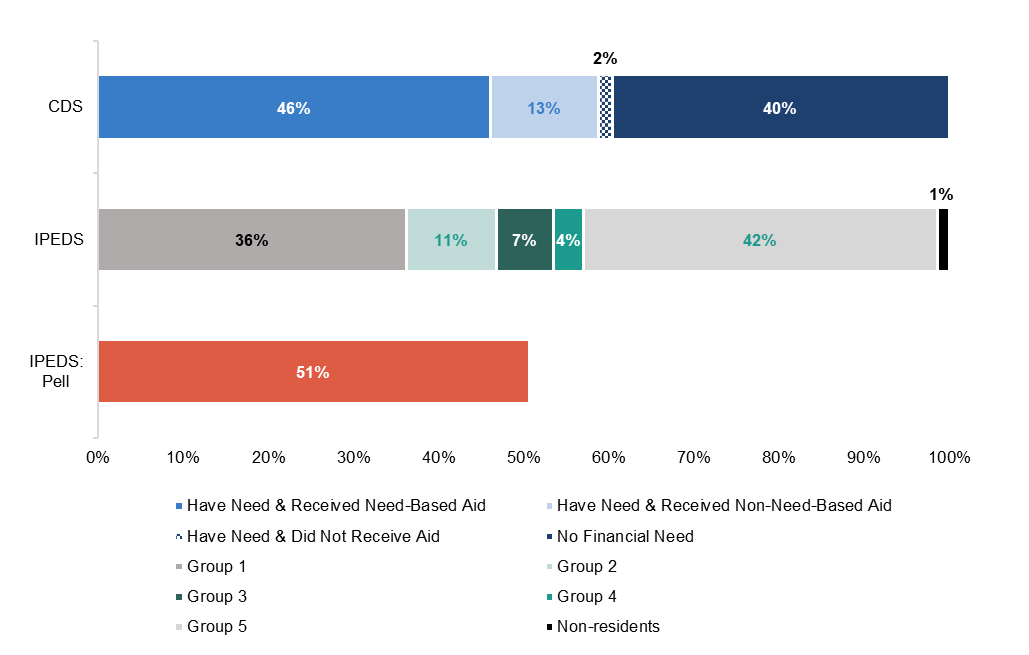
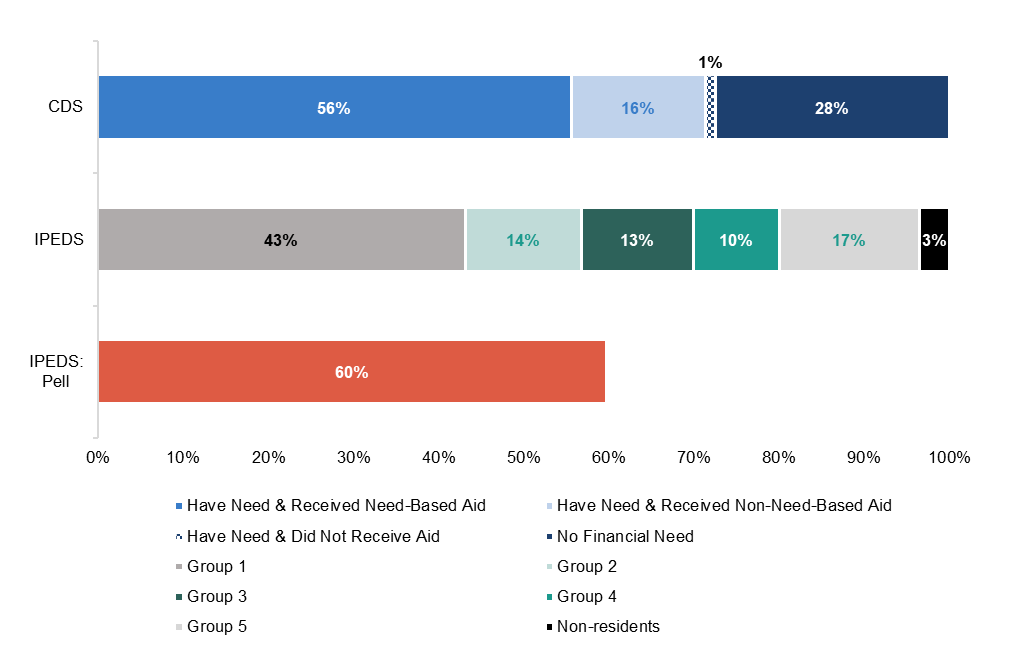
In the previous paper, we compared information from CDS on the share of students who received need-based aid with the student income distribution as reported by IPEDS. We now extend this analysis to include additional information from CDS: the share of students identified by an institution as having financial need, the share of these students that were awarded financial aid from any source, and the share that were awarded need-based scholarship or grant aid. Institution level data are reported here, while the tier level results are summarized in the appendix.
In Figures 4a, 4b and 4c, we plot the distribution of the share of students from Group 5 who receive need-based aid for public and private institutions within the Highly Selective, Selective, and Non-Selective tiers compared to the share identified as having financial need. In each case, there is wide variation across schools, but on average public institutions have a lower share of students receiving need based aid.
Figure 4a: Share of students from Group 5 identified as having need and received need-based aid, highly selective
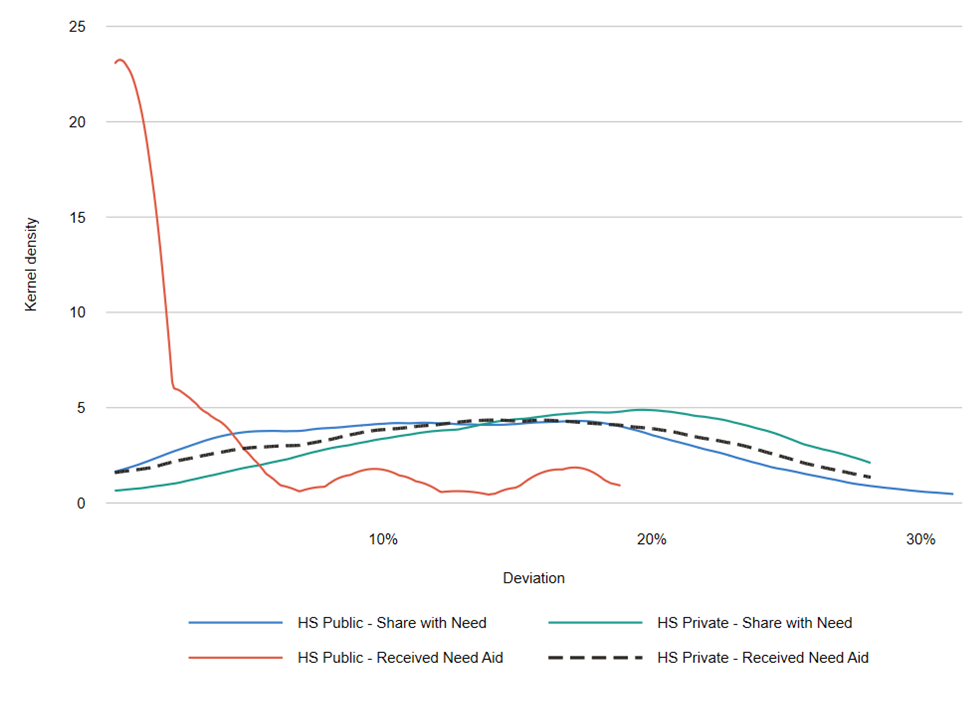
Figure 4b: Share of students from Group 5 identified as having need and received need-based aid, selective
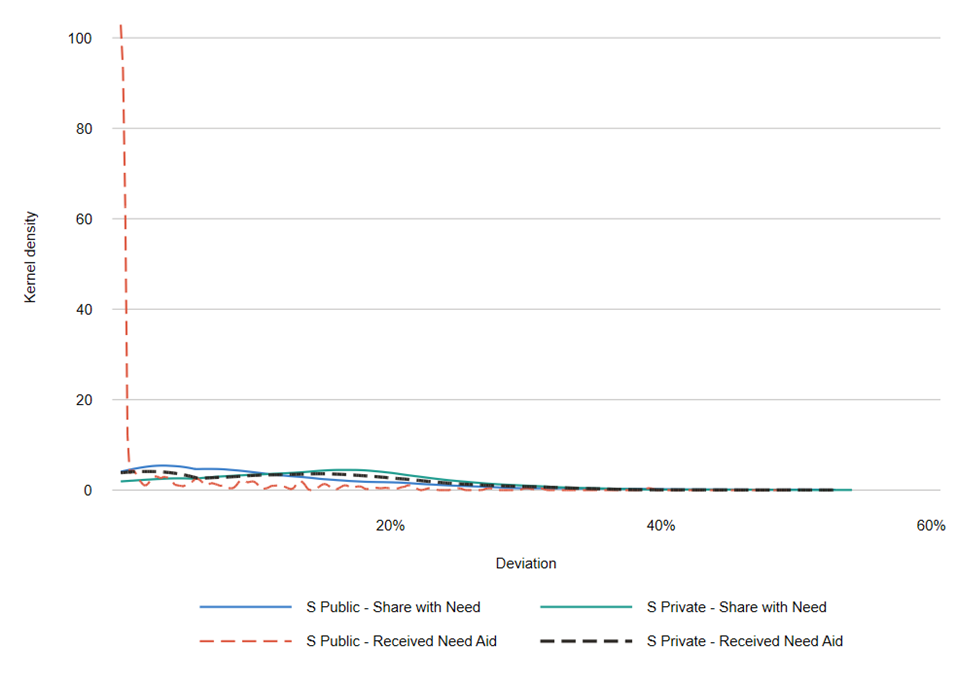
Figure 4c: Share of students from Group 5 identified as having need and received need-based aid, non-selective
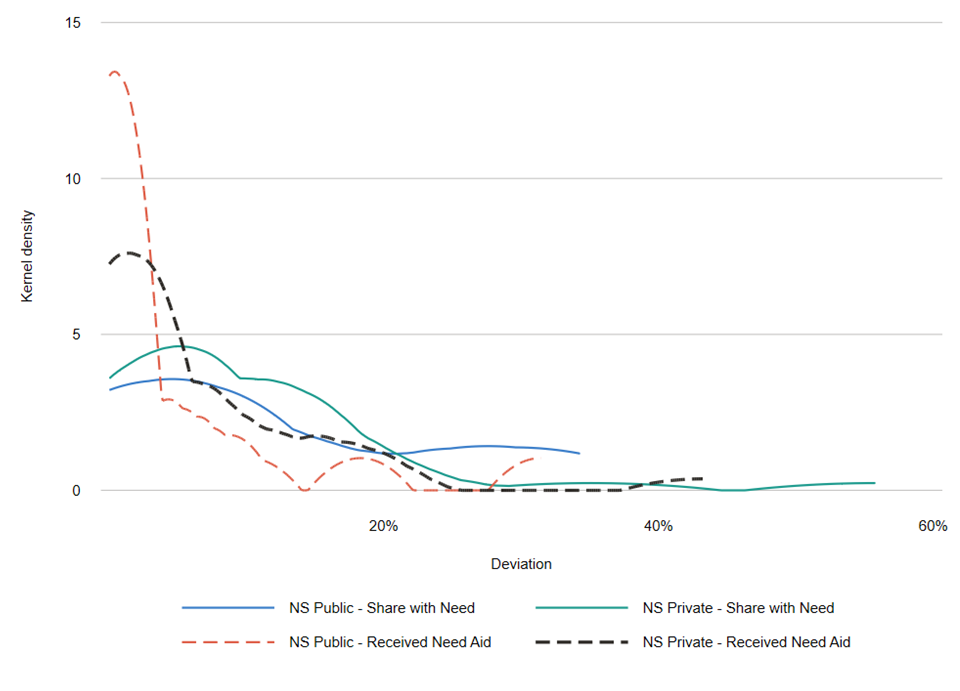
Of course, the share of students from Group 5 who receive need-based aid is based in part on the overall share of students in Group 5 who are identified as having financial need. Figures 5a, 5b and 5c show the distribution of the share of students from Group 5 identified as having need for each of the Highly Selective, Selective, and Non Selective tiers. We see that private institutions are more likely than publics to identify students from families with incomes above $110,000 as having financial need, in large part because need depends on the cost of attendance and not just incomes.
Figure 5a: Share of students from Group 5 identified as having need, highly selective
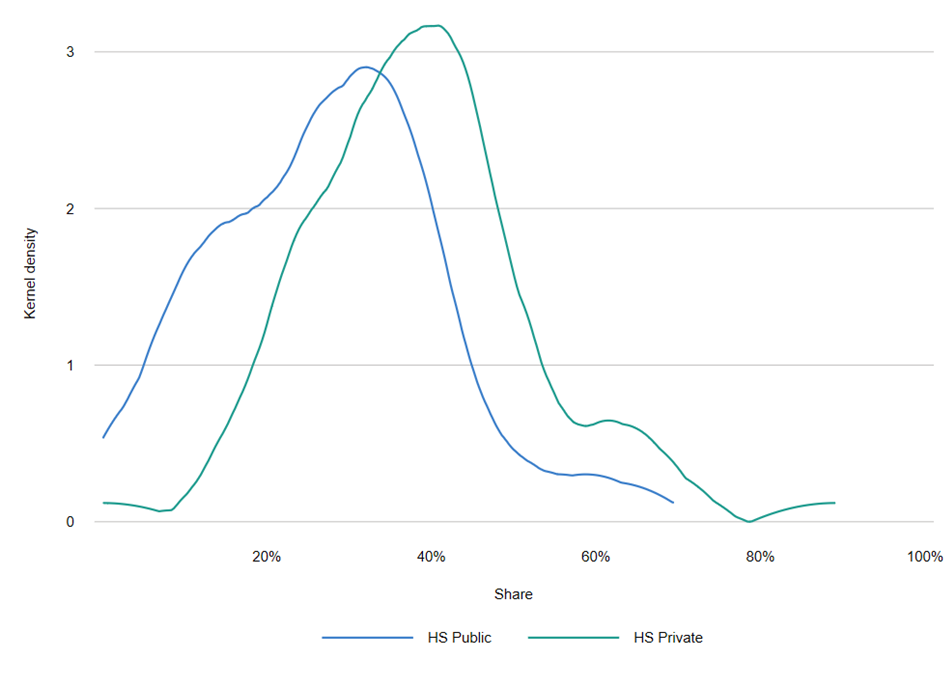
Figure 5b: Share of students from Group 5 identified as having need, selective
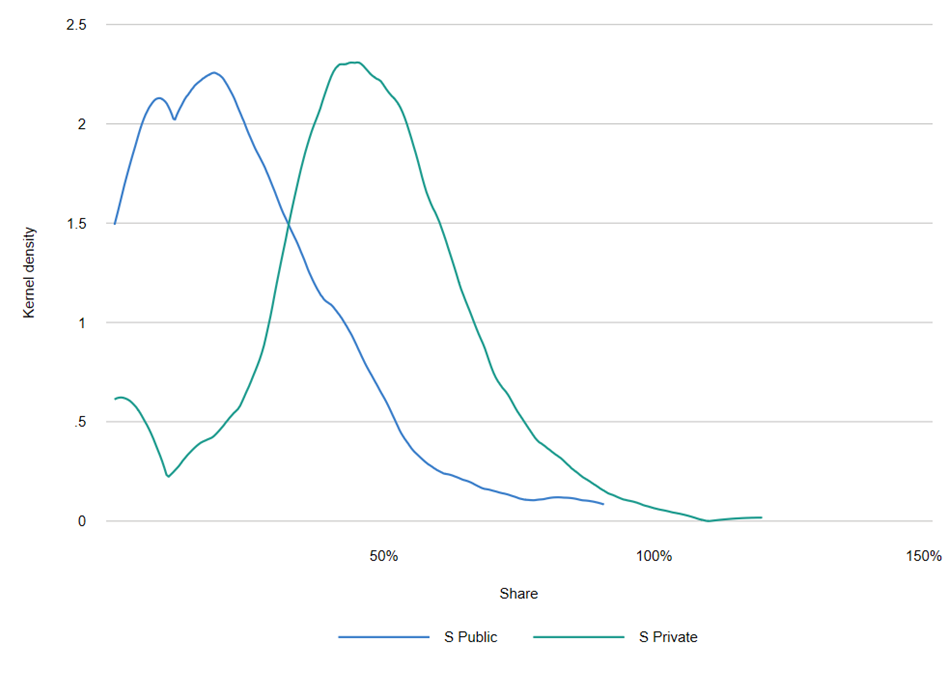
Figure 5c: Share of students from Group 5 identified as having need, non-selective
Note that the shares of Group 5 students who receive need-based aid reported in the above figures represent upper bounds, assuming that no international students receive need-based financial aid. For institutions that do not provide need-based aid for international students (indicated as part of the Common Data Set), we know precisely what share of students from Group 5 receive or are identified as eligible for need-based aid. The shares of institutions that award need-based financial aid to international students varies by tier. At the Ivy Plus tier, all institutions award need-based aid to international students. At the Elites tier, 75 percent do. Forty-eight and 41 percent of institutions in the Highly Selective Private and Selective Private tiers, respectively. Twenty-four and 23 percent of institutions in Highly Selective Public and Selective Public tiers, respectively. We do not know what share of international students receives need based aid compared to US citizens and permanent residents, however.
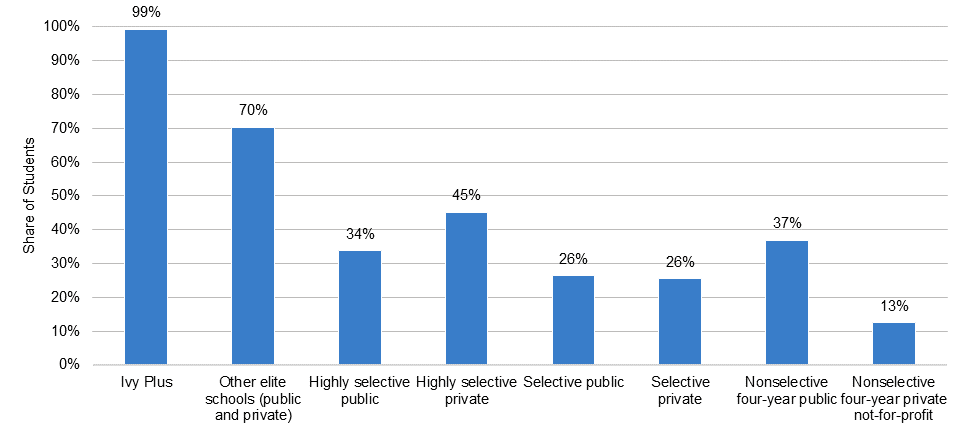
Although we noted earlier that at every tier almost all students identified as having financial need received some form of financial aid, we also observe as shown in Figure 6 that there is variation across tiers in the share of students with need who have their need fully met.
Figure 6: Share of students with financial need fully met
IPEDS vs. CDS time series analysis
In the last report, we compared IPEDS and CDS data for the 2009 and 2015 entering classes. Five of the six tiers studied showed an increase in the share of students with parental income greater than $110,000 or whose income was unknown. Each tier saw its share of international students increase over this time period. Taken together, this means that in five of the six tiers, the share of students from families with income under $110,000 declined over this time period. Meanwhile, in the three most selective tiers, the share of students receiving need-based financial aid increased. These changes are concerning because they could indicate that admissions, enrollment, or financial aid patterns are becoming less equitable over time. To further test this hypothesis, we now present the results of a more thorough time series analysis. Rather than compare the 2009 and 2015 entering cohorts in isolation, we assess the year-by-year trends between 2008 and 2015. Were the changes identified in our last report part of longer term trends, or could they have been driven by random cohort-specific features of the 2009 and 2015 entering classes?
Figure 7 shows the growth in the share of students in Group 5 over time for each selectivity tier. The sample is restricted to institutions that appear in all years of data. Each tier shows a slight decline between 2008 and 2010, perhaps due to the Great Recession, but then a gradual increase in the following years. To contextualize this trend, the figure also includes an estimate of the share of all US families with a family income greater than $100,000. This line seems to parallel the trend observed from IPEDS. While the share of US families earning more than $100,000 increased by approximately 6 percentage points between 2009 and 2015, no tier saw a Group 5 increase greater than 5 percentage points. The growth in the share of students in Group 5 ranged from 1 percentage point in the Selective Publics, 2 percentage points in the Elite and Highly Selective Publics tiers, 3 percentage points in the Ivy Plus and Highly Selective Privates tiers, and 5 percentage points for the Selective Privates tier. Thus, while all these tiers saw an increase in the share of their students from the highest income families, the increase was less than the increase in the general population.
Figure 7: Share of students in Group 5
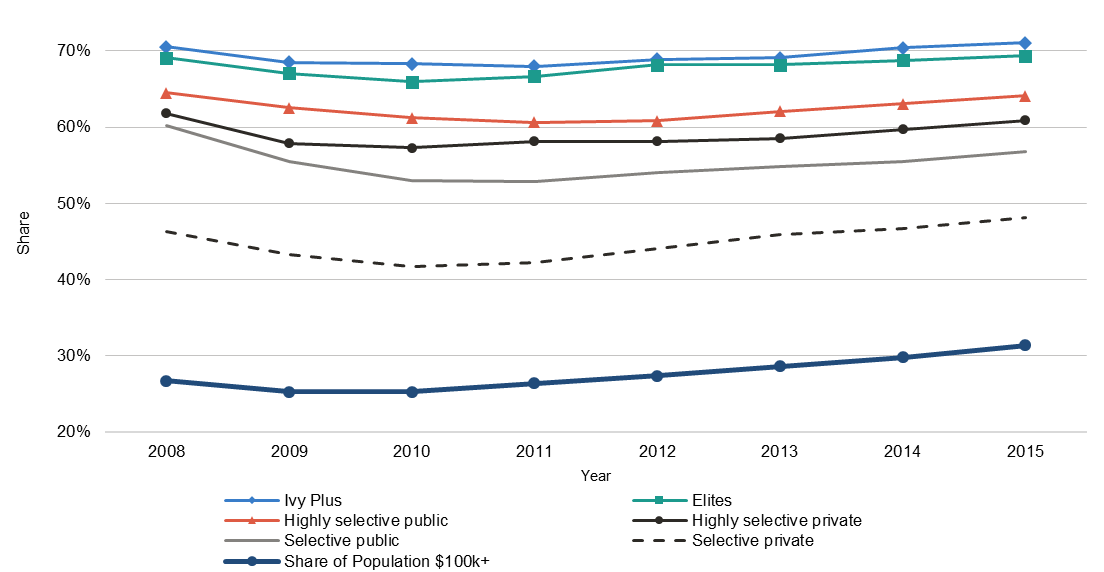
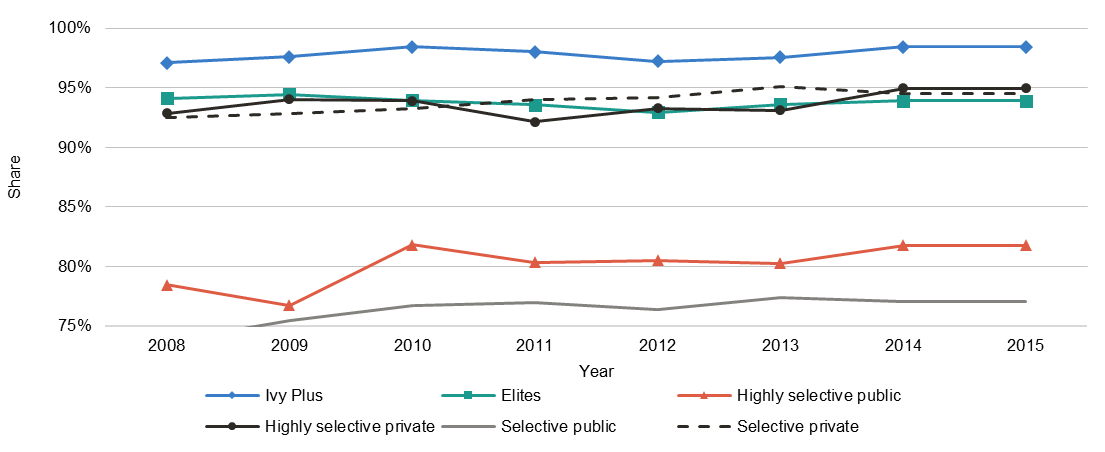
Figure 8 below displays the trend in the share of students identified as having financial need who receive need-based financial aid. Every tier exhibits either no change or a slight increase over this time span.
Figure 8: Share of students with need who received need-based financial aid
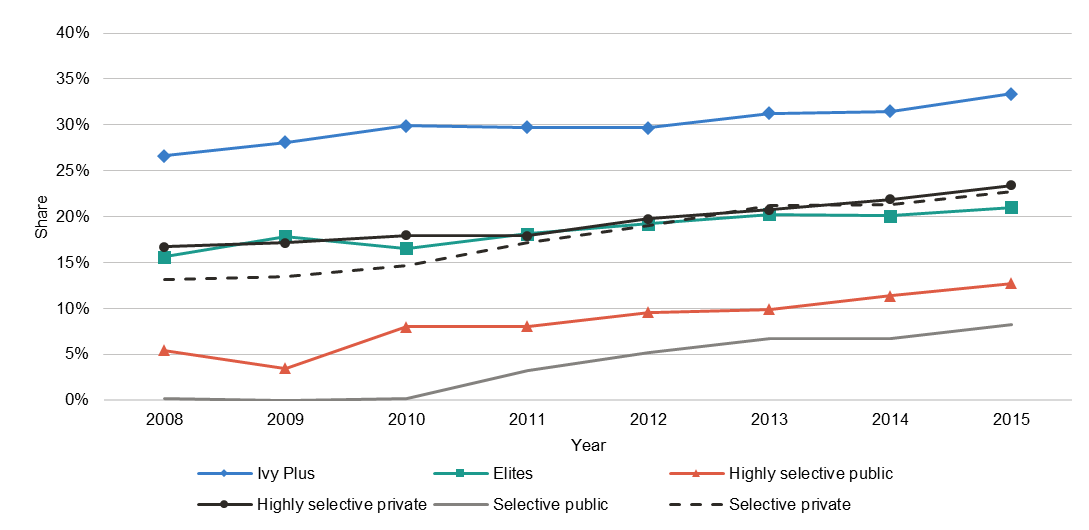
However, as seen in Figure 9, in every tier except Ivy Plus the share of students identified as having financial need whose need is fully met (through any source other than PLUS loans, unsubsidized loans, and private alternative loans) fell. This could indicate that, despite enrolling more students identified as having financial need, institutional financial aid budgets have not kept up with their students’ demands, especially if this change is correlated with an increase in the share of unmet need. Since we do not observe how individual institutions categorize students as having financial need or not, it is also unclear what role changing standards could play. For example, institutions could simply be identifying more students higher up the income distribution as having financial need while prioritizing their need-based financial aid support to those lower in the income distribution. Indeed, in Figure 10, we see in all tiers an increase in the share of students from Group 5 identified as receiving need-based aid.
Figure 9: Share of students whose need is fully met
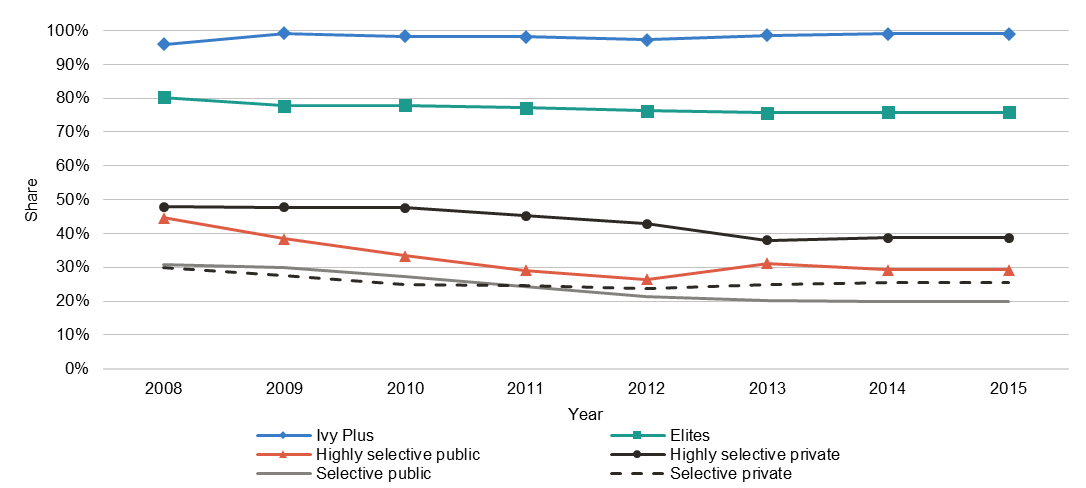
Figure 10: Share of students who receive need-based aid and are in Group 5
Conclusion
Given the discrepancies in how student financial backgrounds are recorded in IPEDS relative to data collected by Opportunity Insights, the imputation procedure used in our analysis allowed us to conduct as close to an apples-to-apples comparison as possible. Overall, our findings suggest that IPEDS data gives a fairly consistent account of the income distribution of students relative to Opportunity Insights, particularly for students from families with incomes under $48,000. While deviations between IPEDS and Opportunity Insights reported shares are small on average, the distribution of deviations is wide and many institutions have deviations that are quite large. We find that, for a number of reasons discussed, IPEDS reported shares are more consistent with Opportunity Insights for private institutions relative to public institutions and more-selective institutions relative to less-selective institutions.
Combining IPEDS data with information on financial aid available in the Common Data Set, we find that private institutions are much more likely than public institutions to identify students with parental incomes greater than $110,000 as having financial need and are also more likely to award these students with need-based financial aid. While we found that the growing share of students with parental incomes greater than $110,000 is actually less than the growth of that group in the national income distribution, we uncovered concerning gaps in the allotment of need-based aid to students with financial need. Fewer than 50 percent of students with financial need have their need fully met at all but the Ivy Plus and Other Elite schools.
These findings raise questions that may be pursued in further research. To what extent are changes in financial need designation driven by changes over time in the criteria used by institutions to determine financial need versus changes in the composition of enrolled students? How do these criteria vary across institutions, and how do they affect access and success of lower-income students? Are there policies, either at the institutional or state level, that have been demonstrated to lead to reductions in financial aid equity gaps? Finally, this analysis has demonstrated the usefulness of publicly available data on the financial background of students, although we were only able to assess the accuracy of such data reported by IPEDS as of the 2009-2010 academic year given the tax return-based data collected by Opportunity Insights. A decade has now passed, and it is not clear that the conclusions reached in this paper still hold true today. In order to effectively track equity in institutional admissions and financial aid decisions, it would be of tremendous value to both researchers and practitioners of higher education policy to have an openly accessible account of student income without the limitations and potential biases associated with the current reporting system through IPEDS.
Appendix
The Appendix figures present the share of students identified by an institution as having financial need, the share of these students that were awarded financial aid from any source, and the share that were awarded need-based scholarship or grant aid, all at the selectivity tier level. A few takeaways emerge.
First, for every tier except Non-Selective Privates, the share of students identified as having financial need extends well beyond the share of students with family incomes below $110,000. This indicates that at every tier there are students identified as having financial need who come from families with incomes greater than $110,000. Conservative estimates of this share range from 1 percentage point for Non-Selective Publics to 8 percentage points for Selective Publics, 10 percentage points for Highly Selective Publics, 12 percentage points for Selective Privates, 14 percentage points for Highly Selective Privates and Other elite institutions, and 21 percentage points for Ivy Plus.[12]
Second, the gaps between the share identified as having financial need and the share that receive any financial aid are nearly non-existent for the most selective tiers, but are slightly larger for public institutions and less selective tiers. The share of students with financial need who do not receive any financial aid ranges from 3 percentage points for the Highly Selective Public, Selective Public, and Non-Selective Public tiers to 1 percentage point for the Elite, Highly Selective Private, Selective Private, and Non-Selective Private tiers to essentially zero for the Ivy Plus tier.
Third, the gaps between the share identified as having financial need and the share that receive need-based scholarship or grant aid are larger for the tiers comprised of public institutions than for tiers comprised of private institutions. The share of students with financial need who do not receive need-based financial aid ranges from 2 percentage points for the Ivy Plus tier to 6 percentage points for the Highly Selective Privates tier, 7 percentage points for the Elites tier, 10 percentage points for the Selective Privates tier, 23 percentage points for the Non-Selective Privates tier, 24 percentage points for the Selective Publics tier, 27 percentage points for the Highly Selective Publics tier, and 28 percentage points for the Non-Selective Publics tier.
Finally, in each tier, the share of students awarded Pell grants exceeds the share of students who have reported family income below $48,000. This gap ranges from 2 percentage points for the Highly Selective Privates tier to 6 percentage points for the Selective Publics tier.[13]
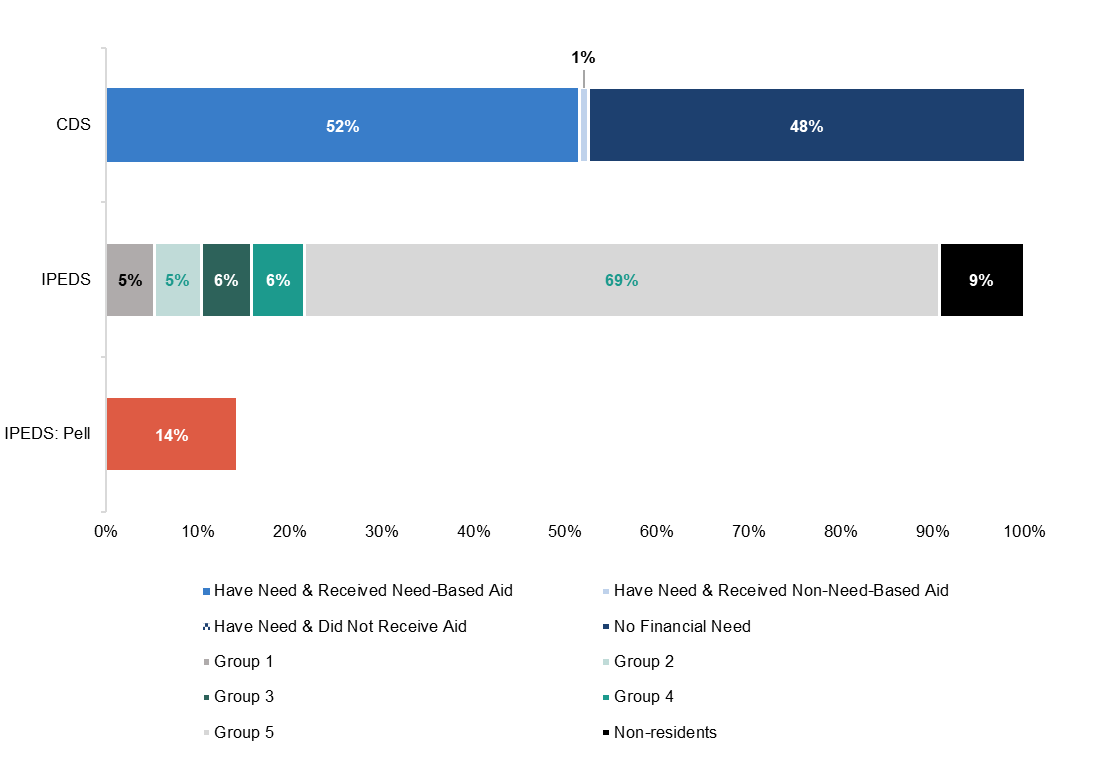
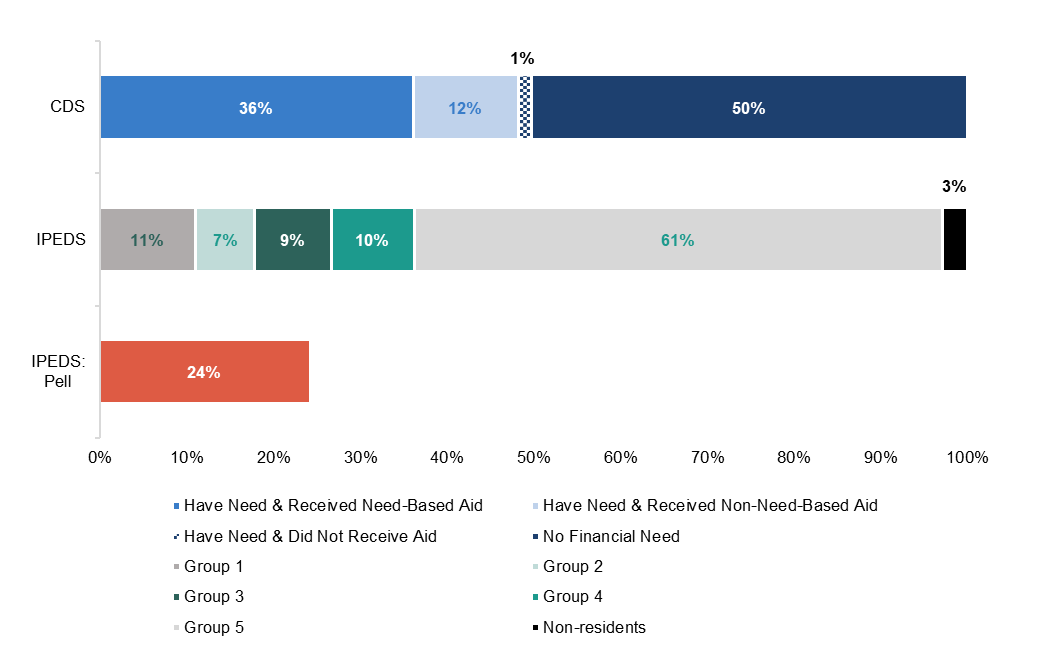
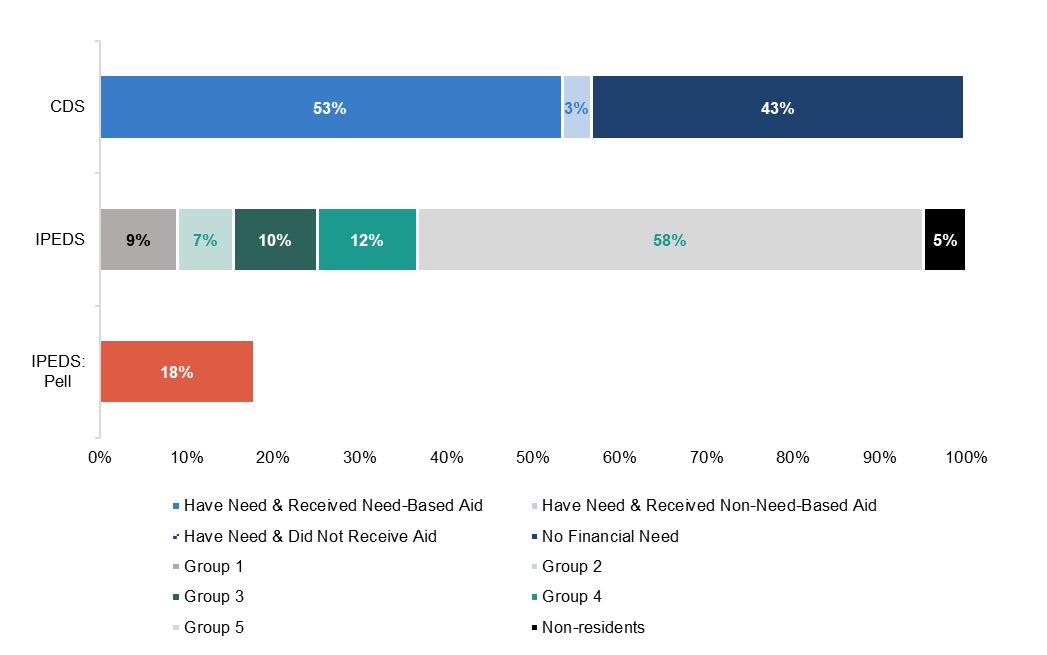
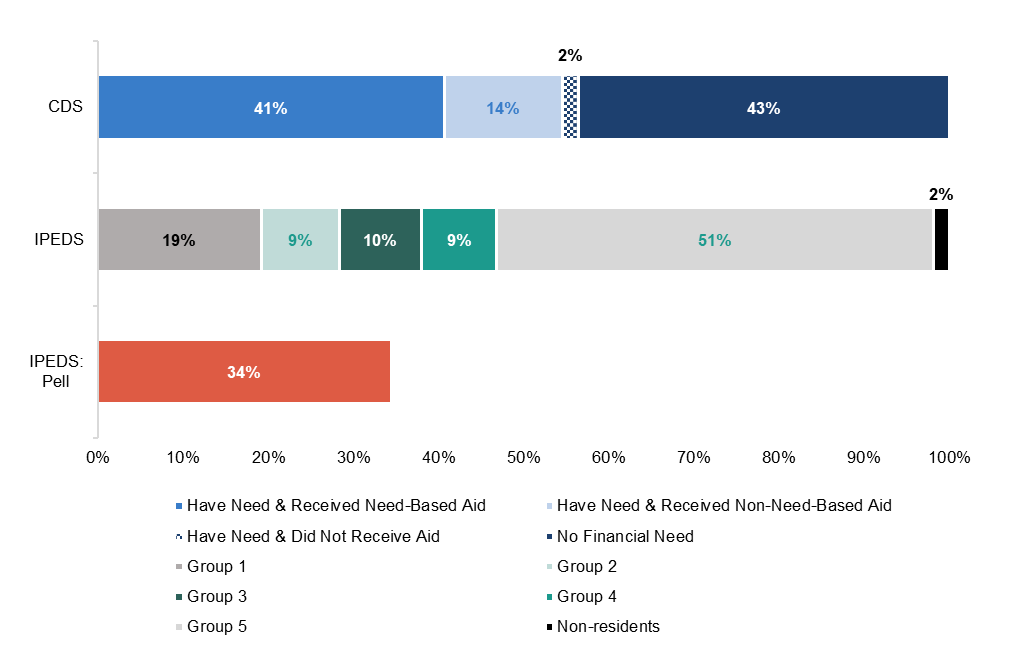
IPEDS Parental Income Distribution vs. CDS Need-Based Aid Graphs
Selectivity Tier: Ivy Plus
Highly Selective Public
Highly Selective Private
Selective Public
Selective Private
Nonselective four-year public
Nonselective four-year private not-for-profit
Endnotes
- We follow Raj Chetty, John N. Friedman, Emmanuel Saez, Nicholas Turner, and Danny Yagan, “Mobility Report Cards: The Role of Colleges in Intergenerational Mobility,” July 2017, https://opportunityinsights.org/wp-content/uploads/2018/03/coll_mrc_paper.pdf, in grouping institutions into the following selectivity tiers: Ivy Plus (Ivy League institutions plus Stanford, MIT, Chicago and Duke), Elites (Barron’s Tier 1 excluding Ivy Plus institutions), Highly Selective (Barron’s Tier 2), Selective (Barron’s tiers 3 through 5) and Non-Selective (Barron’s tier 9 and all four-year institutions not included in Barron’s selectivity index). ↑
- For example, if an institution does not require its students to borrow, fewer students not eligible for Pell grants will need to take out federal loans, and the institution will not be required to include them in their IPEDs reporting. ↑
- One reviewer suggested we compare an additional dataset, the results of the National Postsecondary Student Aid Survey (NPSAS), in our update. We have not done so, because NPSAS does not include the institution- or selectivity tier-level results or the college-entry cohorts that would enable a close comparison to the other datasets we investigate. ↑
- Raj Chetty, John N. Friedman, Emmanuel Saez, Nicholas Turner and Danny Yagan, “Mobility Report Cards: The Role of Colleges in Intergenerational Mobility,” Working Papers 2017-059, Human Capital and Economic Opportunity Working Group, August 2017. ↑
- We also conducted this analysis for students who enrolled in college in the fall of 2008, the earliest year for which IPEDS collected data on student financial backgrounds, and found the results to be substantially similar to the 2009 analysis. For this reason, we only present the 2009 analysis. ↑
- The income distribution used in OI is the distribution of the parents with children in the birth cohort, with income measured as the average parents’ family income over the five years when the child is aged 15 to 19. ↑
- The imputation procedure we use is as follows: First, we locate the Opportunity Insights parental income percentile cutoff that is closest to the threshold for a given IPEDS income group. For example, the closest cutoff to the upper threshold for IPEDS Group 1 (representing incomes of $30,000 and below) is the 35th parental income percentile which corresponds to incomes up to $30,100. Second, we estimate the share of students within each percentile by dividing the reported number within each ventile by five. This assumes an even distribution of students within each reported parental income ventile, a method we followed because it was the most effective at reducing errors in imputed shares within the five IPEDS income groups. We tested this by comparing the reported ventile shares with imputed shares generated using a faux dataset of quintile (aggregated ventile) shares using a variety of alternative imputation methods. Finally, we aggregate the percentile shares within each imputed income group. In our example, that means that the imputed student share for Group 1 is the aggregate of estimated shares for percentiles 0 through 35. ↑
- Selectivity tiers are defined by Opportunity Insights. We focus our analysis on the six most selective tiers: Ivy Plus, Other Elite, Highly Selective Public, Highly Selective Private, Selective Public, and Selective Private. ↑
- In 2009-10, approximately 95 percent of Pell students were from families who earn less than $50,000 annually. Calculations by Ithaka S+R staff using data from the US Department of Education, 2009-10 Federal Pell Grant Program End-Of-Year Report, Table 2, https://www2.ed.gov/finaid/prof/resources/data/pell-2009-10/pell-eoy-09-10.pdf. ↑
- Note that because institutions are not equally distributed across selectivity tiers, the distribution reported in this figure (and subsequent figures also based on the full sample of all institutions) are skewed toward tiers that include a greater number of institutions. In particular, the figures are skewed toward the Selective Public and Selective Private tiers, which together account for 74 percent of all institutions. Rather than using institutions as the unit of observation, student weighted shares could also be calculated.
Selectivity Tier Number of institutions Share of all institutions Ivy Plus 12 1% Other Elites 65 5% Highly Selective Public 19 1% Highly Selective Private 71 6% Selective Public 347 27% Selective Private 609 47% Non-Selective Public 76 6% Non-Selective Private 92 7%
↑ - U.S. News & World Report, “Economic Diversity.” Accessed January 27, 2020. https://www.usnews.com/best-colleges/rankings/national-universities/economic-diversity ↑
- These conservative estimates are based on the assumption that all international students receive need-based financial aid and are thus calculated by subtracting the share of students receiving need-based financial aid from the sum of the shares of students in Groups 1 through 4 along with the share of international students. If we instead assume that no international students receive need-based financial aid, the shares are as follows: 31 percentage points for Ivy Plus, 19 percentage points for Other Elites, 20 percentage points for Highly Selective Private, 13 percentage points for Highly Selective Public, 14 percentage points for Selective Private, 10 percentage points for Selective Public and 3 percentage points for Non-Selective Publics. The true shares lie somewhere in between these conservative and liberal estimates. ↑
- These gaps do not necessarily indicate that the shares reported by either dataset are problematic. In fact, according to the US Department of Education’s 2009-2010 Federal Pell Grant End-of-Year Report, 9.1 percent of all dependent students who received Pell Grant support came from families with incomes greater than $50,000. ↑