Ithaka S+R Art Museum Director Survey 2020
Foreword
This inaugural Art Museum Director Survey launched in early 2020. At the time, we did not know that a global pandemic would claim the lives of millions over the following months, that it would raise unemployment in the United States to levels not seen since the Great Depression, that it would fundamentally alter the way we celebrate birthdays and weddings, and the way we grieve our losses.
We also did not know that the continued killing of Black civilians by police would spark a national reckoning and historic protests. The Washington Post reports that nearly one thousand people have been killed by police in the United States in 2020 so far, with Black and Hispanic/Latinx people killed at a radically disproportionate rate.[1] While the world weathers a global pandemic, the United States confronts persistent structural inequities, which require changes at local, state and national levels.
What is the role of an art museum in such a context? Perhaps it is not so different from what it has been at its best—to serve as a hub of community engagement, a center for reflection, imagination, and healing, while participating in the construction of cultural narratives that help us make sense of our experiences and the experiences of others. This work in the coming years will be increasingly urgent and complex, as each of us will have been changed by our experiences during this pandemic as we adapt and respond to the varied manifestations of our new social norms.
Museums may find themselves fighting for their continued existence in the years to come. Ongoing closures have stripped museums of crucial revenue streams, threatening their financial sustainability. As a result, many staff who serve the public most directly have been furloughed or laid off, with BIPOC staff disproportionately suffering the impact. Financial outlooks for many museums are increasingly bleak, while public demands for rapid shifts in the culture and operations of these institutions are increasingly urgent.
The 2020 Art Museum Director Survey was fielded in the winter of 2020 and closed in March when it became clear that COVID-19 posed a crisis for each participating institution. Ithaka S+R was lucky to secure enough responses by then to provide a snapshot of the perspectives of directors immediately preceding this transition. This data reveals the state of the field as it entered into a crisis—though more research is needed to understand how these perspectives have changed over the last several months. We are grateful to our respondents, who have provided a benchmark in this first iteration of the Art Museum Director Survey. This benchmark provides evidence of the perspectives of art museum directors immediately preceding the COVID-19 pandemic and will allow us to iteratively measure change over the years as our institutions continue to adapt to new social and environmental challenges.
We are grateful to the Kress Foundation for supporting this important initiative.
Art Museum Director Survey 2020
Art museums serve a unique social role in that they operate between the public sphere, the academy, the art market, and the philanthropic sector. They are invaluable resources for scholars and also serve school children, adults, seniors while engaging broadly in the cultural life of their cities. Beyond these roles, they also have the responsibility to maintain and care for a collection of objects for future generations in perpetuity.
The Ithaka S+R Art Museum Director Survey 2020 examines strategy and leadership issues from the perspective of the directors of art museums across the United States. This project aims to provide leaders in the cultural sector with a rich and comprehensive view into directors’ visions and the opportunities and challenges they face in leading their organizations. It will also provide a baseline of data which will allow us to measure change over time.
In winter 2020, we invited art museum directors at 303 municipal and academic museums in the United States to take the survey; 149 completed the survey for a response rate of nearly 50 percent.[2] This survey was fielded prior to the pandemic, and when it closed March 30 it was clear that the pandemic posed an urgent emergency for the organizations we were surveying. In that sense, these findings offer a snapshot of perspectives and priorities prior to the pandemic.
Key Findings
Leadership and Strategy
Prior to the pandemic, art museum directors viewed education and public programming as top priorities for fully realizing their organizational missions. Social justice programming was not seen as a high priority, though directors strongly agreed that internal changes—such as diversifying the board of trustees, ensuring pay equity among staff, and improving accessibility—are necessary to make their institutions more equitable. Fundraising and communication skills, along with an ability to manage change, are seen as the most critical skills for the job of an art museum leader.
Budget and Staffing
The vast majority of museum expenses are allocated toward personnel, which has since been significantly impacted by the pandemic as museums have furloughed and laid off staff in anticipation of major losses in income. Endowment income and private philanthropy are the largest components of museum revenue. Earned income also composes a significant portion of revenue, highlighting the financial vulnerability museums face during physical closure.
Visitors and the Public
Museums have strong on- and off-site programs, particularly for K-12 education, as well as partnerships with local cultural organizations. They do not view each other as competitors, but are more concerned about the collective perspective of the public towards the museum field.
Collections
Most museum directors would like for it to be easier to deaccession works that do not fit strategically in the collection. They estimate that such works constitute roughly one tenth of their collections on average. Diversifying collections based on artist identity (i.e. race, ethnicity, gender) is seen as a priority in acquisition strategies.
Methodology
Participation
We sent our initial invitation to the survey on February 25, 2020 to 303 art museum directors. By the end of fieldwork on March 30, we received completed responses from 149, for an overall response rate of 50 percent. The initial invitations were signed by Christine Anagnos, executive director of the Association of Art Museum Directors (AAMD) and Laura Lott, president and CEO of the American Alliance of Museums (AAM), with a reminder message signed by Max Marmor president of the Kress Foundation. This response rate was equivalent across museum types with 50 percent of directors at both academic and municipal museums completing the survey. As fieldwork began prior to the beginning of the COVID-19 pandemic, we decided not to continue sending reminder messages to respondents and close the survey early to help reduce the burden on participants.
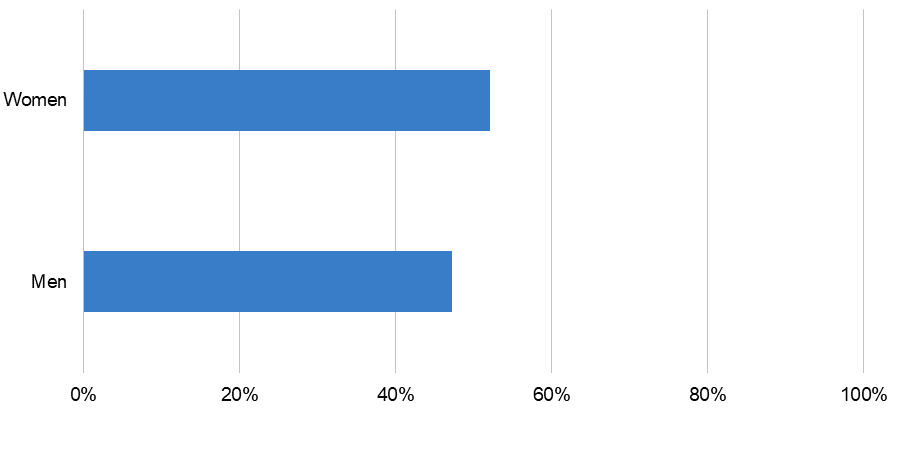
The majority of respondents reported being white (91 percent) and women (52 percent). On average, museum directors have been at their current institution for nine years and have worked in the museum sector for 27 years. Their most common previous position is director at another institution (43 percent). At 45 percent of participating museums there is a set entrance fee, and at nine percent there is a suggested donation. More information on participant demographics can be found in Appendix A.
Figure A. Please select the population group or groups that you most closely identify with from the list below. Percentage of participants who selected each response option.[3]
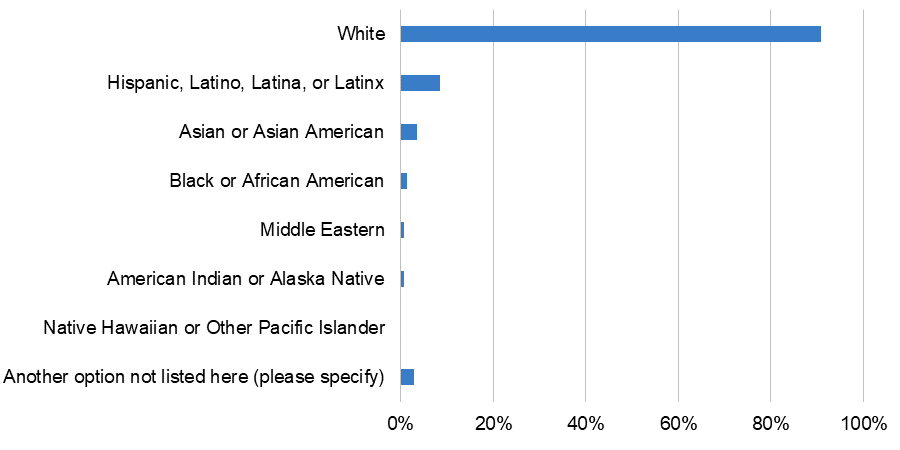
Figure B. With which gender(s) do you most identify? Please select all that apply.
This population has unique insight into the current institutional strategies and priorities at their own museums and in the broader field. Their ability to set the strategy of a museum makes their perspective important to consider when studying the trajectory of the cultural sector. However, their opinions are not representative of the field overall, and in our analysis they are not treated as a proxy for their staff. We expect that surveys of museum staff in different departments and levels of seniority would yield valuable insights that would be highly differentiated from the perspective of directors.
Questionnaire
The Ithaka S+R Museum Survey 2020 is our first national survey of art museum directors developed in partnership with the Association of Art Museum Directors (AAMD) and with support from the Kress Foundation.
To determine the themes of the survey, we spoke to a group of external advisors who provided input on current trends impacting academic and municipal museums in the United States (they are acknowledged by name below). We discussed fiscal health, organizational and talent management, public trust and engagement, and collections care and stewardship, and subsequently developed corresponding questions for the instrument.
Based on these interviews, we drafted a questionnaire and solicited feedback from the advisors. After receiving feedback from these advisors on a draft instrument, we tested the survey via cognitive interview with eight additional museum directors.[4] During these interviews, we received further feedback on the clarity of the survey and relevance to directors at a variety of different institution types. We then made final revisions and prepared the survey for fieldwork.
The final survey included randomization on the order of items within question sets as well as display logic on a few items such that they would only display to participants if they selected particular responses.
Analysis
To identify the distribution of responses at a high level, we ran frequency or descriptive analyses (averages) on each response option for each survey question. We used averages for items in which respondents were asked to generate a percentage (e.g., the percentage of budget derived from different sources) and frequencies for the remaining questions. Frequencies and averages were computed on both the aggregate data and subgroup data (e.g. grouped by museum type). These analyses were used to create the figures shown in this report.
In figures based on frequencies, we display responses at the high end of the scales used. For items with 4-7 point scales, we display frequencies of the top two response options.
Additional subgroup analyses were performed for groups with at least 30 respondents. In cases where some groups reached this threshold while others did not, we created dummy variables for the groups with enough respondents. When possible, responses were recoded to align with these variables.
Using these groups, we ran independent samples t-test, and one-way ANOVA with Tukey’s HSD tests when appropriate. These tests allowed us to make all possible comparisons between groups. Results of these analyses are reported throughout this report if they are statistically significant at the p <.05 level.
Acknowledgements
Our advisory board helped us establish the questionnaire and provided feedback at key stages of the process. We would like to acknowledge and thank them for their help with this project:
- Brent Benjamin, Barbara B. Taylor Director of the Saint Louis Art Museum
- Rod Bigelow, Executive Director & Chief Diversity and Inclusion Officer, Crystal Bridges Museum of American Art
- Terry Carbone, Program Director for American Art, The Henry Luce Foundation
- Jill Deupi, Beaux Arts Director and Chief Curator of The Lowe Art Museum, University of Miami
- Lori Fogarty, Director & CEO, Oakland Museum of California
- Lial Jones, Mort and Marcy Friedman Director and CEO, Crocker Art Museum
- Heather MacDonald, Senior Program Officer, The Getty Foundation
- Elizabeth Merritt, Vice President for Strategic Foresight, American Alliance of Museums and Founding Director of the Center for the Future of Museums
We are grateful to our partners from AAMD on this project, Chris Anagnos, Alison Wade, and Stephanie Yao, as well as Laura Lott from AAM, and Max Marmor and Lisa Schermerhorn from the Kress Foundation for their guidance and support.
Finally, we would like to thank our colleagues who contributed to our work on this project in a variety of ways, including Christine Wolff-Eisenberg, Roger Schonfeld, and Kimberly Lutz. In particular, this work would not be possible without the significant contributions of our colleague Nicole Betancourt who administered the survey.
Leadership
One of the goals of the Art Museum Director Survey 2020 is to provide insight into museum directors’ perceptions of the various roles of their institutions. We also seek to understand how directors view their own role in the museum and how they manage limited resources. To this end, we have queried respondents on what has been most valuable, as well as most constraining, in executing strategy.
Competencies
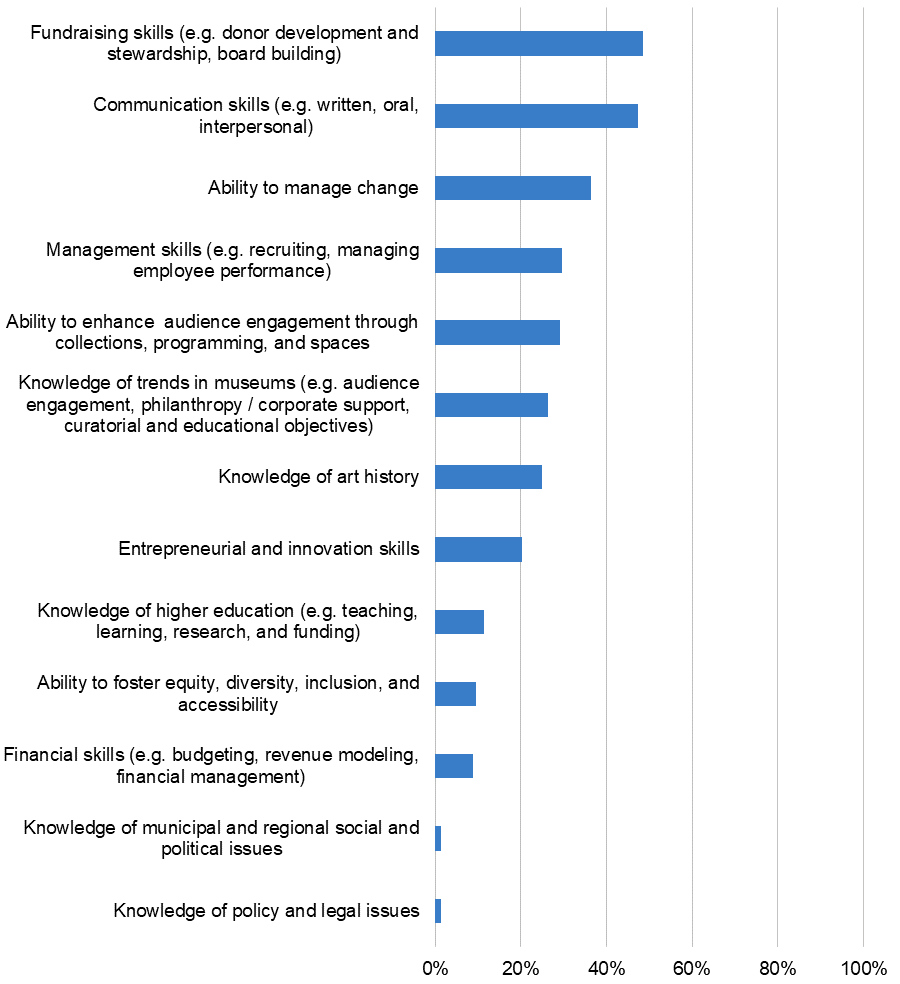
Directors were asked to identify which competencies have been most valuable in their role as museum leaders. As can be seen in Figure 1, fundraising skills and communications skills were chosen most frequently, with fundraising measuring as the most important in the aggregate. This reflects the US budget model for cultural institutions, which have had declining federal and state support for decades.[5] Thus, the director’s role is primarily oriented around securing the financial health of the museum through fundraising and communicating the mission of the museum to staff and to the public.
Fewer than ten percent of directors considered financial skills (e.g. budgeting, revenue modeling, financial management), knowledge of local politics, and knowledge of policy and legal issues to be valuable competencies. Equity, diversity and inclusion competency was also not viewed as important to the role. However, directors of color selected the ability to foster equity, diversity, inclusion, and accessibility as core to their work at a higher rate than white respondents (24 percent vs eight percent).
The ability to manage change was the third most frequently selected item. Communication and adaptability skills are highly valuable in a sector that is frequently impacted by social movements. Museums have been sites of social critiques, protests, and boycotts for decades, from both conservative and progressive ideological camps. Given their mandate to serve the public, directors see themselves as more effective when they can communicate the value of the institution through changing social conditions.
Figure 1. Which of the following knowledge, skills, abilities, and competencies have been most valuable for you in your current position? Please select up to three items or leave the question blank if none of these items apply. Percentage of respondents that selected each item.
Priorities and Constraints
Given the multiple roles museums play for their various communities, it is important to understand how museum directors rank the functions and operations of the museum. Figure 2 represents two questions: dark blue bars represent the current priorities of the museum from the directors’ point of view, and the light blue bar represents what they anticipate will be prioritized in five years. As can be seen in Figure 2, two clear priorities emerged, one community-oriented and one collection-oriented. These are represented by four items: museum education, displaying the permanent collection, providing physical space for community engagement, and conserving the collection. Acquiring artworks, hosting traveling exhibitions, facilitating scholarship in art history, and providing digital experiences with the gallery and collection, while considered to be of great importance by a large share of respondents, are clearly of secondary importance.[6]
Figure 2. How important to you is it that your museum currently serves in the capacities listed below / How important to you is it that your museum will serve in the capacities listed below in five years? Please select one answer for each item. Percentage of respondents that selected “highly important.”
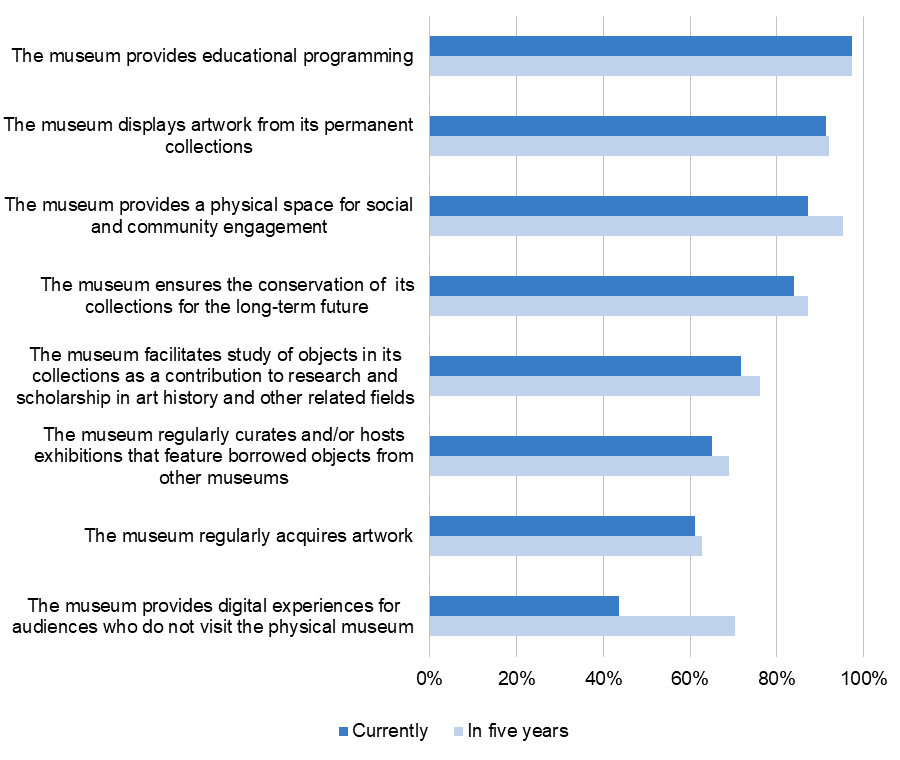
While fewer than 50 percent of directors consider remote digital experiences to be a current priority, over 70 percent anticipate that this will be a priority in five years. That trend was certainly accelerated by the COVID-19 pandemic, as museums had to urgently shift to forms of digital engagement in order to maintain a connection with their audiences.
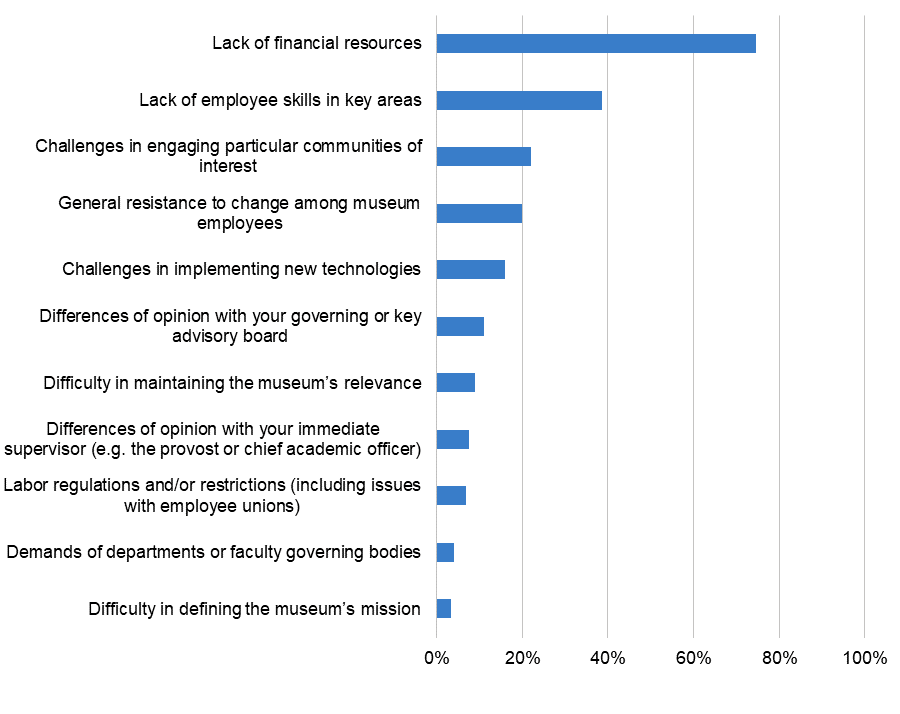
Directors indicated that the primary constraints to executing strategy in the museum were a lack of financial resources and lack of sufficient employee skills (see Figure 3). This finding underscores the degree to which the museum is keenly oriented towards securing its financial sustainability and must balance that need with the challenge of recruiting highly skilled labor. In certain positions, museums compete with for-profit sectors, particularly in technology, a sector that offers more competitive salaries and benefits.[7] As a result, museum staff often feel underpaid and stretched too thin.[8]
“Difficulty in defining the museum’s mission,” and “Difficulty in maintaining the museum’s relevance,” were two noteworthy items that art museum directors do not see as constraints to executing strategy. This reflects a high level of confidence in the internal direction and public role of the institution. Furthermore, the majority of museum directors agree that their supervisor or governing board share the same vision for the museum as the director. This was more frequently the case for municipal museums. Sixty percent of academic museum directors agree their direct supervisor has the same vision for the museum, while eighty-seven percent of municipal museums say the board shares the same vision.
Figure 3. What are the primary constraints on your ability to execute strategy in your museum? Please select up to three items that have the greatest impact, or leave the question blank if none of these items apply. Percentage of respondents that selected each item.
Equity, Diversity, Inclusion
Art museum directors have an important role to play in improving equity in their institutions, developing more inclusive programs, and improving the diversity of their staff and collections. In the findings below, art museum directors share their approaches to EDI issues in relation to staff, board, the museum’s collection, and its audience.
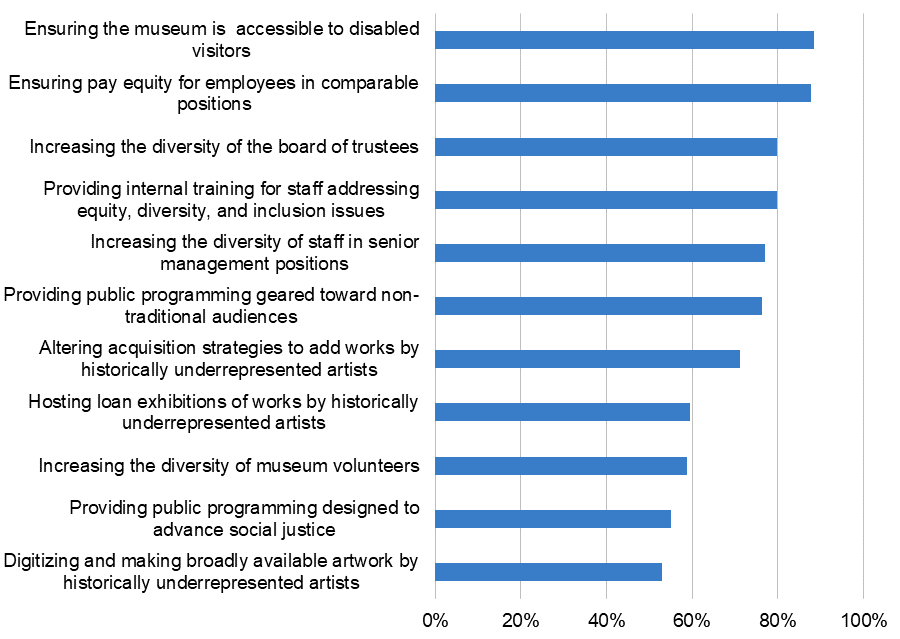
The results of this inquiry show that the most frequently selected priorities include diversity training, diversifying the board, and improving accessibility. However, more than 50 percent of respondents agreed that the equity, diversity and inclusion strategies in Figure 4 were priorities at their museum. Considering that only about ten percent of directors see EDI competencies as core to their job, these findings suggest that in the aggregate, art museum directors support EDI initiatives in the abstract but do not view these efforts as a central part of their own work. It is possible that they instead are delegating these efforts to other parts of the organization.
While roughly half of respondents view social justice programming as highly valuable, it was one of the least selected items, as can be seen in Figure 4. A greater share of academic museum directors (64 percent) prioritize providing public programming designed to advance social justice, as compared to those in municipal museums (47 percent). This may result from the fact that academic museums are often embedded in more liberal environments and are not beholden to a fiduciary board.
Figure 4. How much of a priority is each of the following equity, diversity, and inclusion strategies at your museum? Please select one answer for each item. Percentage of respondents that selected “high priority.”
This project captures director’s perspectives prior to the protests against police brutality in the Spring of 2020 and the subsequent solidarity commitments issued by many museums.[9] While the pandemic has continued to prevent museums from realizing these commitments through in-person programming over the summer of 2020, some museums have provided digital tools to help their communities engage and learn.[10]
In addition to EDI priorities at their own institutions, we also collected museum directors’ perspectives about how important these areas were for the museum field. Analyzing these results by subgroups reveals some notable differences in priorities based on institution type. For instance, a greater share of directors at municipal museums (85 percent) say the museum sector prioritizes increasing the diversity of the board of trustees, which makes sense given that they have more influence over that process than at academic museums (64 percent). The same is true of their own museums: 88 percent of municipal museum directors prioritize increasing the diversity of the board of trustees at their own museums compared to 71 percent of academic museum directors. A greater share of municipal museum directors (70 percent) say the museum sector prioritizes pay equity for employees in comparable positions, as compared to academic museums (57 percent).
Pay equity has been a source of great conflict and increasing awareness in the field.[11] While museum directors acknowledge that the field must pay greater attention to pay equity issues, they are more inclined to believe that these are already priorities at their own museums. In fact, museum directors say they prioritize ensuring pay equity for employees in comparable positions at their own museums (88 percent) more than they imagine this practice is prioritized in the museum sector as a whole (64 percent).
Budget and Personnel
As the pandemic in the United States extends beyond the summer of 2020, new research shows the cultural sector, composing 4.5 percent of the US GDP,[12] anticipates a total revenue loss of $12.4 billion.[13] With staff reductions and other cuts to expenses, net losses are expected to be around $6.8 billion. These projections are invariably based on a great deal of speculation, particularly when it comes to contributed revenue and investment income. Understanding the budgetary trends of art museums prior to the pandemic can help to formulate realistic expectations about sustainable models moving forward.
Revenue and expenditures
Museum directors were asked what percentage of their museum’s operating budget is derived from a variety of sources, as shown in Figure 5. Earned income represented 20 percent of municipal museum income. A significant portion of this revenue comes from admissions. Forty-five percent of museums reported that they charge admission, ten percent said they have a suggested donation, and 45 percent do not charge admission in any form.
Figure 5. What percentage of your museum’s operating budget is derived from the following sources? Please provide your best estimate. Percentages must add to 100%. Average response by museum type.[14]
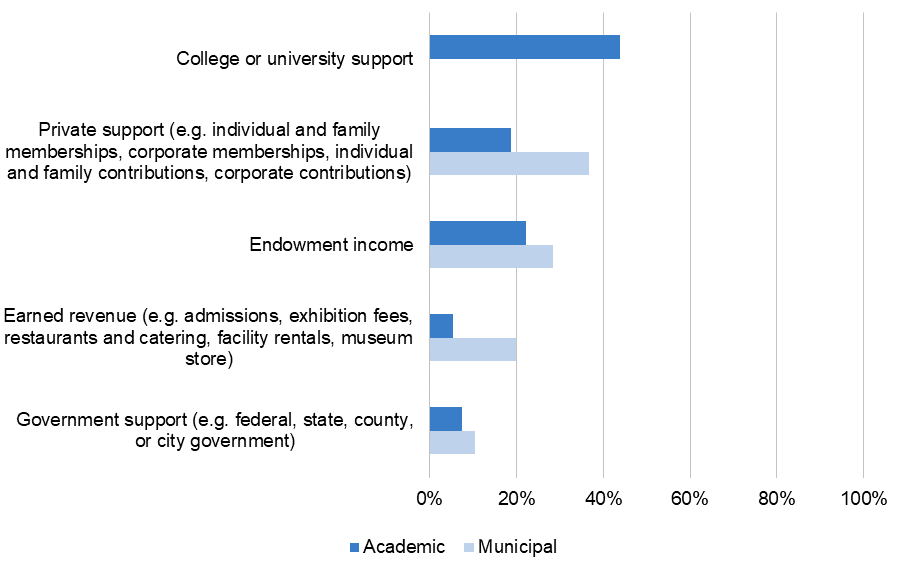
Prior to the pandemic, over 70 percent of museum directors were expecting increases in endowment revenue, private philanthropy, and earned revenue over the next five years. When directors of cultural organizations were surveyed by the AAM in June of 2020, several months after our survey was fielded, they speculated that endowment income and private philanthropy would decrease as markets were expected to decline. It remains to be seen how the long-term impacts on markets will impact the endowments of cultural organizations.
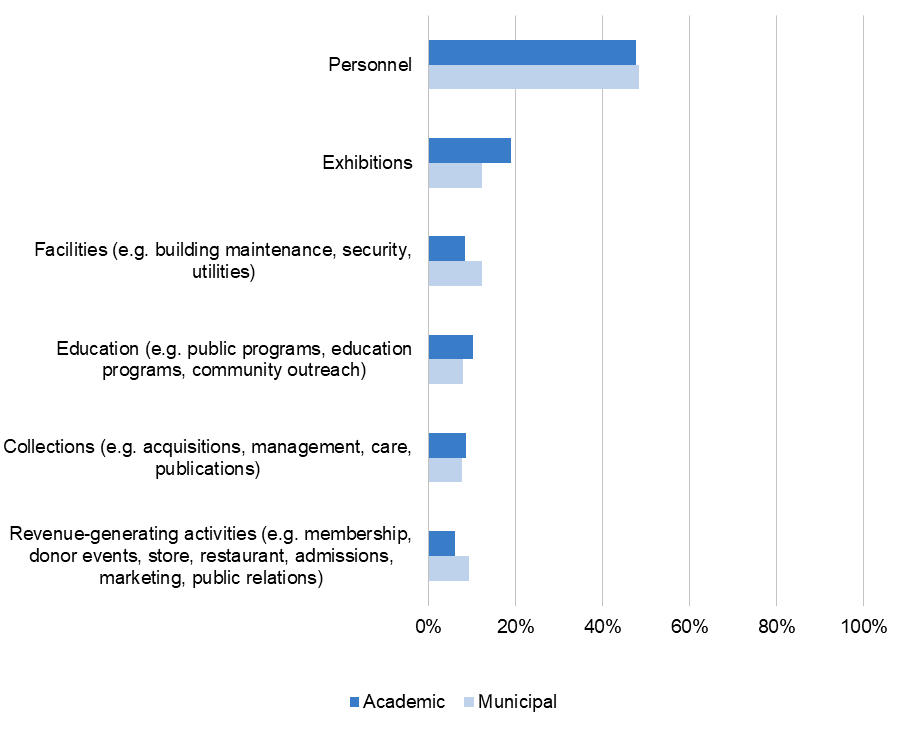
We also asked directors what percentage of their operating expenses is allocated to a variety of sources. Personnel expenses exceed all other categories by three to four times, as can be seen in Figure 6. Academic museums often do not have to absorb facilities expenses, which are provided by their parent institution, which explains the gap academic and municipal facilities costs. At a high level, spending is quite closely aligned between museum type, but revenue sources are much different between municipal and academic museums. While staffing will be different between these two types of museums in order to account for the differing revenue streams, personnel remains the most significant expense for both.
Figure 6. What percentage of your museum’s operating expenses is allocated to the following areas? Please provide your best estimate. Percentages must add to 100%. Average response by museum type.
Prior to the pandemic, roughly seven in ten museum directors expected their spending on personnel and education/public programming to increase. This was more than any other category and tracks with trends documented in previous Ithaka S+R research on museum staffing, wherein education staff increased by 20 percent between 2015 and 2018.[15]
Staffing
When asked prior to the pandemic where they were planning to add or reduce staff, directors’ responses mirrored their expectations for anticipated increases in expenses over the next five years; education positions were most frequently expected to increase. None of the museum directors said they planned to reduce education staff, and 58 percent said they planned to hire more, as can be seen in Figure 7. But as we are seeing in the current economic climate, full-time, exempt staff members may be better protected.[16] For instance, in the 2018 Demographic Survey of Art Museum Staff we found that 1,400 of the reported museum educators were full-time, while over 2,000 were part-time. Of the 1,400 full-time museum educators, over 400 were non-exempt. Fewer than a third of educators in our sample were full-time with exempt status. When institutions are in crisis, these non-exempt and part-time positions are the most vulnerable, while in relatively stable times the function of the museum educator is seen as the highest priority of the institution.
Figure 7. To the best of your knowledge, will your museum add or reduce employee positions in any of the following areas over the next five years? Percentage of respondents that selected “adding employee positions.”
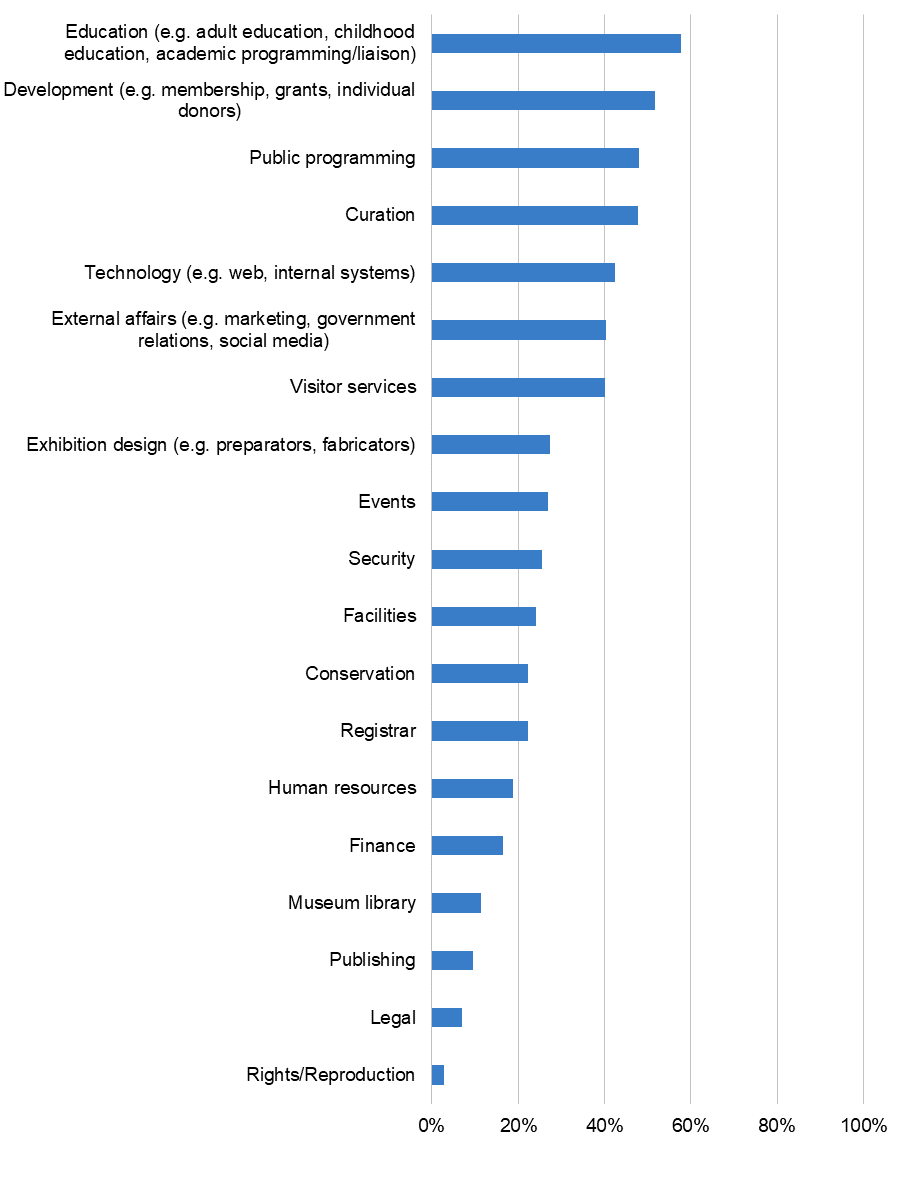
A greater share of municipal museums (56 percent) expected to add employee positions in public programming, as compared to academic museums (39 percent). Further, a greater proportion of large academic museums (50 percent) expected to add employee positions in technology compared to small academic museums (15 percent). This likely reflects the reliance of small academic museums on central information technology departments and other centralized and departmental support structures at their universities.
We also asked directors about a variety of staffing issues. As Figure 8 shows, directors find building a diverse candidate pool to be the most difficult aspect of staffing the museum. Retaining staff is perceived to be relatively more difficult than paying them equitably and competitively.
Figure 8. In staffing positions in your museum, how easy or difficult are each of the following? Percentage of respondents that selected “easy.”
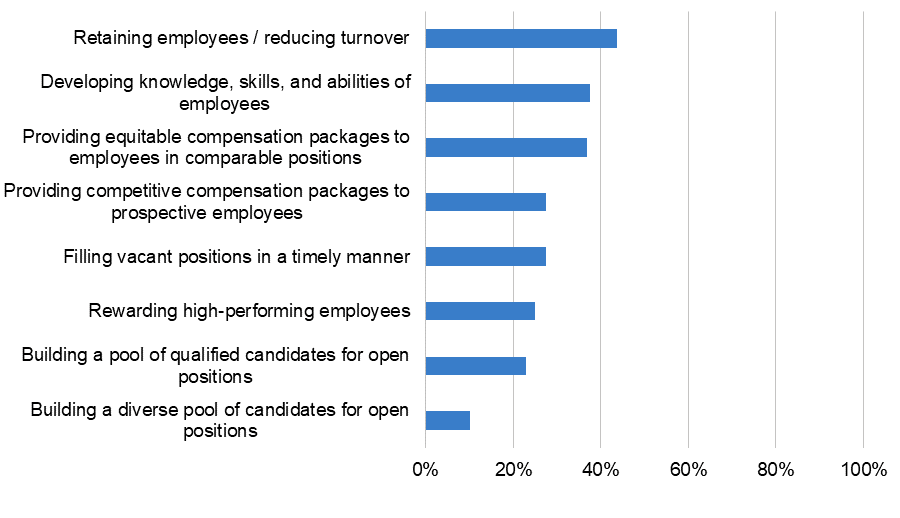
A greater share of academic museum directors (73 percent) find it difficult to reward high-performing employees compared to municipal museums (40 percent). This is likely due to the added administrative layer at university museums, where directors do not have full autonomy to grant promotions or faculty status.[17] Additionally, university-wide “pay bands” can be ill-suited to academic museum positions, and can create barriers to autonomously granting promotions and raises in the museum. A greater share of small municipal museum directors (74 percent) found it difficult to build a pool of qualified candidates for open positions compared to large municipal museums (46 percent), which one would expect given the draw of larger markets for top talent.
Recruiting and Hiring
While museum directors are themselves typically involved in hiring, this is more likely at academic museums (92 percent) compared to municipal museums (65 percent). Instead, municipal museums (61 percent) rely more on hiring managers and human resources representatives (68 percent) than do academic museums (37 percent and 15 percent respectively).
When hiring for new positions, directors reported that they most frequently list job postings on listservs in the field (such as AAMD, AAM and AAMG), and national job boards. They also send postings to their professional networks and post on their museums’ websites. More grass roots hiring like placing flyers in historically underserved neighborhoods is not a common practice, with only six percent of museum directors saying they do this occasionally or often.
A greater share of academic museum directors (95 percent) post job ads on national higher education job boards or listservs, as compared to municipal museums (72 percent). A greater share of municipal museums directors (95 percent) post job ads directly on their museum’s website as compared to academic museum directors (64 percent). It is likely that academic museum positions are more regularly posted on job boards with their parent college or university. When analyzing these findings by gender, we found that a greater share of women (91 percent) send job advertisements to colleagues at other museums to share with their networks, as compared to men (82 percent).
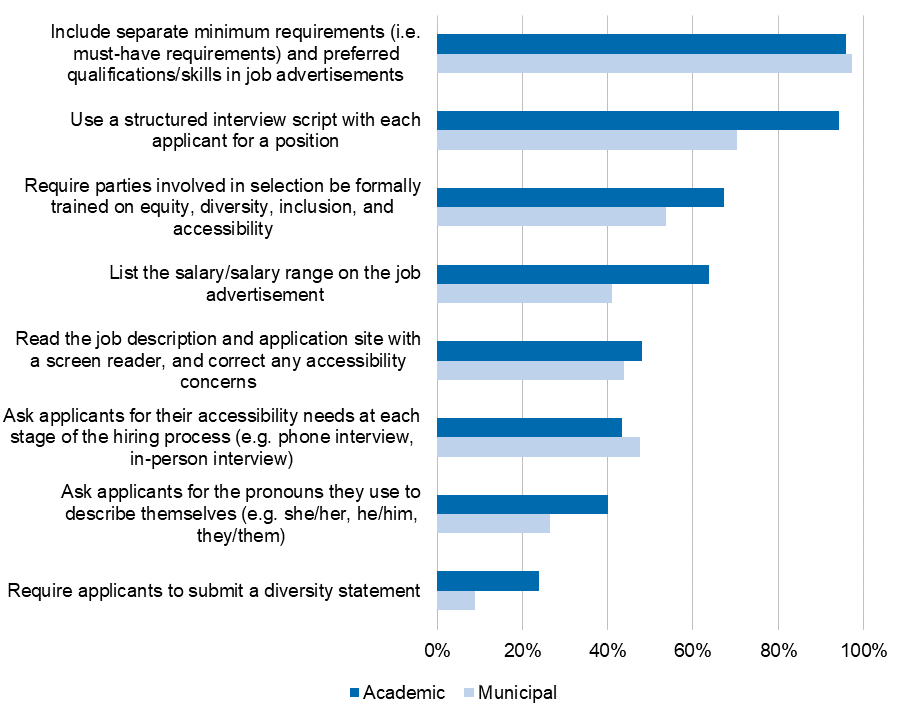
Lastly, we asked museum directors about norms in their hiring practices. We found that nearly all museum directors distinguish preferred from required qualifications. It was also common to use a structured interview script when hiring, see Figure 9. On the other hand, it was very uncommon to ask for diversity statements from candidates. A greater share of academic museums use a structured interview script with all applicants (90 percent), list the salary/salary range (59 percent), and require applicants to submit diversity statements (20 percent) as compared to municipal museums (70 percent, 41 percent, and eight percent respectively). A greater share of large municipal museums (thirteen percent) require applicants to submit a diversity statement compared to small municipal (zero). A greater share of directors of color (48 percent) ask applicants for their accessibility needs, as compared to white directors (35 percent), and a greater share of women (86 percent) use a structured interview script with all applicants, as compared to men (73 percent).
Figure 9. Generally speaking, how often do you, a hiring manager, a human resources representative and/or members of the search committee do each of the following when recruiting and hiring museum employees? Percentage of respondents that selected “occasionally” or “often” by museum type.
Attrition
We also sought to understand what directors believe are the top reasons employees voluntarily leave their museum. As can be seen in Figure 10, directors perceive career advancement and salary to be the most common reasons staff leave for other positions, indicating a lack of mobility for many in the field.
Figure 10. What are the top reasons employees voluntarily leave your museum? Please select up to three items. Percentage of respondents that selected each item.
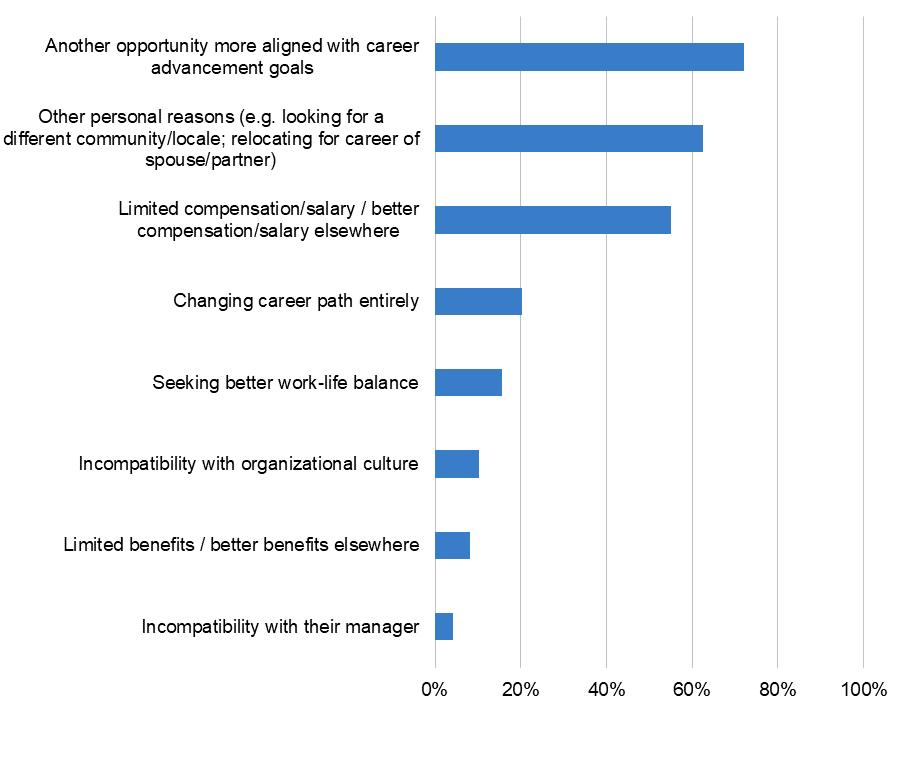
Directors say it is far less common for staff to leave due to incompatibility with their manager, incompatibility with organizational culture, or to seek a better work/life balance. This finding aligns with the barriers that directors claim limit their ability to realize the museum’s strategy—adequate financial resources and qualified personnel. It is also notable that personal reasons, like looking for a different community or locale, or relocating for the career of one’s partner, ranked very highly as a reason for attrition. Thus, it is apparent that, at an aggregate level, museum directors are not inclined to recognize staff attrition as connected to issues of climate in the museum, so much as a result of greater structural issues that are out of their control. This was more true for municipal museum directors (64 percent), who said employees leave because of limited compensation/salary or better compensation/salary elsewhere, as compared to academic museums (47 percent).
Visitors and the Public
Directors recognized a high degree of off-site programming—an often overlooked aspect of the art museum—with community organizations such as K-12 schools and local cultural organizations. Over 90 percent of directors reported partnerships with other local cultural organizations, and about 85 percent engage in partnerships with schools. In many cases, museums have served as a backstop for public schools that have had to cut arts programs because of reductions in state funding for arts education.[18] A recent survey of museum leaders by the American Alliance of Museums found that one third of museum directors in the United States are afraid that their museum will not survive the economic ramifications of the COVID pandemic.[19] While this includes all AAM members and is not specific to the art museum subgroup, it reflects a high degree of anxiety over the sustainability of many cultural organizations in the field. Figure 11 may serve as an illustration for how such a significant loss of museums would cripple the arts education infrastructure, which has increasingly come to rely on museums to fill funding gaps.
Figure 11. Does your museum offer any of the following off-site programming? Select all that apply. Percentage of respondents that selected each item by museum type.[20]
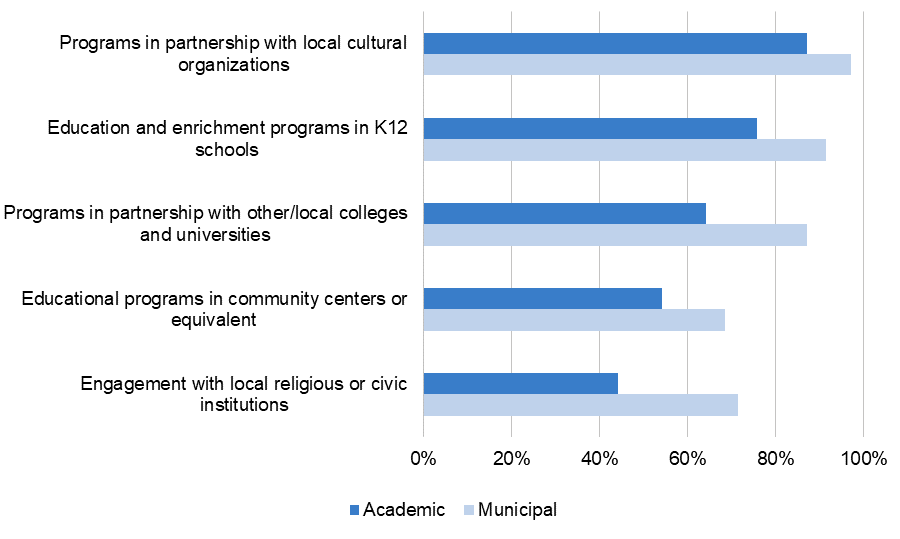
These off-site partnerships are especially core to respondents who are directors of municipal museums. Ninety-one percent provided programming for K-12 schools, as compared to 76 percent of academic museums, and 97 percent of museum directors reported off-site programs with local community partners, as compared to 87 percent of academic museums. A greater share of municipal museums also provide engagement with local religious or civic institutions (71 percent vs 44 percent of academic museums).
Audiences
One of the key strategic focuses of art museums has been a desire to reach historically excluded audiences.[21] This reflects a shift in the field resulting both from a recognition that museums historically have failed to adequately represent non-white cultures, as well as a concern that by ignoring such a significant portion of the population, museums may find themselves to be increasingly irrelevant institutions. As was found in La Placa Cohen’s Culture Track ’17 survey, which measures the attitudes of cultural consumers (the public), people of color are 82 percent more likely than white audiences to avoid cultural organizations because activities fail to reflect a range of cultural backgrounds.[22]
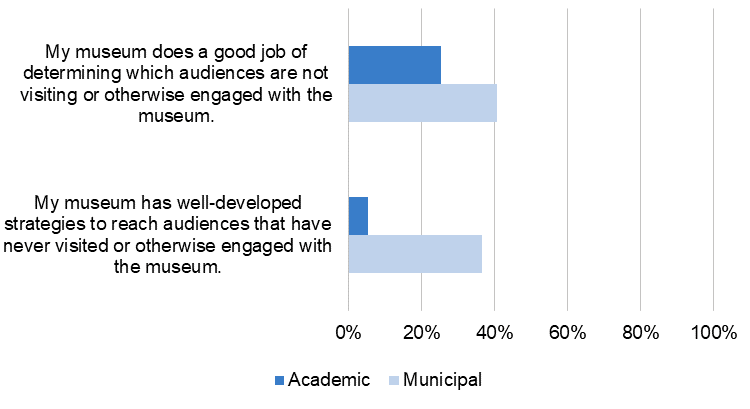
Only 14 percent of museum directors consider their institution to excel at both identifying non-visitors and making connections with them, while 11 percent say they do not have well-developed strategies to get non-audiences to visit. Forty-one percent of municipal museums agree or strongly agree that their museum succeeds in determining which audiences are not visiting or engaged, while only 25 percent of academic museums agree or strongly agree. A greater share of municipal museum directors (36 percent) agree that their museum has well-developed strategies to reach audiences that haven’t visited than academic museums (five percent). See Figure 12.
Figure 12. Please read the following statements and indicate the level of your agreement. Percentage of respondents that selected “highly agree” by museum type.
While academic museums often do have well-developed strategies to serve the public, their primary constituents are students and faculty. However, in rural areas, academic museums may serve as a de facto regional public art museum, in which case special attention must be paid to engaging members of the public.
Strategies to draw new visitors to the museum can be developed from strong assessment and evaluation practices, and in learning from peers. Ninety percent of museum directors said they have identified peers, and 85 percent believe it would be strategically beneficial to collaborate with peers. Sixty-four percent of museums already collect institutional comparisons of peer museums through assessment practices. Sixty-nine percent agree that the data they collect is more useful when it can be benchmarked against peer museums.
Competition and Controversy
Museums look to be sites of connection for communities, but they are also deeply connected to one another through scholarship, their role in the art market, and especially in the perspective of the public. Culture Track ’17 revealed evidence that “omnivorous” cultural consumers have moved away from a membership model where they commit to supporting a single institution, opting instead to explore cultural opportunities across the field.[23] In theory, this can work to the advantage of all institutions in a cultural ecosystem—so long as engagement and cultural literacy is increasing, all boats can rise with the tide.
There is evidence from the survey indicating that directors hold this view. We asked museum directors to rate their agreement with the following statements:
- “I am concerned that competition from other museums negatively impacts visits to and/or revenue for my museum”
- “I am concerned that the increasing availability of other ways for people to spend their leisure time (e.g. for-profit exhibits, streaming media services, outdoor activities) negatively impacts visits to and/or revenue for my museum.”
We found that museum directors are far more concerned by the latter, the availability of alternative uses of leisure time (39 percent vs nine percent). In other words, directors do not see other museums as competition. Competing interests for cultural consumers, however, are a more serious concern.
Similarly, museum directors are concerned about the impacts of controversies concerning governance and operations, and there is evidence to suggest they are more concerned over these controversies emerging in the field collectively than they are concerned for their own museum. For instance, we asked museum directors how much they agreed that they were uncomfortable about the extent to which donations received from board of trustee members influence decisions at their museum and at other museums. We found that they did not see this as an issue at their own museum, but were more uncomfortable with the likelihood of this occurring at other museums (five percent vs. 18 percent agree or strongly agree). This concern may be related to the idea that museums are not in competition with one another, but rise and fall together. When it comes to the public, a scandal for one museum can be a problem for their peers.
Collections
Whatever their commitments to public programs and community engagement, museums have a fundamental responsibility to care for and curate their collections. These objects tell a story of history and culture. Developing these collections towards an inclusive narrative while preserving the collection for future generations is one of the two primary functions of the museum from the director’s perspective. However, recent research on collections and acquisition patterns at a number of major museums reveals there is much more work to be done to realize these goals.[24]
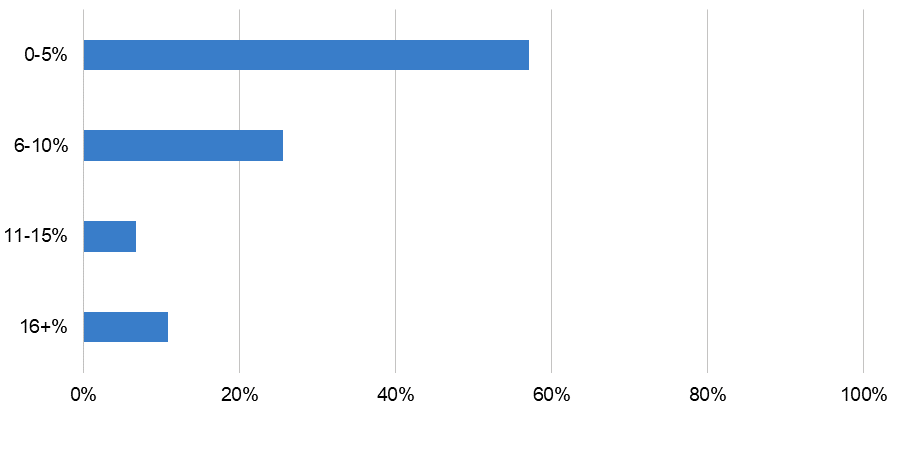
We asked museum directors about the percentage of their collection on display, the percentage on loan, and the frequency with which their displayed collection is rotated. The majority of museums had less than five percent of their collection on display (see Figure 13), less than two percent on loan, and a majority rotate their collections every six to 12 months. Municipal museums have a greater share of their collection on view (14 percent) than academic museums (six percent).
Figure 13. Approximately what percentage of the items in your collection are currently on view at your museum? Please provide your best estimate. Percentage of respondents that entered a percentage within each range.
Deaccessioning
The topic of deaccessioning has been a source of contention for museum administrators for some time. It is a best practice to regularly assess the contents of a collection in order to candidly recognize its strengths and weaknesses and to move closer to the strategic priorities of the institution.[25] It is also a matter of financial health; maintaining unwanted objects in storage can be burdensome and costly. In some cases, these issues arise when a donor makes a gift to the museum contingent on accepting the entirety of a collection, and the museum can find itself acquiring a number of unwanted objects for a few key pieces. In many cases, these collections are given to the museum with explicit instructions that they are to be retained by the museum in perpetuity. Museum directors can therefore be conflicted about deaccessioning policies. On one hand, they want to maintain trust that donors’ wishes will be respected. On the other hand, deaccessioning allows curators to more effectively craft their collections and develop new strengths.
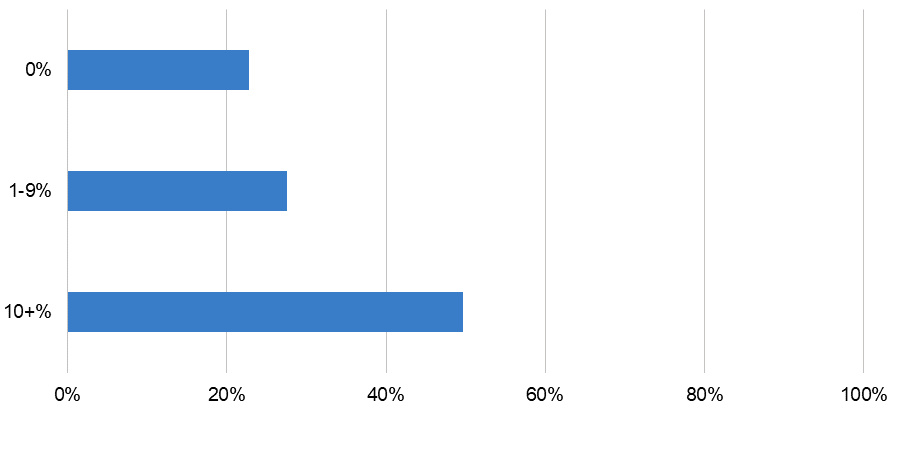
We asked museum directors what percentage of their collections are no longer aligned with their mission and/or curatorial priorities to the extent that the museum is unlikely ever to exhibit them publicly. Eleven percent of the collection on average is not aligned with institutional mission according to directors. Twenty-three percent of museums reported that none of their collection fell into this category. Roughly the same share said one to nine percent of their collection no longer fits with the broader composition of the collection. About 50 percent said ten percent or more of the collection was irrelevant, with about five percent of those respondents recognizing that over half of their collection is no longer relevant, see Figure 14. Thirty-six percent of directors wish it was simpler to deaccession works that are no longer aligned with their collection, while 21 percent disagree with loosening these restrictions.
Figure 14. Approximately what percentage of the items in your collection are no longer aligned with your mission and/or curatorial priorities to the extent that your museum is unlikely ever to exhibit them publicly? Please provide your best estimate. Percentage of respondents that entered a percentage within each range.
One of the conflicts concerning museum deaccessioning involves a concern that works in the public sphere will be sold at auction to the highest bidder, and perhaps enter into private collections. We found that a greater share of academic museums (41 percent) wish it were simpler to deaccession objects that are no longer aligned with their mission as compared to municipal museums (30 percent). Interestingly, a higher percentage of academic museums also care about keeping deaccessioned works in the public domain than do civic museums. This may in part be because academic museums often do not have the same degree of access to private collectors as do municipal museums. Their acquisitions budgets are also generally leaner. When works enter the private domain it is less likely they will find their way back to an academic museum.
Acquisitions
Museum directors indicated that diversifying their collections is a key aspect of their acquisitions strategy. Forty-six percent agreed with the statement that they had “well-developed strategies for increasing the diversity of the artists and/or subjects in its collections.” Furthermore, we asked museum directors what factors influence their acquisitions strategies. We found that the artist’s demographic identity was most significant. Geographical region and time period also ranked high in importance. See Figure 15.
Figure 15. When making decisions about which artwork to acquire at your museum, which of the following do you prioritize? Select all that apply. Percentage of respondents that selected each item.
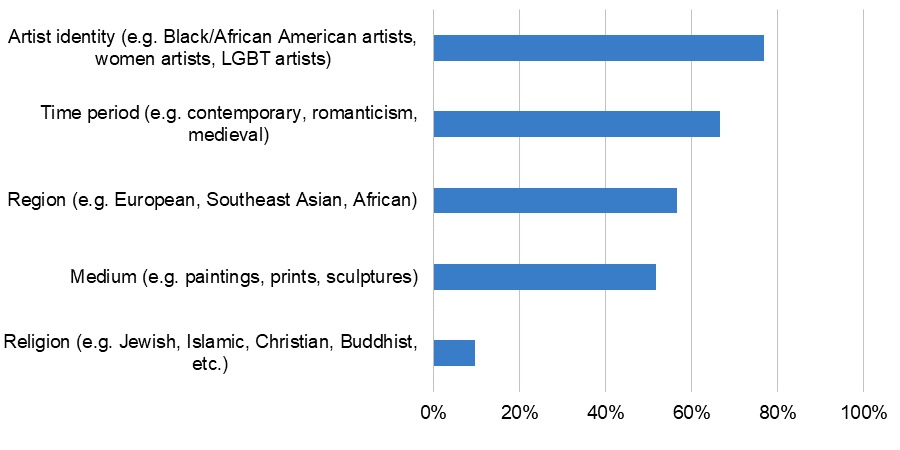
There were some differences in acquisitions strategies according to museum type. A greater share of academic museums prioritize artist identity (84 percent) and time period (74 percent), when acquiring artwork as compared to municipal museums (70 percent and 59 percent respectively). Further, a greater proportion of academic museums (77 percent) prioritize altering acquisitions strategies to add works by historically underrepresented artists, as compared to municipal museums (66 percent). Some small municipal museums (19 percent) have no plans to acquire artwork while all large municipal museums had these intentions at the time of the survey.
Conclusion
The Museum Director Survey 2020 tracks the ways that directors view issues of leadership and strategy through the various functions and operations of museums. We can see from their responses that museum directors prior to the pandemic saw education and public programming as an increasingly primary function of the museum.
Museum directors say they prioritize diversifying their collections based on artist identity as well as geography. Internally, they recognize increasing board diversity as a key initiative in their institutions. Challenges in executing on these strategies have been identified. The director sees a lack of financial resources as the greatest barrier to realizing the institution’s strategy, and fundraising is identified as the most important skill in the role.
Since this survey was fielded, the still-developing COVID-19 pandemic and the Black Lives Matter movement protesting police brutality has deeply disrupted the museum field. These factors have impacted the core of the museum’s work—the ability to have experiences with art and connect with one another. Though museums are reopening with measures in place to protect staff and visitors, the economic consequences of the pandemic will not be fully realized for some time. As we continue to research the most pressing issues of the field during a turbulent period in its history, we invite your comments, questions, and reflections.
Appendix A: Participant Demographics
| Population Demographic | Academic Frequency | Academic Percentage | Municipal Frequency | Municipal Percentage | Aggregate Frequency | Aggregate Percentage |
|---|---|---|---|---|---|---|
| Museum type | ||||||
| Academic | 75 | 100% | 0 | 0% | 75 | 50% |
| Municipal | 0 | 0% | 74 | 100% | 74 | 50% |
| Source | ||||||
| AAMD | 35 | 47% | 74 | 100% | 109 | 73% |
| AAM | 40 | 53% | 0 | 0% | 40 | 27% |
| Staff size | ||||||
| 4-10 | 34 | 46% | 0 | 0% | 34 | 23% |
| 11-25 | 20 | 27% | 9 | 13% | 29 | 20% |
| 26-50 | 14 | 19% | 18 | 25% | 32 | 22% |
| 51-100 | 3 | 4% | 20 | 28% | 23 | 15% |
| 101+ | 3 | 4% | 24 | 34% | 27 | 18% |
| Entrance Fee | ||||||
| Yes, there is a set fee | 17 | 23% | 50 | 68% | 67 | 45% |
| There is a suggested donation, but visitors can decide how much they would like to pay to enter | 11 | 15% | 3 | 4% | 14 | 9% |
| No, there is no set fee or suggested donation. | 47 | 63% | 21 | 28% | 68 | 46% |
| Job Title | ||||||
| Director | 73 | 97% | 66 | 89% | 139 | 93% |
| CEO | 1 | 1% | 22 | 30% | 23 | 15% |
| Chief Curator | 16 | 21% | 3 | 4% | 19 | 13% |
| President | 0 | 0% | 8 | 11% | 8 | 5% |
| Other (e.g. professor, chief diversity and inclusion officer) | 2 | 3% | 1 | 1% | 3 | 2% |
| Years as director at current institution | ||||||
| Less than 5 years | 21 | 28% | 33 | 45% | 54 | 36% |
| 5-10 years | 31 | 41% | 23 | 31% | 54 | 36% |
| 11-15 years | 10 | 13% | 12 | 16% | 22 | 14% |
| 16+ years | 13 | 17% | 6 | 8% | 19 | 11% |
| Years working in museum sector | ||||||
| Less than 10 years | 0 | 0% | 4 | 5% | 4 | 3% |
| 10-20 years | 23 | 31% | 16 | 21% | 39 | 26% |
| 21-30 years | 31 | 41% | 28 | 38% | 59 | 40% |
| 31-40 years | 16 | 21% | 23 | 31% | 39 | 26% |
| 41+ years | 5 | 7% | 3 | 4% | 8 | 5% |
| Highest degree earned | ||||||
| Bachelor’s degree (e.g. BA, BS) | 4 | 5% | 7 | 10% | 11 | 7% |
| Master’s degree (e.g. MA, MS, Med, MSW, MBA) | 36 | 48% | 39 | 53% | 75 | 50% |
| Professional degree beyond a bachelor’s degree (e.g. MD, DDS, DVM, LLB, JD) | 0 | 0% | 2 | 3% | 2 | 1% |
| Doctorate degree (e.g. PhD, EdD) | 35 | 47% | 26 | 35% | 61 | 41% |
| Position prior to current position | ||||||
| Director at another institution | 29 | 39% | 35 | 47% | 64 | 43% |
| Chief curator (or equivalent) at a museum | 17 | 23% | 8 | 11% | 25 | 17% |
| Deputy or assistant director | 9 | 12% | 15 | 20% | 24 | 16% |
| Other | 20 | 27% | 16 | 22% | 36 | 24% |
| Gender | ||||||
| Women | 46 | 65% | 29 | 40% | 75 | 52% |
| Men | 25 | 35% | 43 | 60% | 68 | 48% |
| Transgender identity | ||||||
| Transgender | 0 | 0% | 0 | 0% | 0 | 0% |
| Race-ethnicity | ||||||
| White | 64 | 91% | 66 | 90% | 130 | 91% |
| Hispanic, Latino, Latina, Latinx | 4 | 6% | 8 | 11% | 12 | 8% |
| Asian or Asian American | 4 | 6% | 1 | 1% | 5 | 4% |
| Black or African American | 1 | 1% | 1 | 1% | 2 | 1% |
| American Indian or Alaska Native | 0 | 0% | 1 | 1% | 1 | <1% |
| Middle Eastern or Northern African | 0 | 0% | 1 | 1% | 1 | <1% |
| Another option not listed | 2 | 3% | 2 | 3% | 4 | 3% |
Endnotes
- “Fatal Force: Police Shootings Database,” The Washington Post, January 22, 2020, https://www.washingtonpost.com/graphics/investigations/police-shootings-database/. ↑
- For our purposes, we use “municipal” to describe non-academic art museums in our cohort. We use municipal rather than public because many academic museums also serve local and national audiences outside the university. ↑
- Participants were able to select more than one response option. Percentages may not add to 100 percent. ↑
- For more information about cognitive interviews, see Christine Wolff-Eisenberg, “Employing Cognitive Interviews for Questionnaire Testing: Preparing to Field the US Faculty Survey,” Ithaka S+R, June 1, 2018, https://sr.ithaka.org/blog/employing-cognitive-interviews-for-questionnaire-testing/. ↑
- Claire McCaughey, Comparisons of Arts Funding in Selected Countries: Preliminary Findings, Canada Council for the Arts, 2005. ↑
- The survey found, unfortunately given the timing, that digital engagement was among the lowest priorities for museums in aggregate. We expect this would be dramatically different if asked now. ↑
- Kelly Cannon, Liam Sweeney, and Seema Rao, “Gender, Equity, and Museum Technology Salaries,” in For Love or Money: Confronting the State of Museum Salaries, eds. Kristina L Durocher, Mark S Gold and Dawn E Salerno (Edinburgh: MuseumsEtc, 2019). ↑
- Zachary Small, “Museum Workers Share Their Salaries and Urge Industry-Wide Reform,” Hyperallergic, June 3, 2019, https://hyperallergic.com/503089/museum-workers-share-their-salaries-and-urge-industry-wide-reform/. ↑
- Alex Greenberger and Tessa Solomon, “Read Statements from Major U.S. Museums About the George Floyd Protests,” Artnews, June 4, 2020, https://www.artnews.com/art-news/news/museums-statements-george-floyd-protests-1202689578/. ↑
- Lori Fogarty, “The Work Begins at Home,” Oakland Museum of Art, June 10, 2020, https://museumca.org/blog/the-work-begins-at-home. ↑
- Eileen Kinsella, “How Much Do Museum Employees Actually Make? A Tell-All Google Spreadsheet Is Now Making the Rounds,” Artnet News, July 17, 2020, https://news.artnet.com/market/museum-employees-salary-google-doc-1561372. ↑
- National Endowment for the Arts, “During Economic Highs and Lows, the Arts Are a Key Segment of U.S. Economy,” March 17, 2020, https://www.arts.gov/news/2020/during-economic-highs-and-lows-arts-are-key-segment-us-economy. ↑
- Zannie Voss and Jill Robinson, “Arts and Cultural Organizations: In It for the Long Haul,” DataArts (n.d.) retrieved September 08, 2020, https://culturaldata.org/pages/long-haul/. ↑
- Only academic museum directors received the item “College or university support.” ↑
- This is not to say the education field necessarily grew more diverse by 20 percent. There was an increase in overall participation in the 2018 survey. However, increases in education outpaced other positions. ↑
- Jillian Steinhauer, “A Crisis in Community Reach: MoMA’s Arts Educators on the Consequences of their Contract Cuts, The Art Newspaper, July 10, 2020, https://www.theartnewspaper.com/analysis/moma-cuts-art-educators-amid-funding-squeeze. ↑
- Liam Sweeney, “Structuring Collaborations: The Opportunities and Challenges of Building Relationships Between Academic Museums and Libraries,” Ithaka S+R, November 10, 2020, https://sr.ithaka.org/publications/structuring-collaborations/. ↑
- Marina Fang, “Public Schools Slash Arts Education and Turn to Private Funding,” Think Progress, August 5, 2013, https://archive.thinkprogress.org/public-schools-slash-arts-education-and-turn-to-private-funding-f16ff3b0bda5/; “Decline in School Arts Programs Follows Funding Drop, but Cuts Aren’t Equally Felt,” StateImpact Oklahoma, January 17, 2019, https://stateimpact.npr.org/oklahoma/2019/01/17/decline-in-school-arts-programs-follows-funding-drop-but-cuts-arent-equally-felt/. ↑
- American Alliance of Museums, “United States May Lose One-third of All Museums, New Survey Shows, July 22, 2020, https://www.aam-us.org/2020/07/22/united-states-may-lose-one-third-of-all-museums-new-survey-shows/. ↑
- The item “Programs in partnership with other/local colleges and universities” was slightly different for academic and municipal museums. Academic museum directors saw “other colleges and universities” and municipal museum directors read “local colleges and universities.” ↑
- Seph Rodney, “How Atlanta’s High Museum Attracted a 45% Non-White Audience,” Hyperallergic, January 18, 2018, https://hyperallergic.com/421398/how-atlantas-high-museum-attracted-a-45-non-white-audience/. ↑
- La Placa Cohen, “Culture Track ’17,” February 2017, https://s28475.pcdn.co/wp-content/uploads/2019/06/CT2017-Top-Line-Report.pdf. ↑
- Ibid ↑
- Julia Halperin and Charlotte Burns, ” Visualizing the Numbers: See Infographics Tracing the Representation of African American Artists in Museums and the Market,” Artnet News, September 18, 2019, https://news.artnet.com/the-long-road-for-african-american-artists/visualizing-numbers-infographics-1351190; Beatriz Lozano, “Charting Gender Inequality,” In Other Words, Art Agency, Partners, September 19, 2019, https://www.artagencypartners.com/visualizing-museums-and-the-market/. ↑
- Martin Gammon, Deaccessioning and Its Discontents: A Critical History (MIT Press, 2018). ↑