It’s Complicated
The Relationship between Postsecondary Attainment and State Finances
Introduction
Increased college-going and attainment comes with a host of benefits for individuals and society. A college credential is associated with increased civic engagement, volunteering, happiness, life satisfaction, and better health and wellness, as well as lower incarceration rates and reliance on social services.[1] In addition to the host of nonpecuniary benefits of higher education, there is a direct link between both college access and attainment and students’ future economic outcomes. For example, students with test scores just above the eligibility threshold who enroll in a four-year institution have higher college completion rates and future earnings than students falling just shy of the threshold, especially students from lower-income families.[2] Those with a postsecondary credential also have significantly higher lifetime earnings and lower student loan default rates.[3] The net benefit to the public, in terms of decreased spending on social services and increased individual tax revenue, of a college degree may be as high as $600,000 over the course of an individual’s lifetime.[4]
Over the past decade, research on the benefits of a college degree and the economic consequences of the Great Recession have galvanized policymakers, advocates, and higher education leaders to increasingly focus on postsecondary attainment. Lumina Foundation spearheaded a national effort to achieve a 60 percent attainment rate by 2025, and nearly all states responded by setting their own goals.[5] The labor market response to the global pandemic has reinforced the need for these goals: over the last several months, those with college degrees suffered fewer job losses than those without a degree. If the post-COVID economic recovery mirrors the recovery from the Great Recession, we can expect that those with a college degree will disproportionately benefit.[6]
The individual economic returns to a college degree are large and increasingly so, but states also benefit from investing in the expansion and improvement of postsecondary education: individuals’ higher earnings typically translate to increased state tax revenues and decreased dependence on state social welfare programs. Most prior research about the returns to increased college attainment, however, has focused on national estimates of the individual returns or on the returns in individual states. Only a few studies explore the returns to attainment for state economies, and none use recent data or explore the significant variation in state higher education contexts and economic policy.
In this paper, we examine the relationship between increased attainment of two- and four-year college degrees and state revenues and expenses, building on our prior work detailing states’ approaches to and progress towards meeting their attainment goals. We use state-specific, national datasets to estimate the relationship between state-level educational attainment and states’ tax revenues and social services spending, and we explore how and why these estimates vary by state. We find that in all states individuals with higher attainment pay more in state taxes (income, sales and excise, and property) and require fewer expenditures through Medicaid and welfare programs, though the extent of these impacts depend on states’ income tax structures, their “generosity” in social services spending, and the attainment and income levels of their populations. When we apply these estimates to current state attainment rates, we find that, other things being equal and assuming the labor market can absorb newly trained workers, having a bachelor’s attainment rate that is five percentage points higher would mean higher tax revenues and reduced social spending across all states, ranging from $5.6 million in Wyoming to $4.5 billion in California. These changes in net revenue translate to an average annual increase of $2,500 (in 2018 dollars) in state revenue for each bachelor’s degree earned.[7]
Our findings provide comparative state-level estimates of the potential economic impacts of increased attainment, which can help inform state policymakers about the barriers and benefits to increased higher education investments. As does our other attainment-related work, these findings provide additional context to guide states’ pursuit of their attainment goals and explore some of the state-level characteristics that may lead to variations in the impact of increased attainment.[8] We do not incorporate measures of state higher education investment, however, nor do we explore whether current state higher education investments are adequate or sufficient to improve educational attainment. Further, the narrow economic impacts we explore do not represent the full individual or societal value of a postsecondary education. For these reasons, and certainly others, we are not presenting a cost-benefit analysis of state investments in higher education, and policymakers should not use our findings by themselves to justify investments in or cuts to higher education appropriations.
In the sections below, we discuss the challenges to estimating the economic benefits of increased attainment and outline our theory of action and detailed approach. Next, we present state-by-state estimates of the relationship between attainment and state income, sales, and property tax revenues. Then, we do the same for the relationship between attainment and state expenditures on Medicaid and welfare. We apply these estimates to a hypothetical five-percentage point increase in attainment, using the state’s 2018 attainment levels as a baseline. Finally, we discuss the state characteristics that influence our estimates and provide four recommendations for policymakers to guide their thinking on investments in pursuit of attainment goals: invest in students least likely to attend college and who are likely to benefit the most, including lower-income students and underrepresented minority students; embrace more progressive tax structures that maximize the state’s benefit from increased attainment; invest in high-demand fields and educational programs that will provide students with ample labor market opportunities; and ensure postsecondary attainment goals align with economic needs and development.
Estimating state-level economic returns to attainment
Most research on the economic impact of college attainment has focused on the individual returns to education or explored the broad, national impact of those individual returns. For instance, we know that, on average, increased attainment is associated with higher earnings and better health, and we know that, generally, those improved outcomes have public benefits, such as higher tax revenues and lower health care spending. We do not know, however, the extent to which those benefits vary across states, nor do we know the extent to which states would benefit from increased attainment.
Uncovering these state-level benefits is difficult. First, selection effects likely influence the relationship between educational attainment and public benefits: those who achieve higher levels of attainment are different in meaningful ways from those who do not, in ways that affect both attainment and receipt of public benefits. Second, increased attainment has broad individual benefits, many of which are difficult to observe and quantify. Capturing the full impact of those benefits—at either the individual or the societal level—is infeasible. Third, educational attainment is but one of many factors that influence state economies, and many of the non-education factors are likely endogenous to state population attainment levels. Finally, raising attainment levels likely requires increased investment, and the complexities of higher education finance make it difficult to evaluate the optimal level of investment and the most efficient ways to target those funds.
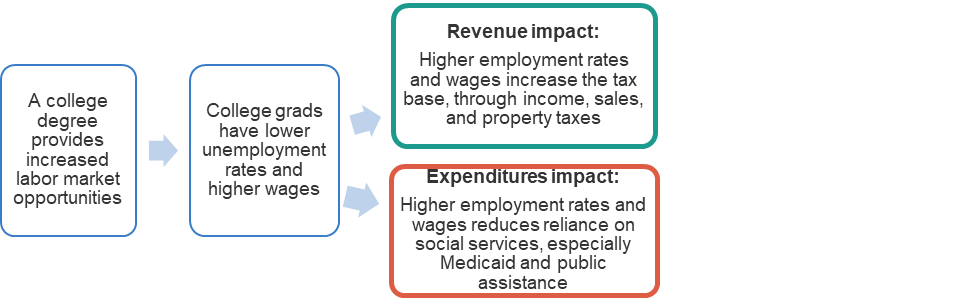
Rather than identify causal estimates, our study provides descriptive context of the relationship between postsecondary attainment and state revenues and expenses, and compares those relationships across states. To do this, we take a narrow view of the economic benefits of increased attainment, using the theory of action below as a guide (Figure 1). This theory shows how a college credential increases labor market opportunities and wages, and how these labor market outcomes impact tax revenue and social services expenditures. To evaluate this theory, we use current, state-level revenues and expenditures for individuals at different levels of attainment to estimate the impact of an increase in attainment in the future. This approach estimates the average returns to an additional credential rather than the marginal returns. Further, we assume that the state’s labor market can fully absorb the new credentials and that the returns to education are independent of the supply of credentials.[9]
Figure 1: Increased attainment likely affects state revenues and expenditures
To identify the potential impact of increased attainment, we examine the differences in state tax revenues and social service expenditures between the average bachelor’s degree holder and the average high school diploma holder. We also examine these differences between the average associate’s degree and high school diploma holder. We then apply those revenue and expenditure differences to a hypothetical five-percentage point increase in the state’s attainment rate. Depending on our model, we either assume that the full increase in attainment is a result of those who had previously held a high school diploma now earning an associate’s degree (lower bound estimate of impact) or now earning a bachelor’s degree (upper bound estimates of impact).
All the data we use is state-specific—the revenues and expenditures by attainment level, the baseline attainment levels, and state tax schedules—so we can report state-by-state predictions and discuss the state characteristics that may influence or bias our findings. In the following sections, we provide more detail for each component of our analysis: the relationship of attainment on state revenues; the relationship of attainment on state expenditures; and using those results, the predicted impact of a hypothetical five-percentage point increase in attainment.[10]
The relationship between attainment and state revenues
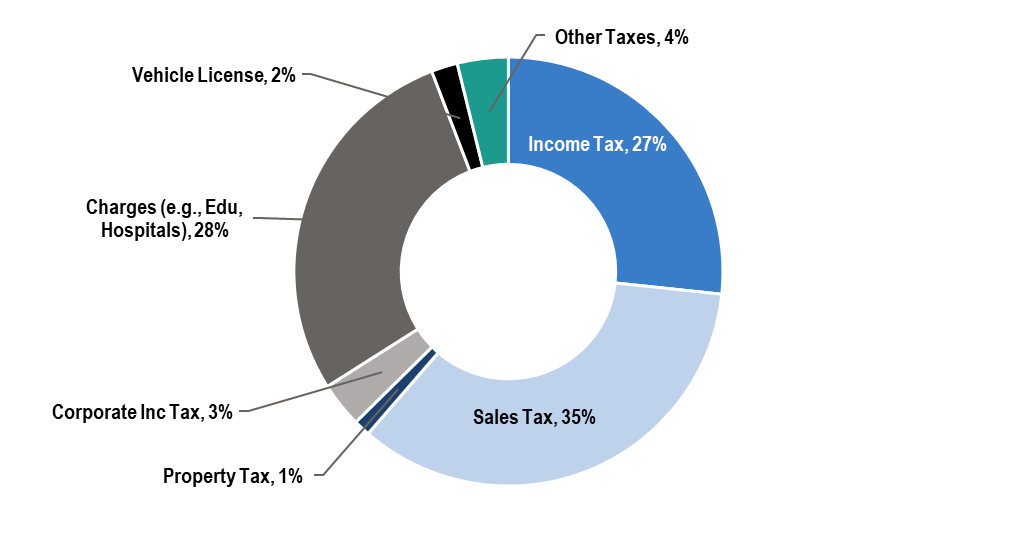
Our narrow examination of the relationship between attainment and state revenues focuses on three sources of state tax revenues: property taxes, sales and excise taxes, and income taxes. Figure 2 shows the national average of the share of state revenues from various sources, where the three revenue sources in our paper are shaded in red and orange tones. These three revenue sources comprise roughly 60 percent of total state revenue and nearly 90 percent of state revenue received directly from individuals (excluding charges and corporate income taxes). We only include these three sources because they are the most obviously impacted by increased attainment, they comprise a large share of most states’ revenues, and state-level data by attainment level is readily available. Of course, increased attainment likely influences other types of taxes—like corporate taxes—but the data to measure them are not easily available.[11]
Figure 2: National average of state revenue sources
To examine the relationship between attainment and state revenues, we use state-specific estimates of average income by attainment level from the American Community Survey (ACS).[12] We use state-by-state tax schedule information from the Tax Foundation to apply the appropriate income tax rate to the average salary of bachelor’s degree, associate’s degree, and high school graduates in each state. The Institute on Taxation and Economic Policy (ITEP) provides estimates of the state and local sales and excise taxes as a share of wages by income quintile. We use ACS data to determine the state income quintiles that correspond to the average salary for each attainment level, and then apply the ITEP proportions for the appropriate quintile. This approach provides us with the estimated amount of taxes paid by the average person in each educational attainment bracket and allows us to calculate the difference between a bachelor’s or associate’s degree recipient and an individual with a high school diploma.
Figure 3: State revenue effects for a bachelor’s degree, by state
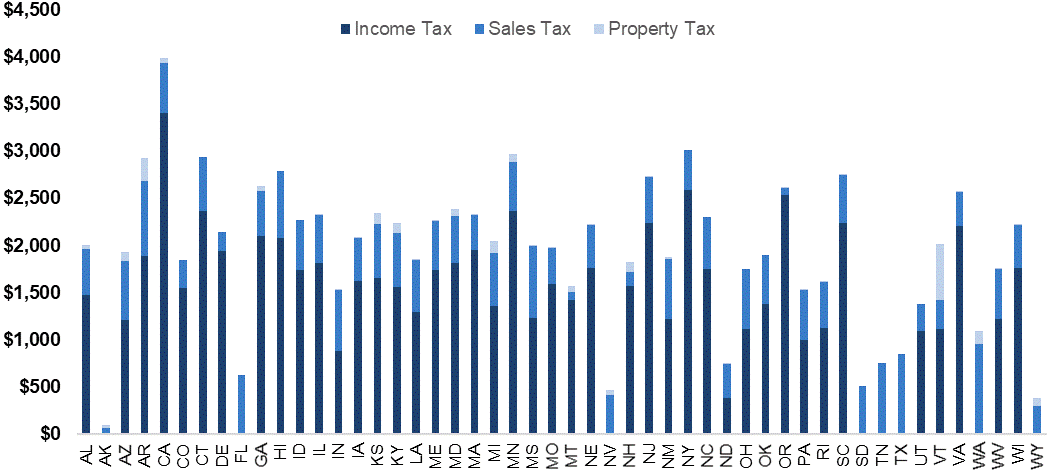
Figure 3 provides state-by-state estimates of the difference in income, sales and excise, and property taxes a bachelor’s degree recipient pays to the state compared to a resident with a high school diploma. Income tax premiums, the bottom portion of the bar, range from $375 in North Dakota to $3,407 in California. Sales tax premiums, the middle portion of the bar, range from $55 in Alaska to $950 in Washington. Finally, property tax premiums, the top portion of the bar, range from less than $10 in thirty states to $597 in Vermont. There is significant state-by-state variation: the average bachelor’s degree recipient in Alaska pays only $92 more than a high school graduate each year compared to a tax payment premium of roughly $4,000 in California.
There are two major variations in state policy and state context that influence our estimates of the relationship between state revenues and educational attainment: State’s approaches to tax policy and the labor market returns to postsecondary credentials. Tax premiums are greatest in states with more progressive tax schedules, larger wage differentials between bachelor’s and high school attainment, and in states that derive larger shares of their direct-from-resident revenue through these tax sources.
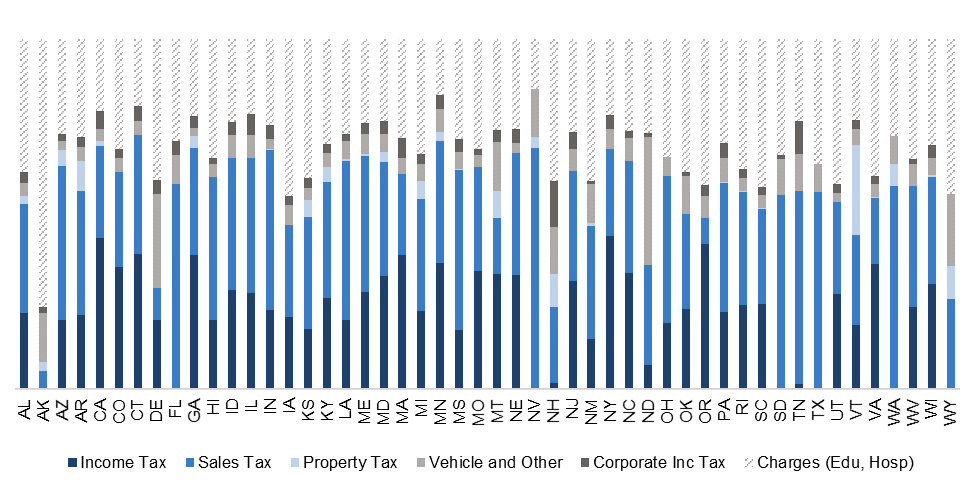
First, the share of state revenues comprised by these three taxes varies across states due to variations in states’ tax structures. Figure 4 shows that the share of states’ total revenue (from both individuals and corporations) comprised of income, sales and excise, and property taxes ranges from 8 percent in Alaska to 74 percent in Minnesota. The share of states’ individual revenues comprised of these three sources also varies significantly by state, largely due to differences in states’ approach to their income taxes. This share ranges from 35 percent in Alaska to 97 percent in Georgia. This variation is important for contextualizing the impact of increased attainment on state revenues. In states with relatively low shares and levels of individual taxes, our estimates of the impact of increased attainment will naturally be lower.
Figure 4: State revenue sources, by state
Second, the wage differentials between attainment levels vary significantly across states. In some states, the average individual with a bachelor’s degree earns only slightly more than an individual with an associate’s degree or a high school diploma. In other states, bachelor’s degree holders earn significantly more than those with lower levels of attainment. State economic factors, like the nature of dominant industries and cost of living, likely influence the variation in the wage premium. For instance, the dominant industries in New York, California, and Connecticut—which include financial services, real estate, insurance, and consulting—may provide opportunities to earn high salaries with only a bachelor’s degree. On the other hand, the oil and gas industry in Wyoming and North Dakota may provide relatively high salaries for those with only a high school diploma.
The relationship between attainment and state expenditures
In addition to the relationship between attainment and state revenues, we also explore the relationship between attainment and the other side of the balance sheet, specifically, two categories of state social services expenditures: Medicaid and public welfare. Figure 5 provides the state-weighted national average of the share of state expenditures. Nationally, the social services expenditures we examine comprise 35 percent of total state expenditures, with Medicaid vendor payments representing 90 percent of these dollars. Although we know higher rates of attainment affect other aspects state expenditures, such as criminal justice or public housing spending, we lack sufficient data to estimate potential savings in these areas. As such, our analysis likely underestimates the long-term savings in social services expenditures that states experience from an increase in attainment. Nevertheless, we believe it is important to quantify these direct-to-resident benefits and their relationship with increased educational attainment.
To estimate the expenditure impact we use the US Census’ Current Population Survey (CPS) to calculate the average personal value of Medicaid and public welfare for each attainment level by state. Of course, some portion of social services expenditures are transfers from the federal government to the state; the National Association of State Budget Officers (NASBO) provides a state-by-state estimate of the share of Medicaid expenditures that come from the state and federal governments. We apply this proportion to the average personal value of Medicaid for each attainment level calculated from the CPS.[13] Similarly, the US Department of Health and Human Services provides state-by-state estimates of the share of public welfare expenses borne by state and federal governments, respectively. We apply this proportion to the personal value provided by the CPS.
Figure 5: National average of state expenditures
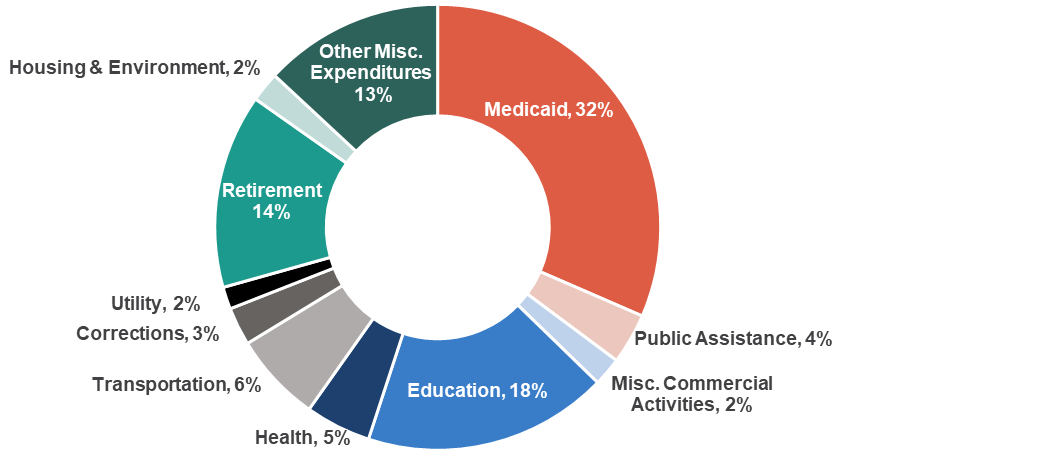
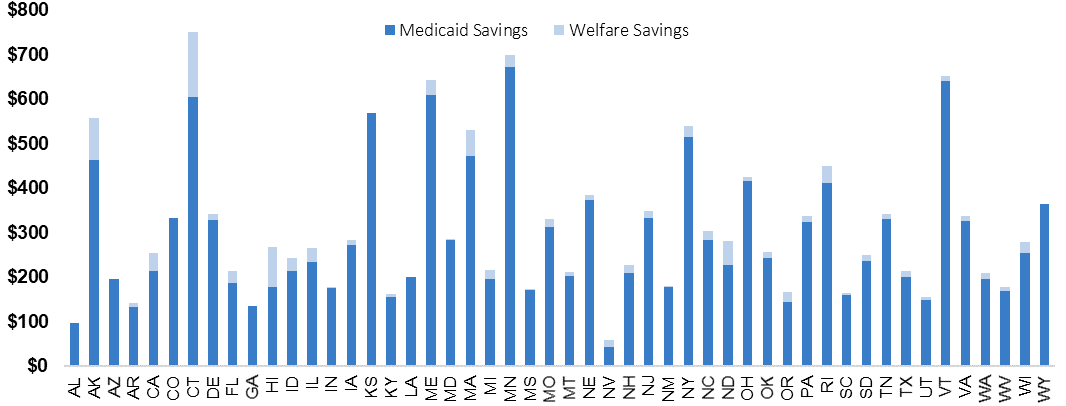
Figure 6 provides the dollar estimates of average savings in each category for a bachelor’s degree recipient compared to a resident with a high school diploma. Medicaid spending differences, shown as the lower portion of the bar in red, range from $43 in Nevada to $673 in Minnesota. The difference in public assistance spending, shown as the upper portion of the bar, ranges from $0 in six states to $147 in Connecticut. The total state savings on social services included in this analysis range from $58 per year for a bachelor’s degree recipient in Nevada to $752 in Connecticut.
Figure 6: State expenditure effects of a bachelor’s degree, by state
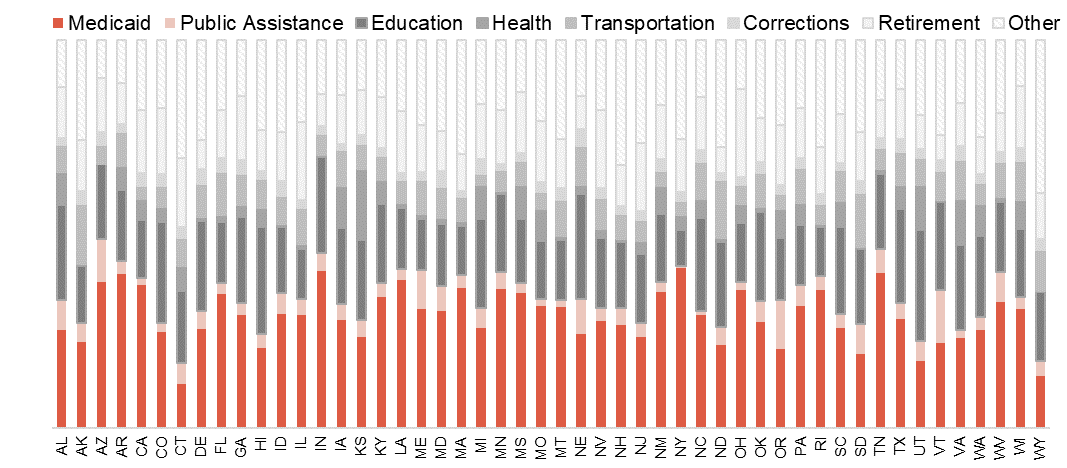
Although there is variation across states in the proportion of total state expenditures comprised by Medicaid and public welfare, the differences across states are relatively small compared to the differences in revenues, as seen in Figure 7. The share of states’ total expenditures that we include in our estimates ranges from 17 percent in Connecticut to 49 percent in Arizona. Across all states, Medicaid spending is significantly larger than public assistance spending.
Because Medicaid is such a large share of state spending, the overwhelming majority of potential savings come from bachelor’s degree recipients having a lower reliance on Medicaid programs. Importantly, a state’s level of investment in Medicaid is positively associated with their potential savings from increased attainment. States with significant investments in social supports—including Connecticut, Minnesota, and Vermont—stand to reap the most savings from increased attainment. Of course, these programs improve the health and financial circumstances of their participants, among other things, so states have numerous reasons to invest. Pairing those welfare investments with investments in increased educational attainment can potentially lead to cost savings if that increased attainment results in lower reliance on social supports.
Figure 7: State expenditures, by state
The net benefits of postsecondary attainment
The potential increases in state tax revenues and decreases in health and welfare expenditures suggest that states’ budgets benefit when their residents earn a bachelor’s degree. In this section, we contextualize these benefits to provide useful guidance for policymakers seeking to increase attainment rates. First, we present national estimates of the average net benefit to states and examine the variation in those net benefits across states. These benefits reflect the current levels of attainment in a state; the impact of an increase in postsecondary attainment on these benefits, however, depends on the number of a state’s residents who newly earn an associate’s or bachelor’s degree as well as a myriad of state characteristics. Yet, states’ current attainment levels, their attainment goals, and their efforts to increase attainment vary widely. To circumvent these state-level variations, we then explore the economic effects of a hypothetical five-percentage point increase in attainment in all states.
The net benefits associated with current levels of postsecondary attainment
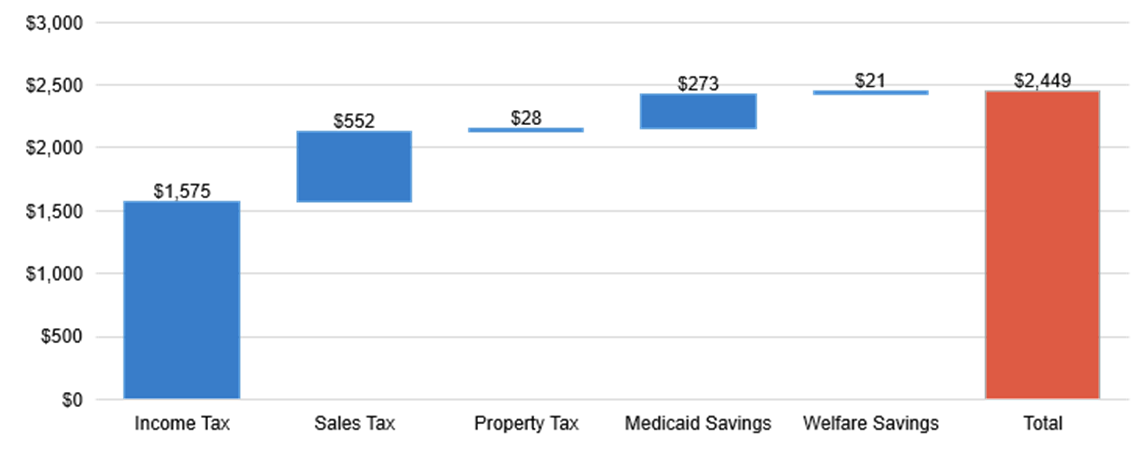
Nationally, we find that postsecondary credentials provide significant economic benefits to states. Figure 8 provides a state population-weighted national average of the annual returns to a bachelor’s degree compared to a high school diploma, nearly $2,500 per degree (as shown in the red bar). Each year, the average bachelor’s degree recipient generates roughly $2,200 in additional tax revenues and $300 in Medicaid and welfare savings compared to the average high school graduate.
Figure 8: National average of state-level economic benefits of a bachelor’s degree
As we discussed earlier, these differentials vary significantly across states and by the level of the postsecondary degree, although the net benefit is positive in all states. Below, Figure 9 shows the state-by-state net economic benefits for the average bachelor’s and associate’s degree relative to the high school diploma. The upper endpoint of each bar represents the net benefit of a bachelor’s degree, and the lower endpoint corresponds to the net benefit for an associate’s degree in the state, both relative to the state’s average high school graduate. The position of either endpoint displays the size of the positive benefit relative to a high school graduate. The length of the bar displays the size of the positive benefit of a bachelor’s degree relative to an associate’s degree—a shorter bar means there is a relatively small additional benefit to a bachelor’s degree compared to an associate’s degree; a longer bar means there is a relatively large positive benefit compared to an associate’s degree.
Figure 9: State-by-state net economic benefits of associate’s and bachelor’s degrees
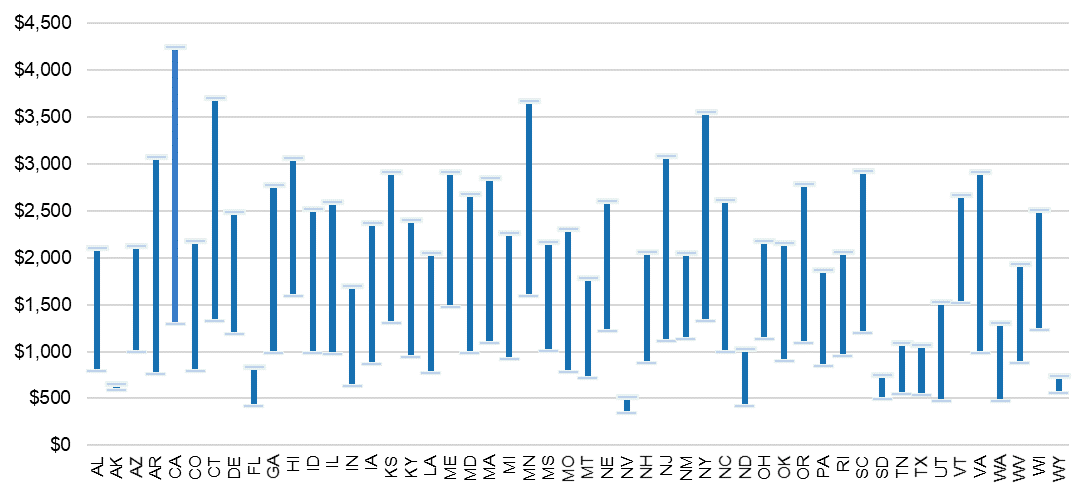
As shown in the earlier section on the relationship between attainment and state revenues, the majority of the net benefits from attainment are due to residents with postsecondary degrees paying higher taxes than those with a high school diploma. On the revenue side, the extent of these differences, however, mostly depends on the level and progressivity of states’ income tax schedules, approaches to property taxes, and wage differentials across degrees. For instance, the five states in Figure 9 with the smallest net benefit to bachelor’s degrees—Alaska, Florida, Nevada, South Dakota, and Wyoming—do not collect any state income tax (see Figure 4). Compared to these five states, Tennessee and Texas—two other states that do not collect state income tax—have relatively higher net benefits for bachelor’s degrees (if not associate’s degrees) largely due to relatively higher wage premiums and larger amounts of sales tax collected for bachelor’s degree holders.
In addition, states with larger wage differentials between associate’s and bachelor’s degrees typically have more progressive tax structures, which magnifies the net benefit to a bachelor’s degree relative to an associate’s degree. In five states—Minnesota, New York, Arkansas, Connecticut, and California—the gap in the net benefit for associate’s and bachelor’s degrees is more than $2,000, largely due to relatively high average wages, highly progressive tax schedules, or public welfare savings (see Figure 6) for bachelor’s degree holders. In some cases, higher wages for bachelor’s degrees are attributable to the dominance of high-value occupations (e.g., financial services, real estate, insurance, and consulting) in state and local labor markets. In other cases, large earnings premiums for bachelor’s degree holders compared to associate’s degree holders drives the large difference in net benefits to the state. Compared to an associate’s degree recipient, a bachelor’s degree recipient in Connecticut annually pays an average of $2,025 more in income, property, sales, and excise taxes and draws an average of $355 less in social service spending. This is in large part because the wage premium between bachelor’s and associate’s degree holders is more than $30,000, the largest of all states. Connecticut also has higher than average levels of state tax progressivity and generous social service supports, which contributes to this large premium.
The net benefits associated with a shift in postsecondary attainment levels
As we stated earlier in the paper, our estimates of the net benefits of postsecondary degrees are conservative because they only account for a narrow subset of both the revenues and expenses related to increased attainment, especially in states that do not collect state income taxes. Further, we calculate the relative net benefits using states’ current levels of postsecondary attainment. To understand how those net benefits may translate to a change in postsecondary attainment, we apply them to a hypothetical five-percentage point increase in attainment. Using an across-the-board five-percentage point change allows us to standardize the shift in attainment across states, irrespective of states’ current levels of attainment or distance from its stated attainment goal. For each state, Figure 10 displays the net benefits of a five-percentage point increase in attainment under three scenarios:
- The lower bound reflects a conversion of those with only high school diplomas to associate’s degrees, equivalent to a five-percentage point increase in the share of residents with an associate’s degree.
- The upper bound reflects a conversion of those with high school diplomas to bachelor’s degrees, equivalent to a five-percentage point increase in the share of residents with a bachelor’s degree.
- The midpoint (red dot) reflects a conversion of those with high school diplomas to both associate’s and bachelor’s degrees, equivalent to a five-percentage point increase in the combined share and equally distributed across the two degree levels.
Figure 10: State-by-state net benefit associated with a five-percentage point increase in attainment
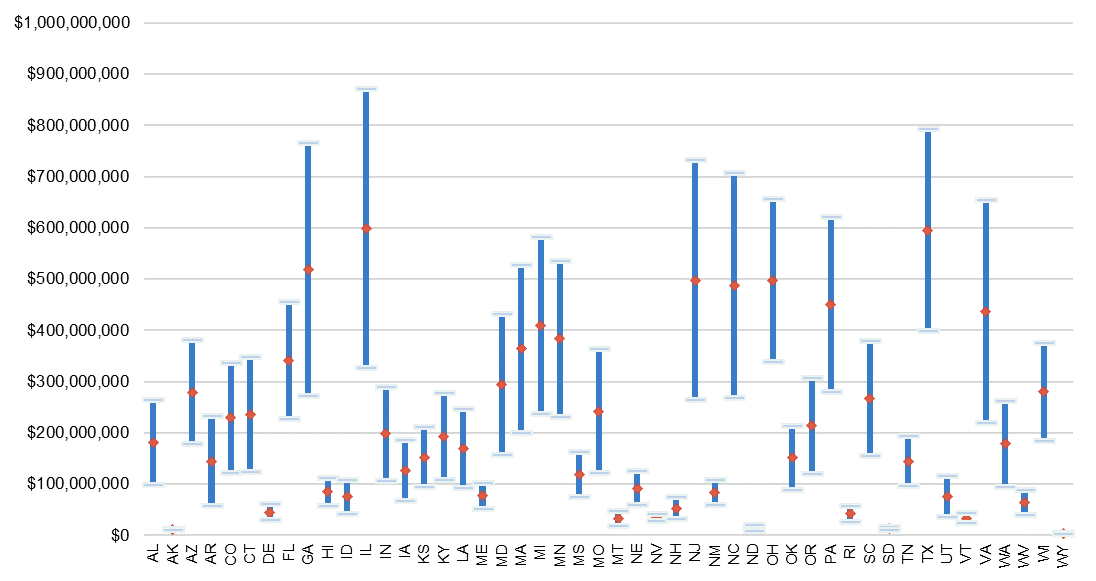
Note: To facilitate readability, we exclude California ($1.4B – $4.5B) and New York ($690M – $1.9B) from this graph.
We chose to model a five percentage point increase in attainment because the majority of states need to increase attainment by at least this amount in order to reach their attainment goals. To contextualize this, from 2008 through 2018, state attainment rates increased by an average of roughly five percentage points. This modest increase in attainment represents a substantial economic gain for many states.
The state-level aggregate estimates, shown in Figure 10, align closely with the individual estimates, presented in the previous sections, although states with larger populations inherently see larger aggregate returns. For most states, an increase in attainment is associated with several hundred million dollars in increased tax revenue and decreased public expenditures each year, in addition to changes in other revenues (e.g., corporate taxes) and expenditures (e.g., corrections spending) we are not capturing in this paper. Not surprisingly, the difference between aggregate net benefits for a five percentage point increase exclusively in bachelor’s degree attainment compared to a five percentage point increase exclusively in associate’s degree attainment also grows with the size of the population. This underscores the potential benefits to states of prioritizing longer degree programs in their attainment strategies.
Importantly, these estimates do not account for potential changes in the labor market resulting from an increase in attainment. The availability of jobs and relative earnings may change as the states’ educational attainment changes. These labor market shifts may be unrelated to increased attainment, and may result in the growth or decline of the associated net benefits. For example, an increase in bachelor’s degree production could reduce labor market returns in the shorter-run, but it could also incentivize companies seeking a highly educated labor force to enter the state. Moreover, some evidence suggests that when the number of jobs requiring a college degree grow, the number and wages of service-sector jobs not requiring a postsecondary credential also grow.[14] Both of these factors could affect the state’s wage premiums, employment rates, tax revenue, and social services spending associated with increased attainment.
Recommendations and conclusion
In this report, we estimate the net economic benefit associated with current levels of postsecondary attainment and apply those benefits to a hypothetical increase in attainment. We first explore the relationship between current attainment levels and state budgets. Specifically, we estimate the amount of state revenues from income, sales and excise taxes and property taxes that residents at different education levels contribute; and we examine the amount of state expenditures comprised by Medicaid and public welfare spending that residents at different education levels draw. We combine these estimates to generate the net economic benefit for current levels of postsecondary attainment and apply those net benefits to a future, hypothetical five-percentage point increase in postsecondary attainment. These efforts generate novel, cross-state comparisons that provide policymakers with important context about the possible impacts of increased attainment on state budgets and the state policy factors that may influence the size and direction of those impacts.
Across all states, our findings show that those with associate’s and bachelor’s degrees contribute more in state revenues and draw less on social service programs than those with only a high school diploma. The size of this net benefit depends on myriad state factors, known and unknown: current levels of attainment, industry and labor market conditions, income tax levels and schedules, and generosity of social service programs, among other things. Those states with no or low state income tax or that offer more limited social service programs tend to have a lower net benefit to the state budget from postsecondary attainment than those states with more progressive policies in both areas. Of course, regardless of the tax structure, increased personal income benefits each adult with a postsecondary credential, and other nonpecuniary benefits accrue for society.
Our estimates of the impact of a hypothetical increase in attainment suggest that increasing attainment may have substantial positive economic effects for states. Yet, our estimates are likely conservative because they focus only on a narrow set of state revenues and expenditures. We expect, for instance, that increased attainment will likely affect other state revenue and expenditure categories (e.g., corporate taxes and/or corrections spending) not included in our models, as well as the wage premiums and labor markets in the state.
For the reasons we stated in our introduction, state policymakers and advocates should not consider our estimates as a full cost-benefit analysis or as reliable predictions of the total effects of increased attainment. Instead, our estimates provide state policymakers with additional context about their own state and other states in order to inform their strategy and decision-making. As such, we recommend state policymakers use this information to consider four next steps:
- Students of color and those from lower-income backgrounds have the greatest potential to personally benefit from a college degree, but often have the least opportunity to do so. Increasing postsecondary attainment for these students also has the greatest potential to benefit their local and state economies: increased attainment will likely increase their lifetime earnings, reduce their likelihood of un- or under-employment, raise their tax contributions, and reduce their reliance on social services. State policymakers have a moral and economic obligation to invest in increased access, financial aid, and academic supports for these students, especially now that the COVID-19 pandemic has disproportionately affected their communities. We discuss effective policies for targeting funds towards these students in previous policy briefs related to this project.[15]
- State policymakers should advocate for progressive income tax policies that will augment the economic benefits of increased attainment. Many states currently have flat state income tax schedules and some states have no state income tax at all. A progressive state income tax schedule would ensure that those who benefit the most from postsecondary opportunities are contributing to the public resources that fund those opportunities. A more progressive state income tax would also help states reap the rewards of their investments in increasing postsecondary attainment and would require those who have benefited most from those investments to contribute to future opportunity.
- State policymakers should invest in postsecondary programs that align with high-demand fields in the state. These investments create more alignment between the postsecondary system and the workforce, help states better meet their labor market demand, increase the earnings of students who graduate from these programs, and increase the state’s net benefits of postsecondary attainment. These investments can also attract new industries and firms to the state, which supports the overall economic growth.
- State policymakers should ensure that their efforts to increase attainment have meaningful labor market benefits for students. To do so, states must explore and strengthen the relationship between increased attainment and their labor market. States should invest in research to understand their labor market needs as well as the potential for wage growth in response to increased attainment. States should also form public-private partnerships that directly link postsecondary training to the skills in highest demand in their economy. Such an approach would help align postsecondary goals with economic development goals in a productive way that benefits students and the state.
Endnotes
- Christopher R. Dennison, “The Crime-Reducing Benefits of a College Degree: Evidence from a Nationally Representative US Sample,” Criminal Justice Studies 32, no. 4 (2019): 297-316, https://doi.org/10.1080/1478601X.2019.1627533; Philip Oreopoulos and Kjell G. Salvanes, “Priceless: The Nonpecuniary Benefits of Schooling,” Journal of Economic Perspectives 25, no. 1 (2011): 159-84, https://doi.org/10.1257/jep.25.1.159. ↑
- Jonathan Smith, Joshua Goodman, and Michael Hurwitz, “The Economic Impact of Access to Public Four-Year Colleges,” National Bureau of Economic Research, no. w27177 (2020) https://www.nber.org/papers/w27177. ↑
- Anthony P. Carnevale, Ban Cheah, and Stephen J. Rose, “The College Pay Off,” Georgetown Center for Education and the Workforce (2011), http://hdl.handle.net/10919/83051; Nicholas W. Hillman, “College on Credit: A Multilevel Analysis of Student Loan Default,” The Review of Higher Education 37, no. 2 (2014): 169-195, http://doi.org/10.1353/rhe.2014.0011. ↑
- Trostel estimates this figure at $481,000 in 2005 dollars and Carroll and Erkut estimate this figure to be $388,000 in 2002 dollars. The authors converted these estimates to 2018 dollars to align with the current report. See Philip A. Trostel, “The Fiscal Impacts of College Attainment,” Research in Higher Education 51, no. 3 (2010): 220-247, https://doi.org/10.1007/s11162-009-9156-5, and Stephen J. Carroll and Emre Erkut, “The Benefits to Taxpayers from Increases in Students’ Educational Attainment,” Rand Corporation (2009), https://www.rand.org/content/dam/rand/pubs/monographs/2009/RAND_MG686.pdf. ↑
- Lumina Foundation, “Tracking America’s Progress toward 2025,” https://www.luminafoundation.org/stronger-nation/report/2020/#nation. ↑
- Anthony P. Carnevale, Tamara Jayasundera, and Artem Gulish, “America’s Divided Recovery: College Haves and Have-Nots,” Georgetown University Center on Education and the Workforce (2016), https://cew.georgetown.edu/wp-content/uploads/Americas-Divided-Recovery-web.pdf. ↑
- Note that we estimate the additional revenue associated with the average credential, not the marginal new credential. ↑
- Cindy Le, Elizabeth Davidson Pisacreta, James Dean Ward, and Jesse Margolis, “Setting a North Star: Motivations, Implications, and Approaches to State Postsecondary Attainment Goals,” Ithaka S+R, June 12, 2019, https://doi.org/10.18665/sr.311539; James Dean Ward, Jesse Margolis, Benjamin Weintraut, and Elizabeth Davidson Pisacreta, “Raising the Bar: What States Need to Do to Hit Their Ambitious Higher Education Attainment Goals,” Ithaka S+R, February 13, 2020, https://doi.org/10.18665/sr.312647. ↑
- We draw on evidence from labor economics that suggests that when there is an influx of college-educated immigrants, overall employment opportunities increase. Rather than crowding out native-born workers, there appear to be positive spillover effects, an expansion of the labor market, and growth in wages. See Jennifer Hunt and Marjolaine Gauthier-Loiselle, “How Much Does Immigration Boost Innovation?” American Economic Journal: Macroeconomics 2, no. 2 (2010): 31-56, DOI: 10.1257/mac.2.2.31; William R. Kerr and William F. Lincoln, “The Supply Side of Innovation: H-1B Visa Reforms and US Ethnic Invention,” Journal of Labor Economics 28, no. 3 (2010): 473-508, https://doi.org/10.1086/651934; Sari Pekkala Kerr, William R. Kerr, and William F. Lincoln, “Skilled Immigration and the Employment Structures of US Firms,” Journal of Labor Economics 33, no. S1 (2015): S147-S186, https://doi.org/10.1086/678986; and Giovanni Peri, “The Effect of Immigration on Productivity: Evidence from US States,” Review of Economics and Statistics 94, no. 1 (2012): 348-358, https://doi.org/10.1162/REST_a_00137. ↑
- This analysis estimates the economic benefits to the state of bachelor’s and associate’s degrees compared to a high school diploma. We define a bachelor’s degree recipient as an individual whose highest degree is a bachelor’s degree, and we exclude those with post-graduate education. Our baseline comparison group consists of individuals with a high school diploma and no additional formal education. As a robustness check, we expanded our baseline group to also include any individuals with some college, but no associate’s degree and observed minimal differences in the estimated value of a postsecondary credential. ↑
- Our estimates do not include charges related to education (8.3 percent) and hospitals (5.3 percent), miscellaneous general revenue related to interest earnings (2.8 percent) and other general revenue (8.1 percent), corporate income tax (3.4 percent), other taxes (3.8 percent), and motor vehicle license (2 percent). ↑
- United States Census Bureau, “American Community Survey,” data retrieved in April 2020, https://www.census.gov/programs-surveys/acs. ↑
- The CPS stopped reporting data on the personal value of Medicaid in 2007. Using a CPI adjuster, we carry the 2007 figure forward to 2018 to fulfill this part of the expenditure calculations. ↑
- Francesca Mazzolari and Giuseppe Ragusa, “Spillovers from High-Skill Consumption to Low-Skill Labor Markets,” Review of Economics and Statistics 95, no. 1 (2013): 74-86, https://doi.org/10.1162/REST_a_00234. ↑
- Cindy Le, Elizabeth Davidson Pisacreta, James Dean Ward, Jesse Margolis, and Heidi Booth, “Policies to Ensure Equitable Access to Well-Resourced Colleges and Universities,” Ithaka S+R, October 1, 2020, https://doi.org/10.18665/sr.313963; Cindy Le, Elizabeth Davidson Pisacreta, James Dean Ward, and Jesse Margolis, “Setting a North Star: Motivations, Implications, and Approaches to State Postsecondary Attainment Goals,” Ithaka S+ R, June 12, 2019, https://doi.org/10.18665/sr.311539; Cindy Le, Elizabeth Davidson Pisacreta, James Dean Ward, and Jesse Margolis, “Expanding Pathways to College Enrollment and Degree Attainment,” Ithaka S+ R, December 12, 2019, https://doi.org/10.18665/sr.312296; James Dean Ward, Cindy Le, Elizabeth Davidson Pisacreta, and Jesse Margolis, “The Strategic Alignment of State Appropriations, Tuition, and Financial Aid Policies,” Ithaka S+R, October 2, 2019, https://doi.org/10.18665/sr.311966. ↑