The Research Data Services Landscape at US and Canadian Higher Education Institutions
Introduction
Research data services—support offerings which enable and improve data-intensive research—have garnered sustained attention from library research support service providers for nearly two decades.[1] Because of the critical role they play in supporting research on college and university campuses across the country, particularly at research intensive universities, research data services have more recently become a central area of concern for an increased number of stakeholders, including offices of research, campus IT, and other units involved in the research enterprise.[2] Despite the widespread recognition of their importance, however, the development of research data services has been largely ad hoc, lacking cohesive cross-campus collaborations or strategic frameworks. As a result, many data-related services are siloed, difficult to locate, and available informally or by word of mouth, leaving researchers and administrators confused about the availability of data research support offerings, where they are located, and who can access them. The resulting opacity is a major barrier to better coordinating these offerings to minimize inefficiencies while continuing to offer services that are ready to adapt to researchers’ evolving support needs.
The need for universities to develop an efficient infrastructure of research data services is an even more urgent strategic priority now than it was in 2020.
Ithaka S+R has been following trends in research data services for several years as part of our research into the support needs associated with data-intensive research methodologies.[3] In 2020, we conducted a pilot project to inventory research data support services in the United States. This study revealed broad patterns and trends in the distribution and provision of research data services at US higher education institutions and marked an important first step toward understanding the quality, relevance, and capacity of university-based research data services.
Since the publication of our 2020 inventory, foundations and the federal governments in both the US and Canada have increased requirements around data management and sharing. As a result, the need for universities to develop an efficient infrastructure of research data services is an even more urgent strategic priority now than it was in 2020.
Yet even as the pressure on universities has grown, provisioning such services remains a challenge. While many universities have made substantial investments in research data services and are likely to continue to make further investments, obstacles such as decentralization and inefficiency, insufficient staffing, lack of technical expertise, and ambiguity about the needs of researchers continue to limit the impact of these investments.[4]
In light of these persistent challenges, and in the interest of providing up-to-date data to inform university decision making, Ithaka S+R revisited our inventory and expanded our scope to include Canadian universities. The new inventory findings are part of a larger collaboration with 29 research universities focused on coordinating research data services offered across campus and aligning them with the evolving needs of their research communities.[5] Our findings are based on a comprehensive review of data services offered at a representative sample of 120 US institutions (including R1, R2, and liberal arts colleges), and eight institutional members of the Canadian Association of Research Libraries (CARL).
The following are our high-level findings:
- While there are wide divergences in the number and variety of services offered both within and across Carnegie Classifications, R1 institutions offer approximately three times the number of services offered by R2s, and more than nine times the number offered by liberal arts colleges.
- General research data services are the most common type offered regardless of institution type. Statistical services, geospatial services, and visualization services are also common at research universities, which typically offer a much wider range of specialized services than liberal arts colleges.
- Libraries remain the largest provider of research data services at US and Canadian research universities, but IT and units associated with the research office play important collaborative roles, especially with specialized services.
- Bioinformatics services are offered almost exclusively through the interdisciplinary units associated with the research office or core facilities associated with medical schools.
- Consulting services are the most common mode of service provision, comprising almost three quarters of all data services.
We would like to thank the members of the 29 teams participating in our Data Services Assessment cohort project. The insights they have shared into their specific institutional struggles and successes with research data services have contributed greatly to our understanding of the current landscape. We also extend our sincere gratitude to Wind Cowles and Brian Westra for their helpful comments, questions, and suggestions as readers of a draft of this report. Finally, we are grateful to Ithaka S+R analysts Sage Love and Claire Baytas for their assistance in designing the inventory instrument and executing the inventory. Any errors or omissions remain our own.
A Web-Based Methodology
Research data services are provided by different campus units (e.g., academic libraries, IT departments, research institutes, core facilities, and medical schools), cover a variety of competencies (e.g., data management and curation, data visualization, spatial data and GIS, statistical consulting, and bioinformatics), and are intended for a range of audiences. This heterogeneity creates significant barriers to many common research methods that might, in theory, be appropriate for conducting an inventory. Survey-based approaches rely on the local knowledge of select individuals and are unlikely to yield comprehensive results because individual people rarely have a comprehensive understanding of all data services offered across their institution. Case studies provide deep insight into particular institutional models but are ill-suited to provide landscape findings or a holistic view. We decided that a systematic search of all institutional and department web pages would be the best method to identify distinct services spread across decentralized units and with a diversity of service models, as it would yield a holistic picture of institution-wide services.[6]
The web-based methodology initially introduced in our 2020 inventory served as the foundational framework for this project. We iteratively refined and adjusted the framework to conduct our updated inventory of research data services. Using the same definition of research data services, similar organizational units, and similar data service categories (all described below) as our original inventory, we used Qualtrics to create an instrument that allowed us to group findings based on service location, service mode, and service type or focus. We also included one question on the availability of high performance computing, one question on the availability of long term data storage, and one question regarding the DMPTool (an open-source tool for creating data management plans).[7]
Using this instrument, we systematically searched the websites of a random sample of 120 US colleges and universities and eight Canadian research universities. Beginning with the library and continuing through IT, academic departments, research office units, and medical schools, we cataloged publicly listed research data services at every school in our sample. Because our sample included R1s, R2s, and liberal arts colleges—schools with very different sizes, research agendas, and institutional structures—the time required to complete the search process varied significantly. R1s took approximately two hours to complete, R2s took approximately one to two hours to complete, and liberal arts colleges took approximately one hour to complete.
Our methodology required consistent decision making on how to count and categorize the data services we encountered. At times, this posed a challenge since schools advertise their service offerings very differently. For example, services in the library might be listed through libguides, in a “research support” menu, under the scholarly communication office, or under an open access tab. Moreover, in some cases, pages explicitly listed the details of each service, while others described services in general terms.
To establish a baseline and streamline how we counted services, we used the following definition of research data services: “Any concrete, programmatic offering intended to support researchers (including faculty, postdoctoral researchers, and graduate students) in working with data for research purposes.”[8] This means that we excluded services intended primarily to support teaching, as well as those focused solely on compliance with security standards or legal requirements. We also excluded all data services offered by offices of institutional research, that is offices conducting research on the college or university itself.
This web-based approach approximated the way a researcher without insider institutional knowledge might seek out services. Therefore, we did not include informal service offerings or word of mouth services, such as assistance offered by colleagues or support accessed through personal relationships. For the purposes of this inventory, if the service didn’t show up on an active webpage, it didn’t exist.
Determining Categorization
The following set of definitions determined how we categorized services:
Service Mode:
Consulting: One-to-one meetings by appointment or during drop-in office hours held to help researchers with a variety of topics related to their research data needs. Consulting may be offered in short sessions or longer-term collaborations.
Training: Workshops and workshop series, seminars, and non-credit-bearing classes, whether provided regularly or ad hoc. This did not include subscriptions to online training modules or research seminars. Workshop series are often offered on a rolling basis, and are listed differently (trainings, events, workshops) on different web pages, so we had to remain conscientious about how we counted these. Workshops offered as part of a series were counted as one service.
When reading the results, it is important to keep in mind that the total numbers show a snapshot in time of the services we located while conducting the inventory. Because consulting services are advertised and delivered differently than training services, which are often listed on university web pages only when they are actively being offered, our methodology is likely to yield a more reliable count of consultation services than of training services.
Service Type:
General Research Data Management: General, non-specialist (i.e., basic or intermediate level of technical sophistication, and not domain-specific) services that cover the whole lifecycle. Examples include assistance with file format selection, data management plans, data curation, processing data, data sharing and reuse; basic storage, version control.
Statistics: Statistical analysis in a multidisciplinary context, including database development for proper statistical analysis, statistical project design, training on statistical methods and statistical programming languages, statistical data analysis consultations. Bioinformatics are classified separately.
Geospatial: GIS mapping, statistical and numerical analysis specific to geospatial research, GIS database development, ArcGIS, editing geospatial statistical data, geoprocessing analysis, geospatial analysis, GIS consultations, data and research methods consultations, custom cartography and geovisualization consultations, remote sensing, spatial analysis, and modeling.
Visualization: Visualization (creation of images and diagrams for the presentation or analysis of data) in a multidisciplinary context, visualization display and software consultations, visualization of data and images assistance.
Bioinformatics: Bioinformatics and biostatistics help and consultations, informatics in a health sciences context, statistical genetics, data analysis, biomedical research data management.
Social Science emphasis: Similar to general data management, but explicitly marketed toward social scientists. Examples include interviews, survey design, survey data analysis, focus groups, and historical data.
Digital Humanities emphasis: Services that include training in areas such as corpus linguistics, text mining, and text analysis. Digital Humanities data services can be hard to differentiate from other services unless they are included under a tab explicitly titled “Digital Humanities.”
Clinical Data: Management of clinical trials data, assisting researchers with creating appropriate data collection instruments for collecting clinical data, clinical data management.
Health Sciences: Provision of services specific to health sciences such as electronic records data, claims data, administrative data, clinical trials, health survey, and disease registries.
Other: Services that otherwise do not fit into any of the defined categories above. An example of this could be “ethical data” services, services for teaching how to use Github, or high performance computing related services.
Service Provider:
We reviewed research data services offered through the following organizational units:
Library. We defined this category as the campus library system, inclusive of professional school libraries and health sciences libraries.
IT Department. This category included services offered by IT or research computing units housed within IT, whether located within a central office or decentralized at the school or college level. Services offered by research computing units affiliated with stand-alone institutes or research cores were included in the research office category.
Research Office: We defined this as a composite category that includes the interdisciplinary institutes, research cores, research facilities, data science institutes, as well as the actual research office. These centers are often indexed by the office of research or are visible on independent college or school websites.
Academic Departments: While we included all academic departments in this category, mathematics and statistics departments yielded the majority of the services we found.
Medical School. We defined a “medical school” as a school or college granting an MD. On some campuses, several academic units such as medical, nursing, and dental are combined into a health sciences campus. In many cases, these services were available to researchers inside and outside of the medical school. In these cases, unless the service was offered explicitly through and only for the medical school, we assigned the service to the research office category.
Finally, we included brief sections on the availability of high performance computing (HPC) resources, whether an institution hosted an institutional repository that accepted datasets for deposit, and whether the institution offered resources related to the DMPTool.[9] Just as in our 2020 inventory, we did not consider HPC to be a research data service; we only measured whether or not HPC resources, inclusive of cluster computing storage and short-term scratch storage, were directly accessible to researchers either on campus or at a regional shared facility. We also did not include data storage space under the research data services umbrella. Rather, for each institution in our sample, we noted the availability and location of an institutional repository that accepted datasets on campus.
Limitations
Our web-based methodology captured research data services that were publicly visible on websites of a sample of US and Canadian institutions. While we are confident our data provides a foundation from which to draw valuable insights and build further research, we cannot guarantee that those services listed on university websites are complete or up to date. Moreover, the organizational location and the way research data services are showcased on library websites varies considerably across all US Carnegie classifications. Some schools had clear but pared down service pages which may have resulted in fewer counted services than schools with more extensive descriptions of their services. It is also possible that in our search process, we did not find every service listed. Most importantly, simply capturing whether and where a service exists does not tell us other critical aspects, such as the quality of the service, who uses the service, and the frequency of engagement.
It is also important to note that more does not necessarily mean better, or to put it another way, quantity does not mean quality. The reader should not assume that institutions offering a greater number of services are necessarily providing better support to their communities.
The limitations to our study highlight the complexity and heterogeneity of the research data services landscape. Our inventory provides one piece to the much larger puzzle in understanding how best to build and sustain a research data services infrastructure capable of keeping up with the increased and evolving needs of researchers. We hope this inventory is useful to stakeholders across the academic community, and we invite feedback, questions, and discussion on our methodology and our results.
Results
US Institutions
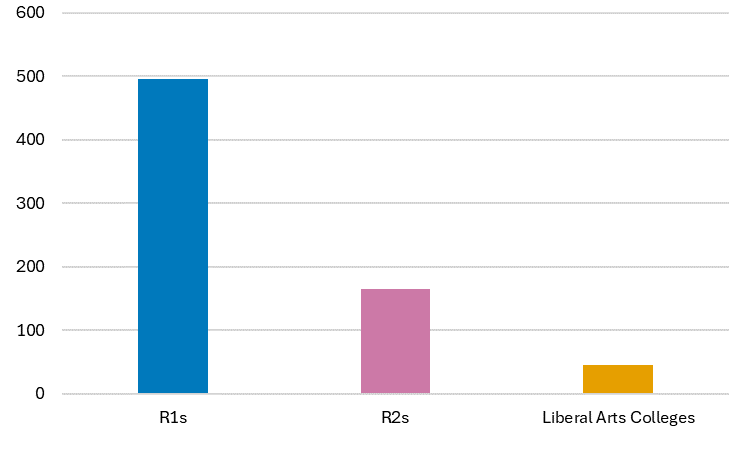
Overall, R1 institutions offer approximately three times as many services as R2s, and approximately 11 times more services than liberal arts colleges. We found 495 services across our sample of R1s, 165 services at R2s, and 45 services at liberal arts colleges. The average number of services in our R1 sample is 12.4 (range 1-32, median 11.5); the average number of services in our R2 sample is 4.1 (range 0-13, median 3); and the average number in our liberal arts sample is 1.1 (range 0-8, median 0) (Figure 1).
Figure 1: Total number of research data services at US institutions by Carnegie Classification[10]
However, the differences in the total number of services offered by individual institutions within Carnegie Classifications are as pronounced as the variations across them. Our findings indicate a small number of institutions are currently offering a wide variety of distinct services. While 100 percent of R1s offered at least one research data service, just six R1s account for almost one third of the R1 total number of services offered by R1s. Similarly, just over 90 percent of R2s offer at least one research data service, but five R2s account for almost a third of the R2 total. Liberal arts colleges also show significant disparities in the number of services they offer, despite being much less likely than research universities to offer even one research data service. Only 38 percent of liberal arts colleges provided at least one service, and just three schools accounted for over one third of all services offered by liberal arts colleges included in our sample (Figure 2).[11]
Figure 2: Number of research data services offered at each school in three Carnegie Classifications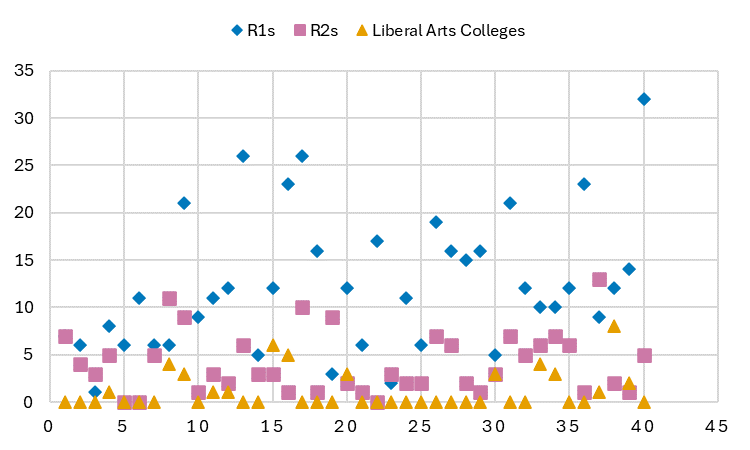
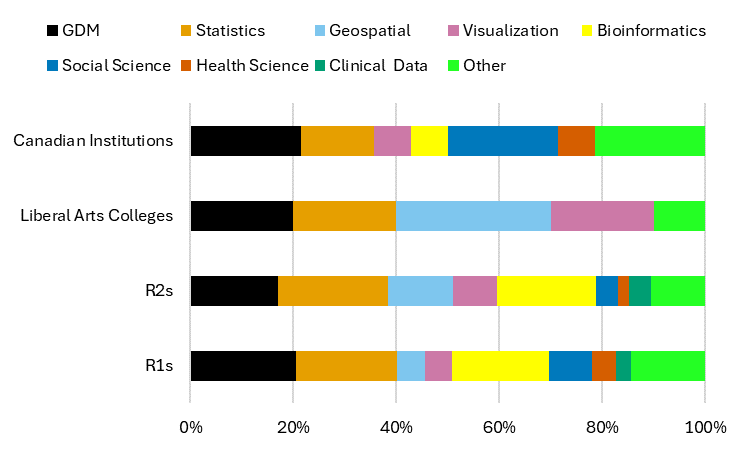
With regard to the types of services offered across campus, R1s and R2s share roughly similar profiles. At R1s and R2s, general research data management is the most commonly offered service, followed by statistics and geospatial services. Visualization and bioinformatics services are also well represented at research institutions. In contrast, services tailored specifically to digital humanities, health science, social sciences, and clinical data are relatively rare (Figure 3).
Figure 3: Types of research data services offered by Carnegie Classification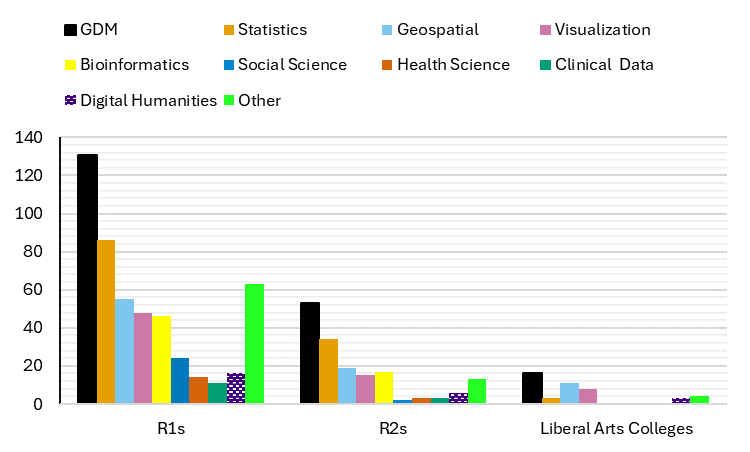
Researchers at the typical R1 university can expect to have access to at least one general research data management service (GDM), one statistical service, one geospatial service, one visualization service, and one bioinformatics service. At the typical R2 institution, researchers can usually rely on having access to one research data management service and one or two additional statistics or geospatial services, but with fewer medical schools connected to R2s, they are less likely to have access to bioinformatics services (Figure 3).
Researchers at liberal arts colleges will almost certainly have fewer options available to them. Like research institutions, liberal arts colleges offer more general research data management services than any other service type (Figure 3). However, with only 30 percent of sampled liberal arts schools providing general research data management services, they remain uncommon on liberal arts campuses. Statistical services and bioinformatics services are even more uncommon, provided by 5 percent and 0 percent of liberal arts colleges, respectively.
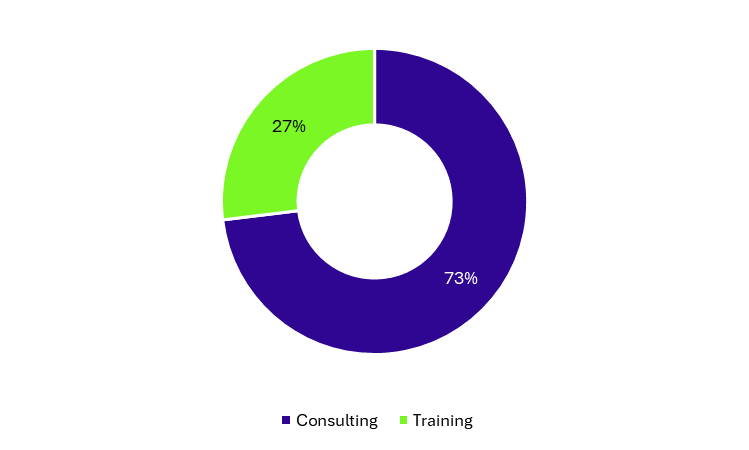
Regardless of institution type, consulting services are significantly more common than training services, with nearly three out of four services delivered through consulting. In fact, only the library offered a substantial percentage of their services through training sessions or workshops. All other service providers rely largely on the consultation model (Figure 4).
Figure 4: Percentage of all research data services offered through consultation and training
Canadian Universities
In contrast to the variation we found within US institutions, Canadian universities had very similar research data services profiles. We found 60 services in our sample of Canadian universities with an average of 6.6 services for each university (range 5-15, median 6). General research data management is the most commonly offered service, though statistics, geospatial, and visualization services follow not far behind. Bioinformatics services appear significantly less common at Canadian research institutions than at US research institutions (Figure 5).
Figure 5: Types of services offered by Canadian institutions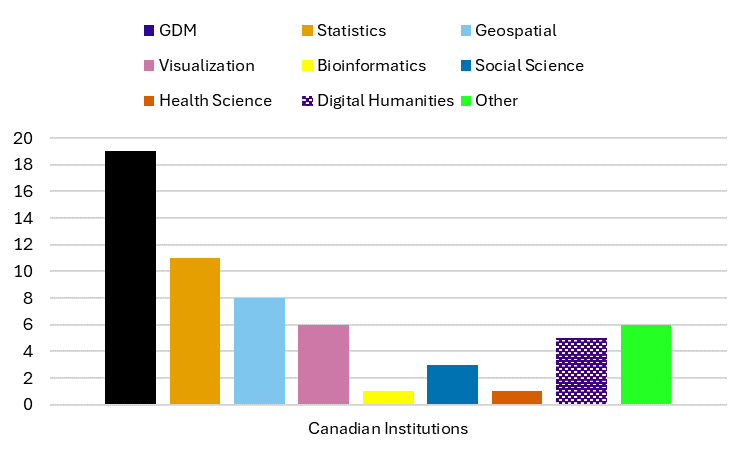
The relative uniformity in service offerings by Canadian institutions can be attributed, at least in part, to the implementation of the Tri-Agency Research Data Management Policy in 2021.This policy required any institution that administers Tri-Agency funding to develop and publish an institutional research data management strategy by 2023.[12] As a result, Canadian university websites had clearly defined, published research data management strategies and a clearly defined research data management team, predominantly situated within the library. The uniform clarity in which services were displayed suggests the top-down mandate has resulted in relatively cohesive data management strategies and services at Canadian institutions.
Service Providers
The Library
Libraries are central players in the research data services infrastructure, offering a large and diverse range of services on campuses. In our sample of US research institutions, libraries are responsible for approximately 40 to 45 percent of all research data services offered by the institution. Liberal arts colleges and Canadian universities exhibit an even higher reliance on library services, with libraries providing approximately 60 percent of overall services we found in both samples (Figure 6). Regardless of institution type, libraries offer more research data services than any other university unit. This is especially true at institutions offering only one to three services: those services were almost always provided by the library.[13]
Figure 6: Percentage of research data services per campus provider at US and Canadian institutions 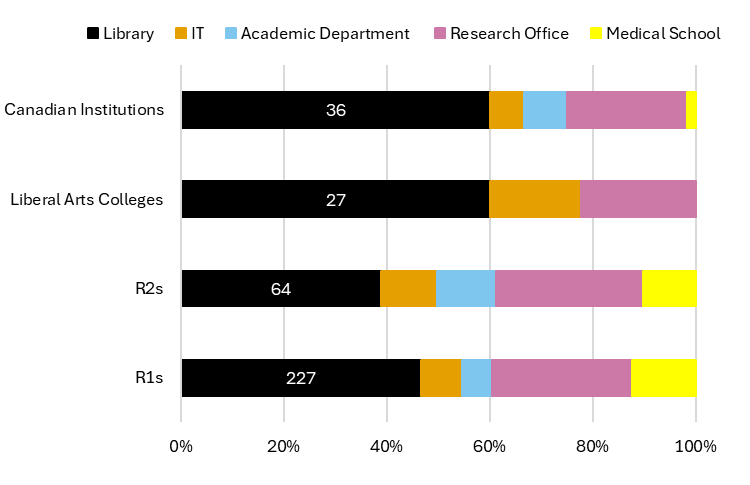 Beyond contributing the highest proportion of total campus services, libraries lead all other units in the percentage of service provision according to the sample. Ninety-eight percent of sampled R1 libraries offer at least one research data service, and an additional 28 percent of these libraries offer a particularly robust menu of data services of eight or more services. Fifty-five percent of R2 libraries offer at least one service, with 25 percent offering more than three. Libraries at liberal arts colleges are less engaged, with only about one third providing at least one research data service. Nonetheless, this number is still significantly higher than all other service providers at liberal arts schools. Remarkably, all libraries at Canadian institutions in our sample offered at least two research data services.
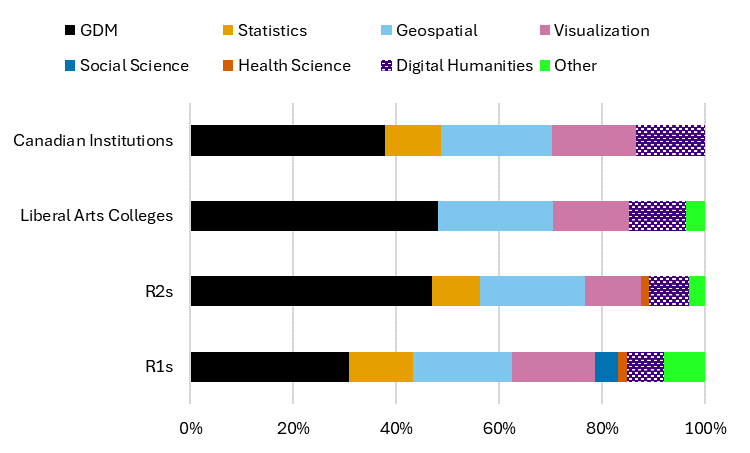
Libraries tend to provide services that are pitched to broader audiences, rather than tailored to specific disciplines, and are particularly invested in offering general research data management services (Figure 7). Geospatial and visualization services, as the second and third most common services provided by libraries, follow not too far behind. Libraries at research universities are also active providers of statistical services. Notably, libraries are the principle, and in most cases only, unit that provides services for digital humanities.
Figure 7: Research data service types provided by libraries at US and Canadian institutions
Nearly all R1s and many R2 libraries, even those with few staffed services, have up-to-date data management resource pages or libguides that include links to outside resources such as web tutorials, information about the NIH data sharing mandate, and the DMPTool. Many libraries also included a list of discipline specific resources for finding data. The high quality of these resource pages suggests that research data management is an important concern for libraries, regardless of the extent of their consultation or training service offerings.
The visibility of the DMPTool on R1 and R2 web pages also suggests increased attention to research data management at research universities. Since its launch in 2011, the DMPTool has grown from eight higher education institutions working collaboratively to more than 330 participating higher education institutions today.[14] The increase in participation has been especially significant in response to the new federal policies as institutions search for methods to ensure compliance.[15] Every R1 university and 70 percent of the R2 institutions in our sample are participating members of the DMPTool, and information about the DMPTool was most commonly included on library pages. However, it is important to recognize that institutional membership and the presence of the DMPTool on webpages does not automatically translate to widespread use among researchers, nor does it imply a deeply rooted institutional commitment to research data management practices.
In sharp contrast with the comprehensive resources available on many research university websites, liberal arts colleges present a much different picture with regard to libguides or other online resources for research data management. In fact, it was common not to find either services or references to online research data management resources or the DMPTool at liberal arts colleges.
IT and Research Computing
IT services only account for between 8 to 15 percent of research data services (See Figure 6). However, IT services are more important to the research data services ecosystem than their modest numbers might suggest, especially at research universities. IT is a key collaborator with the library and the office of research, and some of the services we counted as being offered by the library or research office were offered in partnership with IT.[16] Moreover, as research computing continues to expand and high performance computing becomes more integral to research processes across disciplines, the specialized expertise in computing, technical support, and storage that IT can provide will remain in high demand. Indeed, a number of case studies have confirmed the value of IT expertise to a robust research data services infrastructure, making it especially important to note that the qualitative impact of IT units is not reflected in the relatively small proportion of services cataloged in our inventory.[17]
Academic Departments
While changes in our methodology make a direct comparison impossible, research data services offered by academic departments at US institutions appear to have declined since the 2020 inventory. Indeed, we did not find any data services offered through academic departments at liberal arts schools, and academic departments accounted for approximately 7 percent of total services offered across campus at R1s and 12 percent of total services at R2s (See Figure 6). This may signal a trend towards research data services consolidating into interdisciplinary or more neutral campus locales like the library, where the services can be engaged by a more diverse set of researchers and staffing responsibilities can be shared.
One exception to this pattern is that statistical consulting services at research universities are still often offered by mathematics and statistics departments. At R1 universities, academic departments provide about 25 percent of statistical consulting services (Figure 8). However, very few R1 institutions rely entirely on statistical services offered by academic departments. In most cases, statistical services are also offered through the library, a research office unit, or the medical school.
The fact that there are statistical services offered fairly evenly across the organizational structure at R1s, and often by two or more units, may suggest that R1s are responding to high demand for these services from researchers across disciplines. However, it may also indicate a lack of communication and efficient coordination between campus partners. Some researchers might be accustomed to receiving statistical support from mathematics departments and would not think to go to the library, for example, while others may not think the services offered through an academic department are available to them. Additionally, the cost associated with statistical services may influence researcher choice; some may forgo statistical support if it incurs a fee unless they deem it essential and have the funds. Libraries typically do not charge fees, while other service providers might. Multiple statistical services providers in different locations across campus, while intended to meet diverse needs, could inadvertently lead to confusion among researchers about where to obtain the resources best suited to their needs.
At R2 universities, there are fewer duplicate services overall, and academic departments are more significant contributors to statistical services across campus, providing approximately 40 percent of statistical services (Figure 8). Of the R2s that provided statistical consulting services through academic departments, the vast majority are the sole providers of statistical consulting service on campus. Thus, while the overall percentage of services offered by academic departments is small, they remain significant providers of statistical services (most notably at R2 universities), which is a key element in the data services landscape.
Figure 8: Percentage of statistical services per campus provider
Research Office
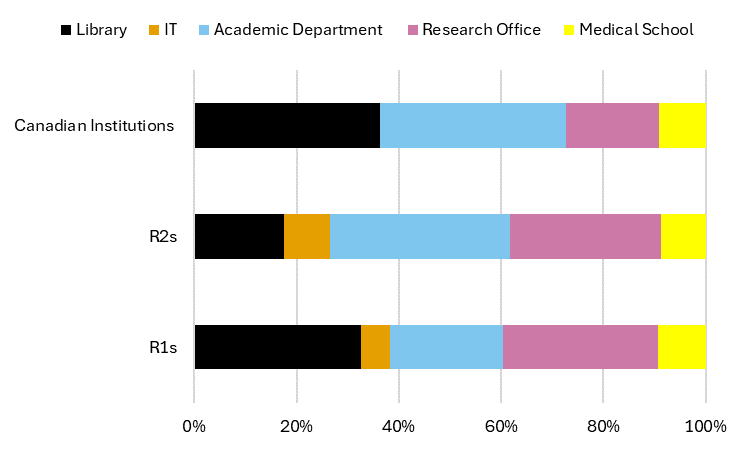
Research offices offer approximately one quarter of all research data services at US and Canadian institutions (See Figure 6). Comprising core facilities, interdisciplinary institutes, and units within the research office proper, the category we call the research office functions in a dual capacity, catering to both interdisciplinary and niche discipline-specific needs. This is most apparent at R1s and R2s where general research data management (GDM), statistics, and bioinformatics each account for approximately 20 percent of services delivered through units associated with the research office (Figure 9).
Figure 9: Research data service types provided by the research office (core facilities, interdisciplinary institutes, and units within the research office) at US and Canadian institutions
The research office is an especially important provider of bioinformatics services, delivering just over 50 percent of all bioinformatics data services on R1 and R2 campuses (Figure 10). These contributions are particularly noteworthy because the services support clinical, translational, and basic researchers alike. They are also important because bioinformatics research often involves research computing expertise and services to support it consequently require some degree of interdisciplinary collaboration. To that end, many of the bioinformatics services we found in research office units, particularly at R1s, also served researchers at the associated medical school if there was one.
Figure 10: Percentage of bioinformatics services per campus provider at R1s and R2s
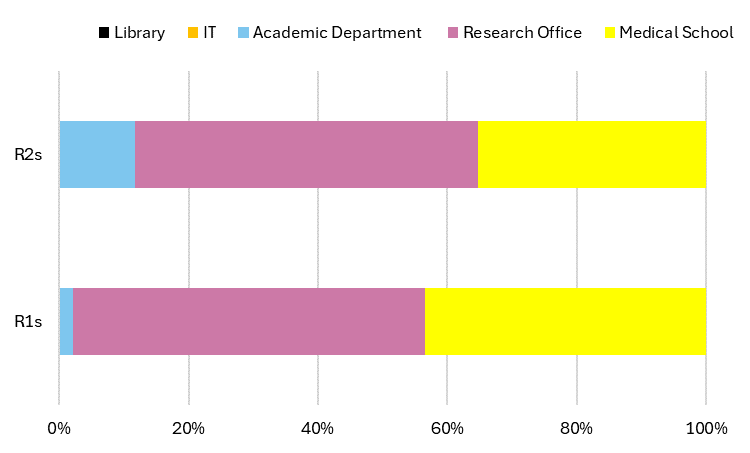
Medical School
Fifteen of the 25 R1 medical schools in our sample delivered research data services. Of these medical schools, 80 percent included bioinformatics services in their menu.[18] Indeed, medical schools are a vital partner in the provision of bioinformatics research data services across R1 campuses, sharing the provision of these services almost evenly with the research office (See Figure 10). Medical schools also split the provision of clinical data and health sciences services fairly evenly with the research office, although these service types represent a very small fraction of overall services we found at R1s.
Researchers at six of the ten medical schools that didn’t appear to offer research data services had access to bioinformatics services through the research office. We found only three R1 schools where medical researchers didn’t appear to have access to at least one bioinformatics service either through the library or through the research office.
Although there are fewer medical schools in the R2 sample (seven in total), researchers associated with R2 medical schools also have reliable access to at least one bioinformatics service. Eighty percent of R2 medical schools offered bioinformatics services, and the remaining 20 percent provided bioinformatics services through the research office.
Two of the sampled Canadian institutions had medical schools but statistical consulting appeared to be the only available service; we did not find any bioinformatics services in the medical school. In fact, bioinformatics services comprise just one percent of the overall services we located at Canadian institutions.[19]
High Performance Computing and Repository
While all of the Canadian institutions sampled provided access to HPC resources, there are significant differences in the level of access US researchers and faculty have to these resources depending on their institutional affiliation. One hundred percent of R1 schools provided access to HPC resources, the vast majority of which were provided on premises, but this number shrinks to 75 percent at R2s and to only 25 percent at liberal arts Schools.
There are similar differences between US institutional types with regard to an institutional repository on campus. Ninety-five percent of R1s had institutional repositories that accepted datasets, as did approximately 80 percent of R2s. By contrast, only 25 percent of liberal arts colleges had an institutional repository. All the Canadian institutions had established institutional repositories.
Conclusion
Coordination, Collaboration, Communication
As the pace of change in research and technology speeds ahead and demand for complex research data support grows, stakeholders in the research data services ecosystem will be challenged to keep pace. Budgetary constraints will continue to pose significant problems as institutions consider how to scale their services to meet these demands effectively without overstretching their financial resources.[20] Our findings do not tell us definitively whether the services we inventoried are optimally distributed for an efficient and cohesive data service infrastructure, but highlighting where services are concentrated can guide stakeholders to identify priority areas on their campuses and to find potential cross-campus and cross-institutional collaboration. For example, the integration of artificial intelligence and machine learning techniques in bioinformatics and biomedical research will likely draw the medical school and interdisciplinary research cores associated with the research office closer, a trend our findings demonstrate is already underway.
Highlighting where services are concentrated can guide stakeholders to identify priority areas on their campuses and to find potential cross-campus and cross-institutional collaboration.
Finding ways to scale up research data services offerings to meet demand is complicated by the fact that consulting services outnumber training services. Consulting services have significant advantages as a delivery model: they provide researchers with individualized support that is responsive to the unique needs and problems of individual research projects in ways that workshops and other trainings cannot readily replicate. In some cases, researchers are creating long-term collaborations with data librarians and other support staff. These collaborations have significant potential to improve data management throughout the research lifecycle. However, the individualized attention involved in consulting and collaborative models is time and resource intensive. Consulting, especially long-term consulting, can also require expertise in highly specialized research areas.
Better coordination between service-providing units is an important step in creating an infrastructure that can provide appropriate levels of consulting support while staying within the institutional budget.
Better coordination between service-providing units is an important step in creating an infrastructure that can provide appropriate levels of consulting support while staying within the institutional budget.[21] Our inventory provides data that may help institutions identify opportunities to distribute existing staff resources or develop cost-sharing arrangements for hiring and retaining specialized staff if capacity is determined to be a problem. The inventory can also help institutions evaluate their allocation of resources to long-term support for the development and maintenance of data literacy skills among staff members in the library and other service-
providing units.[22] But even with the potential for our findings to inform proactive institutional efforts, there is no way around the core problem: no single institution could conceivably support the staff required to provide deep collaboration with its entire research community, regardless of the benefits of doing so would provide for scientific research.
Cross-institutional networks such as the Data Curation Network (DCN) offer an additional path to approach the challenge of meeting demand for high-quality research data services. The DCN fosters communities of practice among data professionals at member institutions and provides “a shared-curation workflow, in which datasets from one institution are matched with an expert at a different member institution.”[23] Similarly, consortial HPC networks such as the Open Science Grid (OSG) and the Massachusetts Green High Performance Computing Center (MGHPCC) could increase the research data services offerings they provide to complement the shared access to HPC resources.[24] Tools like the DMPTool and platforms like The Carpentries and the Digital Resource Alliance of Canada are also important efforts to find collective solutions to the challenges of offering robust research data services. The recent 2024 pilot project jointly undertaken by the Association of Research Libraries (ARL) and the California Digital Library (CDL) dedicated to the “integration or creation of prototypes and possible workflows for machine-actionable data management and sharing plans (maDMSPs)” suggests a trend of growing collaborative action.[25]
Cross-institutional collaborative efforts may be especially beneficial for smaller or less resourced institutions, which offer many fewer services than well-resourced research universities. This disparity reflects the inequitable distributions of resources within higher education, though it also reflects ideas about the differing missions of institutions. For example, liberal arts schools are generally considered to be teaching institutions rather than research institutions. Librarians and other research data services stakeholders at these institutions often face an uphill battle in trying to implement a research data support infrastructure because they are working against the long-held notion that data intensive research doesn’t happen on their campus. However, research data management services for faculty and researchers at smaller liberal arts colleges are still highly valuable, and in many cases crucial, because faculty and students at smaller schools often generate, collect, and work with data without a large network of peers from which to draw support.[26]
To better facilitate research, service provisioners will need to address general misconceptions about the library and prioritize communicating and marketing their service offerings.
Finally, consistency and clarity in how services are communicated to researchers is just as vital to provisioning an effective research data services infrastructure as cross-unit coordination and cross-campus collaboration. This appears especially true for libraries, as highlighted by a number of studies that demonstrate library patrons often have disparate and contradicting ideas of what the library provides.[27] Lack of awareness about what is available at the library and across campus hinders researcher engagement with services, making it difficult to evaluate, adapt, and improve offerings. To better facilitate research, service provisioners will need to address general misconceptions about the library and prioritize communicating and marketing their service offerings.
Long-term Planning
In addition to navigating budgetary constraints and the research data policy landscape, institutions face the challenge of how to plan for the longevity of their research data services. This is particularly difficult for US institutions in part because they do not yet have clear guidance or consensus on which tools to use to assess their current services or future strategy. In this regard, the US lags quite significantly behind Europe, Canada, and Australia, locations that all have access to research data management maturity assessment models (e.g., RISE, SPARC, ANDS, and MAMIC) tailored to their specific research contexts.[28] The historic lack of benchmarking tools and top down guidance for research data management maturity assessment and sustainability has likely contributed to the ad hoc way research data services have developed in the US.[29] The vast diversity of service offerings we found suggests US institutions are largely operating without a shared, structured framework to evaluate the effectiveness, efficiency, and sustainability of their research data services.
While the variation among US institutions makes it clear that some degree of locally tailoring support to specific contexts is necessary, one effort to help provide clear benchmarks and systematic guidance for US institutions has recently emerged from the field of research computing. The Campus Research Computing Consortium (CaRCC) has been working in this area and has developed the Research Computing and Data (RCD) Capabilities Model to help institutions “assess their support for computationally- and data-intensive research, to identify potential areas for improvement, and to understand how the broader community views Research Computing and Data.”[30] This model is a promising effort and, especially as research computing data services become more integrated into the “standard” menu of data services, will help institutions refine their long-term planning. However, this tool focuses on the needs of service provisioners working with computational data, and many service providers, especially those based in the library, may not be aware of it or may only find parts of it directly useful, especially if they are not already partnering with research computing.
Future Research
As computationally driven, data intensive research continues to grow, and as the need for AI governance becomes more apparent, it will be crucial to gain a better understanding of research computing in relation to research data services. What is the optimal method to deliver research data services for computational research across disciplines? What is the best administrative home for these services? Should these services be integrated into campus AI initiatives or campus open source efforts? How can these services facilitate research from a range of disciplines and serve researchers with various levels of computational understanding?
A number of organizations and institutions are already working hard on answers to these questions. For example, the Research Facilitation Service at North Carolina State University serves as a connecting unit between research computing, the library, and IT and helps researchers determine what kind of data support they might need as they navigate the increasingly complex technological infrastructure required to conduct research.[31] Membership organizations such as CaRCC and Educause are fostering active communities of practice, sharing ideas and strategies for providing HPC related services. Future studies on how and where HPC related data services are offered and staffed would complement both our study and these existing efforts.
Secure data storage fell outside of the scope of this study, but like HPC, it is a pressing issue with growing daily urgency. Further study of how individuals, disciplines, and institutions manage data security issues related to data stored in house and on private servers would provide greater insight into this important area than is possible using our instrument.[32]
Understanding frameworks and levels of support for Indigenous data management is another significant area for future research, particularly in assessing the implementation of the CARE principles in research data services and repositories at higher education institutions. This is especially urgent as AI technologies make broad use of secondary data, and the safeguards to ensure Indigenous rights over the use of their data are not well understood. During our inventory, we noted an uneven approach to Indigenous research data sovereignty and governance, with some institutions highlighting its importance and others making no mention of it. The Native Nations Institute at the University of Arizona is a leader in this space and is actively researching, advocating for, and developing policies and frameworks for Indigenous data sovereignty.[33] Continued study of existing, emerging, and potential models to fully integrate the CARE principles into research data service offerings and repository services will help to further spread awareness of the CARE principles, identify gaps or challenges to incorporating them, and offer examples for how best to implement them.[34]
Finally, a project focused on understanding informal support channels, their functions at various institutional levels, in diverse disciplines, and accessibility factors would complement our inventory. Our previous reporting on data-intensive research practices has made it clear that researchers are frequent users of web-based tutorials, word of mouth, and other informal learning opportunities.[35]
Appendix 1
Changes to Our Methodology
Our methodology for this inventory closely follows the methodology developed for our 2020 inventory. However, we have made several modifications to speed data collection, improve the quality of those data, and better reflect the research data services landscape. Specific changes are as follows:
We eliminated the sub-categorization of service offering as either “front end work” or “back end work,” due to the current limited value of this classification. We also did not include “business emphasis” or “STEM emphasis” in service types because services described as such did not appear in our preliminary instrument testing.
In addition, we made a small adjustment to the organization of campus locations. In our 2020 inventory, centers, institutes, and “core” facilities that are affiliated with a professional school or academic department were relegated to an “other” category. We decided to include these in the research office category because the services we found in these locations were almost always available to researchers across campus, regardless of whether they were affiliated with those departments or professional schools. For similar reasons, we grouped services offered on health sciences campuses in the research office category, unless specifically provided by and for the medical school.
After testing the instrument with staffing models included, we determined it too difficult to collect information on how services were staffed by looking at the website alone, so we did not include staffing models in our instrument.
Finally, we included eight Canadian schools, or approximately 30 percent of CARL institutions in our sample.
Appendix 2
Figure Data
Figure 1: Total number of research data services at US institutions by Carnegie Classification
| R1s | R2s | Liberal Arts Colleges | |
|---|---|---|---|
| Number of data services | 495 | 165 | 45 |
Figure 2: Number of research data services offered at each school in three Carnegie Classifications
| R1s | R2s | Liberal Arts Colleges |
|---|---|---|
| 7 | 7 | 0 |
| 6 | 4 | 0 |
| 1 | 3 | 0 |
| 8 | 5 | 1 |
| 6 | 0 | 0 |
| 11 | 0 | 0 |
| 6 | 5 | 0 |
| 6 | 11 | 4 |
| 21 | 9 | 3 |
| 9 | 1 | 0 |
| 11 | 3 | 1 |
| 12 | 2 | 1 |
| 26 | 6 | 0 |
| 5 | 3 | 0 |
| 12 | 3 | 6 |
| 23 | 1 | 5 |
| 26 | 10 | 0 |
| 16 | 1 | 0 |
| 3 | 9 | 0 |
| 12 | 2 | 3 |
| 6 | 1 | 0 |
| 17 | 0 | 0 |
| 2 | 3 | 0 |
| 11 | 2 | 0 |
| 6 | 2 | 0 |
| 19 | 7 | 0 |
| 16 | 6 | 0 |
| 15 | 2 | 0 |
| 16 | 1 | 0 |
| 5 | 3 | 3 |
| 21 | 7 | 0 |
| 12 | 5 | 0 |
| 10 | 6 | 4 |
| 10 | 7 | 3 |
| 12 | 6 | 0 |
| 23 | 1 | 0 |
| 9 | 13 | 1 |
| 12 | 2 | 8 |
| 14 | 1 | 2 |
| 32 | 5 | 0 |
Figure 3: Types of research data services offered by Carnegie Classification
| R1s | R2s | Liberal Arts Colleges | |
|---|---|---|---|
| GDM | 131 | 53 | 16 |
| Statistics | 86 | 34 | 3 |
| Geospatial | 55 | 19 | 11 |
| Visualization | 48 | 15 | 8 |
| Bioinformatics | 46 | 17 | |
| Social Science | 24 | 2 | |
| Health Science | 14 | 3 | |
| Clinical Data | 11 | 3 | |
| Digital Humanities | 16 | 6 | 3 |
| Other | 63 | 13 | 4 |
Figure 4: Percentage of all research data services offered through consultation and training
| Consulting | 73% |
| Training | 27% |
Figure 5: Types of services offered by Canadian institutions
| GDM | 19 |
| Statistics | 11 |
| Geospatial | 8 |
| Visualization | 6 |
| Bioinformatics | 1 |
| Social Science | 3 |
| Health Science | 1 |
| Digital Humanities | 5 |
| Other | 6 |
Figure 6: Percentage of research data services per campus provider at US and Canadian institutions (raw numbers by provider)
| R1s | R2s | Liberal Arts Colleges | Canadian Institutions | |
| Library | 227 | 64 | 27 | 36 |
| IT | 38 | 18 | 8 | 4 |
| Academic Department | 29 | 19 | 5 | |
| Research Office | 132 | 47 | 10 | 14 |
| Medical School | 60 | 17 | 1 |
Figure 7: Research data service types provided by libraries at US and Canadian institutions
| R1s | R2s | Liberal Arts Colleges | Canadian Institutions | |
| GDM | 69 | 30 | 13 | 14 |
| Statistics | 28 | 6 | 0 | 4 |
| Geospatial | 43 | 13 | 6 | 8 |
| Visualization | 36 | 7 | 4 | 6 |
| Social Science | 10 | 0 | ||
| Health Science | 4 | 1 | ||
| Digital Humanities | 16 | 5 | 3 | 5 |
| Other | 18 | 2 | 1 |
Figure 8: Percentage of statistical services per campus provider (raw numbers by provider)
| R1s | R2s | Canadian Institutions | |
| Library | 28 | 6 | 4 |
| IT | 5 | 3 | |
| Academic Department | 19 | 12 | 4 |
| Research Office | 26 | 10 | 2 |
| Medical School | 8 | 3 | 1 |
Figure 9: Research data service types provided by the research office (core facilities, interdisciplinary institutes, and units within the research office at US and Canadian institutions
| R1s | R2s | Liberal Arts Colleges | Canadian Institutions | |
| GDM | 27 | 8 | 2 | 3 |
| Statistics | 26 | 10 | 2 | 2 |
| Geospatial | 7 | 6 | 3 | |
| Visualization | 7 | 4 | 2 | 1 |
| Bioinformatics | 25 | 9 | 1 | |
| Social Science | 11 | 2 | 3 | |
| Health Science | 6 | 1 | 1 | |
| Clinical Data | 4 | 2 | ||
| Other | 19 | 5 | 1 | 3 |
Figure 10: Percentage of bioinformatics services per campus provider at R1s and R2s (raw numbers by provider)
| R1s | R2s | |
| Library | ||
| IT | ||
| Academic Department | 1 | 2 |
| Research Office | 25 | 9 |
| Medical School | 20 | 6 |
Endnotes
- Examples of relevant scholarship are far too many to include all. Some examples are: Elise Gowen, and John Meier, “Research Data Management Services and Strategic Planning in Libraries Today: A Longitudinal Study,” Journal of Librarianship and Scholarly Communication 8 (2020) https://doi.org/10.7710/2162-3309.2336; Julie Goldman, Jennifer Muilenburg, Andrea N. Schorr, Peace Ossom-Williamson, and C. Jeff Uribe-Lacy, “Trends in Research Data Management and Academic Health Sciences Libraries,” Medical Reference Services Quarterly 42, no. 3 (2023): 273-293, DOI:10.1080/02763869.2023.2218776; Stephen Pinfield, Andrew M. Cox, and Jen Smith, “Research Data Management and Libraries: Relationships, Activities, Drivers and Influences,” PLoS ONE 9, no. 12 (2014), https://doi.org/10.1371/journal.pone.0114734; Bethany Latham, “Research Data Management: Defining Roles, Prioritizing Services, and Enumerating Challenges,” The Journal of Academic Librarianship 43 (2017): 263-265; Carol Tenopir, Dane Hughes, Suzie Allard, Mike Frame, Ben Birch, Lynn Baird, Robert Sandusky, Madison Langseth, and Andrew Lundeen, “Research Data Services in Academic Libraries: Data Intensive Roles for the Future?” Journal of eScience Librarianship 4, no. 2 (2015) http://dx.doi.org/10.7191/jeslib.2015.1085. ↑
- Alisa B. Rod, Biru Zhou, and Marc-Etienne Rousseau, “There’s No ‘I’ in Research Data Management: Reshaping RDM Services Toward a Collaborative Multi-Stakeholder Model,” Journal of eScience Librarianship 12, no. 1 (2023), https://doi.org/10.7191/jeslib.624; John Chodacki, Cynthia Hudson-Vitale, Natalie Meyers, Jennifer Muilenburg, Maria Praetzellis, Kacy Redd, Judy Ruttenberg, Katie Steen, Joel Cutcher-Gershenfeld, and Maria Gould, “Implementing Effective Data Practices: Stakeholder Recommendations for Collaborative Research Support,” Association of Research Libraries, September 2020, https://doi.org/10.29242/report.effectivedatapractices2020. ↑
- See for example: Dylan Ruediger et al, “Leveraging Data Communities to Advance Open Science: Findings from an Incubation Workshop Series,” Ithaka S+R, 9 August 2022, https://doi.org/10.18665/sr.317145; Melissa Blankstein, “Ithaka S+R US Faculty Survey 2021,” Ithaka S+R, 14 July 2022, https://doi.org/10.18665/sr.316896; Dylan Ruediger and Ruby MacDougall, “Are the Humanities Ready for Data Sharing?” Ithaka S+R, 6 March 2023, https://doi.org/10.18665/sr.318526; Dylan Ruediger, et al, “Big Data Infrastructure at the Crossroads: Support Needs and Challenges for Universities,” Ithaka S+R, 1 December 2021, https://doi.org/10.18665/sr.316121. ↑
- Rebecca Bryant, Brian Lavoie, and Constance Malpas, “A Tour of the Research Data Management (RDM) Service Space: The Realities of Research Data Management, Part 1,” OCLC Research, 2017, https://doi.org/10.25333/C3PG8J. ↑
- Ruby MacDougall, “Building Campus Strategies for Data Support Services Project Kicks Off,” Ithaka S+R, 2 February 2023, https://sr.ithaka.org/blog/building-campus-strategies-for-data-support-services-project-kicks-off/. ↑
- In their 2017 study, “Research Data Management Services in Academic Libraries in the US: A Content Analysis of Libraries’ Websites,” Ayoung Yoon and Teresa Schultz also examine websites to understand research data services offerings. Yoon and Schultz focus their study on library web pages and employ content analysis to examine the scope of available services. See: Ayoung Yoon and Teresa Schultz, “Research Data Management Services in Academic Libraries in the US: A Content Analysis of Libraries’ Websites,” College & Research Libraries 78, no. 7 (2017) https://crl.acrl.org/index.php/crl/article/view/16788/18346. ↑
- We designed this inventory to maintain as much consistency as possible with our 2020 inventory, but after we tested the instrument, we made some adjustments to the typology of services. These changes, while not extensive, impact the ability to make longitudinal comparisons with the 2020 survey. As such, references to our 2020 study are limited, and we have approached the analysis of data from this study largely independently, without extensive comparative evaluation against the 2020 data. We have included the changes we made to the original methodology in Appendix 1. To read a full account of the 2020 methodology see: Jane Radecki and Rebecca Springer, “Research Data Services in US Higher Education,” Ithaka S+R, 18 November 2020, https://sr.ithaka.org/publications/research-data-services-in-us-higher-education/. ↑
- This is the same definition we used in our 2020 inventory: https://sr.ithaka.org/publications/research-data-services-in-us-higher-education/ ↑
- Established by the California Digital Library (CDL) in 2011, the DMPTool is a free, open source, online tool that supports researchers in fulfilling funder data sharing requirements by streamlining their data management plan process with ready to use templates and checklists. It also allows researchers to browse data management plans, get step by step guidance on their plans, and, for researchers whose institutions are participating members, provides institutionally specific information. ↑
- The data for each figure is included in Appendix 2. ↑
- The differences we observed among schools within the same Carnegie classifications illustrates the tremendous diversity within the higher education landscape, particularly in terms of strategic priorities, funding allocation, and overall resource availability. Beginning in 2025, Carnegie Classifications will be updated to “better group and organize like institutions to accurately reflect the broad scope of their work with students, communities, and the broader public purposes of higher education.” Depending on the criteria, a future landscape assessment may reveal more uniformity among “like” schools. For more on the plan to redefine Carnegie classifications see: “2025 Basic Classification,” https://carnegieclassifications.acenet.edu/carnegie-classification/basic-classification/. ↑
- See: “Tri-Agency Research Data Management Policy,” Government of Canada, https://science.gc.ca/site/science/en/interagency-research-funding/policies-and-guidelines/research-data-management/tri-agency-research-data-management-policy. ↑
- It is important to note that we did not differentiate between health sciences libraries and university libraries. For institutions with health sciences libraries, data services were nearly always coordinated between the two libraries and listed on the webpages of both locations. In some cases, the university library webpage appeared to include a more updated version of service offerings than the health sciences library. Very rarely, we found health sciences libraries that showcased only their own services and described them specifically for health sciences. This likely has some bearing on the number of services we counted specifically as “health sciences emphasis.” ↑
- For more on participating institutions see: DMP Tool, “Participating Institutions,” https://dmptool.org/public_orgs. ↑
- Maria Praetzellis, Matthew Buys, Xiaoli Chen, John Chodacki, Neil Davies, Kristian Garza, Catherine Nancarrow, Brian Riley, Erin Robinson, “A Programmatic and Scalable Approach to Making Data Management Machine-Actionable,” Data Science Journal 22, no. 1 (2023): 26, https://doi.org/10.5334/dsj-2023-026. ↑
- We made this methodological choice because it was often difficult to determine the staffing structure of the service based on the website alone. ↑
- See for example: Alisa B. Rod, Biru Zhou, and Marc-Etienne Rousseau, “There’s No ‘I’ in Research Data Management: Reshaping RDM Services Toward a Collaborative Multi-Stakeholder Model,” Journal of eScience Librarianship 12, no. 1 (2023), https://doi.org/10.7191/jeslib.624; Eva Katharina Donner et al, “Research Data Management Systems and the Organization of Universities and Research Institutes: A Systematic Literature Review,” Journal of Librarianship and Information Science 55, no. 2 (2022) 261-281, https://doi.org/10.1177/09610006211070282. ↑
- We define “medical school” as a college or school offering MD degrees. Several of the institutions in our sample support MD studies via partnerships with nearby, but institutionally separate medical schools: for example, Montana State University belongs to WWAMI, a cooperative program with the University of Washington School of Medicine and the states of Washington, Wyoming, Alaska, Montana, and Idaho. In these cases, we considered the sampled institution not to have a medical school and did not include services offered by the partnered institution in our sample. ↑
- The absence of services does not equate to the absence of bioinformatics research or resources. Although we didn’t find research data services specifically listed as bioinformatics research, each Canadian institution appeared to have bioinformatics programs and substantial resources offered through graduate programs or labs. Many of these programs and labs are housed in computer science departments. ↑
- The Realities of Academic Data Sharing (RADS) Initiative, a partnership between the Association of Research Libraries and six academic institutions involved in the Data Curation Network (DCN) investigated the costs associated with RDS provision in a recent report, Making Research Data Publicly Accessible: Estimates of Institutional & Researcher Expense. See: Alicia Hofelich Mohr, Jake Carlson, Lizhao Ge, Joel Herndon, Wendy Kozlowski, Jennifer Moore, Jonathan Petters, Shawna Taylor, and Cynthia Hudson Vitale, “Making Research Data Publicly Accessible: Estimates of Institutional & Researcher Expense,” Association of Research Libraries, February 2024, https://doi.org/10.29242/report.radsexpense2024. ↑
- However, as detailed in the 2022 OCLC report, “Library Collaboration as a Strategic Choice: Evaluating Options for Acquiring Capacity,” moving from identifying collaborative opportunities to effectively implementing them is not without its challenges and requires careful, strategic planning, which in itself can be resource intensive. For more on collaborative support infrastructure see: Patricia B Condon, Thea P. Atwood, and Catherine DeRose, “Connecting Fragmented Support on Campus: Growing Research Data Services Programs Through Collaboration,” Collaborative Librarianship 13, no. 2 (2023), https://digitalcommons.du.edu/collaborativelibrarianship/vol13/iss2/4; Brian Lavoie, “Library Collaboration as a Strategic Choice: Evaluating Options for Acquiring Capacity,” OCLC Research, August 2022, https://doi.org/10.25333/mt16-0c57; Rebecca Bryant, Brian Lavoie, and Constance Malpas, “Scoping the University RDM Service Bundle: The Realities of Research Data Management, Part 2,” OCLC Research, 2017, https://doi.org/10.25333/C3Z039. ↑
- The importance of skills development and fostering data literacy among library staff has been discussed at length by many including: Javier Calzada Prado and Miguel Angel Marzal, “Incorporating Data Literacy into Information Literacy Programs: Core Competencies and Contents,” Libri: International Journal of Libraries & Information Services 63, no. 2 (2013) 123–134, https://doi.org/10.1515/libri-2013-0010; Lisa Federer, Erin Diane Foster, Ann Glusker, Margaret Henderson, Shirley Zhao, “The Medical Library Association Data Services Competency: A Framework for Data Science and Open Science Skills Development,” Journal of the Medical Library Association 108, no. 2 (2020), http://dx.doi.org/10.5195/jmla.2020.909; It is also critical to recognize that for librarians to deliver methodological inclusive services, they require training in a diversity of data literacy skills spanning both quantitative and qualitative data literacy. For more see: Jessica Hagman and Hilary Bussell, “Going Qual In: Towards Methodologically Inclusive Data Work in Academic Libraries,” IASSIST Quarterly 46, no. 2 (2022), https://doi.org/10.29173/iq1022. ↑
- For more on the DCN see: Data Curation Network, https://datacurationnetwork.org/about-the-dcn/. See also: Jake Carlson et al, The Art, Science, and Magic of the Data Curation Network: A Retrospective on Cross-Institutional Collaboration (Michigan: Michigan Publishing, 2023). ↑
- For more on Open Science Grid see: The OSG Consortium, https://osg-htc.org/; For more on Massachusetts Green High Performance Computing Center see: MGHPCC, https://www.mghpcc.org/. ↑
- For more on The Carpentries see: https://carpentries.org/; For more on the Digital Resource Alliance of Canada see: https://alliancecan.ca/en/services/research-data-management; for more on the joint ARL and CDL project see: “Building a Scalable Data-Management Infrastructure for Strategic Institutional Coordination,” https://www.arl.org/building-a-scalable-data-management-infrastructure-for-strategic-institutional-coordination/. ↑
- See: Rachel Walton and Patti McCall-Wright, “What About the Little Guys?: How to Approach Supporting Research Data Management at a Small Liberal Arts College,” Research Data Q, 6 November 2019, https://researchdataq.org/editorials/what-about-the-little-guys-how-to-approach-supporting-research-data-management-at-a-small-liberal-arts-college/; Ryan Clement et al, “Team-Based Data Management Instruction at Small Liberal Arts Colleges,” IFLA Journal 43, no. 1 (2017): 105-118, https://doi.org/10.1177/0340035216678239. ↑
- Zhixian Yi, “Effective Techniques for the Promotion of Library Services andResources,” Information Research: An International Electronic Journal 21, no. 1 (March 2016), https://files.eric.ed.gov/fulltext/EJ1094561.pdf. Mikolaj Wilk, Gabriela Garcia, Matthew Frenkel, and Lindsay Anderberg, “The Power of Communication: Increasing Patron Engagement through Outreach and Assessment,” Science & Technology Libraries, September 2019, https://archive.nyu.edu/handle/2451/60950. ↑
- Jane Fry and Chantal Ripp, “Helping Canadian Institutions Evaluate their Research Data Management Practices,” ResearchDataQ, 20 April 2023, https://researchdataq.org/editorials/helping-canadian-institutions-evaluate-their-research-data-management-practices/; SPARC Europe, “Evaluate your RDM Offering,” https://sparceurope.org/evaluate-your-rdm-offering/. ↑
- There are a number of toolkits available for librarians who wish to develop RDS. In their article. For a comprehensive overview of some available toolkits, see: Virginia Dressler, Kristin Yeager, and Elizabeth A. Richardson, “Developing a Data Management Consultation Service for Faculty Researchers: A Case Study from a Large Midwestern Public University,” International Journal of Digital Curation 14, no. 1 (2019): 1-23. ↑
- For more on the Research Computing and Data (RCD) Capabilities Model see: https://carcc.org/rcdcm/. ↑
- For more on Research Facilitation Service at North Carolina State University see: https://www.lib.ncsu.edu/rfs. ↑
- The Realities of Academic Data Sharing (RADS) Initiative includes data storage analysis in their research project but there is significant need for more study on secure data storage. For more on RADS see: “Realities of Academic Data Sharing (RADS) Initiative,” Association of Research Libraries, https://www.arl.org/realities-of-academic-data-sharing-rads-initiative/. ↑
- For more see: The University of Arizona Native Nations Institute, “Strengthening Indigenous Governance,” https://nni.arizona.edu/our-work/research-policy-analysis/indigenous-data-sovereignty-governance. See also: Indigenous Data Lab, “Collaboratory for Indigenous Data Governance,” https://indigenousdatalab.org/. ↑
- For more on the CARE principles and data management see: Stephanie Russo Carroll et al, “The CARE Principles for Indigenous Data Governance,” Data Science Journal 19, no. 43 (2020): 1–12, https://doi.org/10.5334/dsj-2020-043; Additional examples of existing university efforts to develop RDS for Indigenous data stewardship include programs at the University of Manitoba, see: “Our Data Indigenous,” https://ourdataindigenous.ca/; and the University of Washington, see “Data Services for Indigenous Scholarship and Sovereignty,” https://sites.uw.edu/dsissresearch/. ↑
- Dylan Ruediger et al, “Big Data Infrastructure at the Crossroads: Support Needs and Challenges for Universities,” Ithaka S+R, 1 December 2021, https://doi.org/10.18665/sr.316121. See also Digital Science’s report, which confirms the importance of these types of resources: Mark Hahnel, Graham Smith, Henning Schoenenberger, Niki Scaplehorn, and Laura Day, “The State of Open Data 2023,” Digital Science, https://doi.org/10.6084/m9.figshare.24428194.v1. ↑