Understanding the Impact of Data-Driven Accreditor Practices on Student Outcomes
Executive summary
This paper examines whether the adoption of data-driven practices by the seven former regional accreditors is associated with measurable changes in student outcomes. We document when accreditors introduced four observable practices—public dashboards, public-facing reports, peer benchmarking policies, and internal dashboards—and compare the onset of those practices with resulting changes in student outcomes, including graduation, completion, full-time retention, and student loan default rates between 2014 and 2023.
Accreditation remains one of the main quality assurance mechanisms in US higher education, yet its impact on student learning and completion has historically been difficult to measure.
Through our research we find modest and short-lived associations between adoption and improvements in retention and cohort default rates in the four-year sector and some evidence of improved graduation rates in the two-year sector. The adoption of multiple practices or longer implementation periods does not appear to strengthen these effects, and in some cases post-treatment trends flatten or reverse. These results suggest that data transparency and benchmarking, on their own, are not strong levers for shifting institutional behavior and are better understood as reinforcing existing accountability structures rather than transforming them.
Accreditation remains one of the main quality assurance mechanisms in US higher education, yet its impact on student learning and completion has historically been difficult to measure. This project begins to address a gap in our understanding of higher education accountability: while accreditors collect a substantial amount of data about student success, there has been little evidence on whether their use of that data improves institutional outcomes.
Introduction
Accreditors play a central role in ensuring institutional quality and accountability in US higher education. For decades, accreditors have collected and reviewed outcomes data—such as enrollment, completion, and financial health indicators—through annual reports, site visits, and institutional self-studies.[1] Their published standards often cite the use of outcomes data as a key element of institutional improvement, though the extent to which these data are explicitly defined or tied to accountability mechanisms varies. Most accreditors also connect to federal data sources like IPEDS and College Scorecard or require their institutions to do so.
Yet despite this long history of and emphasis on data collection, questions persist about how effectively accreditors use these data to hold institutions accountable for student success. Instances of low-performing institutions maintaining accreditation, coupled with growing public concern about educational value and accountability, have intensified calls for accreditors to adopt a more systematic and transparent approach to using student outcomes data.[2]
In response, many accreditors have begun to adopt new data-driven practices that use outcomes data in a more systematic, intentional, and transparent way. These practices include publishing interactive dashboards that display institutional outcomes, developing internal data systems to support peer review, introducing peer benchmarking requirements, and issuing public reports on student achievement. Together, these changes signal a broader shift in how accreditors define and assess institutional quality—one that places greater emphasis on measurable student outcomes.
This paper examines whether the adoption of such data-driven practices by regional accreditors is associated with measurable changes in institutional performance on student outcomes. Specifically, we (1) document when and how accreditors implemented observable data-driven practices, and (2) estimate the relationship between these adoptions and changes in key student outcomes—including graduation, completion, retention, and loan default rates—across institutions accredited by the seven former regional accreditors between 2014 and 2023. We use a two-way fixed effects (TWFE) difference-in-differences model that leverages the staggered timing of practice adoption across accreditors to estimate the average change in outcomes associated with these reforms.
By empirically testing whether accreditor-level reforms correspond with better student outcomes, this study contributes to ongoing debates about the role of accreditation in ensuring educational quality. Historically, accreditors have prioritized institutional mission, improvement processes, and self-study over quantitative measures of student achievement. As policymakers, oversight bodies, and the public demand greater accountability, understanding whether data-driven reforms translate into improved outcomes is critical to shaping the next generation of quality assurance in higher education.
As policymakers, oversight bodies, and the public demand greater accountability, understanding whether data-driven reforms translate into improved outcomes is critical to shaping the next generation of quality assurance in higher education.
This paper proceeds as follows. The next section describes the data-driven practices introduced by regional accreditors and the criteria used to categorize them. We then describe our data sources, sample construction, and analytic approach, followed by results from our main model and robustness checks. We conclude with a discussion of findings, implications for accreditor policy and federal oversight, and directions for future research.
Data driven practices: accreditor case studies
Accreditors use data in a variety of ways to evaluate institutional performance, communicate results to the public, and support institutional improvement. However, for the purpose of this study, we focus only on a specific set of practices that are both observable and verifiable across accreditors. These practices represent the most consistent and measurable ways that accreditors have begun to integrate outcomes data into their review processes and external reporting.
We categorize these practices into four treatment conditions:
- Public, interactive dashboards: dashboards published by the accreditor that present disaggregated student outcomes data about the institutions they accredit.
- Public-facing reports: reports published by the accreditor that outline institutional performance on student outcomes.
- Peer benchmarking policies: published policies guiding how peer benchmarking of student outcomes data is used during the accreditor’s review process.
- Internal dashboards: dashboards used internally by accreditor staff, peer reviewers, or commissioners as part of the accreditation review process.
These categories do not include all ways accreditors engage with outcomes data. The case studies that follow describe the full range of practices we identified, while the four categories above represent the subset we use to define treatment for the quantitative analysis. We identified the first year in which each accreditor adopted one or more of these practices and used that information to construct an “any treatment” variable that marks the first year an accreditor adopted at least one data-driven practice. Unlike the other three practices, which were publicly available, the first year of internal dashboard use was confirmed through direct correspondence with accreditor representatives. The next section profiles each of the seven formerly regional accreditors, outlines the practices they have adopted, and identifies the year in which each practice first appeared.
Western Association of Schools and Colleges Senior College and University Commission (WSCUC)
In 2019, WSCUC announced its “Better Conversations, Better Data” evidence improvement initiative, funded by Lumina Foundation.[3] A deliberate focus of this initiative was “Results driven change,” as WSCUC sought to enhance its use of evidence of student success in evaluating institutional improvement and accountability.[4] This campaign resulted in the development of a peer benchmarking pilot project in 2020 and the publishing of a Key Indicators Dashboard (KID), which went public in August 2021. KID is an interactive dashboard that presents federally collected trend data on student and institutional outcome variables such as enrollment trends, student demographics, completion, student and institutional finances, and post-graduation outcomes.[5] WSCUC’s peer benchmarking pilot project identified national peer groups for WSCUC institutions and used these groups for benchmarking as a part of the accreditation review process.[6] This pilot practice has since been formally adopted, and benchmark targets and peer groups are now published publicly as a part of KID.[7] WSCUC has added to the metrics included in KID over time, most-recently adding post-graduation outcome metrics collected from College Scorecard such as program level earnings data, debt-to-earnings ratio, and the percent of graduates who earn more than high school graduates. WSCUC has also published companion documentation to help institutions, peer reviewers, students, and the public define and understand outcomes data.[8] Finally, WSCUC uses the KID dashboard internally to review institutions.
Higher Learning Commission (HLC)
From 2016 to 2019, HLC published a series of reports focused primarily on the terms and measures that define student success. Together with the Council of Regional Accrediting Commission (C-RAC), HLC surveyed member institutions and developed two reports that found that the federal definition of graduation rates was insufficient at capturing student success and called for a more comprehensive approach using multiple measures. HLC also published three reports focused on “defining success data” that emphasized the need for institutions to use data disaggregated by demographics to better understand their student populations as well as a shared glossary of terms to clarify how student success is defined.[9] In 2022 HLC published a report after forming a partnership with the National Student Clearinghouse (NSC). Using NSC, IPEDS, and Scorecard data to compare HLC institutions to the national average on a variety of disaggregated student outcome measures. Included in HLC’s 2025 Criteria for Accreditation, institutions are now required to benchmark student success outcomes, with reference to peer institutions.[10] HLC has incorporated this benchmarking into their annual review process and in 2025 incorporated student success outcomes of first-year retention rate, graduation rates, and completion or transfer rates into their risk indicator process.[11] HLC has used internal data dashboards as a part of their internal review process since 2010. HLC’s latest data-driven practice, effective September 2025, allows eligible institutions to replace their mid-cycle review with a “Student Success Quality Initiative” (SSQI). This option is intended for institutions that already meet core quality expectations, giving them the opportunity to focus less on compliance and more on improving student success.[12]
Southern Association of Colleges and Schools Commission on Colleges (SACSCOC)
SACSCOC has not published a public-facing data dashboard or any public-facing reports that outline institutional performance on student outcomes. The accreditor also has not published any policy guiding the use of peer benchmarking of student outcomes in their standards of accreditation or as a part of any related data initiative. SACSCOC does require member institutions to report performance on student achievement measures on their websites, but contrary to the stance of other accreditors, specifically states that disaggregated outcomes data is not required to be posted.[13] Links to institutional performance pages are made available through the institution database on the SACSCOC website. Since 2018, SACSCOC has used internal data warehouses and internal dashboards as a part of the accreditation review process.
Accrediting Commission for Community and Junior Colleges (ACCJC)
Like other accreditors, ACCJC collects student outcomes and achievement data as a part of their annual review process. While ACCJC does not have a published policy of peer benchmarking student outcomes, the accreditor does require institutions to set benchmarks and stretch goals for key student achievement indicators and to track their progress annually and as a part of their midterm and comprehensive reviews. ACCJC also requires the institutions they accredit to share their student achievement data and they provide links to the institutional achievement pages on the accreditor website. Concurrently with the release of their 2024 standards, ACCJC also announced a Data Dashboards and Technology Pilot Project. Beyond collecting student achievement data, ACCJC states that “the implementation of a Salesforce-based system with data-collection and visualization capabilities will significantly impact the work of ACCJC and drive forward our organization’s mission to support its member institutions to advance educational quality and equitable student learning and achievement.”[14] These internally facing dashboards were launched in the spring and summer of 2024, and publicly facing student achievement dashboards were launched in August 2025.[15] In 2025, ACCJC published Navigating the Value Landscape for Accreditation, emphasizing the importance of incorporating economic outcomes into quality assurance and concluding that Third Way’s price-to-earnings premium offers a reasonable starting point for quantifying students’ return on investment.[16]
Middle States Commission on Higher Education (MSCHE)
MSCHE’s use of internal-facing data dashboards has evolved over time. Beginning in 2018, the accreditor used internal dashboards as a part of its mid-point peer review, sharing institutional performance metrics with peer evaluators. Since then, the internal dashboards have grown to serve the Annual Institutional Update (AIU) and been expanded for use by Commission staff. In 2025, MSCHE published its AIU dashboard on its website, making data on student achievement, enrollment, and financial health publicly available to stakeholders beyond Commission staff and peer evaluators.[17] The accreditor does not have a published policy on peer benchmarking and has not published additional reports summarizing outcomes at the institutions they accredit. MSCHE will follow up with institutions who fall below “Key Indicators” in their AIUs and requested 81 supplemental information reports related to the student achievement indicator in 2023.[18]
Northwest Commission on Colleges and Universities (NWCCU)
Since the adoption of their 2020 set of Standards, NWCCU has incorporated a number of data-driven practices, establishing internal data dashboards and peer benchmarking as a part of their review process, and publishing data reports and dashboards to their website. The accreditor’s annual reporting policy was updated in 2021 to include outcome metrics such as graduation and retention rates, in addition to standard information on enrollment and finances. Internal data dashboards began being used and incorporated into the annual review process in 2023. NWCCU also published a report in 2022 summarizing findings from NACIQI’s data dashboard and has since expanded its own dashboards to include institutional peer comparisons and benchmarking.[19] In spring 2024, NWCCU implemented a policy requiring peer evaluators to review institutional data using these dashboards and to assess institutions against identified peer groups.[20] Following its August 2023 NACIQI appearance, NWCCU began collecting peer lists directly from institutions and announced that, beginning in fall 2024, it would provide peer comparator data to institutions and further define expectations for promoting student achievement and success using data-informed approaches. Peer benchmarking is also formalized in NWCCU’s standards, which include explicit references to peer comparison and data use in evaluating student achievement. NWCCU has also published articles to clarify how peer comparators are selected and to explain the accreditor’s student achievement standards.[21]
New England Commission of Higher Education (NECHE)
In 2022 NECHE established a Data and Research Advisory Committee to “ensure that the data it gathers and analyzes are appropriate and useful for meeting the needs of its various stakeholders.”[22] Stakeholders that the Data Advisory Committee seeks to support are the accreditor’s member institutions, Commission staff in their review of institutions, and the public. NECHE has developed internal dashboards that track trend data related to enrollment, finances, faculty, and student achievement which are used by Commission staff, and these dashboards have since become part of institutional comprehensive evaluations. The accreditor does not currently publish public facing dashboards or data reports and has no published policy on peer benchmarking of student outcomes.
Constructing the dataset of data-driven practices
To create the analysis dataset, we utilized the Database of Accredited Postsecondary Institutions and Programs (DAPIP) to identify all institutions accredited by the seven formerly regional accreditors. We filtered for institutions that maintained continuous accreditation from August 1, 2013, to August 1, 2023, dropping any that had an accreditation end date before 2023 or started accreditation in 2013 or after. Institutions that received pre-accreditation during this timeframe were also excluded from the analysis dataset. We chose the 2013-2014 academic year as the start of this analysis for two primary reasons. First, the Western Association of Schools and Colleges (WASC) split into WSCUC and ACCJC the year prior, bringing the number of regional accreditors from six to seven. Second, any changes to accreditation brought on by the 2008 Higher Education Opportunity Act would likely have gone into effect by this point. We end our analysis in 2022-2023, as this is the last year that we have full data available through the Integrated Postsecondary Data System (IPEDS) and College Scorecard.
We began by constructing a 10-year panel dataset and merging in IPEDS directory data on the UNITID variable (IPEDS unique identifier), only keeping matches (institutions that have directory data in each year of our sample). Although IPEDS is comprehensive, institutions can be missing in individual years because of changes in institutional reporting. Every unique year and institution combination makes one observation. Across all 10 years, we lost 2,030 observations out of 32,410 in total. We attempted to merge the unmatched observations using OPEID, College Scorecard’s unique identifier, but only a small number had any matches across years (after removing observations with no OPEID, only 31 observations out of 1,842 had any match). None of the institutions in the unmatched group had a full match for the 10 years of the panel. We examined the institutions with no UNITID that we were able to merge with the IPEDS directory data and found no meaningful patterns based on Carnegie classification or sector. We then removed all observations without a UNITID, including the 31 OPEID matches. Now with 30,410 observations, we applied the C21 basic Carnegie classifications for the most recent year of data (2023) to each of the preceding observations by institution.
We then trimmed our sample to ensure consistency across years and types of institutions. First, we removed institutions categorized as “special focus,” and institutions with N/A or missing Carnegie classification data. These institutions represent a small proportion of the overall sample (about eight, one, and three percent of the sample respectively) and are more likely to report incomplete or inconsistent data across years. Additionally, the programmatic specialization and narrow student focus of “special focus” institutions make them meaningfully different from institutions that offer a broad array of undergraduate degrees. We also dropped campuses that are located outside of the United States. To ensure comparability and consistency in the sample we only kept institutions that had a full 10 years of directory data in our panel. This process removed 156 observations and 22 institutions from the dataset, leaving us with a total of 25,020 observations and 2,502 distinct institutions.
Once we had our sample established, we incorporated outcomes data and control variables from IPEDS and College scorecard. Outcomes include graduation rates within 150 percent of normal time (six years at four-year institutions, three years at two-year institutions), total undergraduate completions per full-time equivalent (FTE) undergraduate enrollment, fall-to-fall retention rates, and three-year cohort default rates, which is the percentage of a school’s federal student loan borrowers who enter repayment in a given federal fiscal year and default on their loans within three years. These outcomes capture both the student-level benefits of improved success and the institutional capacity to support timely completion. They provide a balanced view of how effectively colleges help students persist, graduate, and avoid negative financial outcomes after leaving school.
Our control variables include undergraduate FTE enrollment, the share of undergraduate students receiving Pell Grants, the share of undergraduate students who identify as underrepresented minority students, institutional endowment per undergraduate FTE, institutional control (public or private), and the state unemployment rate. Institutional characteristics are drawn from IPEDS, while state-level unemployment data are drawn from the Bureau of Labor Statistics. These controls help account for differences in institutional size, resources, and student composition, as well as external economic conditions that may influence student outcomes independent of accreditor practices. Endowment per FTE was highly right-skewed, so we took the natural log of it to mitigate skew and reduce the influence of outliers.
We investigated missingness among our control variables, by sector. The majority of missing data is observed for the endowment per FTE variable, and the majority of that is missing in the two-year sector. This is expected, as our sample includes institutions of all types, and public two-year colleges may not have an endowment or may report their endowment differently than four-year schools. Following the inclusion of our controls, we underwent a process of listwise deletion, creating a dataset with full availability of control data. We did not observe any other meaningful patterns in institutional characteristics when observing institutions dropped due to missingness in endowment per FTE data than those that were left in the dataset. Overall, 3,820 observations were removed (only one institution was completely dropped from the sample), leaving 21,200 total observations. Under one percent of the remaining observations had missing data on grad rates or completions, and under five percent had missing data on retention rates. Three-year cohort default rate data are unavailable for 2023, and about 13 percent of observations are missing from the dataset overall.
The following two tables present a descriptive overview of our data by sector (Table 1 for four-year institutions and Table 2 for two-year institutions) and treatment status:
Table 1: Summary Statistics — Four-Year Institutions (Treated vs Not Treated)
| (1) Not Treated | (2) Any Treatment | |||||
| Mean | SD | N | Mean | SD | N | |
| Graduation Rate | 0.573 | 0.188 | 5773 | 0.601 | 0.177 | 3468 |
| Completions per FTE | 0.248 | 0.079 | 5877 | 0.267 | 0.287 | 3530 |
| Retention Rate | 0.765 | 0.121 | 5777 | 0.769 | 0.114 | 3456 |
| Cohort Default Rate | 0.066 | 0.048 | 5858 | 0.044 | 0.038 | 2585 |
| FTE Enrollment | 5675 | 7549 | 5879 | 5771 | 8298 | 3531 |
| Pell Share | 0.363 | 0.164 | 5879 | 0.346 | 0.148 | 3531 |
| URM Student Share | 0.284 | 0.227 | 5879 | 0.311 | 0.220 | 3531 |
| Log(Endowment per FTE) | 10.101 | 1.712 | 5879 | 10.237 | 1.680 | 3531 |
| State Unemployment Rate | 5.003 | 1.339 | 5879 | 4.805 | 1.960 | 3531 |
| Observations | 5879 | 3531 | ||||
Table 2: Summary Statistics — Two-Year Institutions (Treated vs Not Treated)
| (1) Not Treated | (2) Treated | |||||
| Mean | SD | N | Mean | SD | N | |
| Graduation Rate | 0.269 | 0.116 | 3170 | 0.319 | 0.121 | 1454 |
| Completions per FTE | 0.315 | 0.127 | 3170 | 0.340 | 0.126 | 1455 |
| Retention Rate | 0.601 | 0.095 | 2772 | 0.592 | 0.099 | 1206 |
| Cohort Default Rate | 0.158 | 0.067 | 2775 | 0.098 | 0.055 | 966 |
| FTE Enrollment | 5288 | 5775 | 3170 | 4312 | 4967 | 1455 |
| Pell Share | 0.374 | 0.131 | 3170 | 0.336 | 0.116 | 1455 |
| URM Student Share | 0.345 | 0.203 | 3170 | 0.325 | 0.193 | 1455 |
| Log (Endowment per FTE) | 7.007 | 1.536 | 3170 | 7.523 | 1.556 | 1455 |
| State Unemployment Rate | 5.131 | 1.461 | 3170 | 4.478 | 1.722 | 1455 |
| Observations | 3170 | 1455 | ||||
Methodology
Theories of action
We focus on the relationship between accreditor adoption of the data-driven practices described earlier and changes in our outcome variables. As a reminder, we focus on four practices: public dashboards with disaggregated outcomes, public-facing reports on outcomes, peer benchmarking policies, and internal dashboards used in the review process. Each practice leans on different mechanisms that may lead to changes for students. The publishing of public, interactive dashboards and reports on an accreditor’s website increases transparency and may heighten pressure to improve on low performing institutions. Both activities signal a shift in priorities by an accreditor to more carefully examine and account for lagging institutional performance. Peer benchmarking practices use institutional comparison as a tool to automatically trigger conversations with low performing institutions, which may help raise overall performance. Internal dashboards make it easier for accreditor staff and commissioners to identify institutions that are underperforming and to integrate outcomes data into routine review.
Each of these practices reflects a different pathway by which accreditors may influence institutional behavior: transparency, self-monitoring, competitive pressure, and data-informed review.
Each of these practices reflects a different pathway by which accreditors may influence institutional behavior: transparency, self-monitoring, competitive pressure, and data-informed review. Collectively, they are expected to increase institutional accountability and improve student success outcomes. Table 3 lists the first year in which each accreditor adopted one or more of these practices and the year we code as initial treatment.
Table 3: Specification of Treatment
| Accreditor | Public Dashboard | Public Report | Peer Benchmarking Policy | Internal Dashboard | Any Treatment (first adopted) |
| WSCUC | 2021 | none identified | 2020 | 2021 | 2020 |
| HLC | none identified | 2022 | 2025 | 2010 | 2010 |
| SACSCOC | none identified | none identified | none identified | 2021 | 2021 |
| ACCJC | 2025 | none identified | none (institutions set stretch goals | 2024 | 2024 |
| MSCHE | 2024 | none identified | none identified | 2018 | 2018 |
| NWCCU | 2022 | 2022 | 2020 | 2023 | 2020 |
| NECHE | none identified | none identified | none identified | 2023 | 2023 |
Rather than test each pathway separately, our primary hypothesis is that institutions accredited by agencies that adopt any of the four key data-driven practices will show greater improvements in student outcomes than institutions accredited by agencies that do not adopt these practices. Although the four practices differ in form, they all point to a broader shift toward using outcomes data in accreditation. Because these practices are not cleanly separable in timing or intent, we use the first year an accreditor adopted any of them as our treatment definition.
In addition to our primary hypothesis, we also expect that both the number of practices adopted and the length of time they have been in place may shape student outcomes. A larger set of practices likely signals a stronger emphasis on data use and accountability, while longer implementation periods give institutions time to adjust and comply with new expectations. Conditional on the results of our main model, we will test whether these factors appear to influence outcomes.
Model specification
We specify a two-way fixed effects (TWFE) difference-in-differences (DiD) model to estimate the impact of these practices as our primary specification. The staggered timing across accreditors implementing data-driven practices allows us to compare institutions whose accreditors had adopted a practice in a given year to otherwise similar institutions whose accreditor had not yet adopted any of these practices.
We will use the following regression specification as our primary model:
where Yist one of four outcomes for institution i, accredited by agency s, in year t: graduation rate within 150 percent of normal time, total undergraduate completions per 100 FTE undergraduates, full-time fall-to-fall retention, or the three-year cohort default rate. AnyTreatst is an indicator equal to 1 in the first year an accreditor adopts at least one of the four data-driven practices and in all subsequent years. Xit is a vector of institution-level control variables drawn from IPEDS that includes undergraduate FTE enrollment, the share of undergraduates receiving Pell Grants, the share of undergraduates who identify as underrepresented minority students, institutional endowment per FTE, and institutional control. Zst is a state unemployment rate assigned by institution location. δi and γt are institution and year fixed effects, and the error term is clustered at the institutional level. β1 represents the average change in the outcome associated with accreditor adoption of at least one practice, after adjusting for observed characteristics and for time and institution fixed effects.
Institutions accredited by the Higher Learning Commission (HLC) are excluded from our main analytic sample because HLC adopted data-driven practices well before the start of our observation window (2013–2023). As a result, all HLC-accredited institutions are continuously “treated” across the entire period, providing no untreated or pre-treatment comparison years necessary for difference-in-differences estimation.
Staggered adoption and robustness
Standard two-way fixed effects models can produce biased estimates when treatment is adopted at different times and when treatment effects are not constant across units or over time. Because our treatment varies at the accreditor-year level and some accreditors adopted earlier than others, we estimate two additional models that are designed for staggered adoption. We first apply Gardner’s two-stage difference-in-differences estimator, which reweights comparisons so that outcomes for already treated groups are not used to identify later treatment effects.[23] This produces an average treatment effect on the treated (ATT) over the observed post-adoption period.
To check for bias, we also estimate the dynamic estimator developed by de Chaisemartin and D’Haultfoeuille.[24] This approach estimates the average effect of treatment at each relative time period before and after adoption and allows us to plot an event-study figure. We will use these dynamic estimates to examine whether treated and not-yet-treated institutions were on similar trends in the years leading up to adoption. We will test the parallel trends assumption by visually inspecting the event-study figures and reporting p-values on joint tests of nullity of the placebos. If our model suffers from widespread violation of the parallel trends assumption, we will create a matched pairs sample based on observed characteristics of institutions in the control and treatment groups and re-run the TWFE model.
Although these are helpful checks to ensure the staggered treatment timing is not biasing our estimates, we prefer the TWFE models as they provide a more efficient estimator and allow for both instance- and cumulative-dosage modeling.[25]
Findings
In the following section we present findings from a series of models estimating the relationship between accreditor adoption of data-driven practices and changes in institutional outcomes. Overall, we find evidence that these practices are associated with small improvements in graduation and retention rates and lower cohort default rates among four-year institutions and mixed effects in the two-year sector. The adoption of multiple data-driven practices or longer implementation periods does not appear to strengthen these effects. Results from Gardner and dCDH robustness checks broadly align with our main TWFE estimates, indicating that differences in treatment timing across accreditors are not driving the observed relationships.
Table 4: Main TWFE Estimates
| Graduation Rate | Completions per FTE | FT Retention Rate | 3-Year Cohort Default Rate | |
| Panel A: 4-Year Institutions | ||||
| AnyTreat | 0.00281 | 0.000661 | 0.00544** | -0.00418*** |
| (0.00220) | (0.00193) | (0.00222) | (0.000821) | |
| Constant | 0.528*** | -0.155 | 1.017*** | 0.0807*** |
| (0.0233) | (0.192) | (0.0219) | (0.0130) | |
| Panel B: 2-Year Institutions | ||||
| AnyTreat | 0.00700* | -0.0315*** | 0.00602 | -0.000345 |
| (0.00365) | (0.00671) | (0.00416) | (0.00270) | |
| Constant | 0.340*** | 0.307*** | 0.656*** | 0.154*** |
| (0.0314) | (0.0575) | (0.0353) | (0.0264) | |
| Controls | YES | YES | YES | YES |
| Institution FE | YES | YES | YES | YES |
| Year FE | YES | YES | YES | YES |
Robust standard errors in parentheses
*** p<0.01, ** p<0.05, * p<0.1
Table 4 presents the findings from our main two-way fixed-effects (TWFE) specification. We find modest evidence that the adoption of data-driven practices by accreditors is associated with small improvements in some student outcomes, particularly in the four-year sector. Among four-year institutions, the adoption of any data-driven practice is associated with a 0.5-percentage-point increase in full-time retention rates (p < 0.05) and a 0.4-percentage-point decline in cohort default rates (p < 0.01). For context, a 0.5-percentage-point increase in retention corresponds to roughly 30 additional retained students at a four-year institution with the average undergraduate enrollment in our sample (about 5,700 students). Likewise, a 0.4-percentage-point decline in cohort default rates is equivalent to four fewer defaults per 1,000 borrowers. We see positive coefficients for graduation rates and completions per FTE, but neither are statistically significant, and completions per FTE estimates are near zero for four-year institutions.
We find modest evidence that the adoption of data-driven practices by accreditors is associated with small improvements in some student outcomes, particularly in the four-year sector.
Among two-year institutions we find the adoption of any data-driven practice to be positively correlated and statistically significant for our graduation rate variable (p<0.10) and statistically significant but with a negative effect on completions per FTE (p < 0.01) of over three percentage points. Later in the paper we discuss how this coefficient may be biased by pre-treatment trends. Although not statistically significant, full-time retention point estimates are similar to those found for the four-year sector. Cohort default rate point estimates are near zero, but match the same sign as estimates in the four-year sector.
Table 5: Gardner and dCDH Robustness Checks
| Graduation Rate | Completions per FTE | FT Retention Rate | 3-Year Cohort Default Rate | |
| Panel A: 4-Year Institutions | ||||
| AnyTreat (Gardner) | 0.0106*** | 0.00884** | 0.00504* | -0.00560*** |
| (0.00270) | (0.00407) | (0.00284) | (0.00119) | |
| Avg Tot Eff (dCDH) | .0019612 | .0008242 | .0056883 | -.0069499 |
| (.0028798) | (.0031734) | (.0043096) | (.0012504) | |
| Panel B: 2-Year Institutions | ||||
| AnyTreat (Gardner) | 0.00296 | -0.0496*** | 0.0108** | -0.00287 |
| (0.00541) | (0.00910) | (0.00519) | (0.00345) | |
| Avg Tot Eff (dCDH) | .0004008 | -.022331 | .0110633 | -.0063836 |
| (.0054251) | (.0071072) | (.0053282) | (.0030396) | |
| Controls | YES | YES | YES | YES |
| Institution FE | YES | YES | YES | YES |
| Year FE | YES | YES | YES | YES |
Robust standard errors in parentheses
*** p<0.01, ** p<0.05, * p<0.1
Presented in Table 5 are results from using Gardner’s two-stage difference-in-differences estimator and the dynamic estimator of de Chaisemartin and D’Haultfoeuille (dCDH), where we report the average cumulative effect per treatment unit. We test our model using both types of estimators to test whether the main TWFE results are sensitive to staggered adoption bias. Across both estimators we see close alignment with the TWFE results. Examining the Gardner estimator, treatment results in positive and statistically significant results for graduation rates, completions per FTE, full-time retention rates, and a negative and statistically significant coefficient for cohort default rates in the four-year sector. Point estimate sizes are a bit larger for graduation rates and completions, and roughly consistent with the other variables. We see a similar result in the two-year sector, where coefficient sign and point estimate magnitude are roughly consistent with the TWFE results. Again, we see coefficient signs and magnitudes that are consistent with the four-year sector except for completions per FTE, where treatment is associated with about a five percent decrease in credential production.
These results are validated by the average total effect estimator from dCDH’s dynamic estimation technique. Coefficient signs and point estimate magnitudes are broadly consistent with the TWFE results and the Gardner estimates. These findings suggest that staggered implementation of treatment adoption is not driving the main findings, and that the main TWFE model is robust.
Table 6: Testing the Parallel Trends and No Anticipation Assumptions
| Graduation Rate | Completions per FTE | FT Retention Rate | 3-Year Cohort Default Rate | |
| Panel A: 4-Year Institutions | ||||
| Test of joint nullity of placebos (p-value) | 0.455 | 0.533 | 0.968 | 0.002 |
| Panel B: 2-Year Institutions | ||||
| Test of joint nullity of placebos (p-value) | 0.726 | 0.000 | 0.295 | n/a |
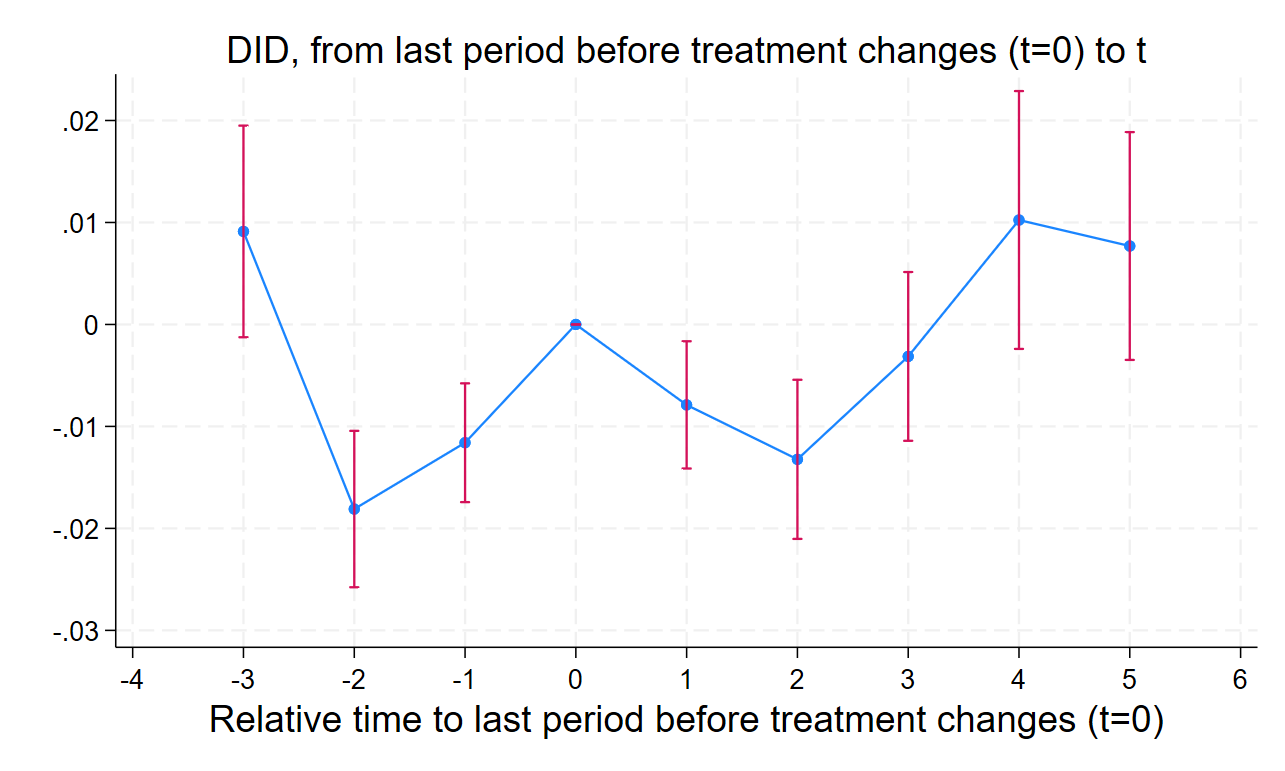
Table 6 reports joint tests of the null hypothesis that pre-treatment (placebo) coefficients are jointly equal to zero in the dCDH dynamic models. For four-year institutions, the tests suggest that the parallel trends assumption generally holds: pre-trends are statistically indistinguishable from zero for graduation rates, completions per FTE, and retention. The joint test for cohort default rates is significant, indicating possible pre-treatment differences in trajectories. For two-year institutions, the assumption holds for graduation and retention, but is clearly violated for completions per FTE, where pre-trends are highly significant. Because of limited post-treatment observations for cohort default rates, the statistical test could not be performed; however, visual inspection of event study plots indicates similar pre-treatment divergence in this outcome. Appendix B presents event-study figures from the dCDH dynamic estimator for all outcomes and sectors. These results imply that the four-year estimates can be interpreted as capturing valid within-institution changes following treatment, while the two-year completions per FTE estimates are most likely biased by sector specific pre-treatment trends.
Dosage and duration models
Because our TWFE results are broadly robust to the Gardner and dCDH estimates, and most variables do not violate the pre-treatment parallel trends assumption, we explore whether the scale and timing of accreditor reforms matter by estimating a set of dosage and duration models. These models are the same in structure as the main TWFE specification, but “any treatment” is replaced with measures that capture (1) the number of data-driven practices an accreditor had in place in a given year and (2) the number of years since any practice was first adopted. The “Dosage” coefficient represents the average change in an outcome for each additional practice adopted, while “Post” and “Post X Trend” estimate the immediate shift that occurs after adoption and whether that effect grows or diminishes in subsequent years, respectively.
Table 7: Dosage and Duration Estimates
| Graduation Rate | Completions per FTE | FT Retention Rate | 3-Year Cohort Default Rate | |
| Panel A: 4-Year Institutions | ||||
| Dosage | 0.00143 | 0.0215 | 0.000802 | 0.000405 |
| (0.00171) | (0.0158) | (0.00125) | (0.000575) | |
| Post | 0.00448** | -0.00107 | 0.00752*** | -0.00729*** |
| (0.00222) | (0.00273) | (0.00244) | (0.00100) | |
| Post x Trend | -0.00178 | 0.00185 | -0.00222** | 0.00245*** |
| (0.00113) | (0.00193) | (0.00109) | (0.000503) | |
| Panel B: 2-Year Institutions | ||||
| Dosage | -0.00243 | -0.0237*** | 0.00132 | -0.00357* |
| (0.00253) | (0.00364) | (0.00452) | (0.00198) | |
| Post | 0.0165*** | -0.00934* | 0.00808 | -0.00770*** |
| (0.00426) | (0.00552) | (0.00526) | (0.00261) | |
| Post x Trend | -0.00648*** | -0.0152*** | -0.00137 | 0.00504*** |
| (0.00200) | (0.00233) | (0.00215) | (0.00122) | |
| Controls | YES | YES | YES | YES |
| Institution FE | YES | YES | YES | YES |
| Year FE | YES | YES | YES | YES |
Robust standard errors in parentheses
*** p<0.01, ** p<0.05, * p<0.1
In Table 7 we find that dosage coefficients are largely not statistically significant across sectors, except for completions per FTE in the two-year sector, where we know that pre-treatment trends may be driving results. Point estimate magnitudes are small, like we saw in the main model. Coefficient signs diverge from the main model in a few places, but not in any statistically significant way. Overall these findings suggest that the adoption of multiple data-driven practices is not associated with improved institutional outcomes.
In our duration model, we find some significant short-term effects in the Post estimator. In the four-year sector graduation rates, full-time retention rates, and cohort default rates are all statistically significant and directionally suggest improved outcomes. We see a similar result in the two-year sector for graduation rates and cohort default rates. However, in both sectors we see multiple instances of signs flipping for post-trend estimates. This suggests that improvements in student outcomes may occur directly after treatment, and initial improvements may level off or reverse in post-treatment years.
Limitations
This study uses observational data and relies on the parallel trends assumption. Although the staggered DiD estimators we use improve on a simple before-and-after comparison, they cannot rule out all unobserved policy or economic changes that occurred at the same time accreditors adopted data-driven practices. We also cannot confirm that accreditor practices were the only changes taking place inside these agencies that could influence institutional behavior. Results should therefore be interpreted as evidence of a longitudinal relationship between the adoption of these practices and institutional outcomes, not as definitive causal effects.
Discussion
In this study we examine the extent to which the adoption of any data-driven practices (publishing of student achievement dashboards, public facing reports with disaggregated student data, the use of peer benchmarking of student outcomes and internal data dashboards) correspond with improvement for student outcomes. Across models we find modest and short-term associations between these practices and improved student outcomes. In the four-year sector we find evidence of improved full-time retention rates and cohort default rates, and some evidence of improved graduation rates in the two-year sector. The direction of coefficients broadly aligns with our hypothesis except for completions per FTE in the two-year sector, which appear to be biased by pre-treatment trends. The adoption of multiple data-driven practices or longer implementation periods does not appear to strengthen these effects, and in some cases, we see trend reversals in the post-treatment period.
Positive effects in the four-year sector suggest that greater use and focus on student outcomes data by accreditors may help strengthen institutional focus and accountability.
Positive effects in the four-year sector suggest that greater use and focus on student outcomes data by accreditors may help strengthen institutional focus and accountability. The positive results are encouraging, but modest point estimates suggest that data-driven practices may help reinforce existing accountability structures rather than fundamentally alter them. Four-year institutions generally have more staff, more stable student populations, and a more established or robust internal data infrastructure. This may make these institutions better equipped to respond to accreditor-driven changes in expectations. Their generally stronger financial standing may allow them to shift focus from institutional finances or governance to improvement of student outcomes during accreditor review cycles. Community colleges often face tighter budgets and more transient student populations, all of which may limit the degree to which data-focused reforms translate to measurable changes in outcomes.
The null and negative findings from our dosage and duration models may reinforce this interpretation of the findings. There is little evidence that adopting more data-driven practices or maintaining them for extended periods increases their effects. This could signal that benefits occur at the time of adoption, but fade as practices become routine or less emphasized. Mounting public pressure and calls for greater transparency and accountability on student outcomes may have led to short term positive effects, but long-run outcomes are unclear. Our findings may also reflect differences in how data-driven practices are carried out. For some accreditors, public dashboards or peer benchmarking policies may be more symbolic rather than actionable tools meant to shape institutional behavior. Others may use these mechanisms more directly in their evaluation and follow-up with institutions, which would theoretically produce more immediate results.
Although our TWFE estimates appear to be robust to staggered-implementation timelines, several limitations remain. Violations of the parallel trends assumption—particularly for completions per FTE in the two-year sector—suggest biased estimates for that outcome variable, and possible biased estimates for the three-year cohort default rates in both sectors. Also, the causal chain between accreditor adoption of data-driven practices and changes in student outcomes at the institutions they accredit, is weak. In this study, we do not define all the ways that accreditors interact with their institutions or the detailed ways in which they monitor and leverage their influence. Treatment adoption year is rather simplistic, corresponding to the year of the first identified data-driven practice or stated implementation of internal-dashboards.
This approach assumes a constant (or annual) application of treatment on institutions they oversee, regardless of where that institution is in their review cycle. Accreditors do collect student outcomes data and monitor institutions annually, justifying this assumption, but our approach does not consider the more detailed timing at play within the review cycle. In addition, whether a practice exists is used to identify treatment, but whether practices are implemented consistently or used actively in the review process is not accounted for. Data-driven accreditor reforms may coincide with other policies or organizational changes as well. For these reasons, the findings here should be interpreted as associations and not as causal effects.
Even with the limitations noted above, the consistency of results across multiple estimators gives us confidence that the patterns we observe reflect real associations. There are several implications for accreditor practice and federal oversight. For accreditors, the results suggest that data transparency alone has limited power to drive institutional improvement. Practices like public dashboards and peer benchmarking may help identify problems but appear less effective in sustaining change without corresponding shifts in how data inform reviews or follow-up actions. This underscores the importance of focusing on how data are used rather than how many mechanisms are adopted. For policymakers and oversight bodies like NACIQI, the findings suggest that simply encouraging accreditors to expand their data infrastructure is unlikely to yield large or lasting improvements in student outcomes. Instead, reforms may need to emphasize the integration of data use into core accountability processes, like linking outcome trends to concrete expectations, performance benchmarks, or improvement requirements.
For accreditors, the results suggest that data transparency alone has limited power to drive institutional improvement.
Future research should explore the mechanisms behind these findings in more detail. Institutional case studies or qualitative analysis of accreditor review practices could clarify whether differences in implementation explain the variation we observe across sectors and outcomes. Extending the analysis over a longer period could also help determine whether these small short-term gains persist, fade, or grow as accreditors refine their use of data.
Conclusion
In this paper we offer an accounting of the data-driven practices that accreditors have introduced alongside their regular review work. We apply a DiD framework and use estimators that account for staggered adoption to examine whether the implementation of these practices corresponds with measurable changes in student outcomes. Across several models and robustness checks, we find modest and short-lived associations between the adoption of these practices and improvements in graduation rates, completion, full-time retention, and student loan default rates. These effects are small, but they generally point in the same direction: greater attention to outcomes data may help reinforce institutional focus on student success, particularly in the four-year sector.
The size of these estimates, however, suggest that data transparency and benchmarking, on their own, are not strong levers for shifting institutional behavior. Adopting more practices does not appear to increase these impacts, nor does longer exposure to treatment. For most institutions, these reforms seem to support incremental improvement rather than drive meaningful change in outcomes. This likely reflects how accreditors currently use these tools, which are as supplements to the existing review process rather than as mechanisms tied to clearer expectations or consequences.
Our findings point to a need for deeper attention to how outcomes data are used within accreditation rather than how much of it is collected. For policymakers and oversight bodies, the results suggest that strengthening accountability will require more than encouraging accreditors to expand their data infrastructure. For researchers, the next step is to understand how accreditors integrate these practices into review cycles, whether certain approaches carry more weight than others, and how institutions respond when data use is tied to firmer expectations. As accreditors and policymakers continue to refine quality assurance, understanding how data can be used not just to monitor outcomes but to improve them will be essential to building a more robust accreditation system and restoring public trust in the value of higher education.
Acknowledgements
Ithaka S+R would like to thank Arnold Ventures for its support of this project. We’re grateful to Michael Fried and Ariel Mond for their valuable contributions to this report.
Appendix
Appendix A: Overview of accreditation
The federal role in accreditation began with the passage of the GI Bill in 1952. The Higher Education Act (HEA), first passed in 1965, formally established accreditation’s connection to Title IV federal student aid and was reauthorized most recently in 2008.[26] Title IV of the HEA authorizes the distribution of federal funds, such as Pell Grants and direct loans, to students attending institutions of higher education. Title IV funding is crucial to students seeking to afford rising tuition rates and to the institutions that operate based in part on these tuition payments.[27] Given its centrality in the higher education landscape, the allocation of these funds is significant: in 2024, Title IV funding represented $120.8 billion, financing the education of approximately 9.9 million students.[28] In order to access Title IV funding, institutions must be accredited by an agency recognized by The Department of Education (ED). The goal of this accreditation process is to ensure that federal funds are going to institutions that meet a “minimum quality level” of educational instruction. This accreditation process is a key mechanism of federal quality assurance available to institutions seeking Title IV funding, since the HEA prohibits ED from evaluating educational curricula.[29]
ED-recognized accreditation agencies fall into two types: institutional and programmatic. Programmatic accreditors evaluate degree programs in specific professions, such as law or nursing. Institutional accreditors survey the quality of institutions as a whole, taking into account metrics such as educational quality, student services, graduate success outcomes, and an institution’s governance and financial health. In the past, institutional accreditors have been organized either nationally or regionally. Although regional accreditors can now oversee institutions in any part of the country, these agencies are still commonly referred to as “National” and “Regional.” National institutional accreditors typically deal with institutions that have a narrow focus as career-specific institutions or those affiliated with specific religious organizations. These accreditors oversee the majority of religious institutions and for-profit institutions in the country.[30] The formerly regional institutional accreditors, meanwhile, oversee the majority of colleges and universities in the country serving 85 percent of postsecondary students.[31] These include:
- the WASC Senior College and University Commission (WSCUC)[32]
- the Accrediting Commission for Community and Junior Colleges (ACCJC)
- the Higher Learning Commission (HLC)
- the New England Commission of Higher Education (NECHE)
- the Northwest Commission on Colleges and Universities (NWCCU)
- the Middle States Commission on Higher Education (MSCHE)
- the Southern Association of Colleges and Schools Commission on Colleges (SACSCOC)
As voluntary members of an accreditation agency, higher education institutions choose to participate in this system as a condition of their access to federal aid. There is no federal mandate that institutions become or remain accredited. This voluntary structure is meant to preserve institutional autonomy and avoid reliance on federal regulation. Institutions submit to a regular process of review, typically every eight to 10 years, with additional mid-cycle reviews or annual reporting required depending on the accreditor. Accrediting agencies base their evaluations on a self-study by the institution, a peer review and site visit conducted by faculty and administrative representatives from other accredited institutions, and the institution’s response to any concerns raised during the visit. This evaluation process is based on a set of predetermined standards. These standards vary across accreditors, but usually involve an institution’s stated mission and purpose, its abilities for planning and evaluation of its goals, organization and governance, the quality of its academic program, rates of student success, qualifications of faculty and staff, and institutional resources and financial health. These metrics are typically qualitative rather than quantitative and tend to focus on future goals rather than past or present outcomes.[33] Accrediting agencies can choose to grant initial accreditation, reaffirm the accreditation, accredit with further review pending response to a corrective action letter, or remove accreditation altogether. It is uncommon for formerly approved institutions to lose their accreditation.[34]
Along with the institutions they accredit, accreditation agencies themselves are also submitted to a regular process of review. Evaluated every five years, accreditors begin this process by submitting renewal recognition applications to ED. From this point, the accreditor review follows two tracks: one in ED, and the other through the National Advisory Committee on Institutional Quality and Integrity (NACIQI), a federal advisory committee housed within the department. In ED, staff within the department’s Accreditation Group review the accreditor application and develop a report assessing an accreditor’s compliance with renewal criteria. This ED report is shared with the accreditor, who has the opportunity to respond and provide additional documentation to support their application. While ED is conducting this review, NACIQI announces a bi-annual review meeting and invites public comments several months in advance. One month before this meeting, ED shares its final report with NACIQI, inclusive of accreditor comments and staff recommendations. During NACIQI’s bi-annual meeting members discuss and make a recommendation for accreditor recognition, usually, following ED’s recommendation. Within three months of NACIQI’s meeting, the ED and NACIQI recommendations are submitted to an ED senior official, who ultimately decides whether to sign off on an accreditor’s renewal, renew with further review, or remove recognition.[35] Much like with institutional accreditation, it is rare for an accreditor to lose recognition status.[36]
Appendix B: Event study graphs
Figure A1. Graduation Rate within 150% of Normal Time, Four-Year Institutions
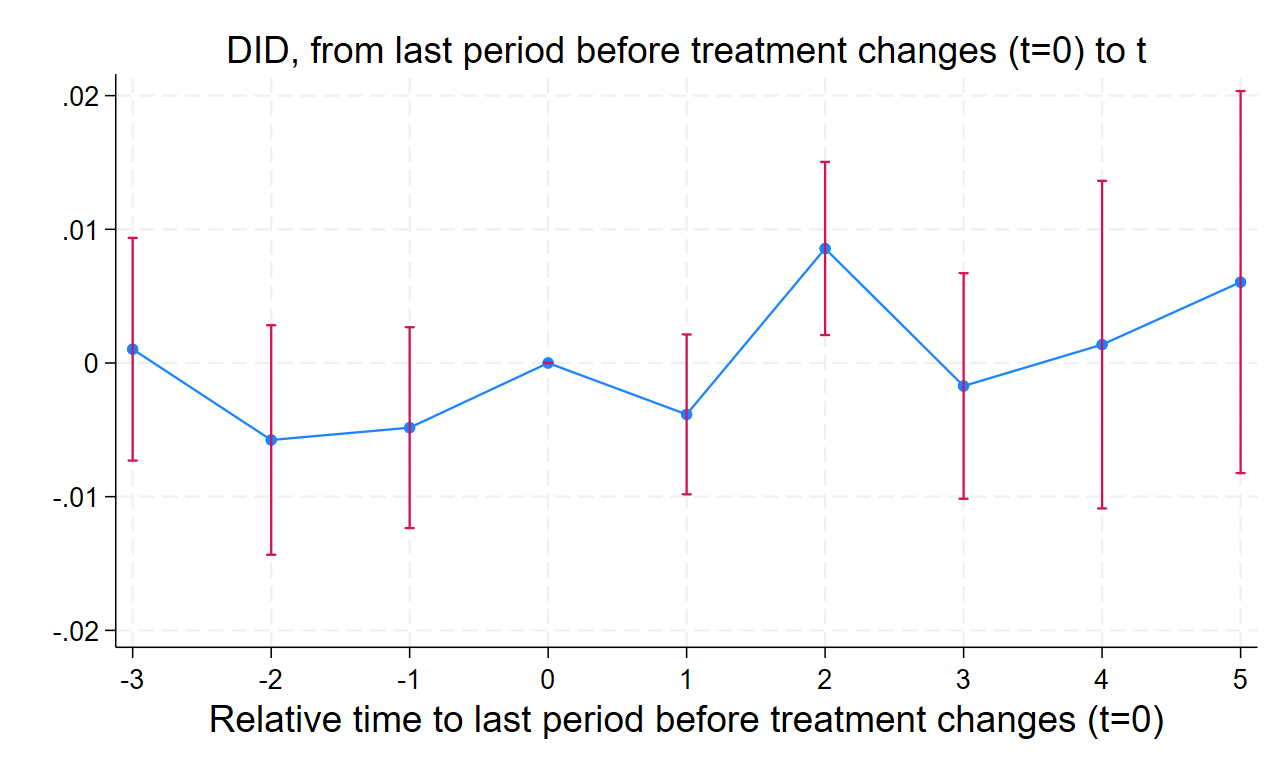
Figure A2. Completions per FTE, Four-Year Institutions
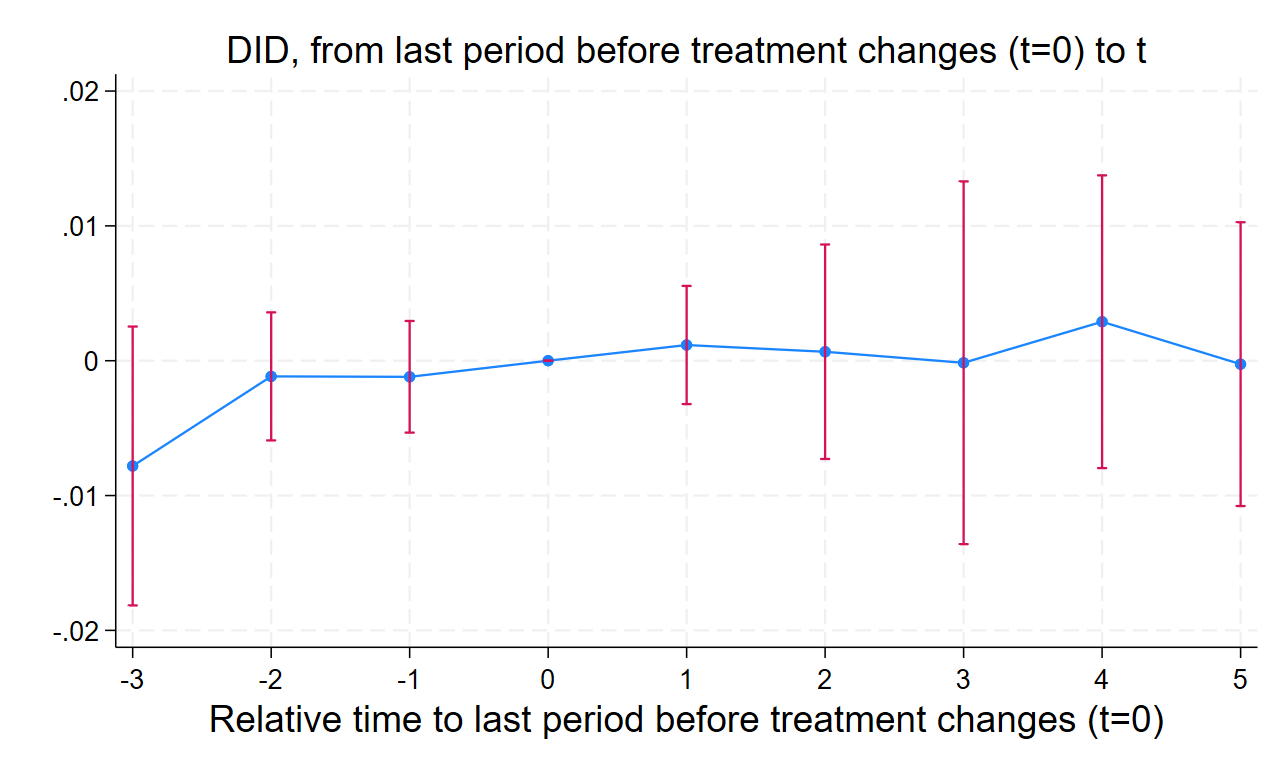
Figure A3. Full-Time Retention Rate, Four-Year Institutions
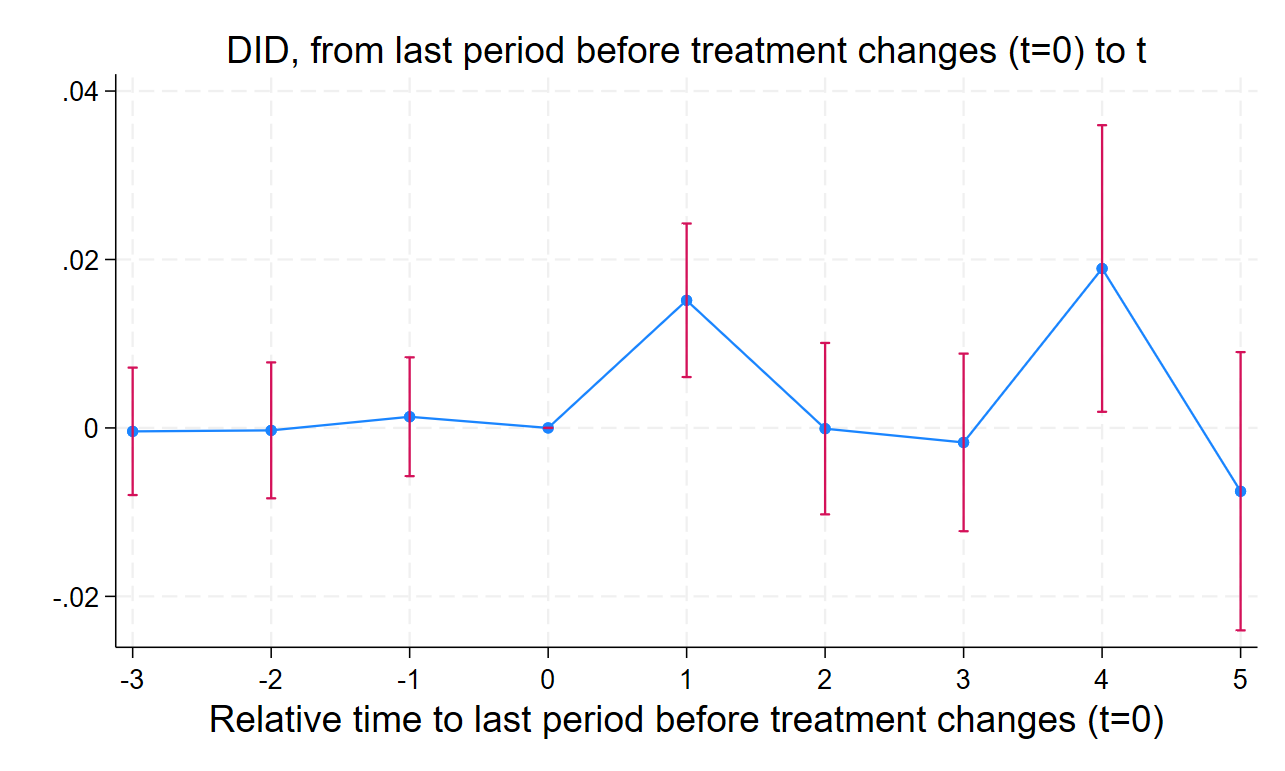
Figure A4. Three-Year Cohort Default Rate, Four-Year Institutions 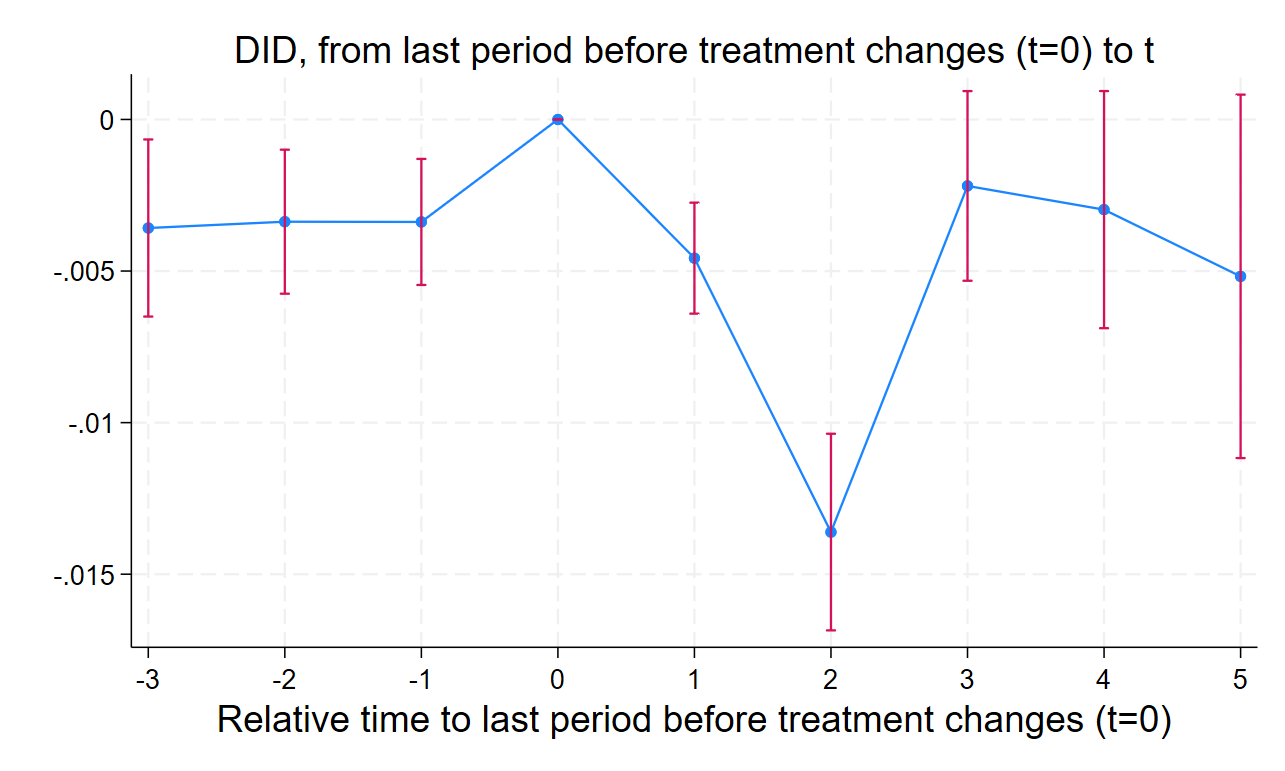
Figure A5. Graduation Rate within 150% of Normal Time, Two-Year Institutions
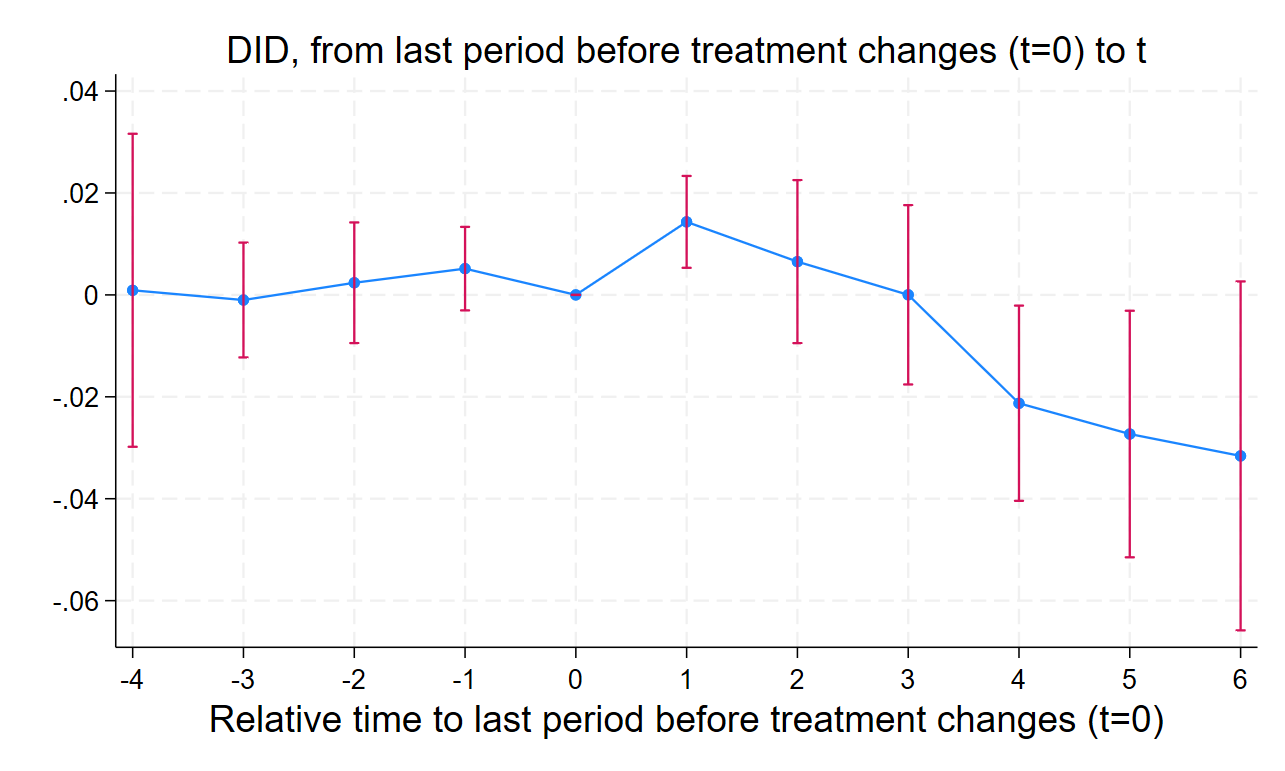
Figure A6. Completions per FTE, Two-Year Institutions
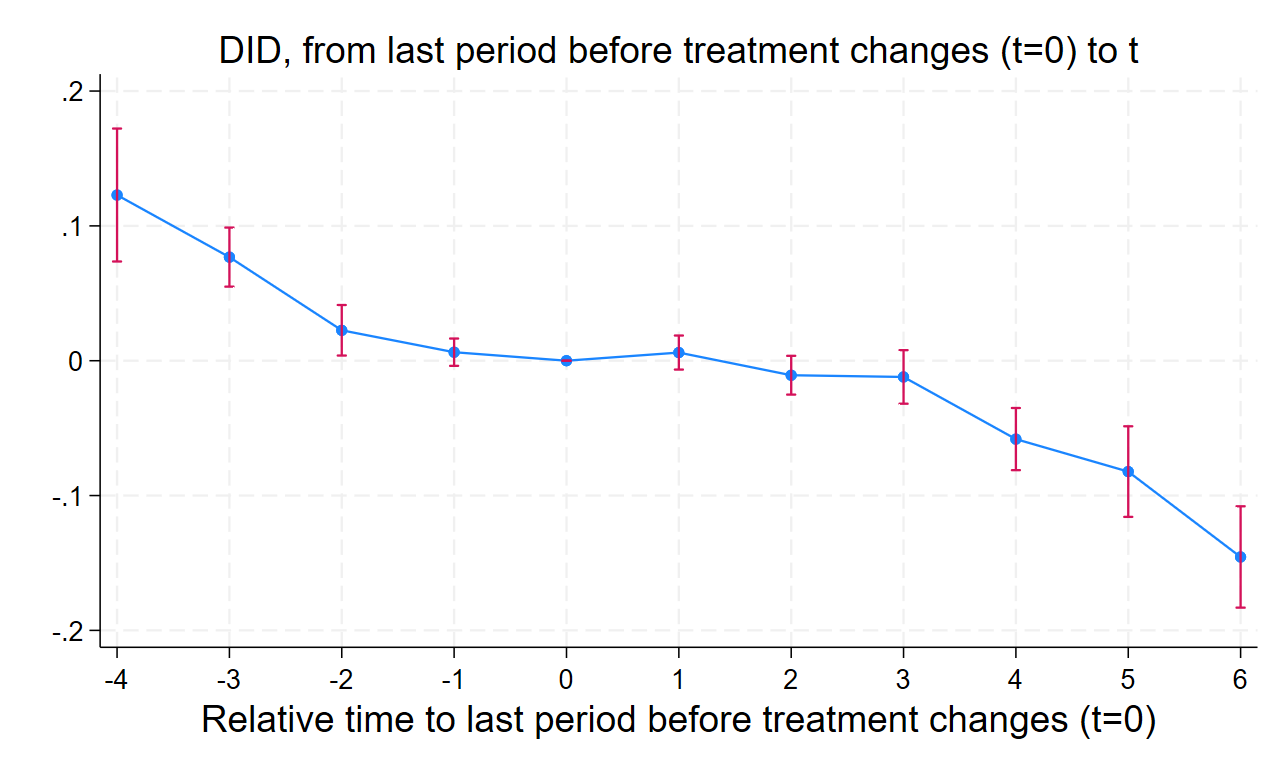
Figure A7. Full-Time Retention Rate, Two-Year Institutions 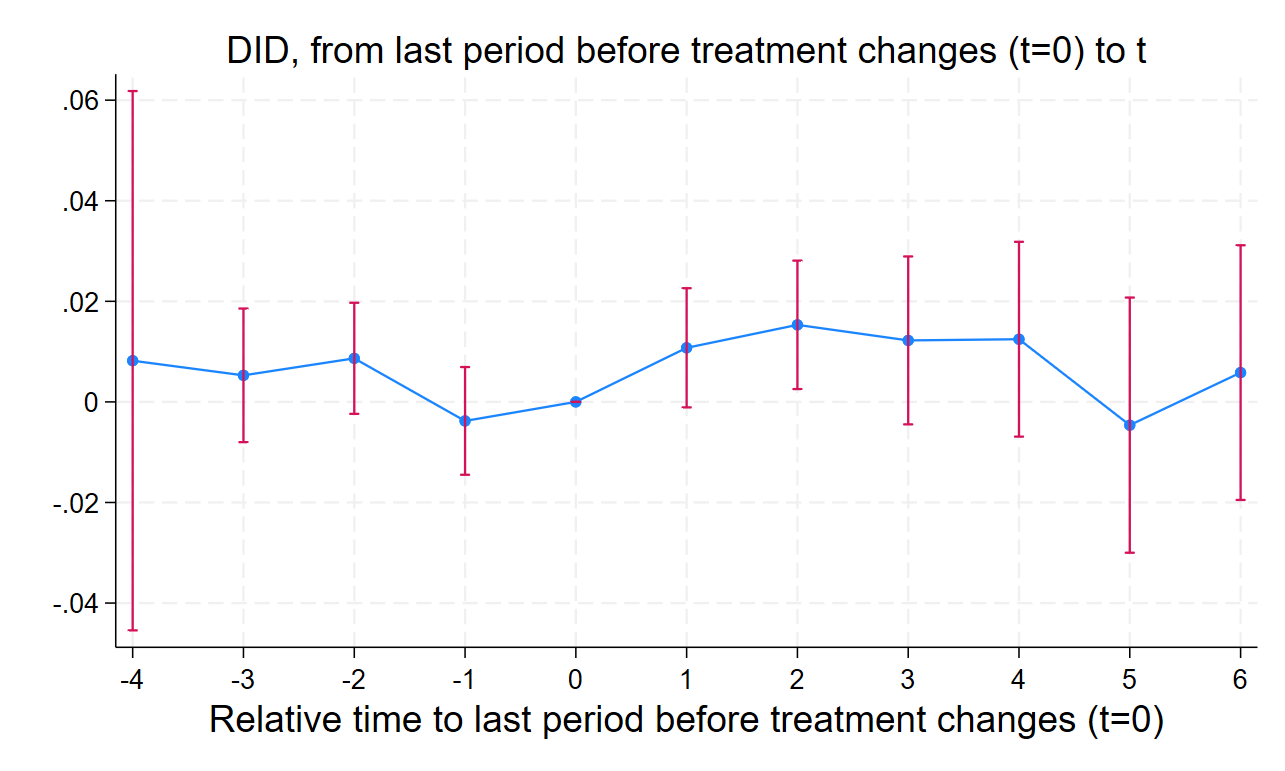
Figure A8. Three-Year Cohort Default Rate, Two-Year Institutions
Endnotes
- A brief overview of the accreditation system and the role of the federal government within it is provided in appendix A. ↑
- David Jesse and Anna Clark, “Michigan’s Baker College spends more on marketing than financial aid,” Detroit Free Press and ProPublica, January 12, 2022, https://www.freep.com/in-depth/news/local/michigan/2022/01/12/baker-college-financial-aid-marketing/915538900. ↑
- Paul Fain, “Data-Driven Accountability,” Inside Higher Ed, September 9, 2019, https://www.insidehighered.com/news/2019/09/10/lumina-convened-task-force-releases-quality-assurance-model-focused-outcomes-equity. ↑
- “WSCUC Earns Lumina Grant to Advance Results-Driven Inquiry, Student Information, and Sustainable Financial Models,” WASC Senior College and University Commission, August 29, 2019, https://web.archive.org/web/20220701102337/https://www.wscuc.org/post/wscuc-earns-lumina-grant-advance-results-driven-inquiry-student-information-and/. ↑
- Accreditors use different terms for student performance measures (such as “achievement,” “outcomes,” or “student success”). In the case studies, we use the terminology each accreditor uses in its own materials. ↑
- “WSCUC Announces Peer Benchmarking Pilot Project,” WASC Senior College and University Commission, November 19, 2020, https://web.archive.org/web/20220817035710/https://www.wscuc.org/post/wscuc-announces-peer-benchmarking-pilot-project/. ↑
- “Peer Benchmarking Guide,” WASC Senior College and University Commission, https://wascsenior.app.box.com/s/uij59ac07v7w0tjfs3zlfwhafynsh6m6. ↑
- “Post Graduate Economic Outcomes Guide: Using Data about Economic Returns to Higher Education,” WASC Senior College and University Commission, https://wascsenior.app.box.com/s/lufkojz8e7cd3h0t7dds276c5vjiur4t. ↑
- “Publications: Student Success,” Higher Learning Commission, https://www.hlcommission.org/learning-center/news-and-publications/publications/#success. ↑
- “Student Success Outcomes,” Higher Learning Commission, https://www.hlcommission.org/about-hlc/initiatives/student-success-outcomes/#research. ↑
- “Risk Indicators,” Higher Learning Commission, https://www.hlcommission.org/accreditation/cycles-and-processes/risk-indicators/#student-success. ↑
- “Quality Initiatives,” Higher Learning Commission, https://www.hlcommission.org/accreditation/cycles-and-processes/standard-and-open-pathways/quality-initiative/#student-success. ↑
- Belle S. Wheelan, “SACSCOC Updates and Information: Memorandum,” SACS COC, January 26, 2021, https://web.archive.org/web/20230529180136/https://sacscoc.org/sacscoc-updates-and-information-january-2021/. ↑
- “ACCJC Data Dashboards and Technology Pilot Project,” Accrediting Commission for Community and Junior Colleges, https://accjc.org/wp-content/uploads/ACCJC-Data-Dashboards-and-Technology-Pilot-Project-January-2024-Report.pdf. ↑
- “ACCJC Launches Student Achievement Dashboards and ROI Metric to Highlight the Value of Higher Education,” Accrediting Commission for Community and Junior Colleges, August 7, 2025, https://accjc.org/announcement/student-achievement-dashboards-roi-metric/. ↑
- “Navigating the Value Landscape for Accreditation,” Accrediting Commission for Community and Junior Colleges, https://accjc.org/wp-content/uploads/Navigating-the-Value-Landscape-for-Accreditation.pdf. ↑
- “Annual Institutional Update,” Middle States Commission on Higher Education, https://www.msche.org/accreditation/annual-institutional-update/. ↑
- “MSCHE Statement on Key Data Indicator Reporting,” Middle States Commission on Higher Education, January 22, 2024, https://www.msche.org/2024/01/22/msche-statement-on-key-data-indicator-reporting/. ↑
- “NACIQI Accreditor Data File,” Northwest Commission on Colleges and Universities, July 2022, https://data.nwccu.org/wp-content/plugins/pdfjs-viewer-shortcode/pdfjs/web/viewer.php?file=https://data.nwccu.org/wp-content/uploads/2023/07/NWCCU-NACIQI-Dashboard-Summary-20222-1.pdf&attachment_id=153&dButton=false&pButton=false&oButton=false&sButton=true&pagemode=none&_wpnonce=8c644de108. ↑
- “NWCCU Guidance on Disaggregated Data and Peer Comparators,” Northwest Commission on Colleges and Universities, July 2025, https://nwccu.app.box.com/s/no9vgipcous7tblt4ox0kcvdqs25oywi. ↑
- “V6I1: Demystifying NWCCU’s Student Achievement Standards,” Northwest Commission on Colleges and Universities, https://nwccu.org/news/v6i1-demystifying-nwccus-student-achievement-standards/. ↑
- “Data and Research Advisory Committee,” New England Commission of Higher Education, https://www.neche.org/data-and-research-advisory-committee/.↑
- John Gardner, “Two-Stage Differences in Differences,” April 2021, https://jrgcmu.github.io/2sdd_current.pdf. ↑
- Clément de Chaisemartin and Xavier d’Haultfoeuille, “Difference-in-Differences Estimators of Intertemporal Treatment Effects,” SSRN, November 16, 2020, last revised November 25, 2024, https://ssrn.com/abstract=3731856. Clément de Chaisemartin and Xavier d’Haultfoeuille, “Two-Way Fixed Effects and Differences-in-Differences Estimators with Several Treatments,” SSRN, December 17, 2020, last revised June 28, 2023, https://ssrn.com/abstract=3751060. ↑
- Jeffrey M. Wooldridge, “Simple Approaches to Nonlinear Difference-in-Differences with Panel Data,” The Econometrics Journal 26, no. 3 (2023): C31–C66.Brantly Callaway, Andrew Goodman-Bacon, and Pedro H. C. Sant’Anna, “Difference-in-Differences with a Continuous Treatment,” National Bureau of Economic Research, February 2024, https://www.nber.org/papers/w32117. ↑
- “Higher Education Opportunity Act – 2008,” US Department of Education, https://www2.ed.gov/policy/highered/leg/hea08/index.html; Antoinette Flores, “Hooked on Accreditation: A Historical Perspective,” Center for American Progress, December 14, 2015, https://www.americanprogress.org/article/hooked-on-accreditation-a-historical-perspective/. ↑
- “Fast Facts: Tuition Costs of Colleges and Universities,” National Center for Education Statistics, https://nces.ed.gov/fastfacts/display.asp?id=76. ↑
- “Federal Student Aid Fiscal Year 2024 Annual Report,” US Department of Education, Federal Student Aid, November 14, 2024, https://studentaid.gov/sites/default/files/fy2024-fsa-annual-report.pdf. ↑
- Alexandra Hegji, “An Overview of Accreditation of Higher Education in the United States,” Congressional Research Service, R43826, October 16, 2020, https://crsreports.congress.gov/product/pdf/R/R43826/10. ↑
- Robert Kelchen, “Accreditation and Accountability” in Higher Education Accountability, (Johns Hopkins University Press, 2018), 96-98. ↑
- Cameron Childress, James Dean Ward, Elizabeth Davidson Pisacreta, and Sunny Chen, “Overseeing the Overseers: Can Federal Oversight of Accreditation Improve Student Outcomes?,” Ithaka S+R, May 25, 2022, https://doi.org/10.18665/sr.316765. ↑
- The Western Association of Schools and Colleges (WASC) represents two accrediting organizations: the Western Association of Schools and Colleges Accrediting Commission for Community and Junior Colleges, and the Western Association of Schools and Colleges Senior College and University Commission. “CHEA- and USDE-Recognized Accrediting Organizations,” CHEA Council for Higher Education Accreditation, https://www.chea.org/chea-and-usde-recognized-accrediting-organizations. ↑
- Barbara Brittingham, “Accreditation in the United States: How Did We Get to Where We Are?” New Directions for Higher Education, no. 145 (Spring 2009): 7-27, https://doi.org/10.1002/he.331. ↑
- “Higher Education: Education Should Strengthen Oversight of Schools and Accreditors,” Government Accountability Office (GAO), December 2014, 27, https://www.gao.gov/assets/gao-15-59.pdf. ↑
- “Accreditor Federal Recognition Process,” US Department of Education, https://www2.ed.gov/admins/finaid/accred/accreditor-federal-recognition-process-steps.pdf. ↑
- Recent years have seen an exceptional case concerning the Accrediting Council for Independent Colleges and Schools (ACICS), which lost its accreditation. Natalie Schwartz, “Feds Yank ACICS’ Recognition, Add Strict Requirements on Colleges it Accredited,” Higher Ed Dive, August 29, 2022, https://www.highereddive.com/news/feds-yank-acics-recognition-add-strict-requirements-on-colleges-it-accred/630133/. ↑