Canadian Association of Research Libraries Faculty Survey
Executive Summary of Findings
-
Table of Contents
- Discovery Where do faculty members begin the research process?
- Digital research activities What is the impact of digital technologies on research?
- Student research skills How do faculty members perceive student research and critical thinking skills?
- Role of the library How do faculty members perceive the library?
- Data preservation and management How do faculty members use data and what services do they require?
- Reflections
Since 2014, eleven member institutions from the Canadian Association of Research Libraries (CARL) have administered the Ithaka S+R Local Faculty Survey on their campuses.[1] The survey instrument covers many scholarly research and teaching-related topics, in part overlapping with the 2015 Ithaka S+R U.S. Faculty Survey and other previous iterations of the Ithaka S+R U.S. Faculty Survey.[2]
Each of these Local Faculty Surveys included a core set of questions on preferences and practices related to discovery, digital research activities, perceptions of student research skills, the role of the library, and data preservation and management, and was then further customized with coverage on additional topics to meet each institution’s needs. This document covers the thematic areas that every institution included in its questionnaire.
Key findings
- Nearly three-quarters of faculty members strongly believe that the primary responsibility of the library should be facilitating their access to scholarly materials. Approximately half of respondents strongly agreed that the primary responsibility should be supporting undergraduate student learning. Respondents in the arts and humanities and those who identified more as teachers valued these two responsibilities of the library most evenly.
- Faculty members who teach at a distance more strongly agree that their students have poor research skills. Approximately sixty percent of these respondents strongly agreed that these students have poor skills related to locating and evaluating scholarly information. These respondents are also more likely to agree that librarians help students to succeed in their courses.
- Faculty members in the arts and humanities and social sciences differ from those in the sciences and medical, veterinary, and health science fields in the ways in which they begin their research processes. Those in the arts and humanities and social sciences are more inclined to begin with the library’s website or catalog, whereas their peers in the sciences and medical, veterinary, and health science fields are more likely to turn to specific electronic resources or databases.
- Faculty members have a clear preference for self-reliance in preserving their research data. Following the conclusion of a project, approximately three-quarters of respondents indicated that they preserve their research data themselves. Approximately half of respondents highly value freely available software and the support of their college or university library in managing and preserving these data.
- Scientists especially value many digital research activities and methodologies, including the analysis of quantitative data, the use of models and simulations, and the writing of software and code. These faculty members also indicated a higher level of interest in integrating these activities and methodologies and a higher level of already having integrated these approaches as compared to their peers in other disciplines.
Institutional details
Across these eleven institutions, there were 4,039 respondents in total. Unless otherwise noted, Ithaka S+R distributed survey invitations to the institutions’ faculty members.
Table 1. Institutional participation details
| Institution | Month(s) in field | Number faculty invited | Number of respondents | Response rate |
|---|---|---|---|---|
| University of Alberta | Dec 2014 - Jan 2015 | 6,981 | 551 | 7.89% |
| University of Guelph | Oct 2014 - Nov 2014 | 1,219 | 356 | 29.20% |
| McMaster University | Jan 2015 - Feb 2015 | 940 | 280 | 29.79% |
| Université de Montréal | January 2015 - February 2015 | n/a[3] | 309 | n/a |
| Memorial University of Newfoundland (MUN) | January 2015 - February 2015 | 1,525 | 392 | 25.70% |
| University of Ottawa | November 2014 - December 2014 | 2,437 | 512 | 21.01% |
| Ryerson University | September 2014 - October 2014 | 1,995 | 468 | 23.46% |
| Simon Fraser University (SFU) | April 2016 - May 2016 | 1,105 | 459 | 41.54% |
| University of New Brunswick (UNB) | January 2015 - February 2015 | n/a[4] | 138 | n/a |
| University of Windsor | November 2014 | 1,073 | 227 | 21.16% |
| York University | October 2014 | 1,253 | 347 | 27.69% |
Analytical approach
Responses in this report are often stratified by demographic items including respondents’ disciplines, number of years in the field, affiliation as more of a researcher or a teacher, and face-to-face vs. at a distance approaches to teaching.[5] While some differences across respondents are driven by institutional affiliation, and these differences are highlighted in this report, much of the variation can be attributed to these aforementioned demographic items. This population of respondents across the eleven institutions broke down demographically in the following ways:
Table 2. In which academic discipline do you work?
| Response | Percent | |
|---|---|---|
| Arts and Humanities | 1,064 | 27.01% |
| Social Sciences | 1,237 | 31.40% |
| Sciences | 1,090 | 27.67% |
| Medical, Veterinary, or Health Sciences | 548 | 13.91% |
Table 3. For how many years have you been in your field?
| Response | Percent | |
|---|---|---|
| 0 - 5 | 201 | 6.43% |
| 6 - 10 | 442 | 14.14% |
| 11 - 15 | 560 | 17.91% |
| 16 - 20 | 562 | 17.98% |
| 21+ | 1,361 | 43.54% |
Table 4. Do you think of yourself primarily as a researcher, primarily as a teacher, or somewhere in between?
| Response | Percent | |
|---|---|---|
| Much more as a researcher than as a teacher | 629 | 15.95% |
| Somewhat more as a researcher than as a teacher | 787 | 19.95% |
| About equally as a researcher and a teacher | 1,557 | 39.48% |
| Somewhat more as a teacher than as a researcher | 428 | 10.85% |
| Much more as a teacher than as a researcher | 543 | 13.77% |
Table 5. Faculty members teach courses both in traditional face-to-face classroom settings and using a variety of distance education models. Do you teach courses primarily face-to-face, primarily remotely, or somewhere in between?
| Response | Percent | |
|---|---|---|
| Primarily teach face-to-face | 3,524 | 90.24% |
| About equally face-to-face and at a distance | 82 | 7.66% |
| Primarily teach at a distance | 299 | 2.10% |
In our reporting here, we have aggregated responses to simplify the presentation of findings. Responses are generally grouped together into categories for questions where respondents are asked to respond on a 1 to 10 scale. Responses of 8, 9, and 10 are often grouped together for analysis and characterized as strong positive responses; responses of 1, 2, and 3 are grouped together for analysis and characterized as strong negative responses; and responses of 4, 5, 6, and 7 are grouped together and characterized as relatively neutral responses. Additionally, questions that use a 1-6 scale are similarly grouped into categories: 1-2 (strong negative response), 3-4 (neutral), and 5-6 (strong positive response).
Discovery
Where do faculty members begin the research process?
Faculty members were first asked about the ways in which they approach the research process, both in generally exploring literature to find new journal articles and monographs and in looking for a specific piece of literature, and ways in which they keep up with current scholarship in their fields. Respondents from differing academic disciplines especially vary in the ways that they approach the research process (see Figures 1 through 4).
- Faculty members in the medical, veterinary, and health sciences fields are less likely than their peers in other disciplines to begin the research process with a general purpose search engine and are more likely to begin with a specific electronic resource or database. Respondents from the arts and humanities and social sciences both are more likely than those from the sciences and medical, veterinary, and health sciences disciplines to begin with the online library website or catalog and less likely to begin with specific electronic resources or databases.
- Humanists and social scientists also are more likely than their peers to visit the library’s website or catalog and less likely to use a specific scholarly database or search engine when trying to locate a specific piece of secondary scholarly literature that they already know about but do not have in hand. We see the same behavior reported when respondents were asked about how they explore the scholarly literature to find new journal articles and monographs; those in the sciences and medical, veterinary, or health sciences disciplines are more likely than their peers to search on a specific scholarly database or search engine and less likely to visit the library’s website or online catalog. Overall, when exploring the scholarly literature, the largest share of respondents reported using a specific scholarly database or search engine, whereas the largest share of respondents reported visiting the library’s website or catalog when looking for a specific piece of literature.
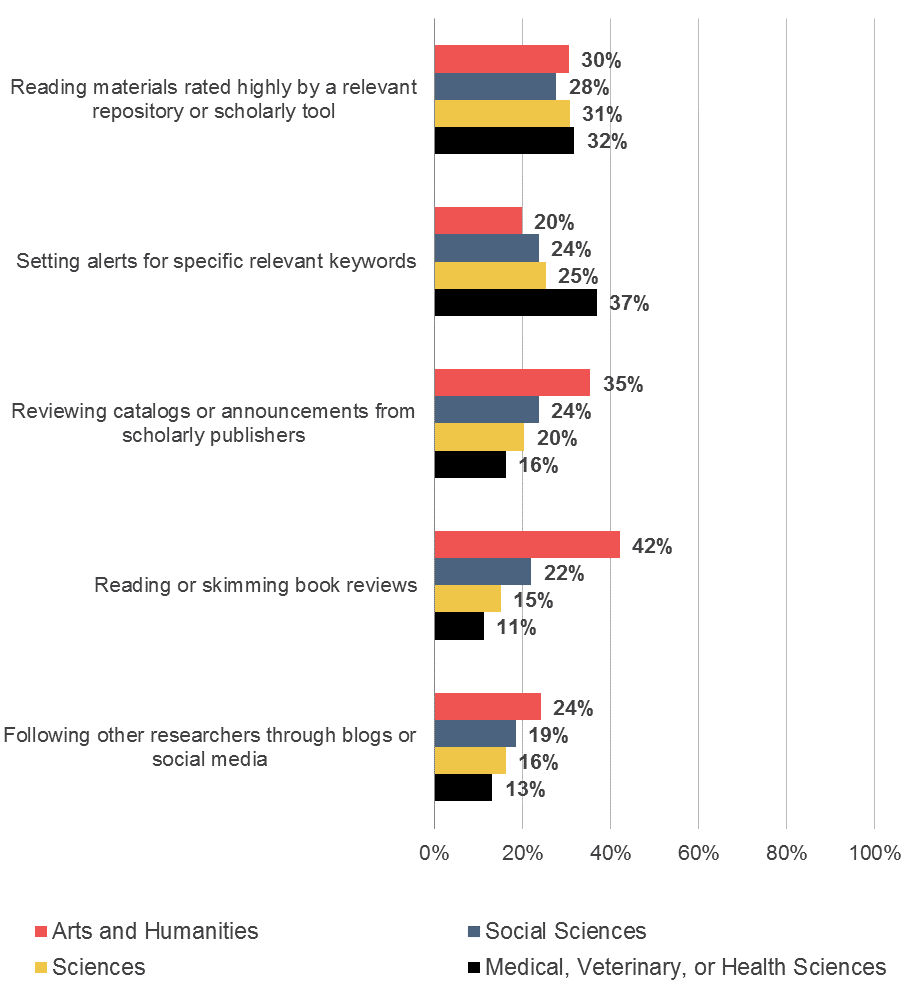
- To keep up with scholarship in their respective fields, faculty members overall, with little variation by discipline, indicated that attending conferences or workshops was highly important. However, there are a number of methods for staying current for which there are differences by discipline. Humanists, for example, value “reading or skimming book reviews” and “reviewing catalogs or announcements from scholarly publishers” more highly than those respondents from other disciplines, whereas those from the medical, veterinary, and health science fields more highly value “setting alerts for specific relevant keywords.” Both humanists and social scientists more highly value “reading materials suggested by other scholars” as compared with peers in other disciplines.
Figure 1: Below are five possible starting points for research in academic literature. Typically, when you are conducting academic research, which of these five starting points do you use to begin locating information for your research? Percent of respondents who indicated that each option is the starting point for research in academic literature. (N= 3,924)
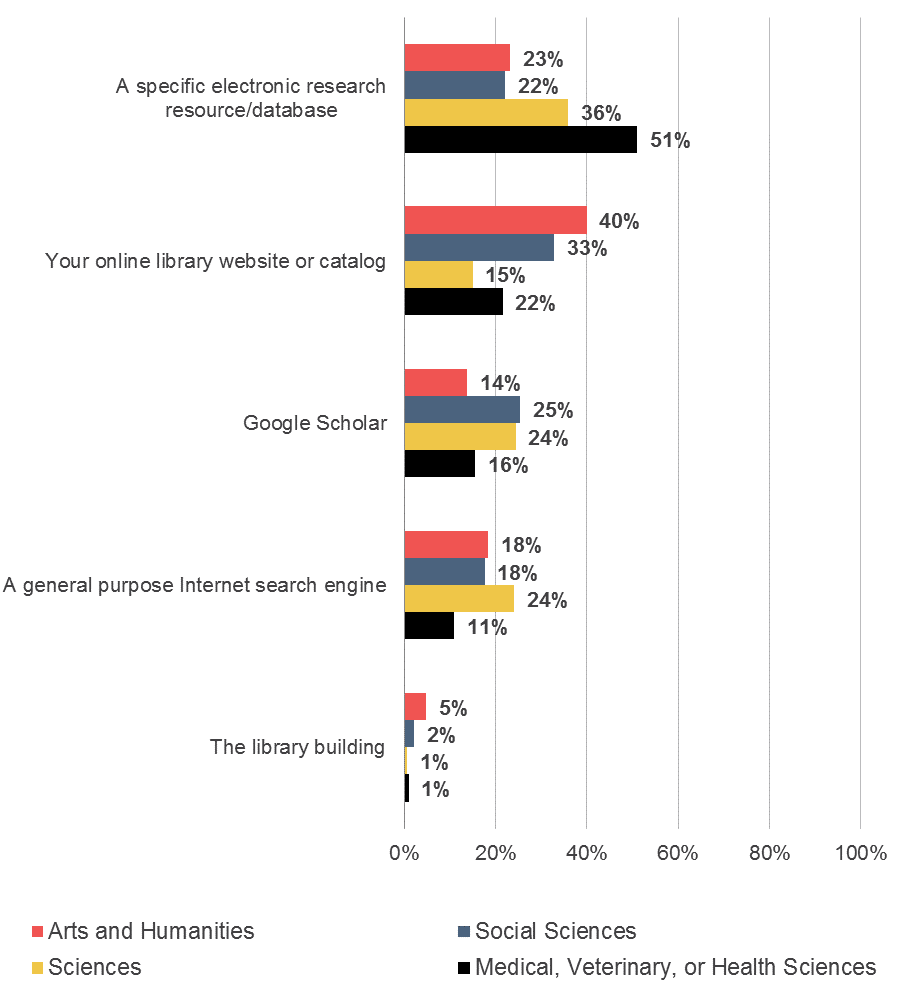
Figure 2: When you try to locate a specific piece of secondary scholarly literature that you already know about but do not have in hand, how do you most often begin your process? Select one of the following answers. Percent of respondents who indicated that each option is how they most often begin their process. (N= 3,925)
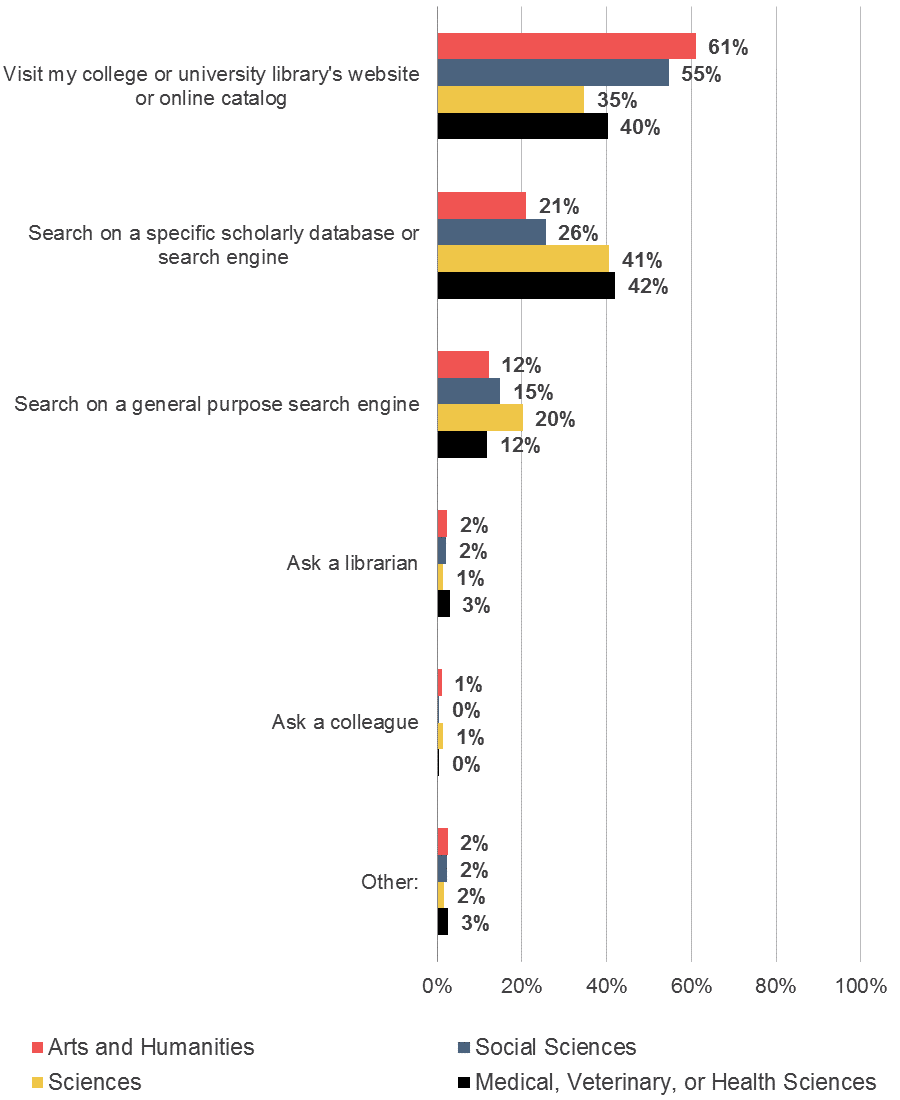
Figure 3: When you explore the scholarly literature to find new journal articles and monographs relevant to your research interests, how do you most often begin your process? Select one of the following. Percent of respondents who indicated that each option is how they most often begin their process. (N= 3,918)
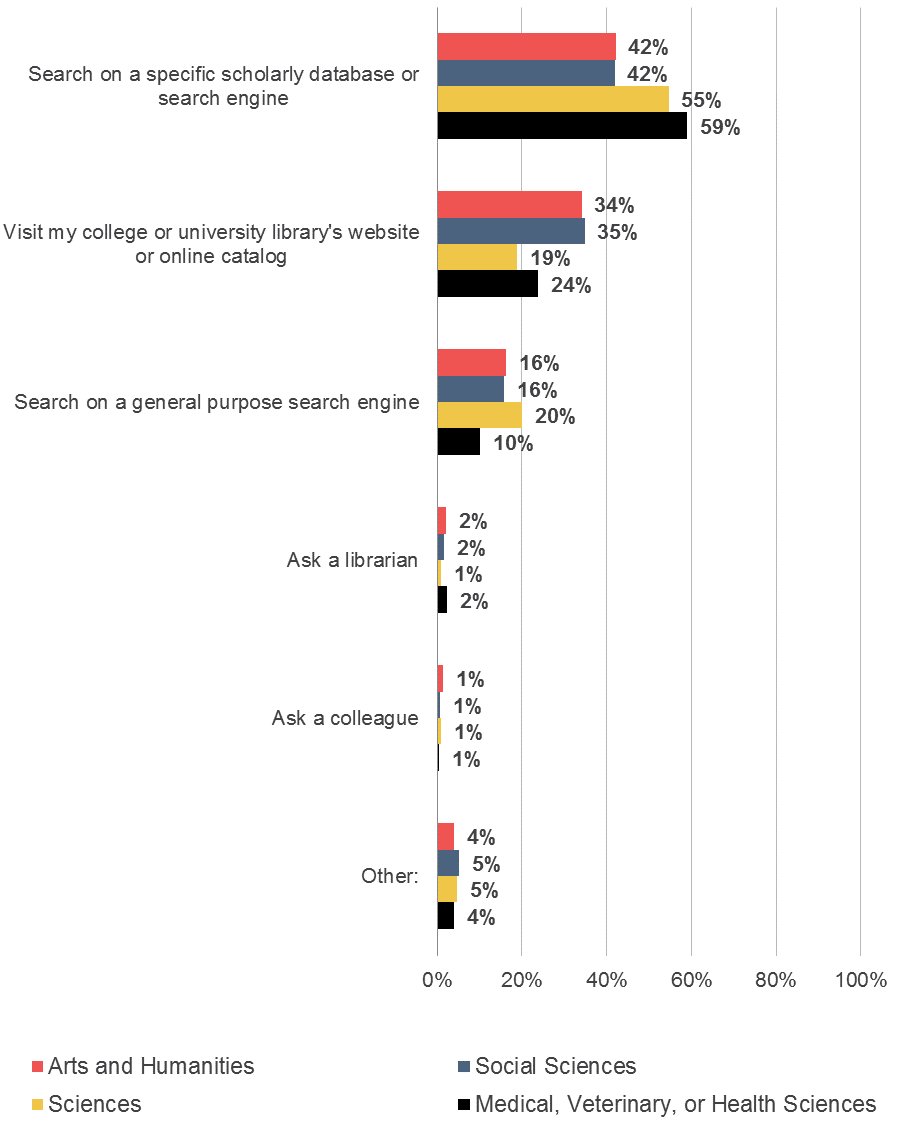
Figure 4a: You may employ a variety of different tactics to “keep up” with current scholarship in your field on a regular basis. Please use the scales below to rate from 10 to 1 how important each of the following methods is for staying current with new scholarship in your field, where 10 equals “Extremely important” and 1 equals “Not at all important.” Please select one rating for each item. Percent of respondents who indicated that each of these methods is very important (8-10). (N= 3,885)
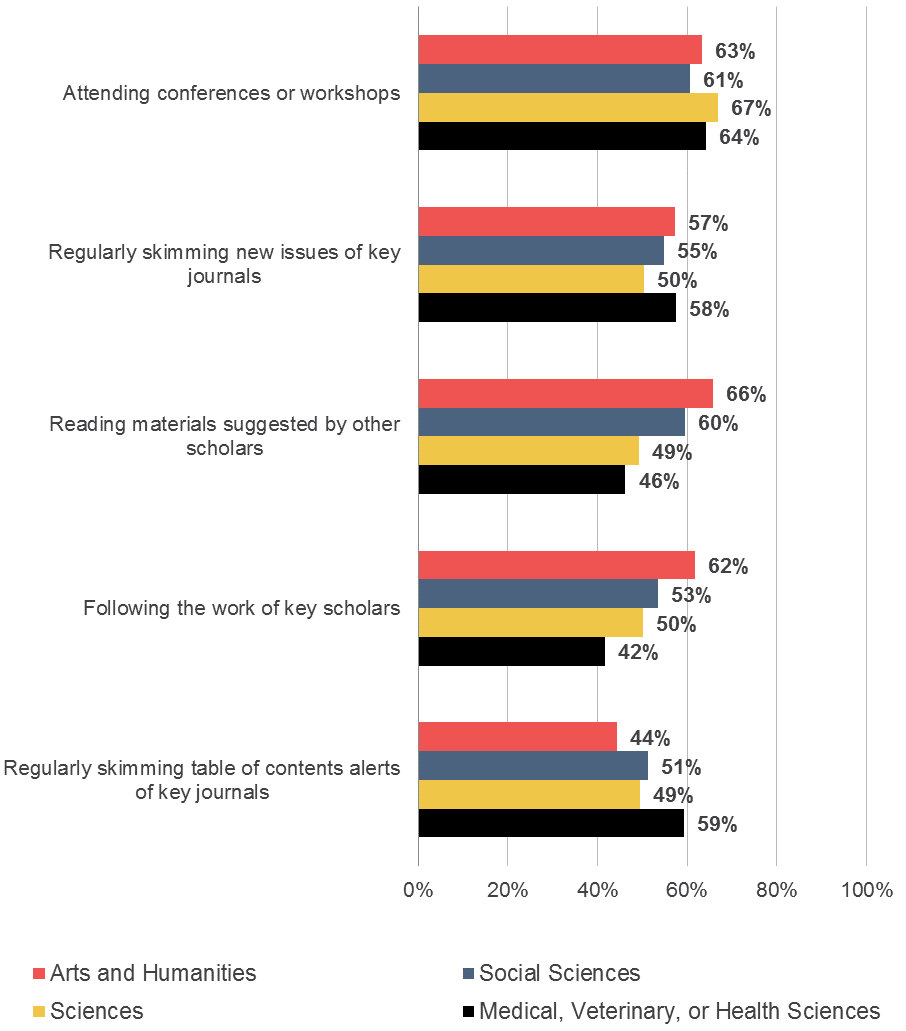
Figure 4b: You may employ a variety of different tactics to “keep up” with current scholarship in your field on a regular basis. Please use the scales below to rate from 10 to 1 how important each of the following methods is for staying current with new scholarship in your field, where 10 equals “Extremely important” and 1 equals “Not at all important.” Please select one rating for each item. Percent of respondents who indicated that each of these methods is very important (8-10). (N= 3,885)
Digital research activities
What is the impact of digital technologies on research?
Respondents were then asked about their interest in, and the importance of, integrating digital research activities and methodologies into their research. Questions on these topics were only displayed to respondents who indicated that they perform research as a part of their professional responsibilities; overall, 86% of respondents conduct research.
We see that faculty members often differ in the importance they assign to various digital research activities and methodologies by discipline and number of years in the field (see Figures 5 and 6).
- Scientists especially value using models or simulations and writing software or code as compared to their peers in other disciplines, and both respondents in the sciences and medical, veterinary, and health sciences fields more highly value the analysis of quantitative data that is generated in the course of research. Humanists value all of the activities and methodologies less highly than peers in other disciplines.
- Respondents with less years in the field rated many of the digital activities and methodologies as more highly important than did those with more years in the field.
Furthermore, respondents who assigned higher levels of importance to the various digital research activities and methodologies often indicated greater interest in integrating these activities and methodologies. They also demonstrated higher levels of already having integrated these activities and methodologies, with no interest in further integrating more deeply (See Figures 7 and 8).
- Respondents in the sciences most strongly agreed that they are very interested in integrating digital research activities and methodologies more deeply into their work; they also most strongly agreed that they make use of digital research activities and methodologies in their work, but are not interested in integrating them more deeply. Conversely, we see the opposite for humanists, the subgroup that assigned the lowest level of value to the activities and methodologies.
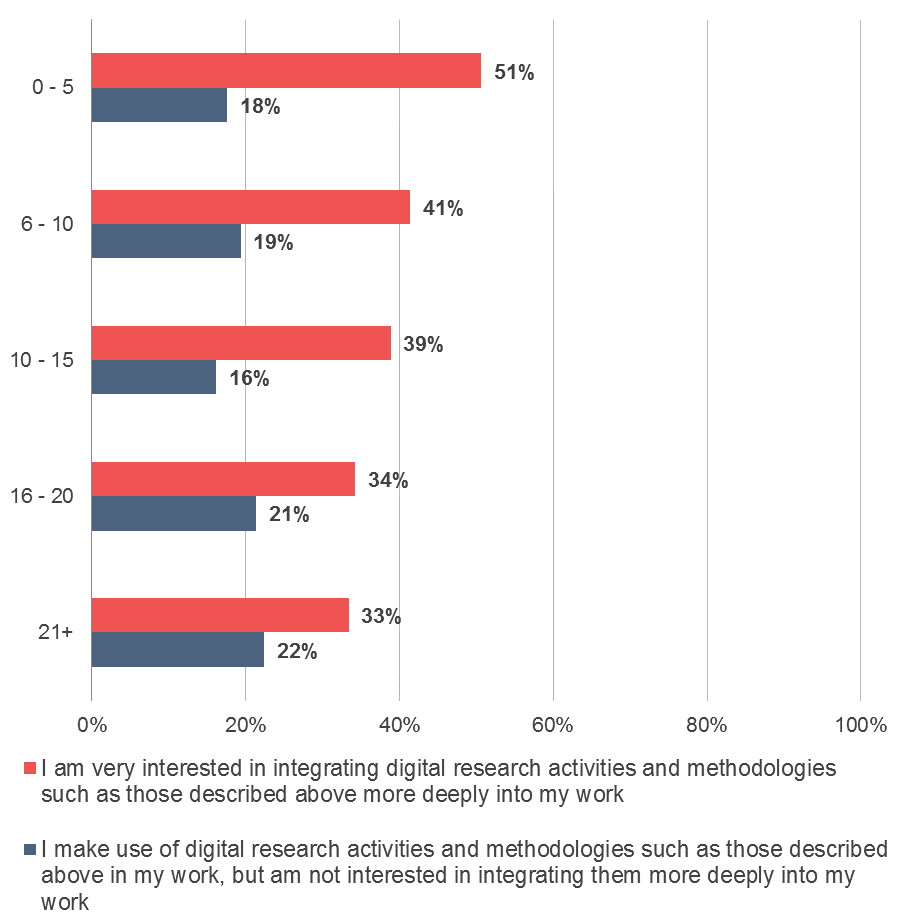
- Faculty members with fewer years in the field also indicated relatively higher levels of interest in integrating these activities and methodologies. We do not see substantial differences for the share of respondents, by number of years in the field, that are not interested in more deeply integrating the activities and methodologies.
Figure 5: How important to your research is each of the following digital research activities and methodologies today? Use the scales below to rate from 10 to 1 where 10 equals “Extremely important” and 1 equals “Not at all important.” Please select one answer for each item. Percent of respondents who indicated that each of these activities and methodologies is very important (8-10).
(N= 3,355)

Figure 6: How important to your research is each of the following digital research activities and methodologies today? Use the scales below to rate from 10 to 1 where 10 equals “Extremely important” and 1 equals “Not at all important.” Please select one answer for each item. Percent of respondents by years in the field who indicated that each of these activities and methodologies is very important (8-10). (N= 2,676)
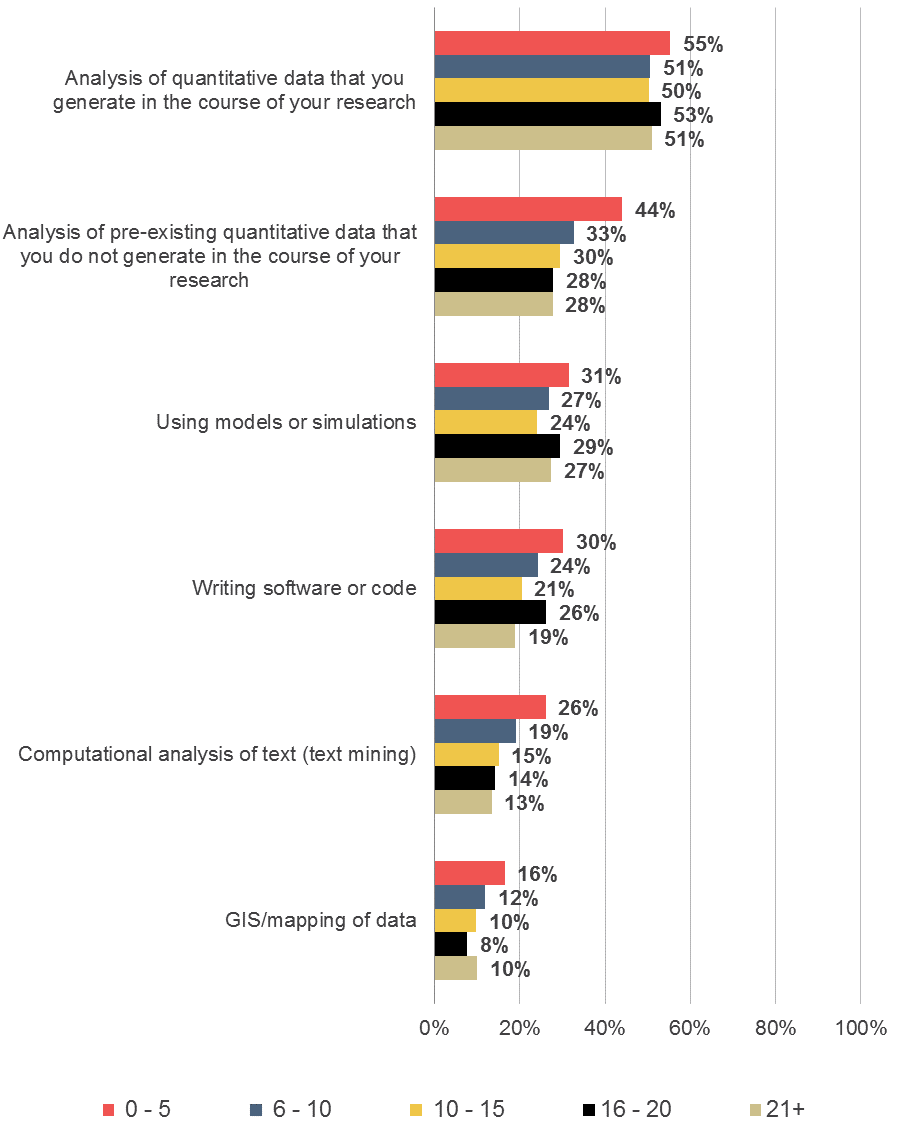
Figure 7: Please use the 10 to 1 scales below to indicate how well each statement below describes your point of view, where a 10 equals “Extremely well” and a 1 equals “Not at all well.” You may pick any number on the scale. The higher the number, the better you think the statement describes your point of view. The lower the number, the less you think the statement describes your point of view. Percent of respondents who strongly agreed with each statement (8-10).
(N= 3,322)
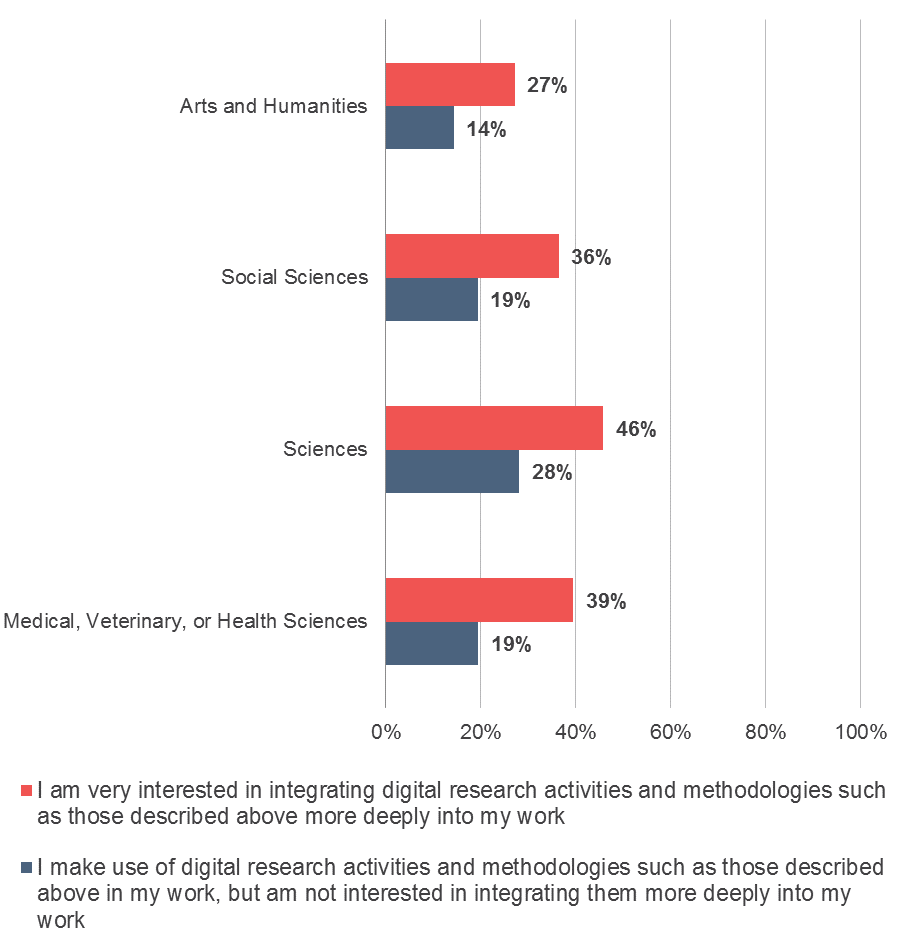
Figure 8: Please use the 10 to 1 scales below to indicate how well each statement below describes your point of view, where a 10 equals “Extremely well” and a 1 equals “Not at all well.” You may pick any number on the scale. The higher the number, the better you think the statement describes your point of view. The lower the number, the less you think the statement describes your point of view. Percent of respondents by years in the field who strongly agreed with each statement (8-10). (N= 2,651)
Student research skills
How do faculty members perceive student research and critical thinking skills?
Faculty members for whom teaching is among their professional responsibilities (93% of respondents overall) were then asked a series of questions on student research skills (see Figures 9 through 12).
- Respondents in the arts and humanities and social sciences more strongly agreed that their undergraduate students “have poor skills related to locating and evaluating scholarly information” as compared to those from other disciplines. Conversely, those from the sciences and who teach primarily face-to-face indicated lower levels of agreement – that is, they less strongly believe that their students have poor research skills. A relatively smaller share of respondents from the sciences indicated that undergraduate students’ interaction with librarians at their university library help students to succeed in their courses.
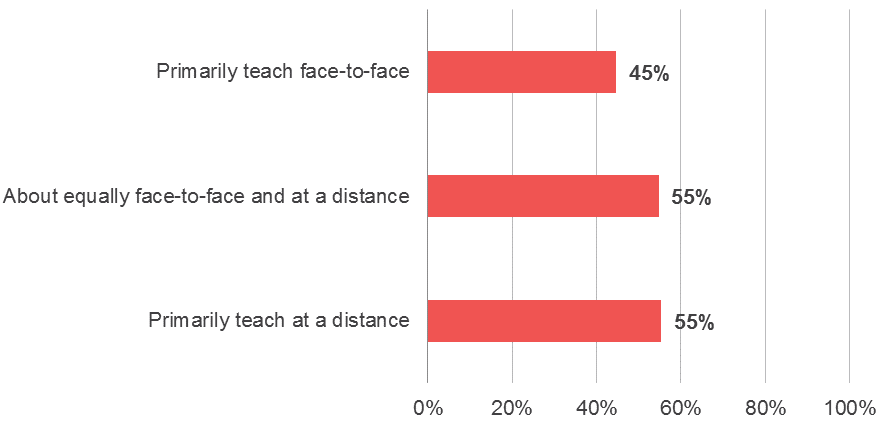
- A larger share of respondents who primarily teach at a distance more strongly agreed that their undergraduate students have poor research skills and that interactions with librarians help students to succeed in their courses.
- Perceptions related to student research skills and associated interactions with librarians were not affected by the number of years that respondents were in the field.
Figure 9: Please use the 10 to 1 scales below to indicate how well each statement below describes your point of view – a 10 equals “Extremely well” and a 1 equals “Not at all well.” You may pick any number on the scale. The higher the number, the better you think the statement describes your point of view. The lower the number, the less you think the statement describes your point of view. Percent of respondents who strongly agreed with the following statement (8-10).
(N= 3,289)
“My undergraduate students have poor skills related to locating and evaluating scholarly information.”
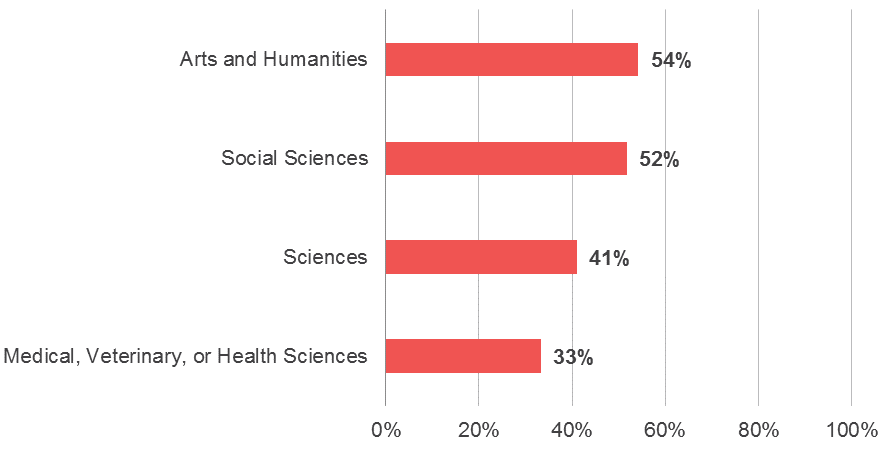
Figure 10: Please use the 10 to 1 scales below to indicate how well each statement below describes your point of view – a 10 equals “Extremely well” and a 1 equals “Not at all well.” You may pick any number on the scale. The higher the number, the better you think the statement describes your point of view. The lower the number, the less you think the statement describes your point of view. Percent of respondents who strongly agreed with the following statement (8-10). (N= 3,287)
“My undergraduate students have poor skills related to locating and evaluating scholarly information.”
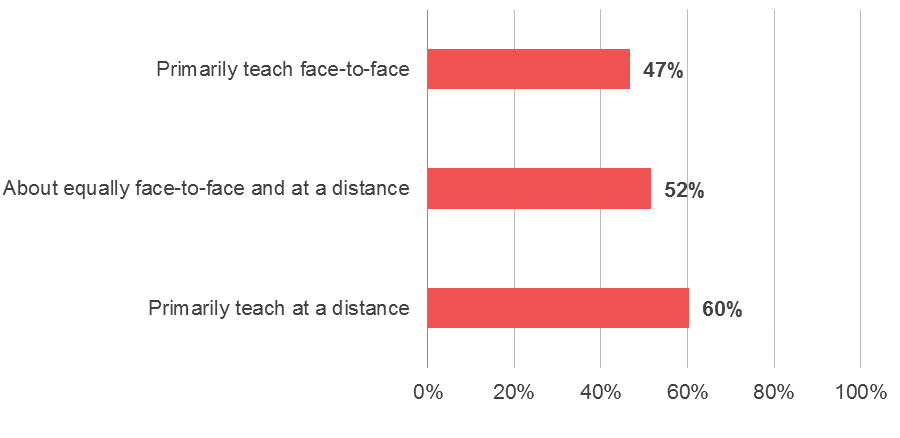
Figure 11: Please use the 10 to 1 scales below to indicate the extent to which undergraduate students’ interaction with librarians at your college or university library helps them to succeed in your courses, where a 10 equals “Helps significantly” and a 1 equals “Does not help at all.” Percent of respondents who indicated that these interactions are highly helpful (8-10). (N= 3,206)
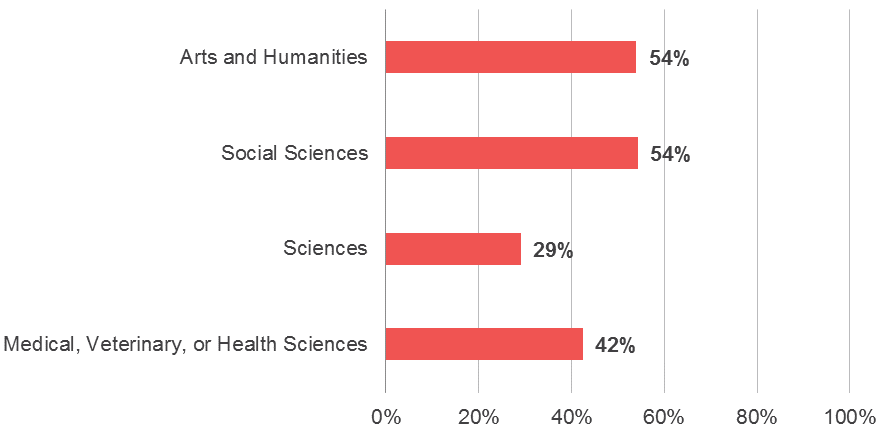
Figure 12: Please use the 10 to 1 scales below to indicate the extent to which undergraduate students’ interaction with librarians at your college or university library helps them to succeed in your courses, where a 10 equals “Helps significantly” and a 1 equals “Does not help at all.” Percent of respondents who indicated that these interactions are highly helpful (8-10). (N= 3,207)
Role of the library
How do faculty members perceive the library?
Respondents also had an opportunity to provide input regarding how they view the importance and functions of the library (see Figures 13 through 18).
- When asked about their dependence on the library for research, respondents from differing institutions indicated varying levels of dependence. We did not observe this level of variation based on stratification by other demographic items.
- There are notable differences in the importance that faculty members assign to various functions of the library depending on discipline, affiliation as a researcher or a teacher, and institution. However, there is consensus across these subgroups in the high level of importance that respondents have assigned to the role of the library in paying for needed resources.
- Compared with peers from other disciplines, scientists relatively value all of the roles of the library less highly – with the exception of the “buyer” role, which they rate highly.
- Respondents who identify as more of a researcher than a teacher rate the “buyer” role relatively more highly, whereas those who identify as more of a teacher more highly value the “teaching support” and “undergraduate support” roles.
- Respondents from different institutions indicated their needs and expectations from the library in the differing levels of importance they assigned to the various roles of the library.
- Citing increased access to scholarly content online, respondents in the sciences and medical, veterinary, and health sciences fields, and those who identified more as researchers, slightly more strongly agreed that the role librarians play is becoming less important and that less money should be spent on library buildings and staff. Contrary to this, humanists and social scientists, and those who identify more as teachers were less likely to agree.
- Overall, respondents indicated that the primary responsibility of the library should be facilitating their access to scholarly materials as opposed to supporting undergraduate student learning by helping students to develop research skills and find, access, and make use of needed materials. Respondents in the arts and humanities disciplines and who identified more as teachers valued these two responsibilities of the library most evenly.
Figure 13: How dependent would you say you are on your college or university library for research you conduct? Please rate from 10 to 1 where 10 equals “Completely dependent” and 1 equals “Not at all dependent.” Percent of respondents who are very dependent (8-10). (N= 3,986)
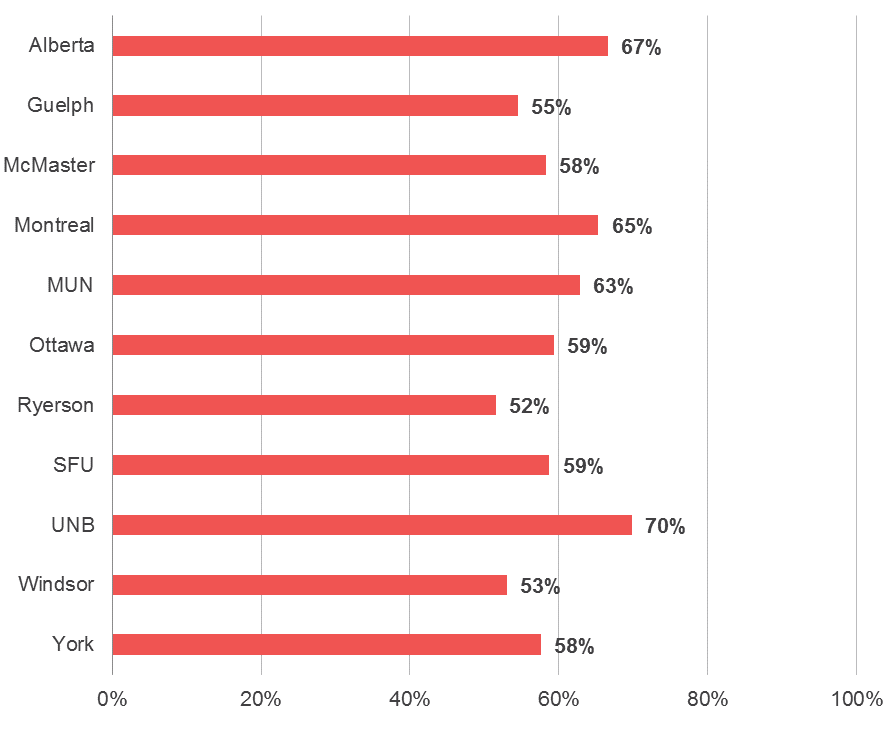
Figure 14: How important is it to you that your college or university library provides each of the functions below or serves in the capacity listed below? Please use the scales below to rate from 6 to 1, where 6 equals “Extremely important” and 1 equals “Not at all important.” Please select one answer for each item. Percent of respondents who indicated that each function is very important (5-6). (N= 3,909)
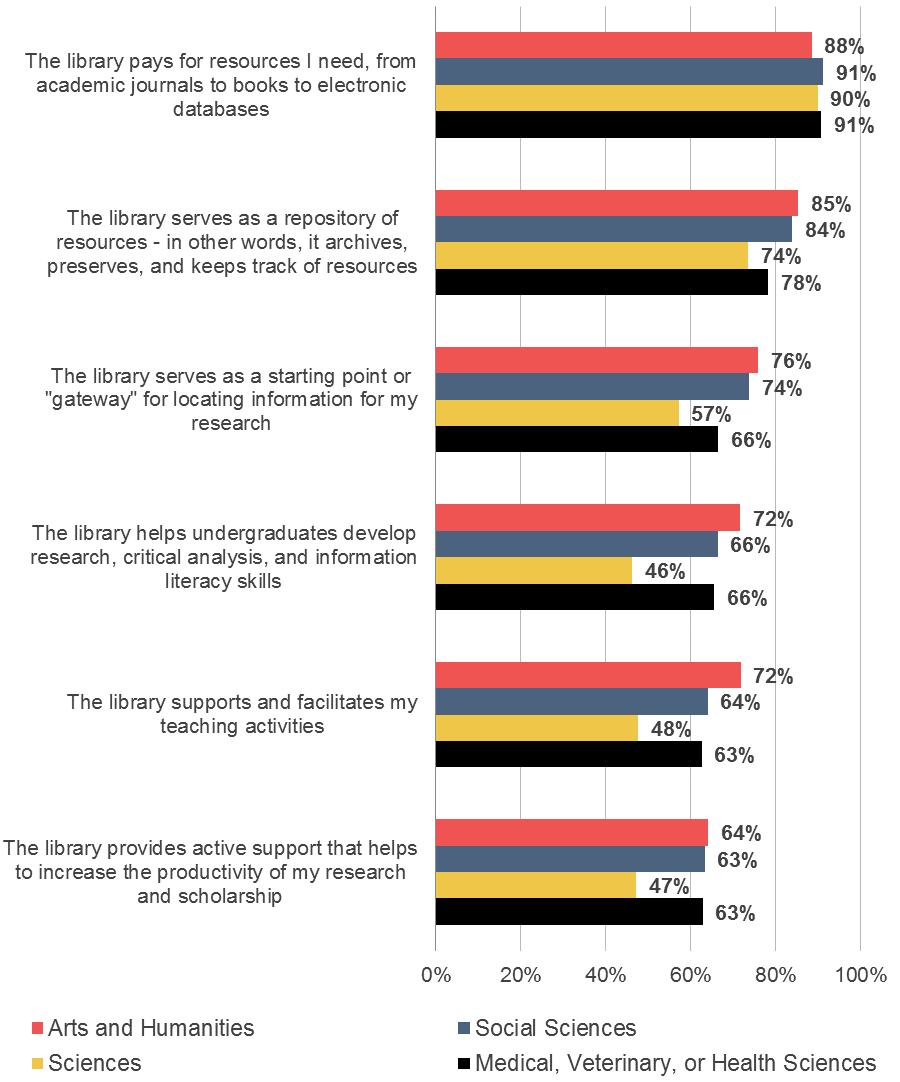
Figure 15: How important is it to you that your college or university library provides each of the functions below or serves in the capacity listed below? Please use the scales below to rate from 6 to 1, where 6 equals “Extremely important” and 1 equals “Not at all important.” Please select one answer for each item. Percent of respondents who indicated that each function is very important (5-6). (N= 3,915)
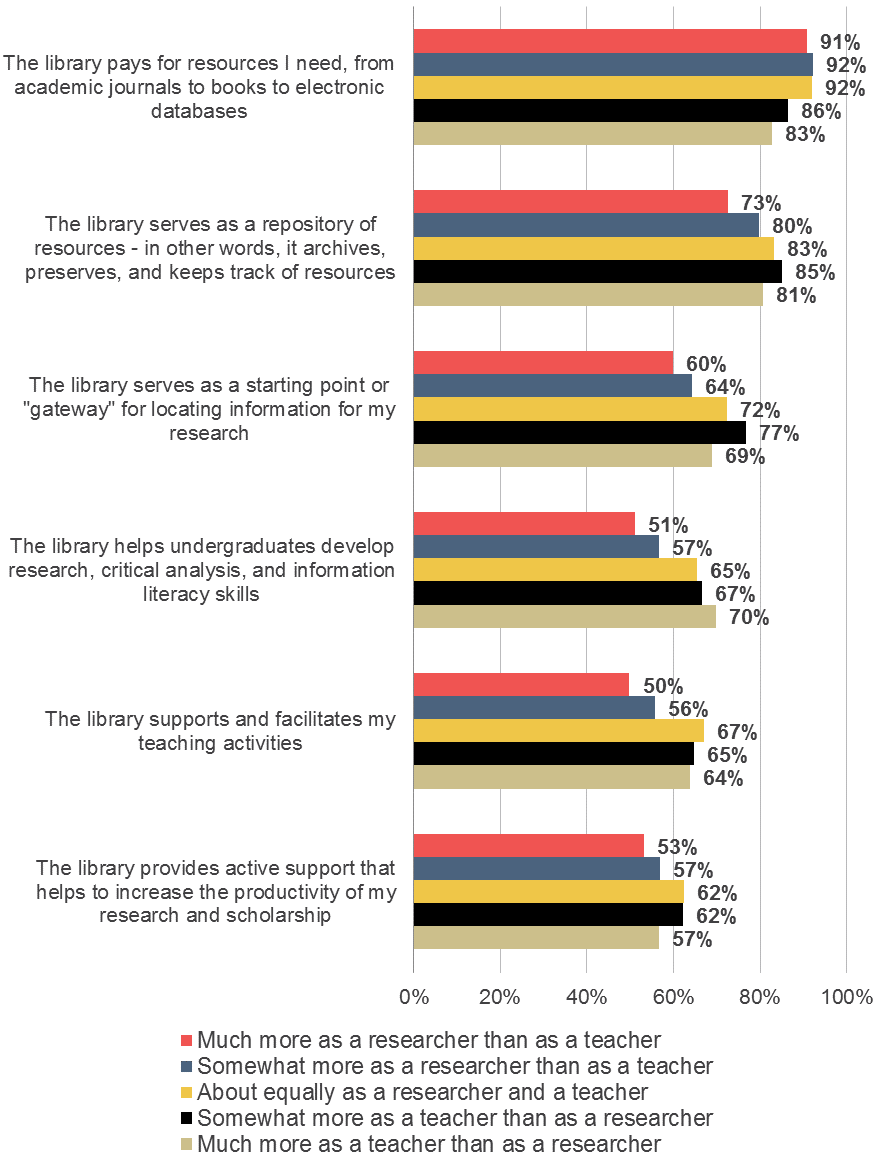
Figure 16a: How important is it to you that your college or university library provides each of the functions below or serves in the capacity listed below? Please use the scales below to rate from 6 to 1, where 6 equals “Extremely important” and 1 equals “Not at all important.” Please select one answer for each item. Percent of respondents who indicated that each function is very important (5-6). (N= 3,998)
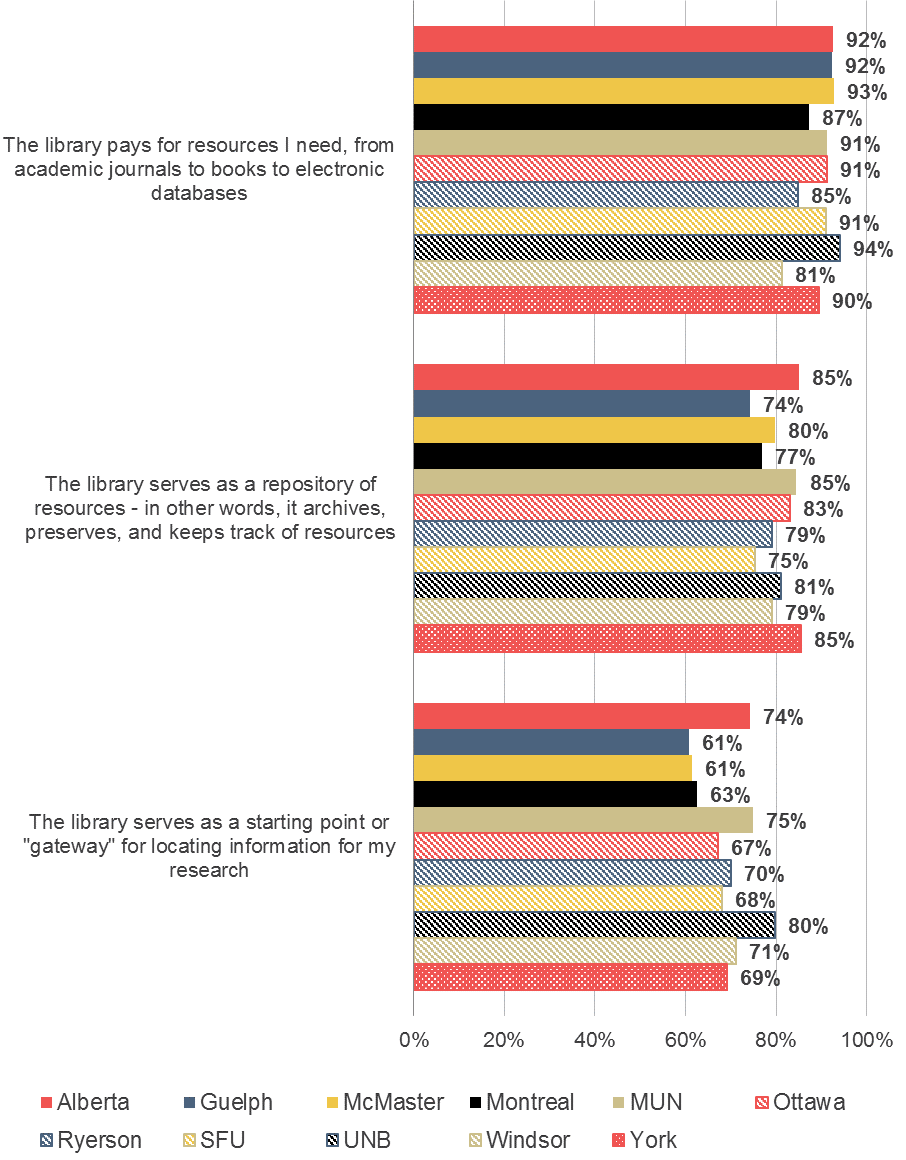
Figure 16b: How important is it to you that your college or university library provides each of the functions below or serves in the capacity listed below? Please use the scales below to rate from 6 to 1, where 6 equals “Extremely important” and 1 equals “Not at all important.” Please select one answer for each item. Percent of respondents who indicated that each function is very important (5-6). (N= 3,998)
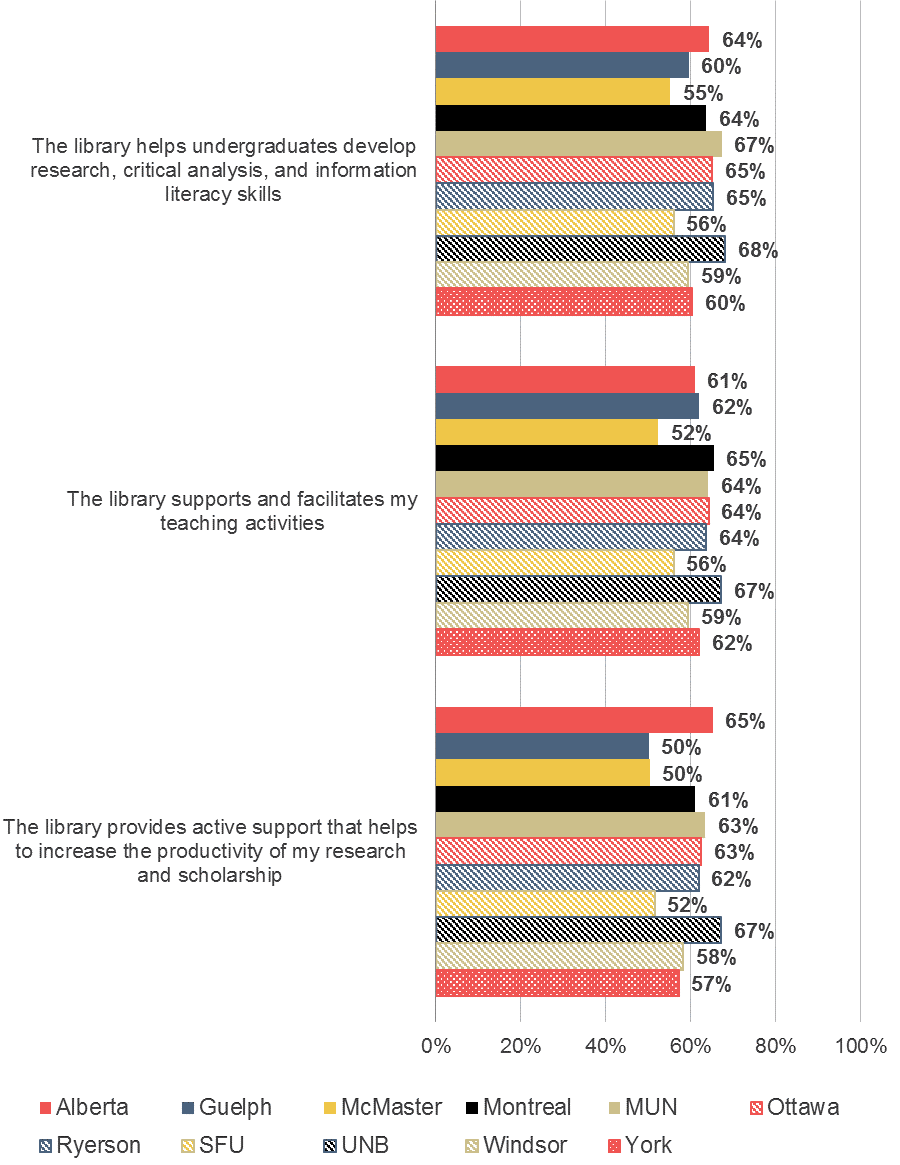
Figure 17: Please use the 10 to 1 scales below to indicate how well each statement below describes your point of view – a 10 equals “Extremely well” and a 1 equals “Not at all well.” You may pick any number on the scale. The higher the number, the better you think the statement describes your point of view. The lower the number, the less you think the statement describes your point of view. Percent of respondents who strongly agreed with each of the statements (8-10). (N= 3,450)[6]
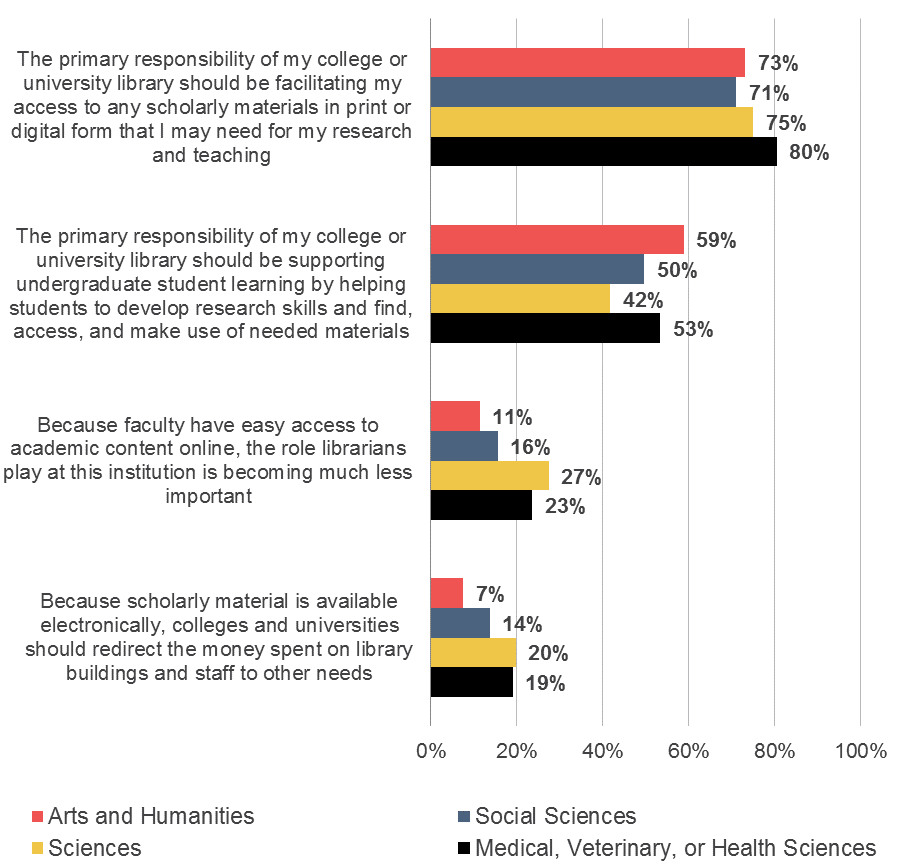
Figure 18: Please use the 10 to 1 scales below to indicate how well each statement below describes your point of view – a 10 equals “Extremely well” and a 1 equals “Not at all well.” You may pick any number on the scale. The higher the number, the better you think the statement describes your point of view. The lower the number, the less you think the statement describes your point of view. Percent of respondents who strongly agreed with each of the statements (8-10). (N= 3,455)[7]

Data preservation and management
How do faculty members use data and what services do they require?
Finally, respondents were asked about the ways in which they organize, manage, and preserve their data, media, or images for research (see Figures 19 through 26).
- Respondents in the arts and humanities are nearly equally as likely to build up collections of scientific, qualitative, quantitative, or primary source research data as they are to build up digital collections of image or media research data in the course of their research; respondents from other disciplines were more likely to collect the former. There were no discernable differences based on respondents’ years in the field.
- Humanists often assign greater levels of importance to various kinds of data, especially those collected by other researchers outside of their field. Additionally, for a number of types of data, respondents with fewer years in the field assigned greater levels of importance.
- Faculty members in the medical, veterinary, and health science fields, and those with fewer years in the field, often more highly value various features for managing or preserving their research data, media, or images. Overall, the feature that is most highly valued is the ability to update existing datasets with new data, media or images.
- When managing or preserving research data, respondents from differing disciplines and with varying years of experience in the field often value different sources of support for these processes. Overall, respondents rated freely available software and their college or university libraries as most highly valuable.
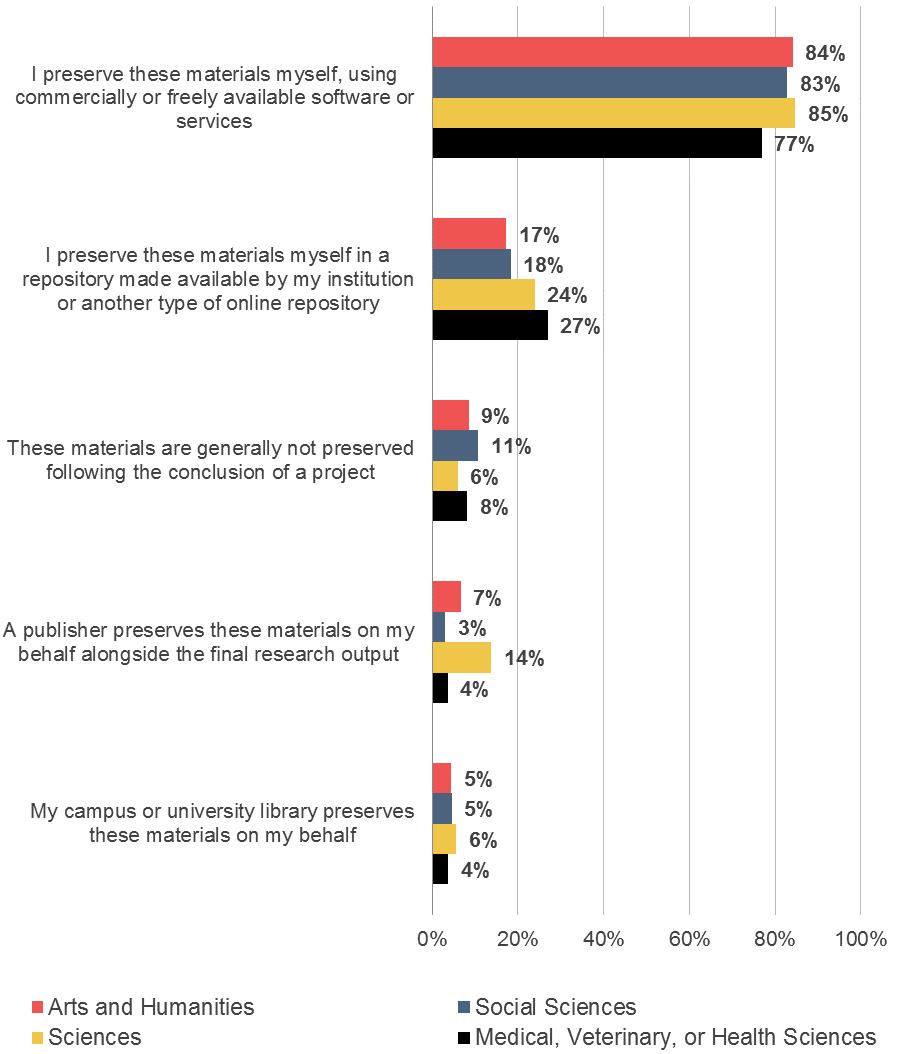
- Faculty members have a clear preference for self-reliance in preserving their research data following the conclusion of a project. Relative to colleagues in other disciplines, scientists are more likely to have a publisher preserve these data on their behalf alongside their final research output, and scientists and faculty members in medical, veterinary, or health sciences fields are more likely to preserve these materials themselves in a repository made available by their institution or another type of online repository.
Figure 19: Percent of respondents who indicated that they build up each of the following types of data.[8] (N= 3,917)
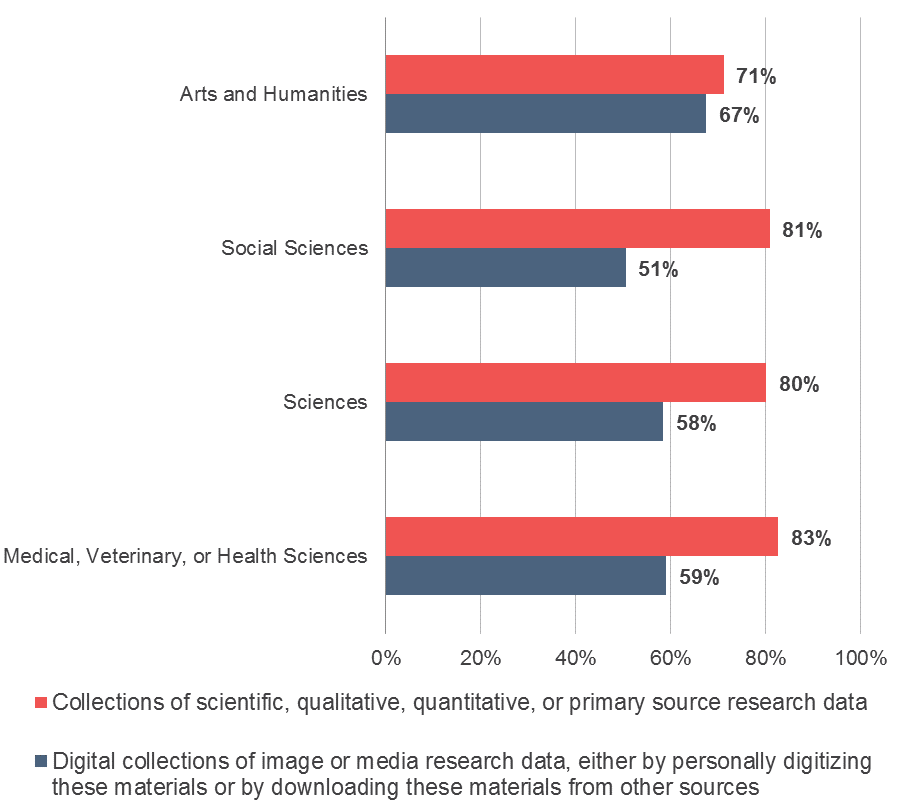
Figure 20: How important to your research are the following types of data? Use the scales below to rate from 10 to 1, where 10 equals “Extremely important” and 1 equals “Not at all important.” Please select one answer for each item. Percent of respondents who indicated that each of the following types of data are very important (8-10). (N= 3,170)
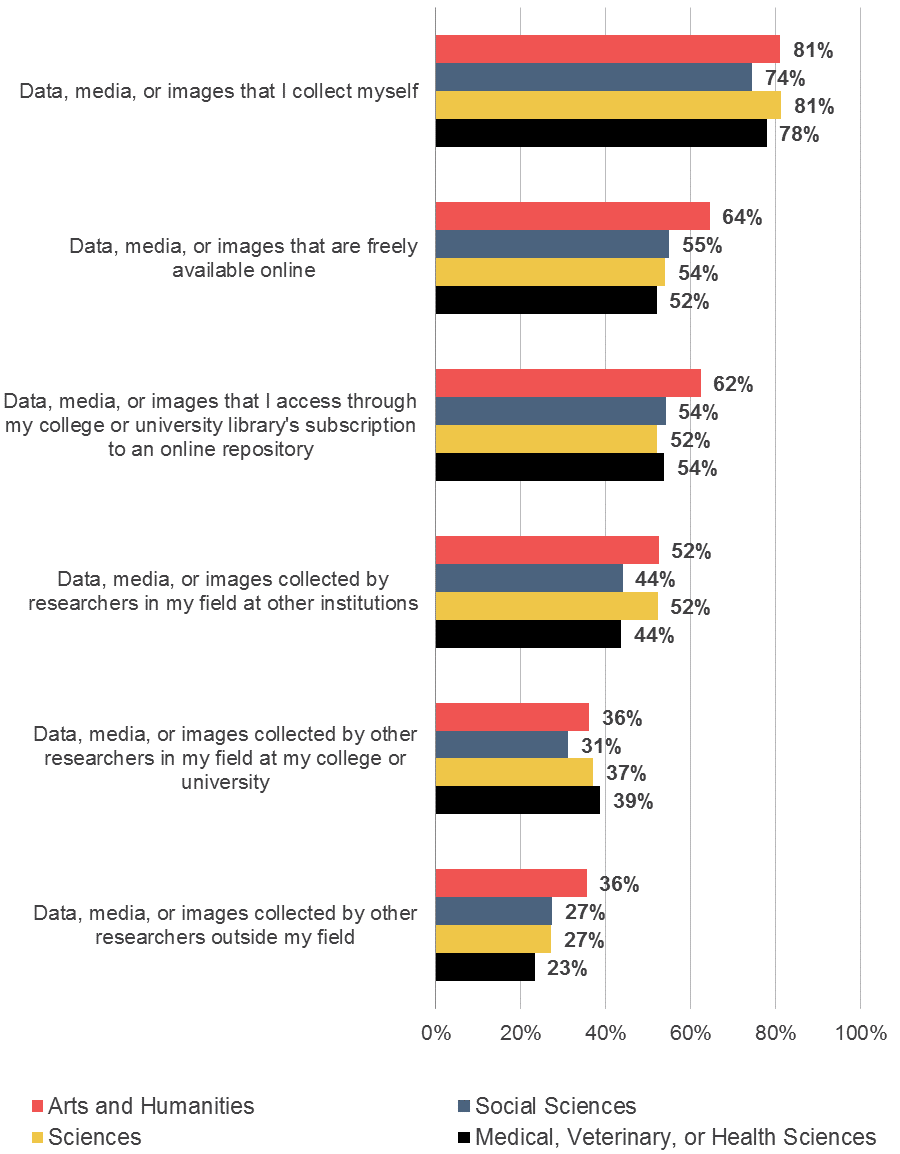
Figure 21: How important to your research are the following types of data? Use the scales below to rate from 10 to 1, where 10 equals “Extremely important” and 1 equals “Not at all important.” Please select one answer for each item. Percent of respondents by years in the field who indicated that each of the following types of data are very important (8-10). (N= 2,512)
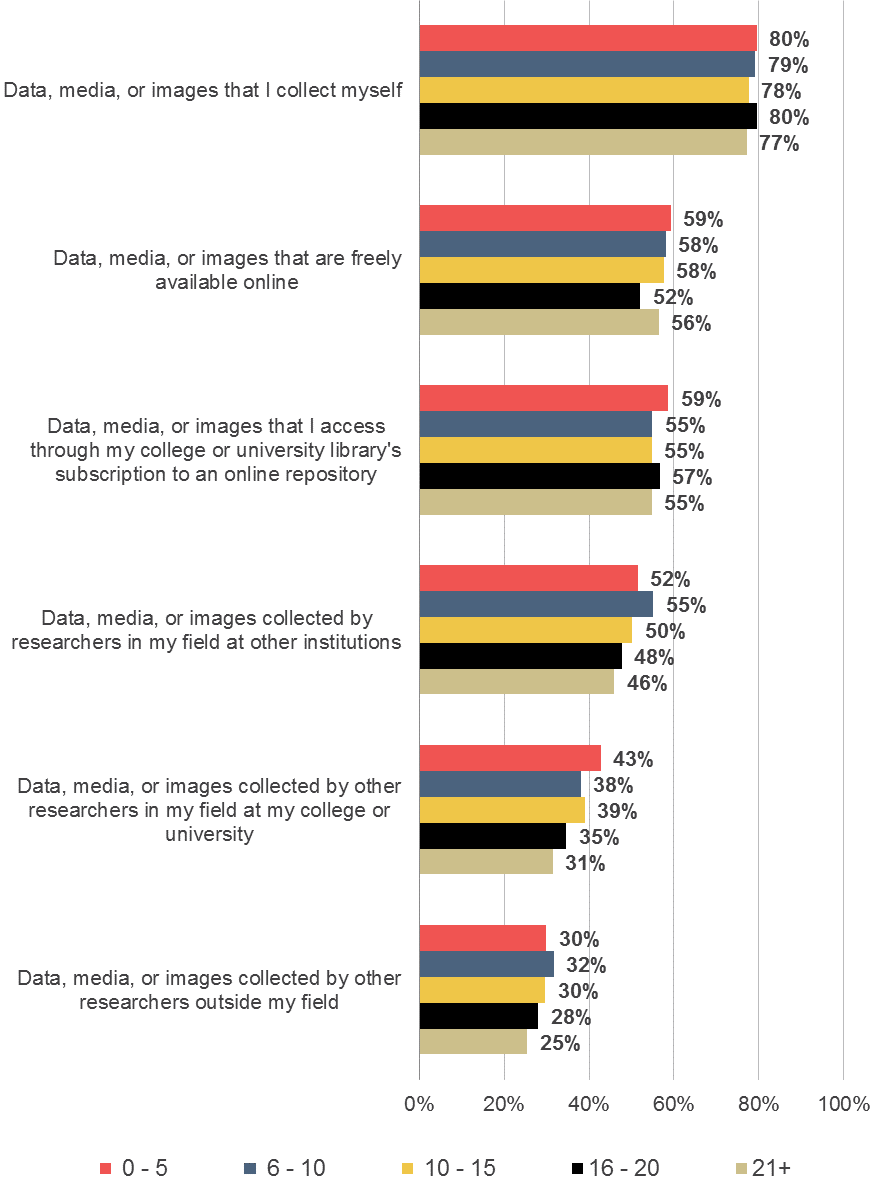
Figure 22: When you think about managing or preserving the research data, media, or images that you collect, how important are each of the following features or how important would each of the following features be? Use the scales below to rate each item 10 to 1, where 10 equals “Extremely important” and 1 equals “Not at all important.” Percent of respondents who indicated that each of the following features is very important (8-10). (N= 3,111)
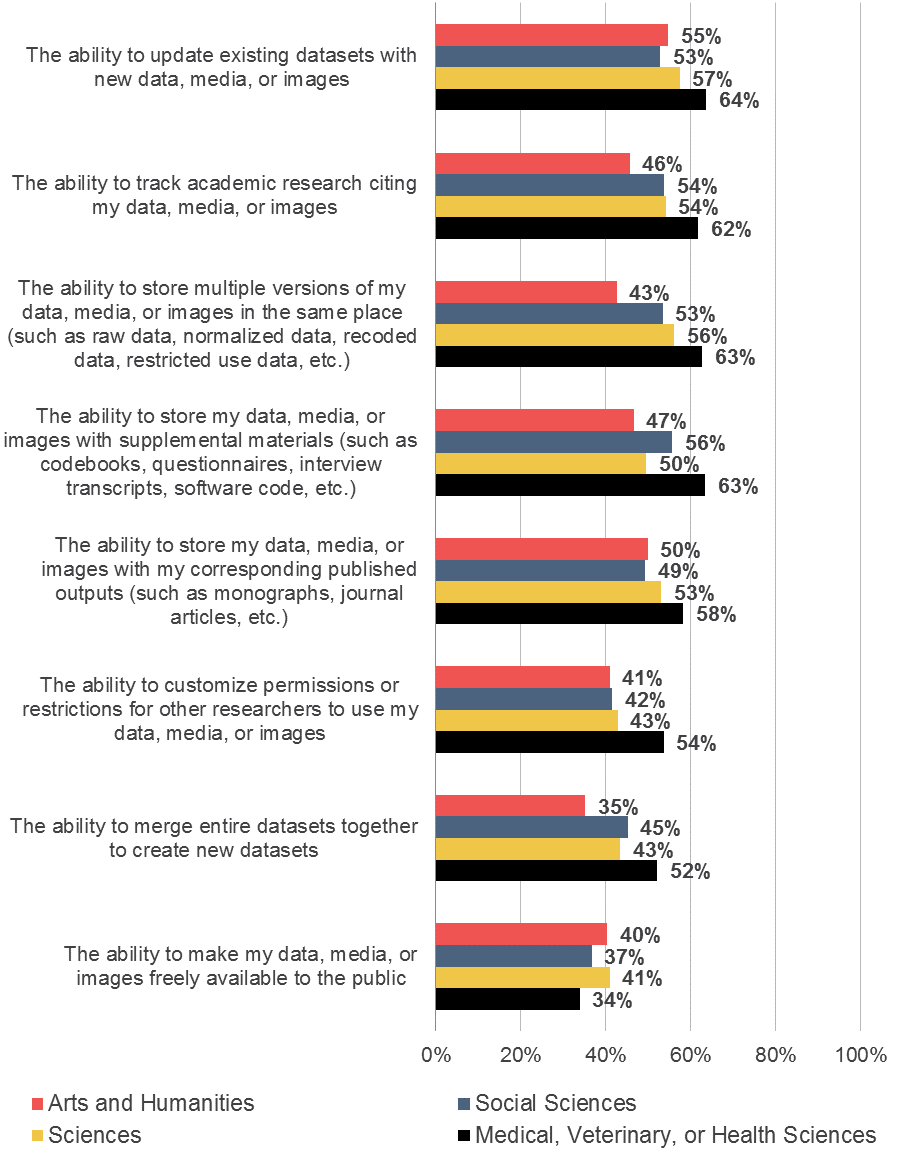
Figure 23: When you think about managing or preserving the research data, media, or images that you collect, how important are each of the following features or how important would each of the following features be? Use the scales below to rate each item 10 to 1, where 10 equals “Extremely important” and 1 equals “Not at all important.” Percent of respondents by years in the field who indicated that each of the following features is very important (8-10). (N= 2,465)
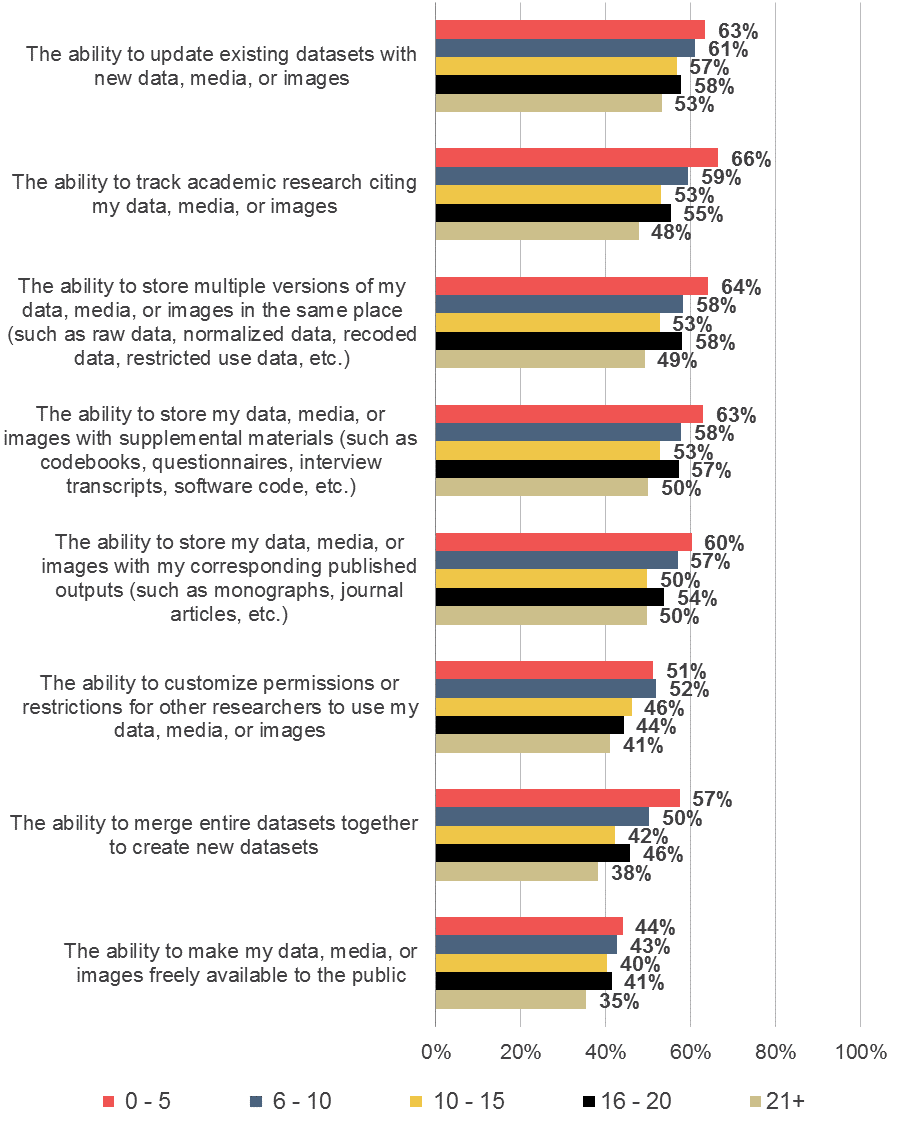
Figure 24: Please use the scale below to rate from 10 to 1 how valuable you would find each of the following possible sources of support for managing or preserving research data, media, or images or how valuable you do find each of the following sources of support for managing or preserving research data, media, or images, where 10 equals “Extremely valuable” and 1 equals “Not at all valuable.” Please select one answer for each item. Percent of respondents who indicated that each of the following sources of support is very valuable (8-10). (N= 3,084)
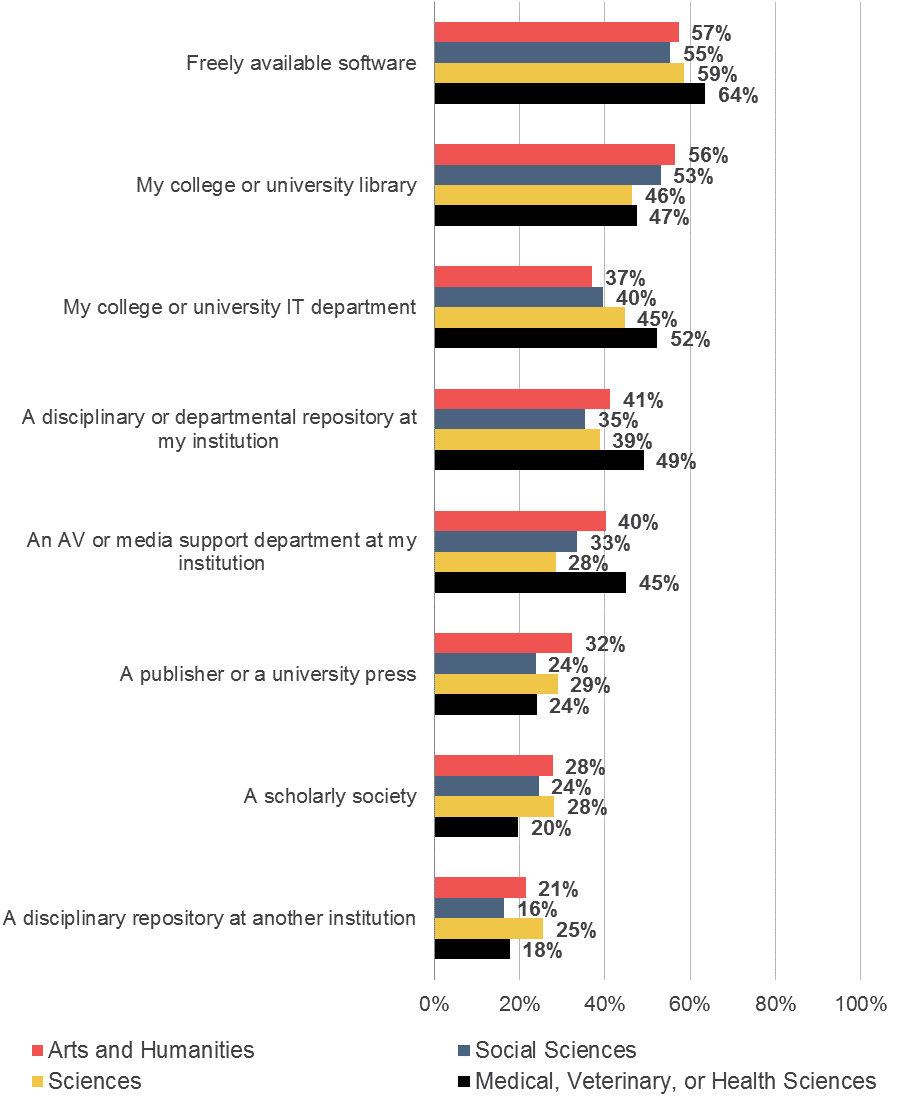
Figure 25: Please use the scale below to rate from 10 to 1 how valuable you would find each of the following possible sources of support for managing or preserving research data, media, or images or how valuable you do find each of the following sources of support for managing or preserving research data, media, or images, where 10 equals “Extremely valuable” and 1 equals “Not at all valuable.” Please select one answer for each item. Percent of respondents by years in the field who indicated that each of the following sources of support is very valuable (8-10). (N= 2,439)

Figure 26: If these collections or sets of research data are preserved following the conclusion of the projects, what methods are used to preserve them? Please select each method by which they are preserved or indicate that they are not preserved. Percent of respondents who indicated that each method is used.
(N= 3,085)
Reflections
The results from this analysis suggest these key findings and opportunities for future strategic direction:
- Compared with faculty members in the United States and the United Kingdom, respondents from CARL institutions report being more highly dependent on their college or university library.[9] Across these groups of respondents, we see that the role of the library in paying for needed resources is consistently rated as highly important. These findings should serve as important context for libraries seeking to transition to alternative models for scholarly communication.
- Teachers and researchers vary in the value they assign to different aspects of the library. Compared to others, respondents who identified more strongly as teachers value more highly the role of the library in helping students develop research, critical analysis, and information literacy skills; value more highly the role of the library in helping students to find, access, and make use of needed material; and are less likely to agree that the role of the library and librarians are becoming less important in light of increased access to scholarly content online. Since many faculty members identify more strongly as researchers or as teachers, it may be worth considering whether it is valuable in some cases to differentiate service provision to them on this basis.
- Faculty members in the arts and humanities highly depend on the library in a number of ways, as compared to respondents in other fields. Arts and humanities scholars are more likely to begin their research with the library website or catalog, more highly value support from the library in managing or preserving research data, and more likely to find that interactions with librarians help students to succeed in their courses. Thus there are also some services that may be differentiated on the basis of disciplinary affiliation.
- While respondents in science fields rated the various functions of the library as less highly important than their peers, these respondents are relatively more interested in integrating various digital research activities and methods and rated these activities and methods as highly important. Respondents with fewer years in the field are also more highly interested in integrating these activities and methods, indicating an opportunity for the library to partner with and offer targeted services to these subgroups of faculty members to effectively support their research needs. If libraries are to be more than just service providers to the humanistic fields, it is vital to identify new ways to re-engage scientists.
- Faculty members who primarily teach students at a distance are more likely to agree that their students have poor research skills, but are also more likely to agree that librarians help students to succeed in their courses. This may suggest an opportunity for the library to more deeply engage with students who are enrolled in hybrid or online courses to improve these students’ research skills.
- I would like to thank Katherine McColgan, CARL’s Manager of Administration and Programs, for helping to guide this collaboration between Ithaka S+R and the CARL member institutions. ↑
- See Christine Wolff, Alisa B. Rod, and Roger C. Schonfeld, “Ithaka S+R US Faculty Survey 2015,” Ithaka S+R, April 4, 2016, http://dx.doi.org/10.18665/sr.277685, and Roger C. Schonfeld and Ross Housewright, “US Faculty Survey 2012,” Ithaka S+R, April 8, 2013, http://dx.doi.org/10.18665/sr.22502. ↑
- Ithaka S+R did not distribute invitations to this survey. ↑
- Ithaka S+R did not distribute invitations to this survey. ↑
- All institutions included the demographic question on discipline except for Simon Fraser University, where a mapping was developed based on respondents’ departments. All institutions included the demographic question on number of years in the field except for Guelph and Ryerson. Respondents from these institutions are not included in analysis based on years in the field. ↑
- This figure does not include responses from Ryerson University. ↑
- This figure does not include responses from Ryerson University. ↑
- Responses included in this graph include those for the following questions:“In the course of your research, you may build up collections of scientific, qualitative, quantitative, or primary source research data. Do you accumulate any of these types of data in your research? Please select one answer.”“In the course of your research, you may build up digital collections of image or media research data, either by personally digitizing these materials or by downloading these materials from other sources. Do you accumulate any of these types of data in your research? Please select one answer.” ↑
- Sixty percent of respondents from CARL institutions indicated that they were highly dependent on the library as compared to 46% of respondents in Doctoral Universities in the United States and 45% of respondents from RLUK institutions in the United Kingdom. ↑
Attribution/NonCommercial 4.0 International License. To view a copy of the license, please see http://creativecommons.org/licenses/by-nc/4.0/.