Higher Ed Insights: Results of the Spring 2016 Survey
Introduction
In fall 2015, Ithaka S+R invited a select group of higher education administrators and experts to join a panel of advisors. One activity of the panel, which currently consists of 111 members with diverse backgrounds and perspectives, is to take part in semi-annual surveys on issues of national importance in higher education. The first of these surveys was administered in the fall of 2015.[1] Ithaka S+R analyzes and publishes the results of these surveys to inform the broader higher education community about the panel’s views on current debates, initiatives, and challenges. The results of the Higher Ed Insights surveys also help guide Ithaka S+R’s research agenda.
This report presents findings from the Spring 2016 survey, administered between June 15 and July 11, 2016. The survey asked respondents to rate a list of obstacles to changes at US higher education institutions that would promote student success and a list of potential solutions to those obstacles. Survey questions focused specifically on obstacles and solutions in three key areas: motivation and culture, funding and resources, and institutional structures and practices. The lists of obstacles and solutions drew on panel members’ open-ended responses to the Fall 2015 survey, supplemented with salient issues from current events and the research literature in higher education. Respondents were asked to think about higher education institutions in the US as a whole while completing the survey, recognizing that obstacles and solutions may have different effects for different types of institutions.[2] A small number of respondents reported struggling with this prompt and indicated in comments that they chose instead to assess survey items through the lens of a particular type of institution.
The narrative section of the report describes Ithaka S+R’s analysis of the survey results. Aggregate responses to all close-ended survey items are provided in the Appendix.
Summary of Findings
Although survey respondents come from a range of institutional contexts, there was broad agreement that insufficient state funding of public institutions of higher education is the most significant obstacle to improving student success. As several respondents noted in open-ended comments, state disinvestment in public institutions has both raised costs for the majority of students and limited those institutions’ capacity to meet students’ needs.[3]
Interestingly, state funding was the only public-policy obstacle to improving student success that respondents rated among the most significant. Aside from that item, the obstacles respondents identified as most significant all relate to institutional actors, policies, and practices. In particular, they singled out as significant obstacles (i) incentives for faculty that deemphasize student success and teaching, (ii) administrative silos, and (iii) faculty resistance to change. Relatedly, when asked which actors would need to change their behavior the most to improve student success, respondents ranked senior leaders of higher education institutions first, followed by faculty.
The emphasis on institutional factors is further reinforced by respondents’ favored solutions to student success obstacles. The two solutions rated most promising were (i) rewarding faculty for experimentation and innovation in teaching and learning and (ii) promoting research on bringing student success initiatives to scale. The former directly addresses the concern about faculty incentives, while the latter focuses on improving knowledge about the process of changing an institution’s culture in the face of obstacles such as administrative silos and faculty resistance.
A second theme of the favored solutions was collaboration across institutions. Specifically, respondents viewed as highly promising (i) increasing collaboration among PreK-12 systems, community colleges, and four-year colleges to improve articulation and (ii) developing a PreK-20 unit record system. Institutional leaders would have key roles to play in those efforts, but as several respondents pointed out in open-ended responses, both would benefit from state- and federal-government support and coordination.
[The proposed solutions] require institutional leadership and regulatory rewards and much, much needed public sharing of data, the implementation of a unit record, and the engagement of the entire educational pipeline from cradle to career, but that too takes legislation and educational leadership at the very top.
President – Public College or University System
While there was general agreement across respondents on the most significant obstacles and most promising solutions, there are some important distinctions between respondents from different institutional contexts. Respondents affiliated with public institutions of higher education generally viewed the obstacles presented in the survey as more significant impediments to change than respondents affiliated with private not-for-profit institutions. This pattern is most pronounced with respect to obstacles pertaining to institutional administrators and administrative structures, such as (i) frequent turnover among administrators, (ii) the presence of administrative silos, and (iii) a lack of strategic change management capacity among institutional leaders.
One of the goals of the survey is to inform priorities for further research, by Ithaka S+R and others, and the findings point to several important topics for investigation and solution design. Faculty incentives featured prominently in the responses, suggesting several promising avenues of research, such as (i) identifying areas of misalignment in contexts where incentives are not oriented to student success, (ii) unpacking the process by which exemplary institutions have successfully redesigned faculty incentives, and (iii) designing and testing new incentive structures that promote innovative and success-oriented teaching are all promising avenues of research. Similarly, the survey findings support the value of better evidence and guidance on how to bring student success initiatives to scale, and the process of change management at higher education institutions. Ithaka S+R has delved into these topics with our case studies in educational transformation, and we have begun to operationalize models for institutional change with our Educational Transformation Assessment;[4] the survey’s findings suggest we should continue those efforts and focus on developing concrete, actionable resources for institutional leaders.
Detailed Survey Findings
Panel and Respondents
The Higher Ed Insights panel consists of 111 higher education experts, who were invited to join based on their expertise in the field and their affiliation with innovative or influential institutions. A total of 85 panel members completed the Spring 2016 survey (77% of the panel).
Respondents’ Affiliations
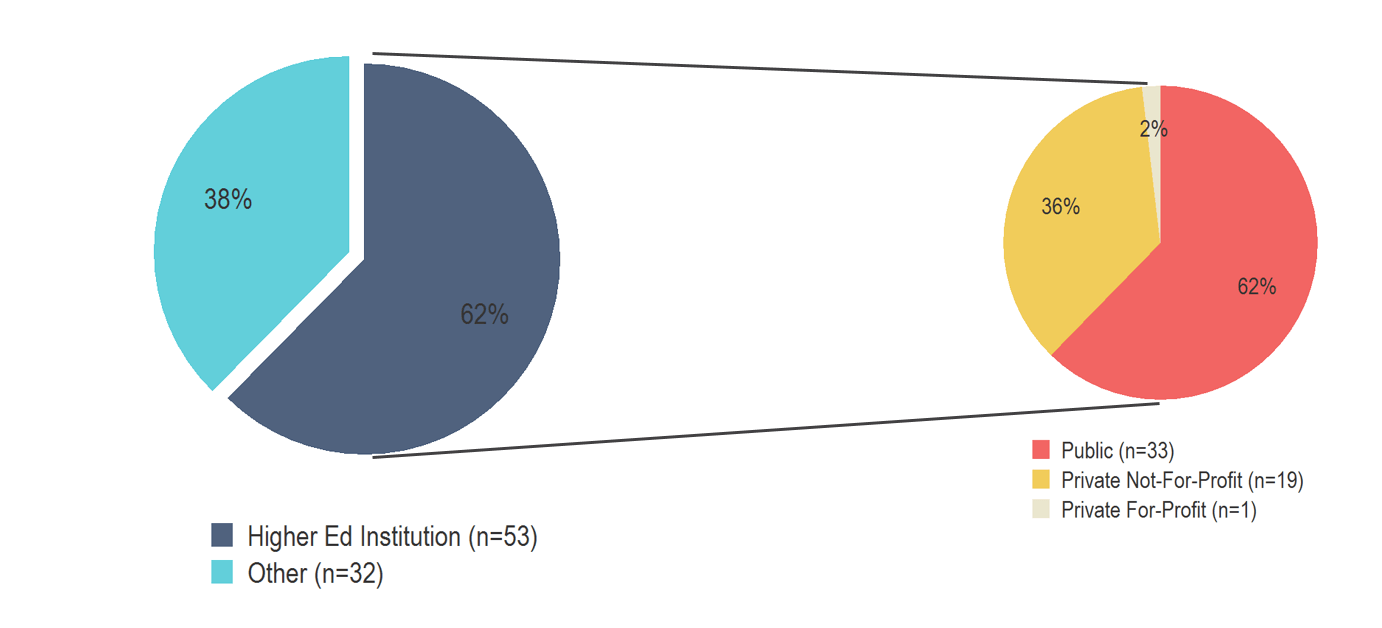
The majority of respondents are affiliated primarily with institutions of higher education (62%). The remaining 38 percent of respondents are affiliated with other types of institutions, such as research institutes or think tanks, member associations, and philanthropic foundations. Of those respondents affiliated with institutions of higher education, most are affiliated with public institutions (62%), slightly over a third are affiliated with private not-for-profit four-year universities and colleges (36%), and one respondent (2%) is affiliated with a for-profit college. Respondents affiliated with public institutions represent public four-year universities and colleges (n=21), community colleges (n=7) and public college or university systems (n=5).
Figure 1.
Open figure in new window
Respondents affiliated with higher education institutions (n=53) represent 33 distinct institutions that vary widely in size and student composition. For instance, the size of the undergraduate student population at represented institutions ranges from less than 500 to more than 170,000, with an average of approximately 23,000 students (Median=18,095 students). Similarly, the percentage of Pell-eligible students enrolled at these institutions ranges from 11 to 67 percent, averaging 30 percent (Median=26%).
Respondents’ Roles
Many respondents identified their roles as chief executives, including chief executive officers, presidents, or chancellors (38%). Additionally, five percent held positions as provosts, chief academic officers, or vice presidents. Other reported roles include other administrative positions such as chief innovation officers (25%); researchers (21%); faculty members (19%); and policymakers, advocates, grant makers/program officers, or consultants (14%). Most of the 53 respondents from higher education institutions held administrative positions (n=40; 75%) and are referred to throughout the report as higher education administrators.
Respondents’ Experience
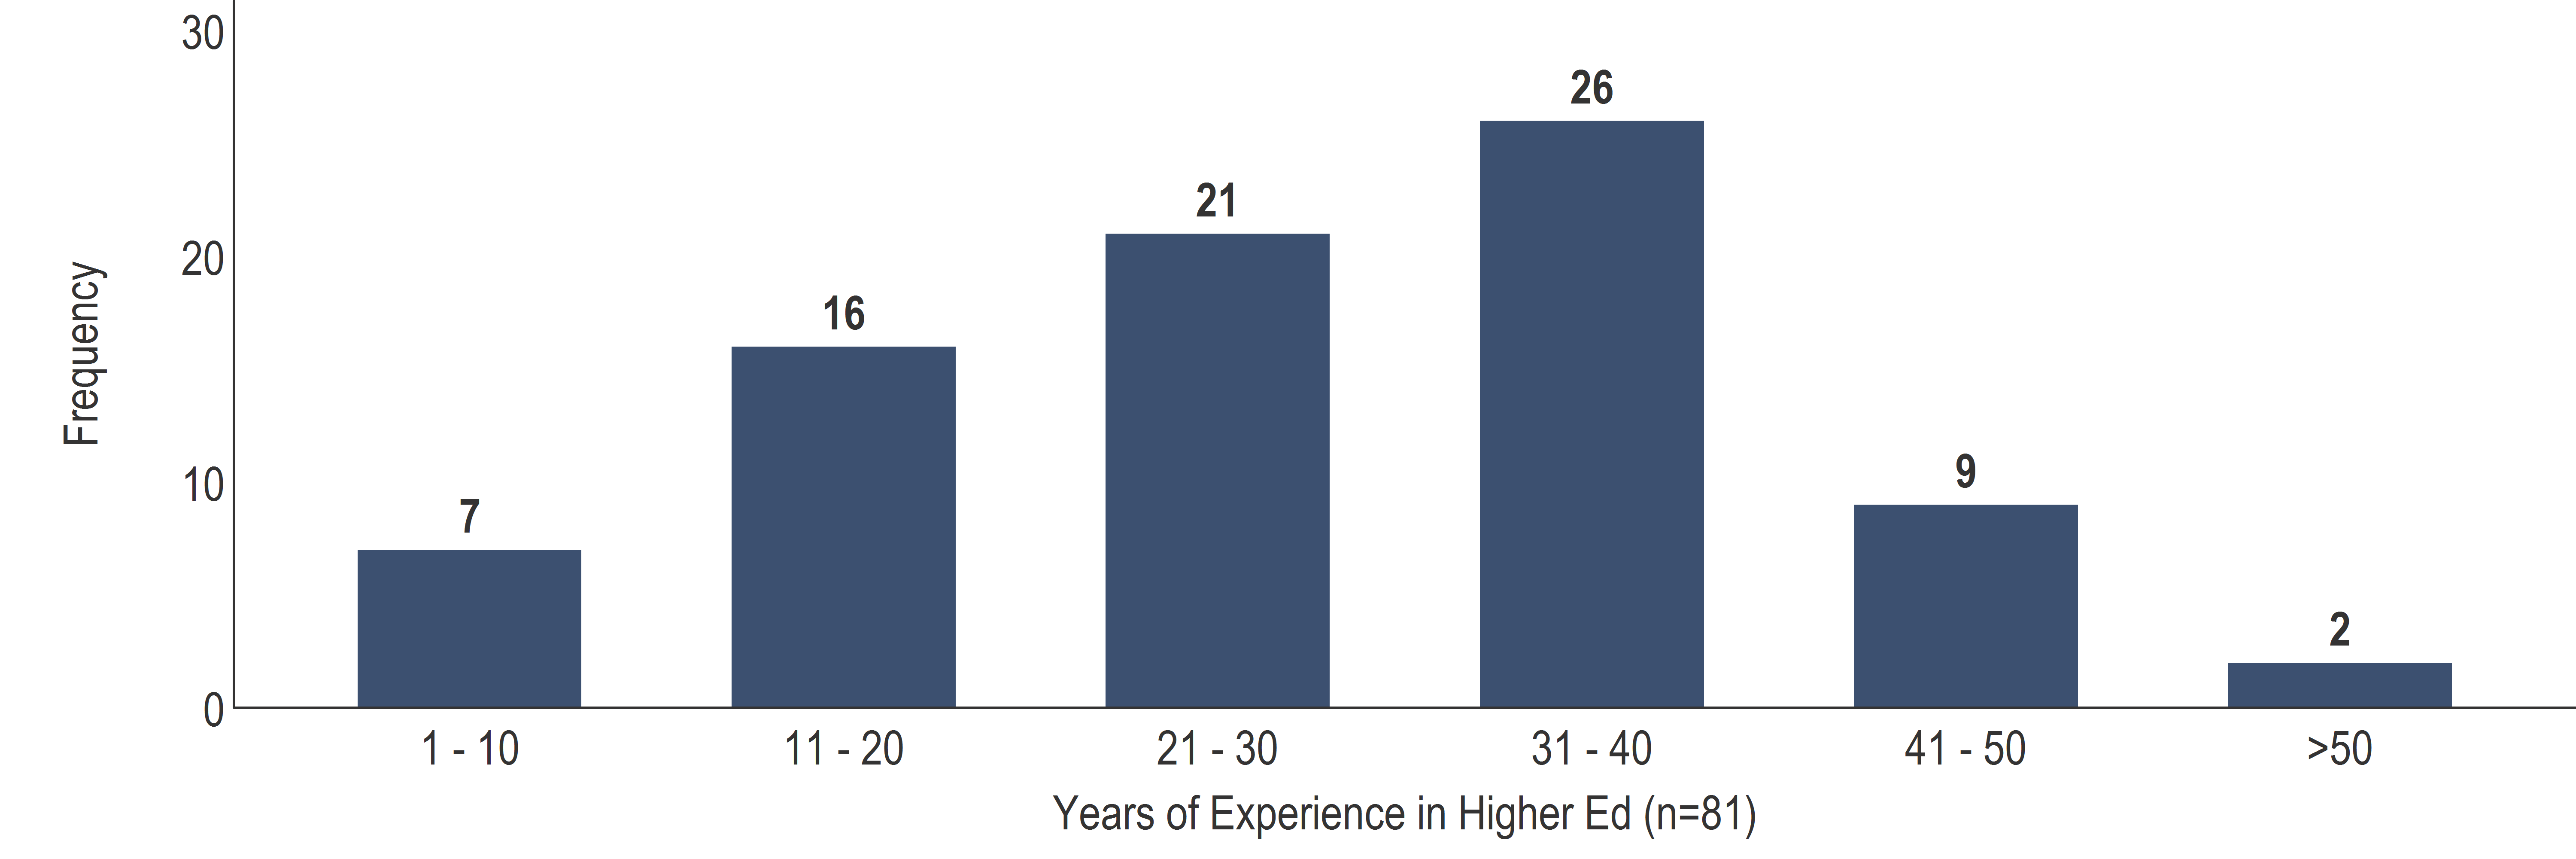
Respondents were asked to report the number of years they have been professionally involved in higher education, including all experiences that have contributed to their current expertise in the field (figure 2). The 81 respondents who answered this question reported an average of 29 years of experience with a range from eight to 52 years.
Figure 2.
Open figure in new window
On average, higher education administrators have approximately five more years of experience in the field (M=31.32; SD=8.84; n=38) than other respondents (M=26.77; SD=12.88; n=43; p=0.07).
Obstacles to Student Success
Respondents were presented with a list of 24 potential obstacles pertaining to three key areas: motivation and culture, funding and resources, and institutional structures (all obstacles and categories are listed in the Appendix). They were asked to rate the extent to which each obstacle is a significant impediment to institutions of higher education making changes to improve student success, on a 1-to-7 scale, with 1 indicating “not a significant obstacle” and 7 indicating “extremely significant obstacle.” Survey participants also had the option of selecting “disagree with statement” to indicate that they considered a statement to be altogether incorrect or untrue, and therefore could not rate the extent of its significance as an obstacle.[5]
Finally, for each section, respondents were asked to select up to three of the listed obstacles they believe are the most urgent to address at the present time, considering both the feasibility of addressing the obstacle and the likelihood it will promote institutional change for student success. Because the obstacles most frequently selected as “most urgent” were the same as those with the highest significance ratings in each section, we do not discuss those results in the analysis; they are, however, reported in the Appendix.
Motivation and Culture Obstacles
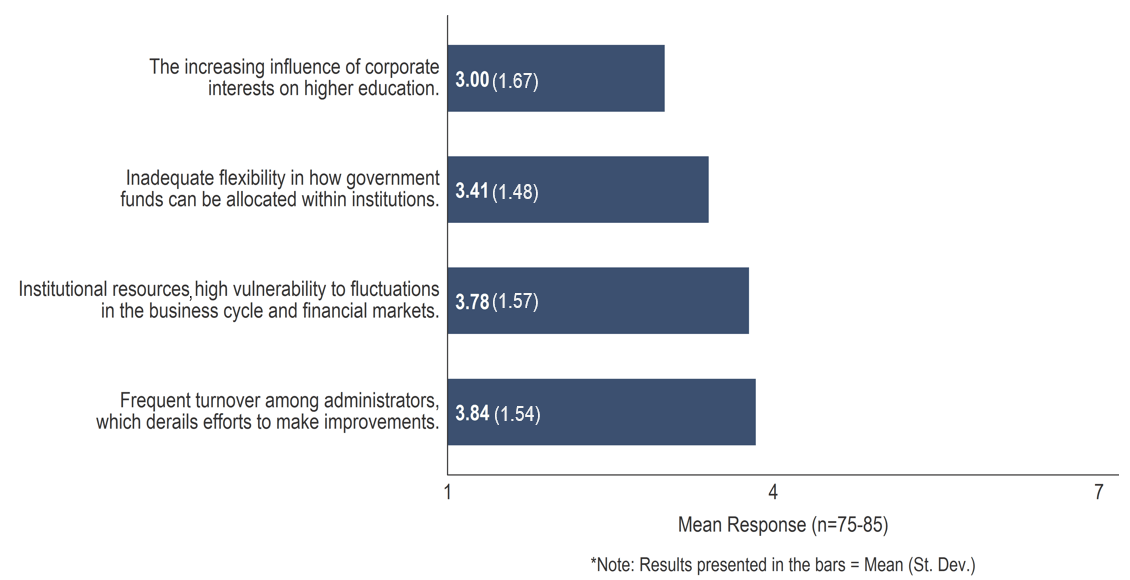
Unlike statements in the other categories, none of the eight obstacles pertaining to motivation and culture received an average rating above 5 (figure 3). Of the eight, respondents perceived faculty resistance or aversion to change as the most significant obstacle to improving student success. Only 16 percent of respondents rated the item below a 4, while a vast majority (84%) rated it as a 4 or above. None of the survey participants disagreed with the statement itself. One respondent, an administrator at a community college, gave this obstacle a high rating and elaborated: “Faculty aversion to change often stems from distrust that could be alleviated by administrators working with faculty and staff in an open but clear change agenda.”
The second most significant obstacle, according to respondents, is administrators’ failure to effectively use rigorous evidence to select or design student success programs and strategies. Less than a quarter of respondents (21%) rated the item below a 4, while the vast majority (79%) rated it as a 4 or above. Five survey participants (6%) disagreed with this statement and did not rate it. One participant, a faculty member at a private not-for-profit research university, disagreed with the statement because “[f]aculty, not administration, are more likely to disregard data or dislike evidence-based instruction.”
Figure 3.

Open figure in new window
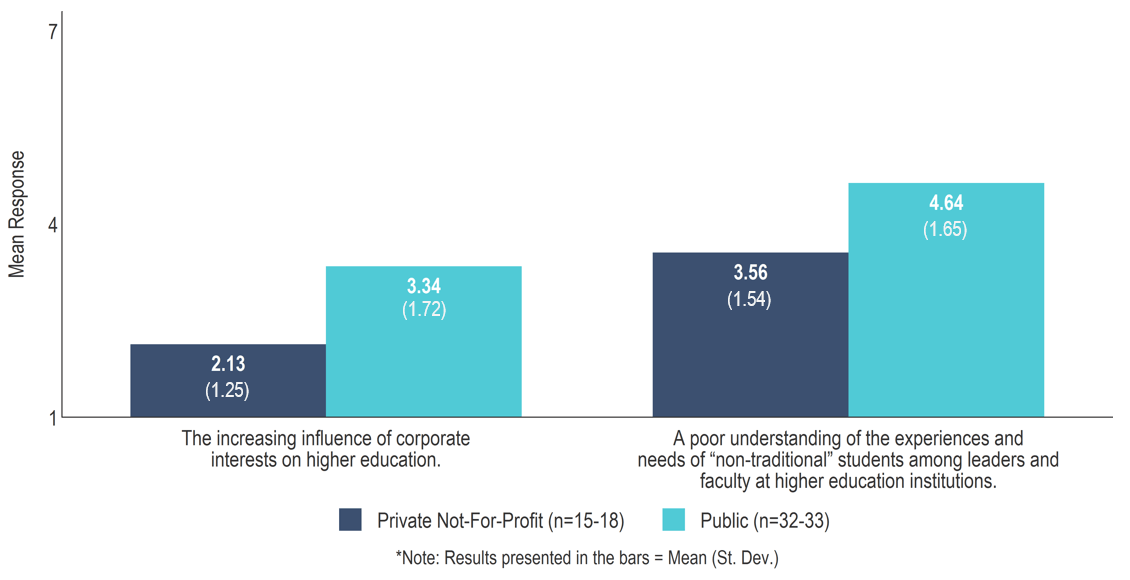
Respondents rated the increasing influence of corporate interests on higher education as the least significant impediment to improving student success. Eleven percent of survey participants disagreed with the statement altogether, and only 20 percent rated it as a 5 or above. Interestingly, respondents affiliated with public institutions, while still ranking this obstacle at the bottom in terms of significance, rated this obstacle as more significant than their counterparts affiliated with private not-for-profit institutions did (p=0.02; figure 4). In fact, nine of the 15 respondents who rated the item as a 5 or above are affiliated with public institutions of higher education. One such respondent, an administrator at a public university, clarified that “[i]t is not corporate interest, but a corporate mindset focused on efficiency over education.”
Another distinction between these groups is that respondents affiliated with public institutions rated leaders’ and faculty members’ poor understanding of the experiences and needs of “non-traditional” students as a more significant obstacle than did those affiliated with private not-for-profit institutions (p=0.03; figure 4).
Figure 4.
Open figure in new window
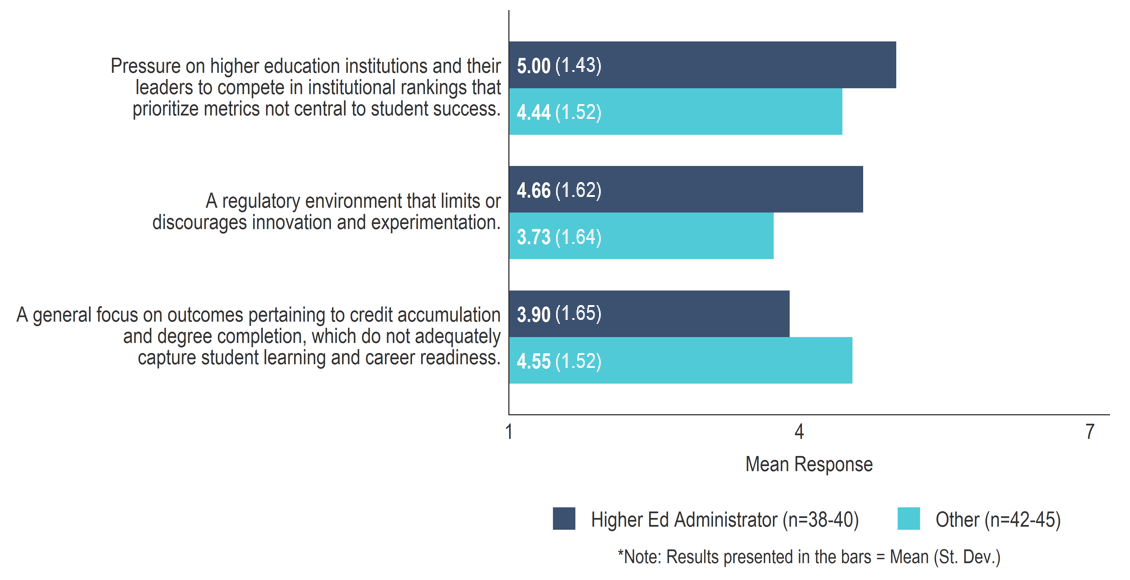
Higher education administrators differed from other respondents in their ratings of some motivation and culture obstacles (figure 5). Specifically, these administrators rated the pressure to compete in institutional rankings and a regulatory environment that limits innovation as more significant obstacles to institutional change than other respondents (p =0.09 and 0.01, respectively). Higher education administrators rated an excessive focus on credit accumulation and degree completion as a less significant obstacle than did other respondents (p =0.07).
Figure 5.
Open figure in new window
Finally, it is worth noting that although respondents rated “a poor understanding of the experiences and needs of ‘non-traditional’ students among institutional leaders and faculty” around the midpoint of the scale on average, almost all respondents affiliated with individual community colleges (n=6; 86%) rated this obstacle as a 5 or above (compared with only 45 percent of other respondents).
Funding and Resources Obstacles
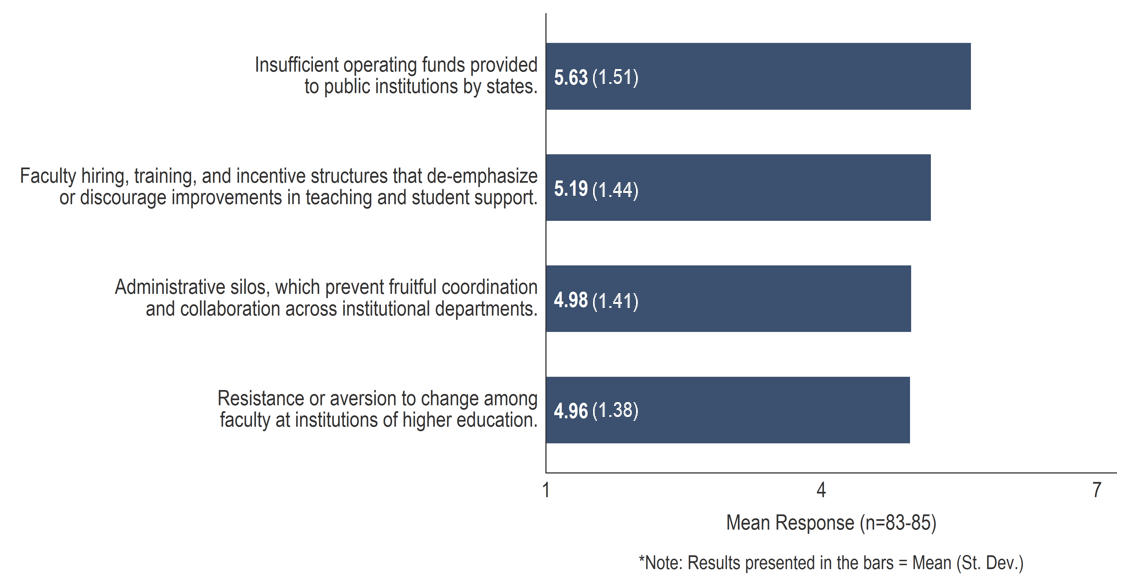
Respondents were presented with eight obstacles pertaining to institutional funding and resources (figure 6). They rated “insufficient operating funds provided to public institutions by states” as the most significant obstacle to institutional change for student success in this category. Two survey participants disagreed with the statement; 92 percent of respondents rated it as a 4 or above and about two thirds (67%) gave it a rating of 6 or 7.
Figure 6.
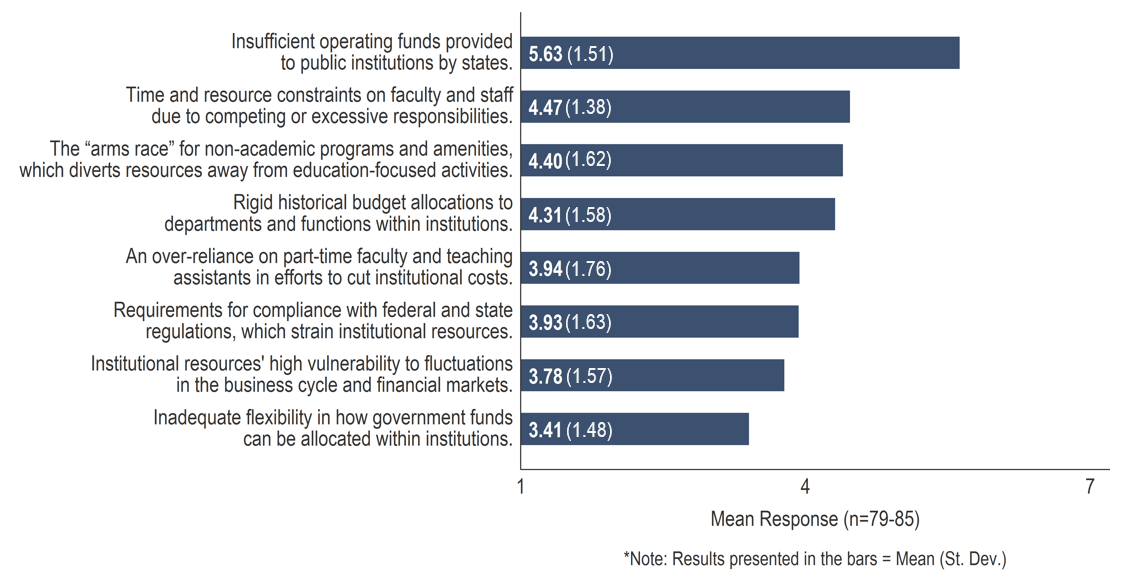
Open figure in new window
Respondents rated limits on how government funds can be allocated and vulnerability of institutional resources to fluctuations in financial markets as the least significant obstacles.
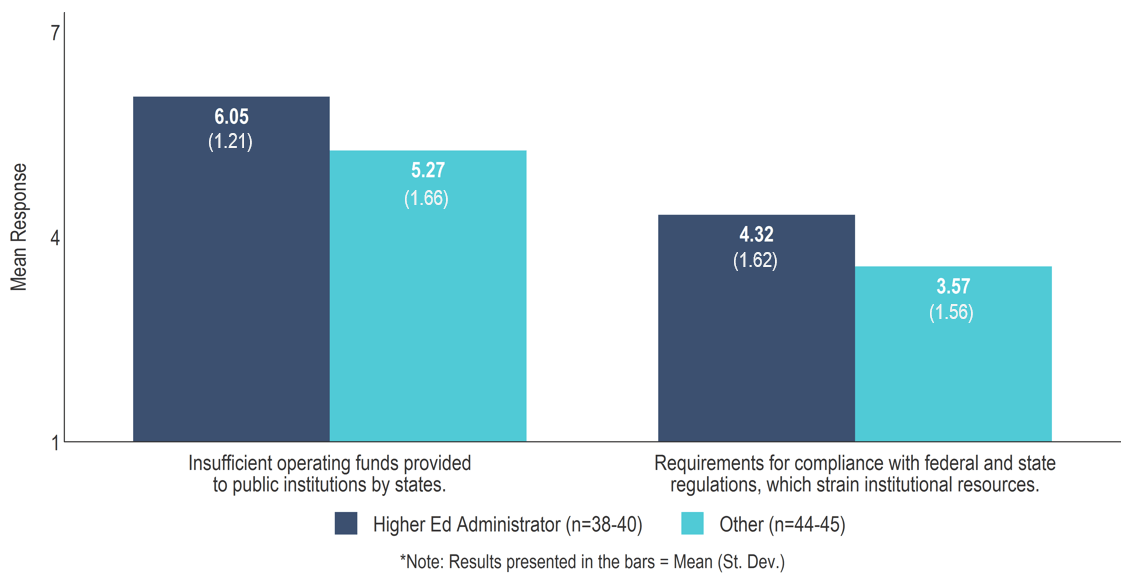
While responses in this category were generally consistent regardless of a respondent’s affiliation or role, a few instances of heterogeneity stand out (figure 7). First, while all respondents rated insufficient state operating funds for public institutions as a highly significant obstacle, higher education administrators gave it a higher average rating than other respondents (p=0.02). Interestingly, there was no difference in rating on this item between those affiliated with public institutions and those affiliated with private not-for-profit institutions. Higher education administrators also rated compliance with federal and state regulations as a more significant financial obstacle than other respondents (p=0.03).
Figure 7.
Open figure in new window
Finally, six of seven survey participants who identified as community college affiliates rated institutions’ over-reliance on part-time faculty and teaching assistants at 5 or above (one participant disagreed with the statement), compared to 45% of the other respondents. While our sample of community college affiliates is too small to reliably compare their responses to affiliates of other types of institutions, we would conjecture that funding obstacles are a particular challenge for those institutions, especially given the make-up of their student body. As one respondent affiliated with a philanthropic foundation noted: “In effect, we’ve charged the least well-resourced institutions (community colleges) to educate the most underserved students.”
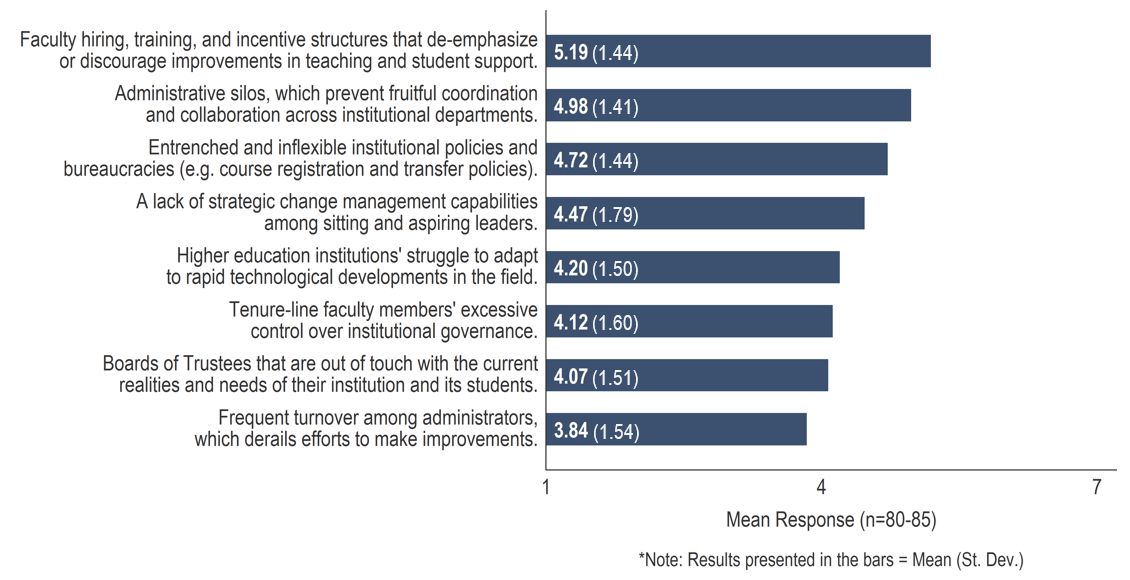
Institutional Structures and Practices
The third category of obstacles focused on institutional structures and practices. Respondents identified institutional practices pertaining to hiring, training, and incentivizing faculty as the most significant structural obstacle to improving student success, followed closely by administrative silos and inflexible institutional policies and bureaucracies (figure 8).
We still work in silos, jealously guarding our resources rather than using systems thinking to make bold changes that cut across departments.
Administrator – Community College
Conversely, respondents rated “frequent turnover among administrators, which derails efforts to make improvements” as the least significant structural obstacle, with an average rating below 4; five percent of survey participants disagreed with the statement altogether and did not rate its significance. Respondents also agreed that “Boards of Trustees that are out of touch with the current realities and needs of their institution and its students” is not a significant obstacle, giving it an average rating just above 4.
Figure 8.
Open figure in new window
Interestingly, there were large subgroup differences in the responses to both the highest- and lowest-rated structural obstacles (figure 9). Respondents affiliated with private not-for-profit institutions rated each item as less significant than did respondents affiliated with public institutions (p =0.002-0.08). In fact, while private not-for-profit affiliates rated frequent turnover among administrators as the least significant obstacle (rated below a 3, on average), it was in the middle of the distribution (rated above a 4) for public institution affiliates.
Figure 9.
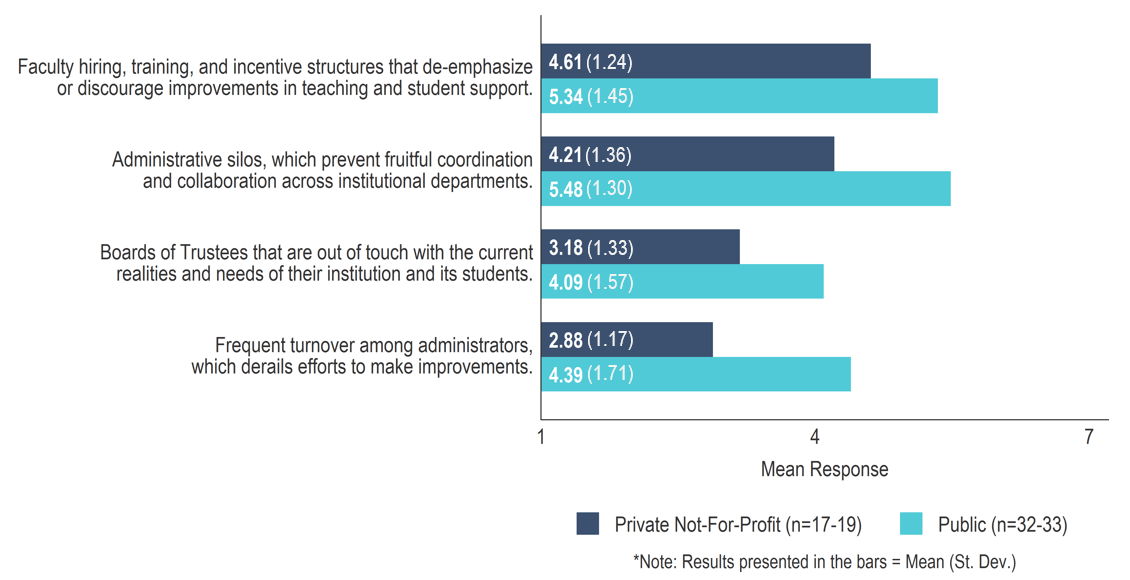
Open figure in new window
Respondents affiliated with public institutions also rated a lack of strategic change management capabilities among sitting and aspiring leaders as a more significant obstacle than those affiliated with private not-for-profit institutions did (M=4.85; SD=1.72 vs. M=3.47; SD=1.87; p=0.01).
Most- and Least- Significant Obstacles across Categories
When all three types of obstacles and their respective 24 items are considered together, the four obstacles rated most significant are presented in figure 10, with the highest-rated obstacle at the top:
Figure 10.
Open figure in new window
Conversely, the four obstacles rated the least significant are presented in figure 11, with the lowest-rated obstacle at the top:
Figure 11.
Open figure in new window
Solutions to Student Success Obstacles
Respondents were presented with 16 existing or potential solutions to the obstacles that impede institutional change to promote student success. They were asked to rate the extent to which each solution holds promise for supporting institutional change to improve student success, on a 1-to-7 scale with 1 indicating “not a promising solution” and 7 indicating “extremely promising solution.” Respondents also had the option of selecting “don’t know/not sure” for any listed solution. See the Appendix for a list of all items.
Most Promising Solutions
The average rating for most solutions is above 4, indicating that respondents found at least some promise in most proposed solutions. In the words of one community college administrator: “These solutions all seem related to creating structural incentives and supports for change. They will all be valuable.”
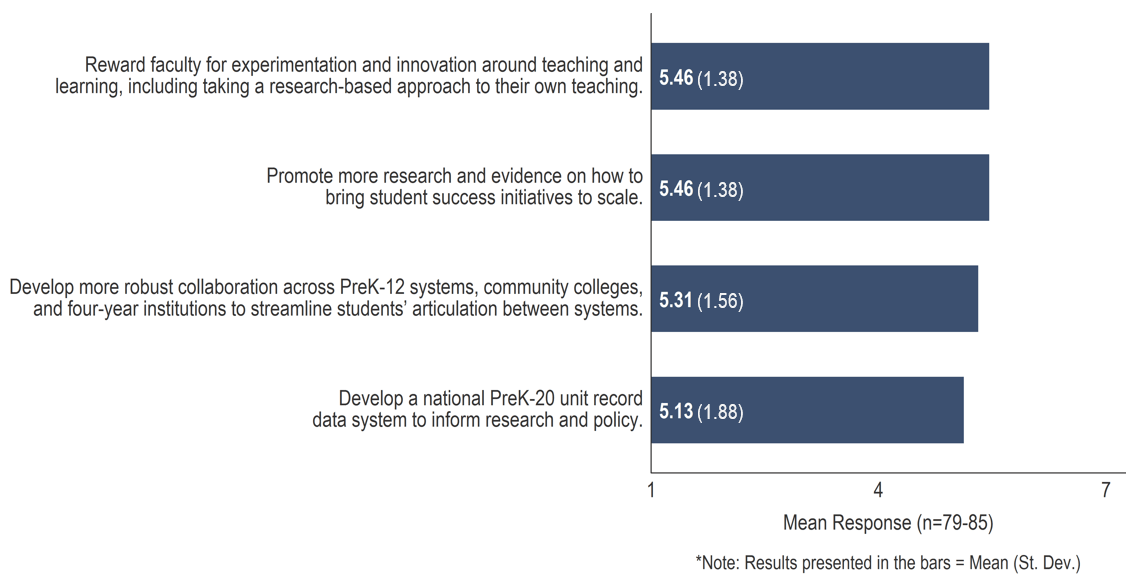
Four solutions stood out as holding particular promise (figure 12): rewarding faculty for innovation around teaching and learning;[6] promoting research on how to bring student success initiatives to scale;[7] improving collaboration among PreK-12, community colleges, and four-year institutions;[8] and developing a national PreK-20 unit record system. More than seventy percent of respondents rated each of these four solutions as a 4 or above.
Figure 12.
Open figure in new window
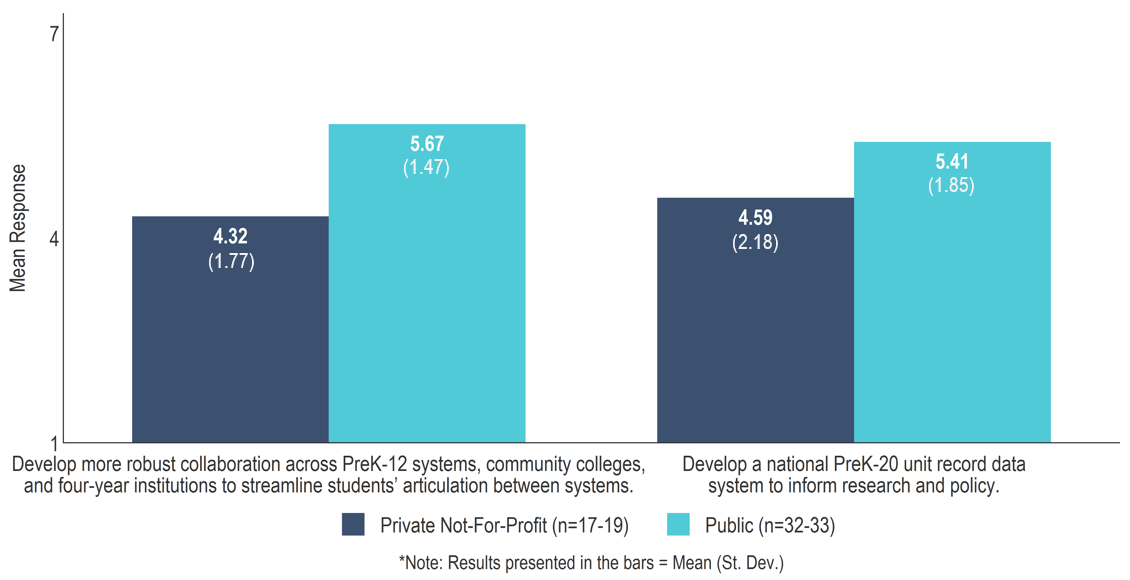
Despite general agreement over the promise these solutions hold, respondents at private not-for-profit institutions rated robust collaboration across PreK-12 systems and higher education institutions as significantly less promising than respondents at public institutions (p =0.005; figure 13). Private not-for-profit affiliates also rated a national PreK-20 unit record data system lower than public institution affiliates, although the difference is not statistically significant (p=0.17).
Figure 13.
Open figure in new window
Least Promising Solutions
Respondents rated only two of the sixteen solutions presented in this section below 4, on average (figure 14).
Figure 14.
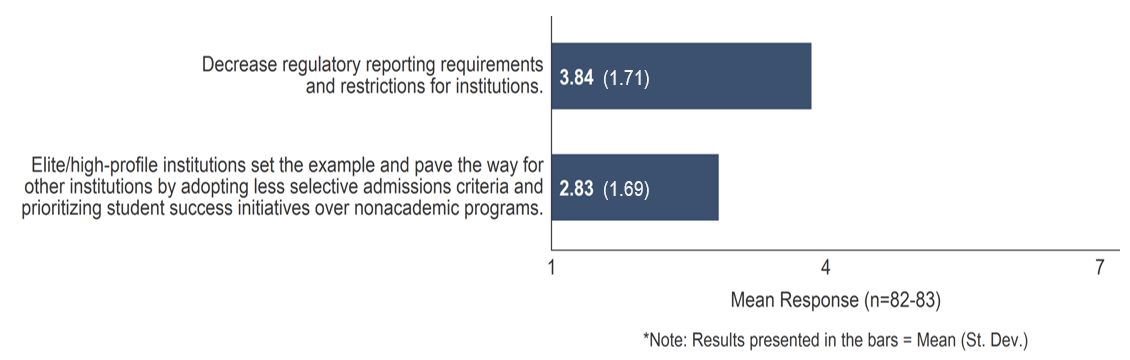
Open figure in new window
The least promising solution, according to respondents, is for high-profile institutions to adopt less selective admissions criteria and prioritize student success initiatives over nonacademic programs. Respondents affiliated with private not-for-profit institutions rated this proposed solution lower than affiliates of public institutions (M=2.11; SD=1.45 vs. M=3.19; SD=2.04; p=0.05). This item elicited additional feedback by numerous respondents. Some who gave it a low rating described a lack of faith in elite institutions’ willingness or ability to spearhead experimentation and solutions: “I strongly doubt that the most privileged institutions are places where solutions begin. We will be lucky if they realize they can learn from those they consider their inferiors,” and “I really don’t expect the elites to lead this work, nor are they likely to do so. . . There is currently a lot of experimentation going on; it’s just not at the elites.” Other respondents who gave it higher ratings clarified that elite institutions can set a good example by prioritizing student success initiatives but took issue with the notion of lowering selectivity.
Consistent with the relatively low significance ratings for obstacles pertaining to government regulations, respondents also gave low ratings to decreasing regulatory reporting requirements as a solution.
Other Solutions
The remaining 10 proposed solutions were all rated at or above 4, on average. Nonetheless, noteworthy group differences emerged for some of these items based on respondents’ institutional affiliations or roles.
Affiliates of public institutions and higher education administrators gave higher ratings than other respondents did on the three following items (p=0.006-0.09):
- “Develop a regulatory environment that provides safe spaces for responsible innovation and experimentation by institutions, and allows for failure;”
- “Develop more formalized structures to promote practice-sharing across institutions facing similar challenges;”
- “Increase agenda-setting and aligned financial support from philanthropies focused on student-success practices.”
Additionally, higher education administrators rated “restructuring the accreditation process to focus more on student outcomes and make accreditation results more public and transparent” a less promising solution than other respondents (p=0.02).[9] Public institution affiliates rated “improving research and training on change management for institutional leaders” higher than affiliates of private not-for-profit institutions (p=0.007)[10].
Changes in Practices of Higher Education Actors and Stakeholders
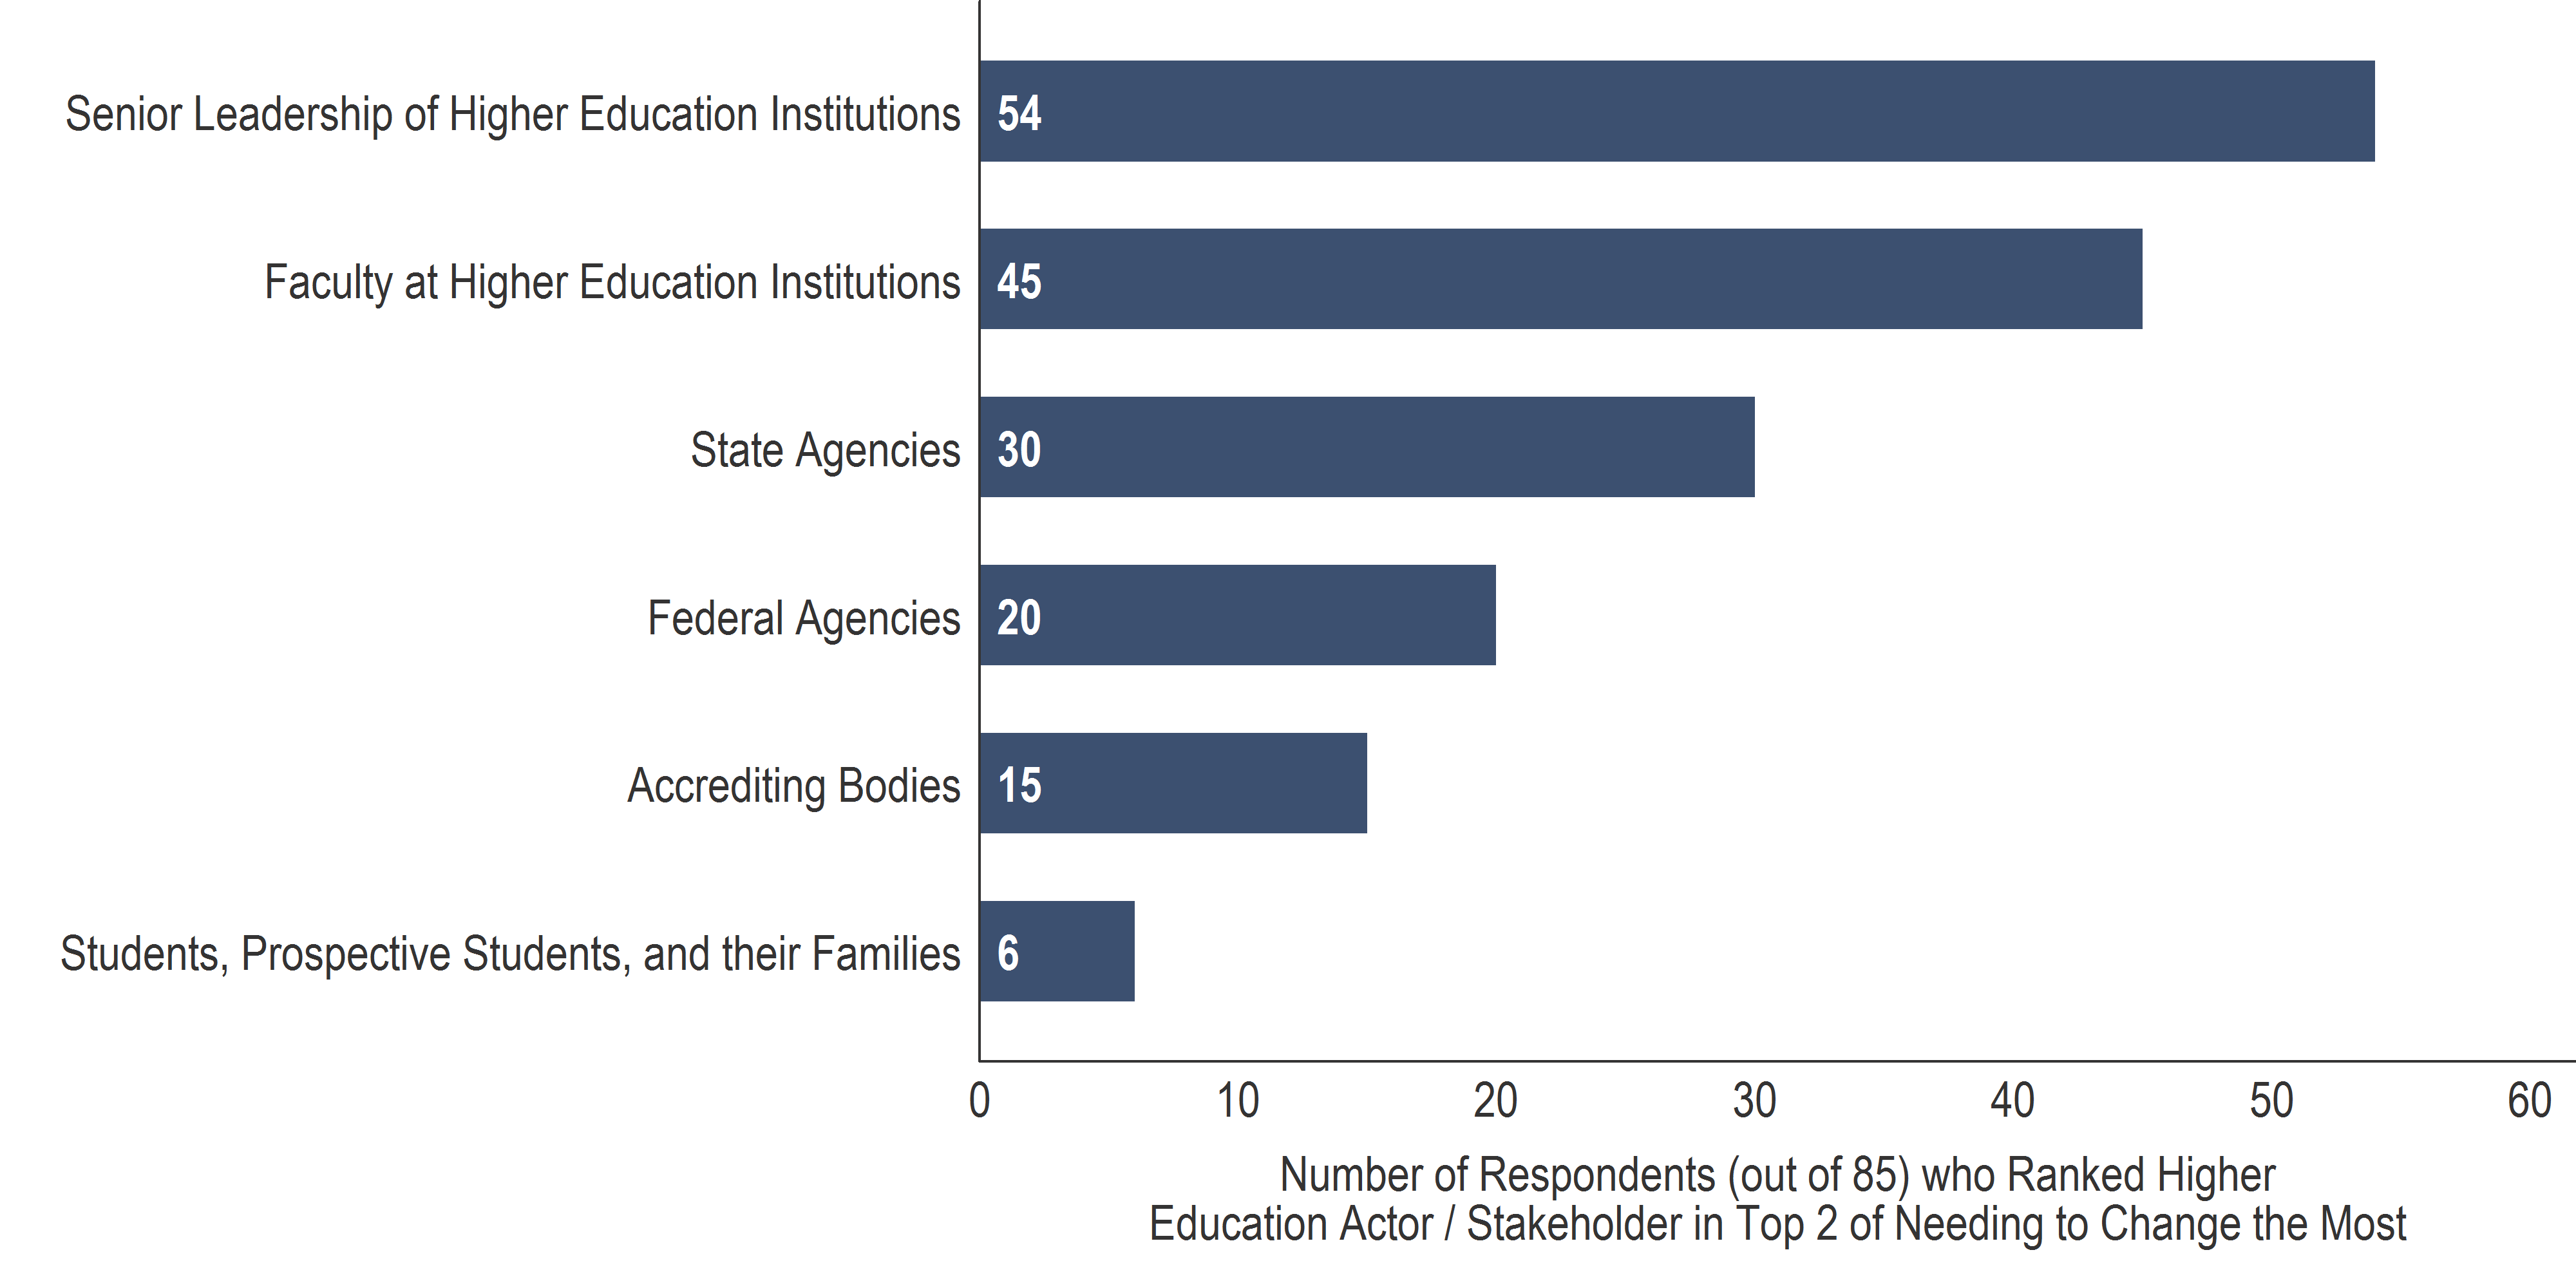
Lastly, respondents were asked to rank six groups of higher education actors and stakeholders based on the extent to which they would need to change their current practices in order to improve institutional change for student success. Most respondents ranked senior leadership of higher education institutions (64%; n=54) and faculty at higher education institutions (53%; n=45) as the top two actors and stakeholders needing to make changes (figure 15).
Figure 15.
Open figure in new window
Additionally, about one-third of respondents (35%; n=30) ranked state agencies in the top two and roughly one-quarter (24%; n=20) ranked federal agencies in the top two. Higher education administrators and affiliates of public institutions ranked state agencies higher than other respondents did (p=0.04 and 0.02, respectively). No such differences were observed in their rankings of federal agencies.
Finally, 18 percent of respondents ranked accrediting bodies in the top two (n=15), though higher education administrators tended to rank accreditors lower than other respondents (p=0.007). One administrator elaborated on this low ranking of accrediting bodies: “I think accrediting agencies are already outcomes based, but simply don’t get real good data and therefore don’t really enforce institutional shortfalls . . . Frankly, we need more training and consistent leadership at the institutional top.”
Lastly, only seven percent of respondents (n=6) selected students, prospective students, and their families as the top two actors that need to change their current practices.
Appendix
Table 1. Frequency of Response to Obstacles to Institutional Change for Student Success – Motivation and Culture
| Motivation and Culture | ||||||||
| 1 | 2 | 3 | 4 | 5 | 6 | 7 | Disagree | |
| Please rate the significance of each obstacle as an impediment to institutions of higher education making changes to improve student success. (1=”Not a significant obstacle” 7=”Extremely significant obstacle”) | ||||||||
| Pressure on higher education institutions and their leaders to compete in institutional rankings that prioritize metrics not central to student success. | 2 | 7 | 9 | 14 | 24 | 22 | 7 | 0
|
| Administrators’ failure to effectively use rigorous evidence to select or design programs and strategies that impact student success. | 1 | 7 | 9 | 9 | 24 | 17 | 13 | 5 |
| A regulatory environment that limits or discourages innovation and experimentation. | 4 | 12 | 15 | 16 | 16 | 12 | 8 | 2 |
| A general focus on outcomes pertaining to credit accumulation and degree completion, which do not adequately capture student learning and career readiness. | 4 | 10 | 12 | 16 | 21 | 12 | 6 | 4 |
| Administrators’ unwillingness to risk upsetting their faculty. | 1 | 9 | 11 | 14 | 23 | 16 | 9 | 2 |
| A poor understanding of the experiences and needs of “non-traditional” students among leaders and faculty at higher education institutions. | 2 | 13 | 16 | 12 | 17 | 18 | 6 | 1 |
| Resistance or aversion to change among faculty at institutions of higher education. | 1 | 2 | 11 | 14 | 26 | 19 | 12 | 0 |
| The increasing influence of corporate interests on higher education. | 15 | 19 | 17 | 9 | 9 | 2 | 4 | 9 |
| n | |
| Of the eight motivation and culture obstacles you just rated, please select up to three obstacles you believe are the most urgent to address at the present time. | |
| Pressure on higher education institutions and their leaders to compete in institutional rankings that prioritize metrics not central to student success. | 33 |
| Administrators’ failure to effectively use rigorous evidence to select or design programs and strategies that impact student success. | 49 |
| A regulatory environment that limits or discourages innovation and experimentation. | 24 |
| A general focus on outcomes pertaining to credit accumulation and degree completion, which do not adequately capture student learning and career readiness. | 33 |
| Administrators’ unwillingness to risk upsetting their faculty. | 26 |
| A poor understanding of the experiences and needs of “non-traditional” students among leaders and faculty at higher education institutions. | 32 |
| Resistance or aversion to change among faculty at institutions of higher education. | 41 |
| The increasing influence of corporate interests on higher education. | 10 |
Table 2. Frequency of Response to Obstacles to Institutional Change for Student Success – Funding and Resources
| Funding and Resources | ||||||||||
| 1 | 2 | 3 | 4 | 5 | 6 | 7 | Disagree | |||
| Please rate the significance of each obstacle as an impediment to institutions of higher education making changes to improve student success. (1=”Not a significant obstacle” 7=”Extremely significant obstacle”) | ||||||||||
| The “arms race” for non-academic programs and amenities, which diverts resources away from education-focused activities. | 1 | 10 | 16 | 17 | 12 | 16 | 9 | 4 | ||
| Inadequate flexibility in how government funds can be allocated within institutions. | 7 | 18 | 17 | 18 | 13 | 4 | 2 | 5 | ||
| Rigid historical budget allocations to departments and functions within institutions. | 4 | 9 | 12 | 14 | 26 | 12 | 6 | 2 | ||
| Time and resource constraints on faculty and staff due to competing or excessive responsibilities. | 1 | 6 | 15 | 17 | 23 | 17 | 4 | 2 | ||
| Insufficient operating funds provided to public institutions by states. | 3 | 3 | 1 | 7 | 13 | 30 | 26 | 2 | ||
| An over-reliance on part-time faculty and teaching assistants in efforts to cut institutional costs. | 7 | 14 | 12 | 14 | 16 | 11 | 6 | 5 | ||
| Requirements for compliance with federal and state regulations, which strain institutional resources. | 5 | 15 | 13 | 19 | 17 | 10 | 5 | 1 | ||
| Institutional resources’ high vulnerability to fluctuations in the business cycle and financial markets. | 7 | 14 | 16 | 15 | 22 | 9 | 2 | 0 | ||
| n | |
| Of the eight funding and resources obstacles you just rated, please select up to three obstacles you believe are the most urgent to address at the present time. | |
| The “arms race” for non-academic programs and amenities, which diverts resources away from education-focused activities. | 32 |
| Inadequate flexibility in how government funds can be allocated within institutions. | 9 |
| Rigid historical budget allocations to departments and functions within institutions. | 30 |
| Time and resource constraints on faculty and staff due to competing or excessive responsibilities. | 41 |
| Insufficient operating funds provided to public institutions by states. | 61 |
| An over-reliance on part-time faculty and teaching assistants in efforts to cut institutional costs. | 23 |
| Requirements for compliance with federal and state regulations, which strain institutional resources. | 21 |
| Institutional resources’ high vulnerability to fluctuations in the business cycle and financial markets. | 21 |
Table 3. Frequency of Response to Obstacles to Institutional Change for Student Success – Institutional Structures
| Institutional Structures | |||||||||
| 1 | 2 | 3 | 4 | 5 | 6 | 7 | Disagree | ||
| Please rate the significance of each obstacle as an impediment to institutions of higher education making changes to improve student success. (1=”Not a significant obstacle” 7=”Extremely significant obstacle”) | |||||||||
| Frequent turnover among administrators, which derails efforts to make improvements. | 3 | 15 | 19 | 16 | 15 | 9 | 4 | 4 | |
| Administrative silos, which prevent fruitful coordination and collaboration across institutional departments. | 0 | 2 | 17 | 10 | 19 | 26 | 11 | 0 | |
| Faculty hiring, training, and incentive structures that de-emphasize or discourage improvements in teaching and student support. | 1 | 3 | 7 | 13 | 19 | 24 | 16 | 2 | |
| Higher education institutions’ struggle to adapt to rapid technological developments in the field. | 2 | 10 | 15 | 16 | 22 | 10 | 5 | 5 | |
| A lack of strategic change management capabilities among sitting and aspiring leaders. | 5 | 10 | 11 | 14 | 16 | 17 | 12 | 0 | |
| Boards of Trustees that are out of touch with the current realities and needs of their institution and its students. | 5 | 10 | 11 | 19 | 26 | 7 | 4 | 3 | |
| Tenure-line faculty members’ excessive control over institutional governance. | 6 | 8 | 11 | 24 | 17 | 10 | 6 | 3 | |
| Entrenched and inflexible institutional policies and bureaucracies (e.g. course registration and transfer policies). | 2 | 3 | 11 | 20 | 20 | 18 | 9 | 2 | |
| n | |
| Of the eight institutional structures obstacles you just rated, please select up to three obstacles you believe are the most urgent to address at the present time. | |
| Frequent turnover among administrators, which derails efforts to make improvements. | 14 |
| Administrative silos, which prevent fruitful coordination and collaboration across institutional departments. | 46 |
| Faculty hiring, training, and incentive structures that de-emphasize or discourage improvements in teaching and student support. | 50 |
| Higher education institutions’ struggle to adapt to rapid technological developments in the field. | 22 |
| A lack of strategic change management capabilities among sitting and aspiring leaders. | 37 |
| Boards of Trustees that are out of touch with the current realities and needs of their institution and its students. | 15 |
| Tenure-line faculty members’ excessive control over institutional governance. | 18 |
| Entrenched and inflexible institutional policies and bureaucracies (e.g. course registration and transfer policies). | 36 |
Table 4. Frequency of Response to Solutions to Obstacles to Institutional Change for Student Success
| 1 | 2 | 3 | 4 | 5 | 6 | 7 | Don’t Know | ||
| Please rate the extent to which each solution holds promise for supporting institutional change to improve student success. (1=”Not a promising solution” 7=”Extremely promising solution”) | |||||||||
| Develop a national PreK-20 unit record data system to inform research and policy. | 5 | 7 | 4 | 7 | 13 | 20 | 23 | 6 | |
| Elite/high-profile institutions set the example and pave the way for other institutions by adopting less selective admissions criteria and prioritizing student success initiatives over nonacademic programs. | 23 | 18 | 15 | 12 | 7 | 4 | 3 | 3 | |
| Performance-based or outcomes-based state funding that considers institutional quality metrics as well as student outcomes, and adjusts for student characteristics. | 7 | 9 | 9 | 16 | 25 | 9 | 10 | 0 | |
| Reward faculty for experimentation and innovation around teaching and learning, including taking a research-based approach to their own teaching. | 1 | 4 | 1 | 9 | 28 | 18 | 24 | 0 | |
| Develop a corps of full-time, permanent, teaching-focused faculty at research institutions. | 10 | 11 | 9 | 10 | 15 | 18 | 9 | 3 | |
| Develop a regulatory environment that provides safe spaces for responsible innovation and experimentation by institutions, and allows for failure. | 4 | 8 | 7 | 11 | 23 | 14 | 14 | 4 | |
| Make fundamental changes in doctoral and faculty training to improve instructional skills. | 2 | 6 | 12 | 14 | 17 | 16 | 16 | 2 | |
| Decrease regulatory reporting requirements and restrictions for institutions. | 8 | 13 | 14 | 18 | 14 | 11 | 5 | 2 | |
| 1 | 2 | 3 | 4 | 5 | 6 | 7 | Don’t Know | ||
| Please rate the extent to which each solution holds promise for supporting institutional change to improve student success. (1=”Not a promising solution” 7=”Extremely promising solution”) | |||||||||
| Provide government incentives to institutions that replicate effective practices. | 2 | 7 | 11 | 18 | 21 | 14 | 9 | 3 | |
| Develop more formalized structures to promote practice-sharing across institutions facing similar challenges. | 3 | 9 | 9 | 17 | 22 | 18 | 5 | 2 | |
| Develop more robust collaboration across PreK-12 systems, community colleges, and four-year institutions to streamline students’ articulation between systems. | 2 | 4 | 6 | 7 | 21 | 21 | 22 | 2 | |
| Promote more research and evidence on how to bring student success initiatives to scale. | 1 | 2 | 5 | 11 | 18 | 26 | 22 | 0 | |
| Restructure the accreditation process to focus more on student outcomes and make accreditation results more public and transparent. | 1 | 11 | 9 | 13 | 18 | 22 | 9 | 2 | |
| Improve research and training on change management for institutional leaders. | 5 | 8 | 11 | 20 | 19 | 15 | 6 | 1 | |
| Increase agenda-setting and aligned financial support from philanthropies focused on student-success practices. | 5 | 8 | 14 | 15 | 18 | 15 | 6 | 3 | |
| Foster closer collaboration between institutions of higher education and the primary industries their students enter. | 4 | 9 | 8 | 13 | 22 | 18 | 10 | 1 | |
Table 5. Frequency of Response to Groups of Higher Education Actors and Stakeholders
| “1” | “2” | “3” | “4” | “5” | “6” | |
| Please rank the six following groups of higher education actors and stakeholders based on the extent to which they will need to change their current practices in order to improve institutional change for student success. (1=”Need to change the most” 6=”Need to change the least”) | ||||||
| Federal Agencies | 8 | 12 | 20 | 22 | 18 | 5 |
| State Agencies | 14 | 16 | 13 | 23 | 12 | 7 |
| Senior Leadership of Higher Education Institutions | 31 | 23 | 9 | 10 | 9 | 3 |
| Faculty at Higher Education Institutions | 22 | 23 | 13 | 12 | 14 | 1 |
| Students, Prospective Students, and their Families | 3 | 3 | 10 | 5 | 11 | 53 |
| Accrediting Bodies | 7 | 8 | 20 | 13 | 21 | 16 |
Endnotes
- See Rayane Alamuddin, Martin Kurzweil, and Daniel Rossman, “Higher Ed Insights: Results of the Fall 2015 Survey,” Ithaka S+R, February 22, 2016, http://www.sr.ithaka.org/publications/higher-ed-insights-results-of-the-fall-2015-survey/.↑
- The following prompt was presented to respondents: “When completing this survey, please think about higher education institutions in the US as a whole. For some of the obstacles and solutions presented below, you may feel that some types of institutions are not affected, or that different effects apply to different types of institutions. (For example, you may feel that an obstacle is a substantial impediment for community colleges but does not affect research universities at all.) When considering such items, please respond from the perspective of how they affect higher education considered as a whole. In other words, taking account of the differential impact, how much of an impediment to student success is the obstacle for higher education, when all of higher education is considered as one combined group? Some factors you may wish to consider in making that judgment are the share of institutions affected, the prominence of the institutions affected, or the number of students affected.” ↑
- For a recent summary of the consequences of insufficient state funding, see the Commission on the Future of Undergraduate Education. “A Primer on the College Student Journey,” pp. 33-36. American Academy of Arts & Sciences, 2016. https://www.amacad.org/multimedia/pdfs/publications/researchpapersmonographs/PRIMER-cfue/Primer-on-the-College-Student-Journey.pdf. For a more detailed treatment, see Mulhern, Christine, Richard R. Spies, and D. Derek Wu. “The Effects of Rising Student Costs in Higher Education: Evidence from Public Institutions in Virginia.” Ithaka S+R. Last Modified 4 March 2015. http://dx.doi.org/10.18665/sr.221021. ↑
- The case studies in educational transformation are available at http://www.sr.ithaka.org/case-studies. For information regarding the Educational Transformation Assessment, see http://www.sr.ithaka.org/services/educational-transformation-assessment. ↑
- Throughout the report, calculations that report percentages of respondents exclude survey participants who selected “disagree with statement”; they only include those who rated the given item between a 1 and 7, inclusively. ↑
- For example, the University of Central Florida offers faculty course release and stipends to research and design effective online and blended courses. Martin Kurzweil and Jessie Brown. “Breaking the Iron Triangle at the University of Central Florida.” Ithaka S+R. Last Modified 26 August 2015. http://dx.doi.org/10.18665/sr.241922. ↑
- The process of institutional change is the overarching focus of Ithaka S+R’s case studies in educational transformation. Published case studies are available at http://www.sr.ithaka.org/case-studies. ↑
- For example, the University of Central Florida, Valencia College, and Orlando area public schools have worked together to support transfer pathway for associate’s degree graduates and create a federated data system that provides the postsecondary partners with more information about how to personalize support for incoming students. See Brown and Kurzweil. “Breaking the Iron Triangle at the University of Central Florida”; Jessie Brown and Martin Kurzweil. “Collaborating for Student Success at Valencia College.” Ithaka S+R. Last Modified 29 October 2015. http://dx.doi.org/10.18665/sr.274838. ↑
- M=4.23; SD= 1.58 vs. M=5.05; SD=1.55 ↑
- M=4.69; SD=1.45 vs. M=3.47; SD=1.54 ↑
Attribution/NonCommercial 4.0 International License. To view a copy of the license, please see http://creativecommons.org/licenses/by-nc/4.0/.