Institutional Supports for Students with Stranded Credits
Survey Results from the Ohio College Comeback Compact
Introduction
As of 2023, 43.6 million borrowers owe more than $1.7 trillion in student loan debt.[1] The burden of debt negatively impacts borrowers’ ability to provide for their families, purchase a car, or buy a home.[2] However, there is another, often overlooked, institutional debt that students may owe their former institutions after stopping out. It is estimated that 6.6 million students owe $15 billion in unpaid balances to their institutions.[3] This institutional debt stems from various parts of campus including tuition balances, library fees, or parking fines, among others. Typically resulting in registration and transcript holds, institutional debt limits students’ ability to access their transcripts, causing “stranded credits.” These institutional debts can hamstring students’ ability to complete their credential, transfer to a new program, apply for scholarships, or show proof of their education to potential employers.[4]
This practice has been so pervasive that a 2016 survey of 693 postsecondary institutions across the nation found that 97 percent withheld transcripts for an outstanding balance, and 68 percent did so for less than $25 dollars.[5] The urgency to meet enrollment, student success, and state educational attainment goals leaves institutions in a state of dissonance, where restrictive policies impede institutional efforts to meet student success goals and bind students with little to no options to continue their education—an education that could help them bolster their earning power and pay off their institutional debt.
The adverse effects of transcript withholdings and institutional debt have caught the attention of states and institutions nationwide. Eight states recently enacted laws prohibiting or limiting the use of transcript withholding, five have legislative requirements to study the issue, and the federal Department of Education released newly proposed rules to curtail the practice.[6] To respond to the challenges associated with institutional debt, institutions across the country are offering programs to facilitate re-enrollment back to higher education. Several institutions in Ohio, for example, have partnered with their state agency to develop “comeback” programs that eliminate past institutional debt.[7]
Championing an innovative solution, Ithaka S+R launched the Ohio College Comeback Compact (“Ohio Compact” or “Compact”) in August 2022. A cross-institutional partnership with eight public colleges and universities in Northeast Ohio, the program offers stopped-out students the opportunity to re-enroll at any of the participating institutions, despite owing institutional debt and having their transcript withheld.[8] Through the Compact, students are eligible to receive up to $5,000 in debt forgiveness and a release of their transcript after completing two terms or upon graduation. Participating institutions also benefit from engaging in periodic financial transactions to account for students who enroll somewhere other than their previous institution. This program comes at a crucial time when approximately 28 percent of the population in Ohio constitutes some college but no degree, and roughly 38 percent of the population make under $50,000 a year.[9] By providing a two-fold solution—absolution of students’ institutional debt and access to their transcript—programs like the Ohio Compact support student mobility and an upward socioeconomic trajectory, benefitting local and state economies.
A growing body of research examining stranded credits attempts to understand the impact of institutional debt on adult learners; however, there is still little known about the educational and life experiences of students in this situation who embark on a journey to complete their unfinished degree. Recent research points out the need for continued support for stopped-out students who return to pursue their degree, in addition to removing the barrier to entry.[10] As part of our evaluation work to understand the efficacy of the Ohio Compact, we surveyed students in Northeast Ohio who were deemed eligible for the program to obtain a baseline understanding of the obstacles facing some-college no-degree students who have institutional debts, and how these students ended up with stranded credits initially. Our results provide insight into the life circumstances that can hinder these students from their path back to higher education. Findings from these results help inform ongoing improvements to program implementation, informed our evaluation efforts, and help us form a greater appreciation of who students with stranded credits are.[11]
This report introduces students with stranded credits who were eligible to return to college through the Ohio Compact and provides a glimpse into their circumstances outside of the classroom. We share the findings of our survey and describe the hurdles these learners face when once again pursuing their postsecondary degree. We then discuss the types of support vital to the persistence and retention of these students. Finally, we conclude by examining the importance of academic and non-academic supports for individuals with stranded credits in their educational journey.
Methodology
Our analytic sample comes from the Ohio Compact’s eight public community colleges and universities in Northeast Ohio: Cleveland State University, Cuyahoga Community College, Kent State University, Lakeland Community College, Lorain County Community College, Stark State College, The University of Akron, and Youngstown University. To be eligible for the Compact, students must meet the following criteria:
- Have previously enrolled in one of the participating institutions, with the most recent enrollment at least two terms (at least one spring and one fall) prior to the next available term in which they can enroll,
- Have at least a 2.0 cumulative GPA as of their final term at the previously attended institution,
- Owe a debt to the previously attended Compact institution (the “eligible debt”),
- Eligible debt is owed to only one Compact institution; if a student owes debt to multiple Compact institutions, they are not eligible
- Debt balance must be $5000 or less
- Eligible debt must be certified to the Office of the Attorney General (OAG)
- Collection must not be assigned to a special counsel
- Cannot currently be involved in bankruptcy proceedings,
- Cannot currently be enrolled in an associate or bachelor’s degree or certificate program at any institution (Compact or non-Compact), and
- Cannot previously have received the maximum debt cancellation through the Compact.
The eight institutions identified 15,257 former students with stranded credits. To ensure students met all criteria, we collaborated with the Ohio Attorney General (OAG) to identify students who had multiple debts, whose debt was in special counsel, and/or whose debt was in bankruptcy. The application of these criteria and further data cleaning narrowed our eligibility pool for a final, full sample of 5,878 students.
To identify students for survey distribution we restricted the pool to the 5,878 students who were identified as eligible for the Compact as of July 2022.[12] Email addresses provided by each institution were used to contact students on the list. Because these are students who are not actively enrolled, students’ contact information may be outdated. We initially emailed 3,964 students. We received bounce backs from 1,070 students, but it is unclear how many of the remaining email addresses were being actively monitored by students. The survey was conducted from November 22, 2022 to January 13, 2023 and as an incentive, participants were entered into a drawing for $25 Amazon gift cards. To increase our response rate, we opted for a multi-pronged approach, employing a combination of distribution tactics including Qualtrics, individual Outlook emails, and engaging with each institution’s Compact advisor to reach out to eligible students.
The survey was designed to understand how and to what extent personal and professional burdens hindered students’ ability to continue their educational journey and their awareness of the institutional debt they owe to their former institution. The survey contained nine sections related to respondents’ previous and current experiences with higher education, reasons for incurring debt and stopping out, employment status, caregiver responsibilities, transportation, food and housing, general motivation, and identity/demographics. Questions specific to food and housing insecurity were taken from the validated US Department of Agriculture (USDA) food insecurity survey and housing insecurity surveys adapted by the Department of Housing and Urban Development (HUD) and the Department of Education.
Survey findings are reported in the aggregate and quantitative data was analyzed using Stata and Microsoft Excel. It is important to note a few limitations with this study. Several respondents only partially completed the survey. We decided to include all responses in our analysis, concluding that they are nonetheless important to help us contextualize students’ circumstances. In total, 130 individuals responded, representing a response rate of 3.3 percent. The low response rate creates difficulty in drawing generalizable conclusions, but the results of the survey are nonetheless illuminating, providing a window into the lives and lived experiences of students with institutional debt. Additionally, the low response rate is indicative of broader obstacles facing these students and efforts to connect with them. Outdated contact information, general disengagement from their former institution, or limited time and availability pose large hurdles when trying to re-engage stopped-out students.
Who Are Students with Stranded Credits?
The population of students enrolled in the 2020-2021 academic year at the eight Compact colleges is disproportionately female (59 percent) and white (69 percent) followed by Black (13 percent) and Hispanic students (5 percent), closely reflecting the demographics of the state of Ohio in 2022.[13] While the gender split of students eligible for the Compact (58 percent female) is comparable to students who were enrolled in a Compact institution in 2020-2021, eligible students are more likely to identify as Black (36 percent) and less likely to identify as white (46 percent) than overall institutional enrollments. Fifty-four percent were Pell recipients when previously enrolled and 62 percent of the eligible pool attended a community college prior to stopping out. Students’ median age was 41, they had a median GPA of 2.5, and their median debt balance was $735. The higher proportion of Black students with stranded credits, relative to the demographics of the undergraduate population on the eight campuses, points to the disparate impact of debt on minoritized students. These findings echo recent research showing the significantly greater impact of holds on first-generation students, Black students, and those with higher financial need.[14]
In comparison to non-survey respondents, survey respondents are disproportionately Black (43 percent), female (73 percent), and Pell recipients (68 percent). As shown in Table 1, they are more likely to have attended a community college—70 percent of respondents were pursuing an associate degree prior to stopping out—and hold a slightly higher debt balance ($748 survey respondents vs. $735 non-survey respondents).
Table 1: Comparison of survey respondents to non-survey respondents
| Characteristic | Survey Respondents (n=130) | Non-survey Respondents (n=5,748) |
| Share of students who were enrolled at a two-year institution prior to stopping out | 70% | 62% |
| Share of students who were enrolled at a four-year institution prior to stopping out | 30% | 38% |
| Share of students who identify as Black/African American | 43% | 36% |
| Share of students who identify as white | 37% | 46% |
| Share of Pell recipients | 68% | 53% |
| Share of students that are female | 73% | 58% |
| Share of students that are male | 27% | 42% |
| Median age | 40 | 41 |
| Median debt balance | $748 | $735 |
Respondents are more likely to be adult learners over the age of 26. This age demographic is similar to the nearly 40 million former students nationally without a credential, of whom roughly 50 percent are 25 and over.[15] Additionally, about 14 percent of survey respondents identify as LGBTQ+, less than the percent of LGBTQ+ college students enrolled nationally in 2018 (17 percent),[16] but almost double the number of LGBTQ+ US adults in 2021.[17] Over 50 percent of respondents have an income of $30,000 or below—a characteristic shared by 51 percent of respondents who identify as parents and 43 percent of respondents who are employed. Almost two-thirds of survey respondents have caregiver responsibilities either of a dependent child or a spouse or family member, though female respondents (65 percent) are more likely than male respondents (40 percent) to report having these responsibilities.
Reasons for Stopping Out, Incurring Debt, and Source of Transcript Withholds
The interlace between the incursion of debt and ultimately stopping out highlights the tug-of-war reality of financially strapped students who are forced to prioritize their time and resources. The most common reasons for halting their education are financial (59 percent), family obligations (39 percent), and various other challenges (25 percent) such as mental health, lack of motivation and belonging, or COVID-19, as shown in Figure 1. A recent survey by Lumina Foundation and Gallup garnered similar results, pointing to financial reasons as the most frequently cited barrier preventing re-enrollment, along with caregiver responsibilities, stress, and personal mental health/physical health concerns.[18] These explanations are also reflected in survey respondents’ reasoning for incurring the associated debt. Figure 2 shows that 89 percent state a financial reason for having debt, and 28 percent accrue debt because personal obligations forced them to withdraw.
Figure 1: Reasons for stopping out (n=130)
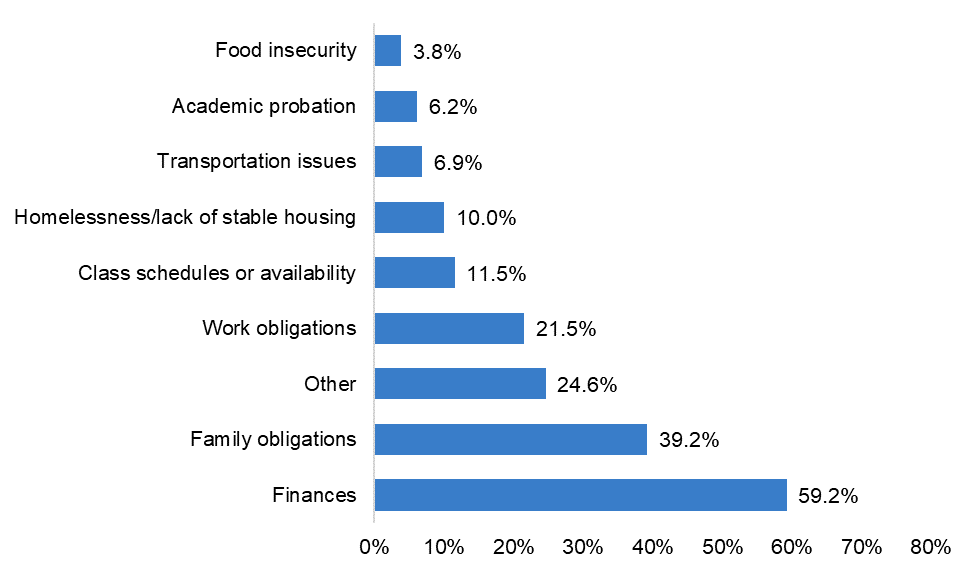
Note: Survey question allowed respondents to select all answer choices.
Figure 2: Reasons for incurring debt (n=130)
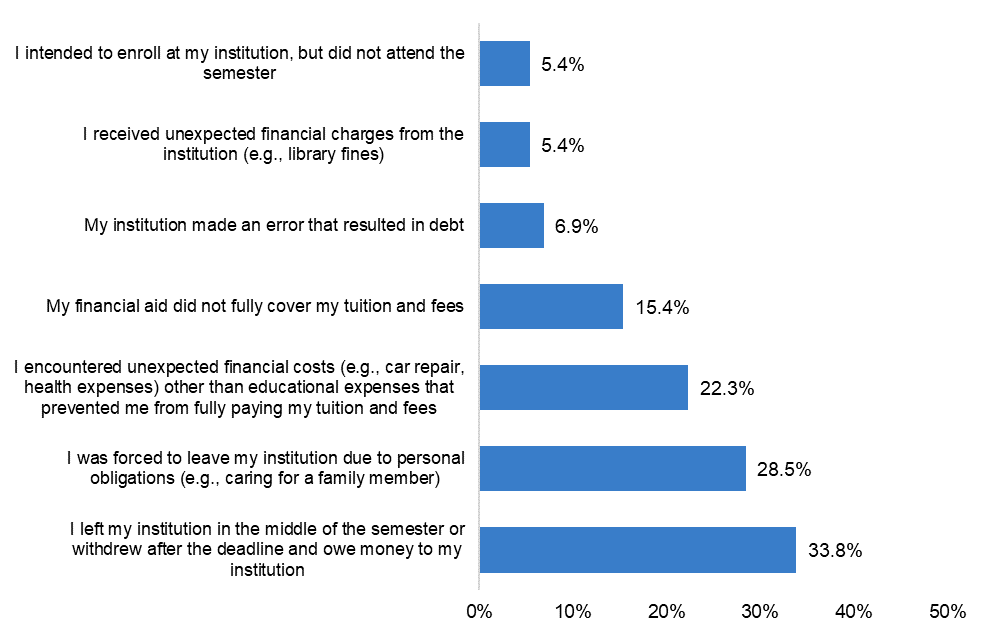
Note: Survey question allowed respondents to select all answer choices.
Looking at the variances in financial causes for debt accrual, we find that 34 percent of survey respondents incurred debt as a consequence of leaving their former institution after the deadline to withdraw. It is highly likely that this is related to the US Department of Education policy known as Return to Title IV funds. This policy requires Title IV beneficiaries to repay some portion of their federal student aid after they withdraw during a payment period or period of enrollment. Based on a certain set of criteria, a calculation is made to determine how much of the funds should be returned and the balance of remaining tuition is pushed onto the student for payment.[19]
Other reasons for the cause of debt include unexpected financial costs that prevent students from paying tuition and fees (22 percent), lower than expected financial aid received to cover tuition and fees (15 percent), unexpected financial charges from the institution (5 percent), and institutional error that resulted in a debt (7 percent). Though it is difficult to assess the veracity of debt resulting from institutional error, the results highlight the complexities around institutional bureaucratic practices that arise from a lack of institutional oversight around debt tracking and billing or students’ unfamiliarity in understanding and navigating the environmental landscape of their institutions and its departments.[20]
Through administrative data, we attempted to collect information related to the source of transcript holds to assess how well students understood their debt. However, only four out of the eight institutions were able to provide source information, suggesting the variability and difficulty in institutions’ ability to track this information.
Scholarship on the issue of transcript withholding suggests that insufficient funds, outstanding balances, parking fees, or library fines are common reasons for a transcript hold. Qualitative research finds that students leave college for a variety of reasons like insufficient financial resources, divorce, loss of a job, or pregnancy, only to find that leaving increases their debt, often making it impossible to pay down.[21] Debt for parking fees or book fines may seem trivial, but the complexities and hardship adult learners from low socioeconomic backgrounds face outside of the classroom can sometimes make repayment of these relatively small debts impossible.
Employment
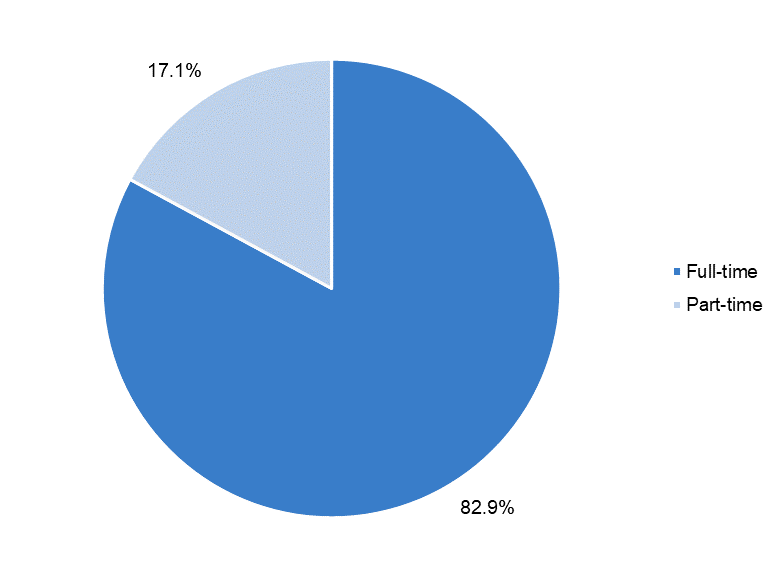
As shown in Figure 3, 66 percent of survey respondents report being employed, and 20 percent indicate they are actively looking for work—a combined statistic higher than Ohio’s labor force participation rate (61.2 percent) and the US labor force participation rate (62 percent) as of December 2022.[22] Figure 4 shows that of those who are employed, 83 percent work full-time. A majority of respondents are employed in the sales and healthcare support industry. Other commonly reported industries include office and administrative support and business and financial operations. Breaking down these results by gender, male respondents are more likely than female respondents to report working at all (63 percent male vs. 57 percent female) and working full-time (54 percent male vs. 46 percent female). Additionally, 46 percent of employed respondents have dependent children and 20 percent are responsible for caring for family members, with some overlap between the two categories. Employed female respondents are significantly more likely to hold these responsibilities, a finding that parallels research showing the burden of caregiver responsibilities often fall on women.[23]
Figure 3: Survey respondents’ response to “Are you currently employed?” (n=115)
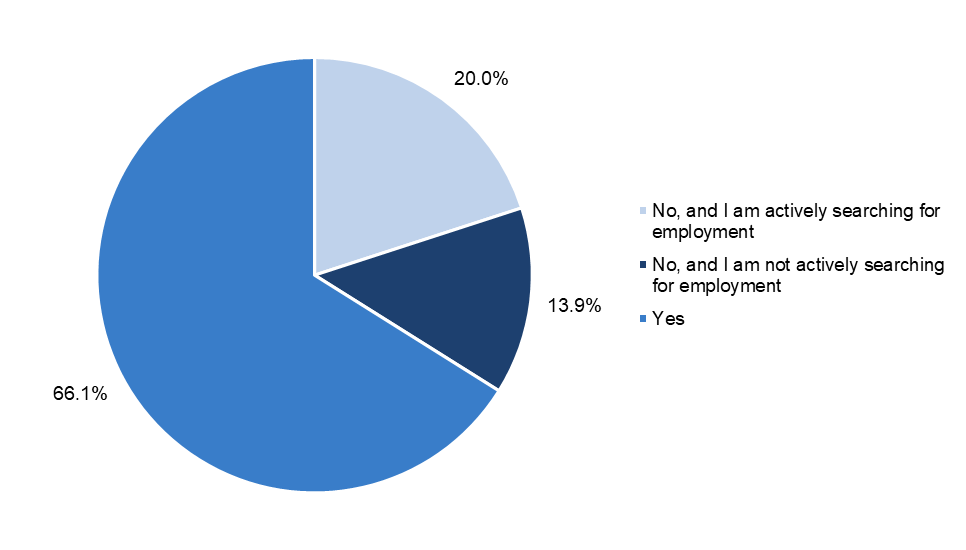
Figure 4: Employed respondents’ current employment status (n=76)
Food and Housing Insecurity
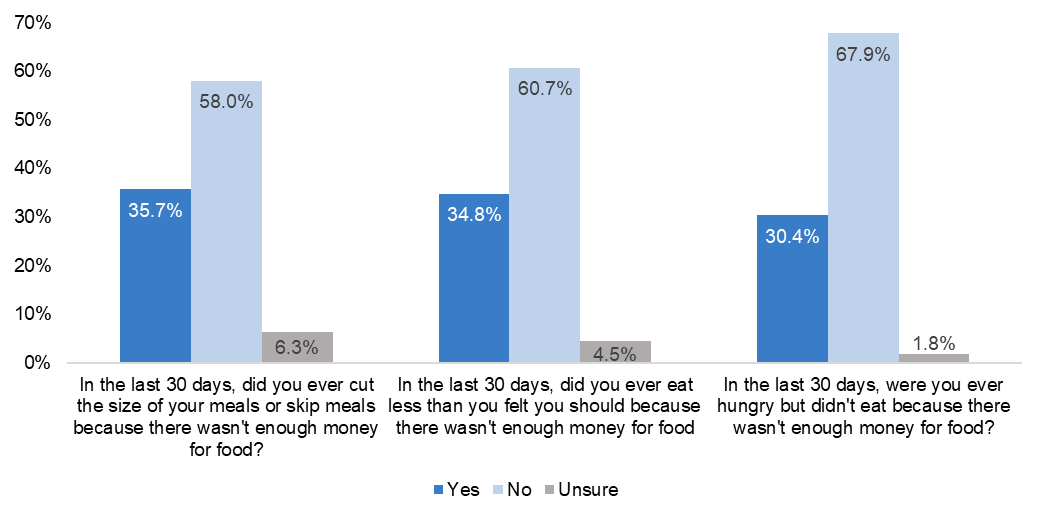
Over half of respondents have no difficulty in accessing or affording food. However, as shown in Figure 5, a sizable proportion of our respondents indicate worrying about food running out (47 percent), the inability to afford nutritious meals (44 percent), or skipping meals altogether (36 percent). The Hope Center’s 2021 basic needs insecurity survey finds that nationally 34 percent of undergraduates deal with food insecurity and many report similar hardships.[24] But, because our respondent pool is different (Compact eligible individuals) than the undergraduate population, comparison of the two groups is difficult. However, our results show food insecurity extends beyond current college students.
Figure 5: Percentage of respondents who report food insecurity in the past 30 days (n=112)
Figure 5a
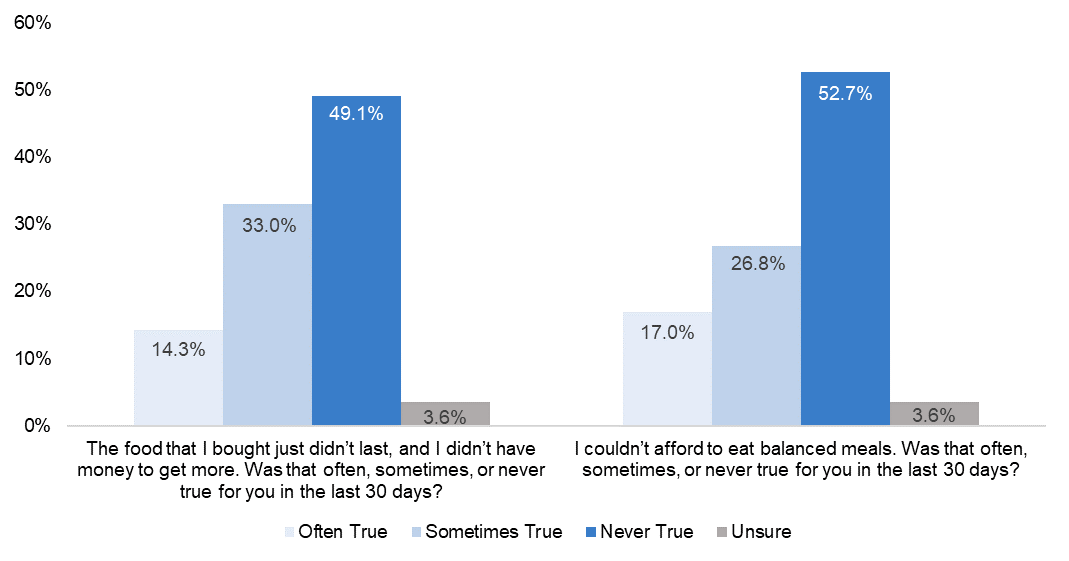
Figure 5b
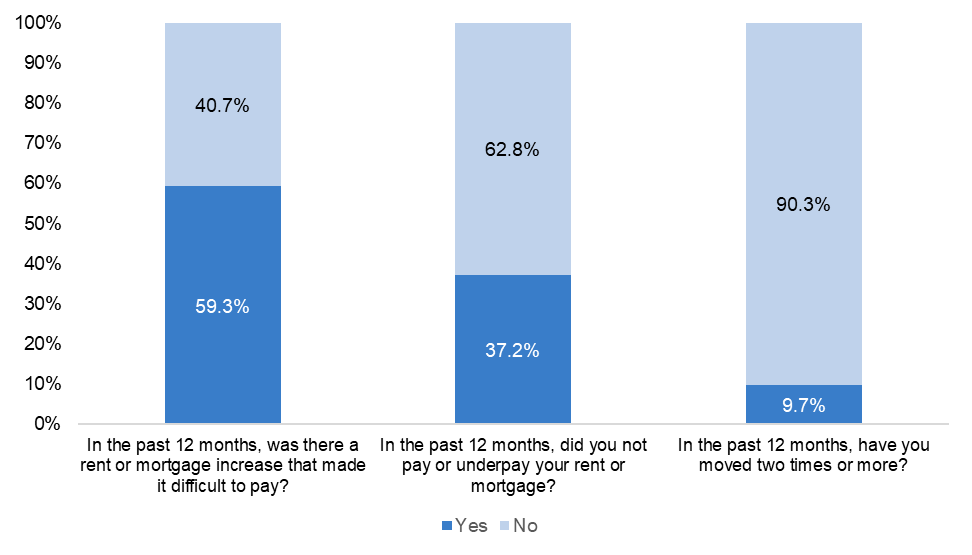
Similar to our results on food insecurity, a majority of respondents report minimal experiences with precarious housing, the one exception being increases in rent or mortgage. Though 63 percent of respondents report no hardship in underpaying or missing payments, a smaller, yet significant proportion (37 percent) struggle with keeping up with their rent or mortgage. Further, as Figure 6 shows, 59 percent of respondents mention that mortgage or rent increases over the past year made it difficult to pay, reflecting common challenges experienced by many undergraduate students nationwide.[25] An interesting point to note is the lack of homeownership among survey respondents. When asked where they slept the night before, 58 percent of respondents cite a rental property, but none report owning a home. This phenomenon is not unique among stopped-out students and reflects a broader challenge many individuals with student debt face.[26]
Figure 6: Percentage of respondents who report housing insecurity (n=113)
Differences in food and housing insecurity by gender and race provide a more nuanced understanding of basic needs insecurity among survey respondents. We find food insecurity to be equal across male and female respondents (43 percent),[27] but 60 percent of male respondents report experiencing housing insecurity in the past year compared to 48 percent of female respondents. Sixty-one percent of Black respondents report housing insecurity in the past year compared to 44 percent of white respondents, and 46 percent of Black respondents are food insecure (low to very low food security) compared to 44 percent of white respondents.
Caregiver Responsibilities
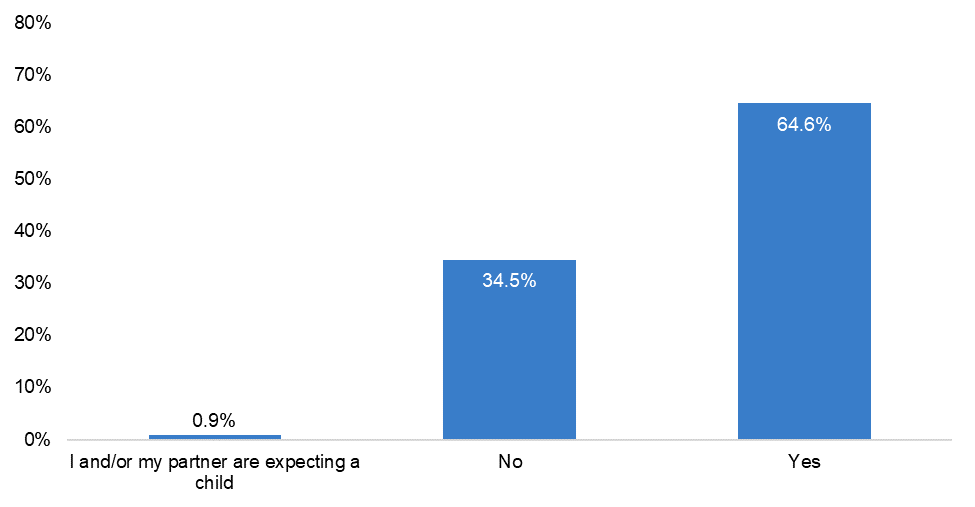
Over half of survey respondents point to caregiver responsibilities as the biggest hindrance to re-enrollment. As shown in Figure 7, almost 60 percent of respondents are caregivers, either to a spouse or family member, children, or both. Figure 8 shows that 65 percent of respondents identify as parents, compared to 49 percent of all post-traditional students and 4 percent of traditional aged students who report having dependent children.[28] Disaggregating these results by gender, 45 percent of female respondents report having dependent children compared to 23 percent of male respondents, and 20 percent of female respondents report being a caregiver for a family member compared to 17 percent of male respondents.
Figure 7: Percentage of respondents who are caregivers (n=130)
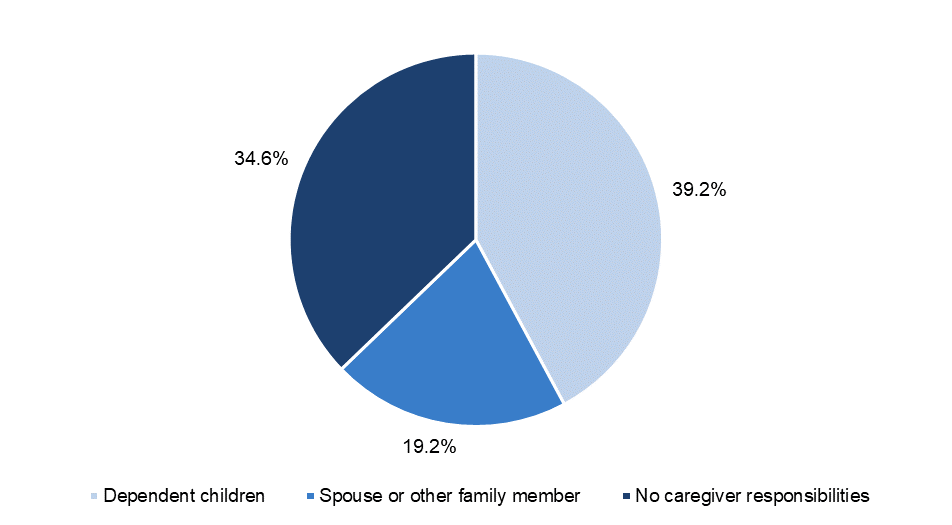
Figure 8: Percentage of respondents who are parents (n=113)
Contextualizing Survey Findings with the Broader Literature
Students with Stranded Credits Need Support
The snapshot of identities and attributes associated with students with stranded credits points to the numerous hurdles that make it difficult to return to school and explains why the hardship of paying off institutional debt extends beyond financial limitations. For many stopped-out students, classroom demands, finding and paying for reliable childcare, working, and attending to other commitments can make it difficult, if not nearly impossible, to pay off debt, re-enroll, or stay enrolled in a program. To add to the compounding responsibilities, the burden of keeping food on the table and a roof over their heads is significant. Thus, recognizing which supports are vital to assist and retain students who seek a postsecondary degree is just as important as knowing why they stopped out in the first place.
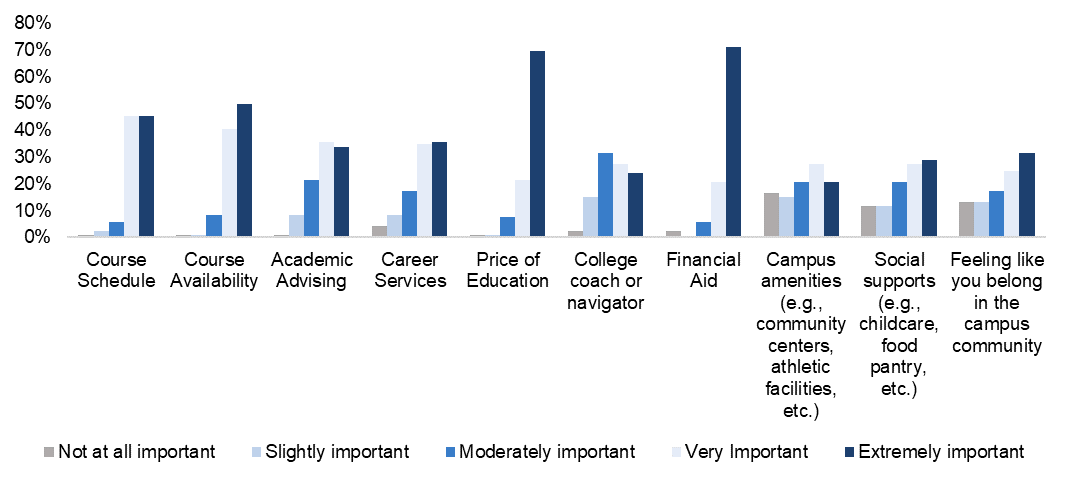
Respondents were asked an array of questions to assess which specific factors inhibited their re-enrollment and what services are crucial to their success after re-enrollment. As shown in Figure 9, social support services such as childcare, food assistance, and mental health support (77 percent), academic support such as course availability (98 percent), college coach or navigator (83 percent), course schedules (97 percent), academic advising (91 percent), financial support such as financial aid (98 percent), and cost of attendance (98 percent) are mentioned as moderately to extremely important to the success of students’ educational experience.
Figure 9: How important do you think each of the following aspects of your educational experience is for your success at your current or future institution, if you were to re-enroll? (n=121)
Social Realities Facing Stopped-Out Students
In various responses throughout the survey, respondents cited the challenges of navigating parenting, mental health, and basic needs insecurity. In this section we discuss the various social circumstances that complicate re-enrollment for students who have stopped out. We consider why these shortages exist in higher education and call attention to solutions campuses are implementing to close the gap.
Sixty-five percent of survey respondents identify as a parent, and 46 percent of employed respondents have dependent children. The lack of access to and cost of childcare are some of the biggest hurdles facing all Americans, a hardship exacerbated by the COVID-19 pandemic.[29] But for parents who are contemplating going back to college, reliable childcare is a key factor to educational success and degree completion. In fact, for parents who have stopped out, access to reliable childcare could have allowed them to stay enrolled and finish their degree.[30] This frustration can be heightened for many parents who are employed full time while pursuing a degree. Eighty-four percent of survey respondents with children are employed full time, compared to 55 percent of student parents who work 20 or more hours a week.[31] Previous research finds that nearly half of all working adult students are parents and a survey conducted in 2021 by The Chronicle of Higher Education and Guild Education reports nearly seven in 10 respondents cite increased child care responsibilities as a driving factor that makes it difficult to stay engaged in class.[32] The lack of reliable and affordable child care is often felt more acutely by low-income families, the same demographic of students straddled with stranded credits.
Though a minority of parents in our survey report their childcare needs as unmet (21 percent), 80 percent of that group said the lack of childcare is a barrier to re-enrollment. A recent survey by Generation Hope evaluating access to and the cost of childcare found that over half of student parents did not have any on-campus childcare options and 41 percent were unaware of any childcare services offered on campus.[33]
This is not surprising since over a 12-year period the number of four-year public institutions with on-campus childcare services shrunk from 55 percent in 2003 to 49 percent in 2015.[34] The most significant form of assistance for on-campus childcare comes from a federally funded program called Child Care Access Means Parents in School (CCAMPIS). Colleges and universities are awarded grants by the US Department of Education to assist student parents with childcare costs either at an on-campus daycare or off campus with an accredited provider. However, insufficient funding and a lack of targeted outreach stymie the program’s reach and effectiveness. More than 4,000 children were on a waiting list for on-campus daycare services in 2017, and less than one percent of student parents with children under 18 were served under the program in 2018.[35]
In addition to long waiting lists, on-campus options may not offer extended hours and off-campus alternatives can cost thousands of dollars, even after accounting for federal childcare subsidies.[36] Both options force student parents to rely on friends and family, which can be strenuous and unreliable. When on-campus childcare is an option, the shortfall in financial aid or the absence of accounting for the cost of childcare in financial aid awards makes it financially challenging to pay for tuition, childcare, and daily expenses. If the cost of childcare is tallied into award amounts, students will often find that federal aid dollars have been exhausted and there is nothing left to distribute.[37]
Aside from childcare, growing scholarship on the effects of food and housing insecurity on college students is now a more prominent focus of discussion, drawing on human development theory that posits that individual basic needs like food and housing must be met to learn higher level skills.[38] Though food and housing insecurity do not seem to be an entry point barrier for our respondents, we find that many still cope with some form of insecurity, whether that constitutes skipping meals, keeping up with rent or mortgage payments, or both. This insecurity is exacerbated for stopped-out students who identify as LGBTQ+—a smaller, but still significant population of our sample. The higher likelihood of estrangement and independent financial status can increase and perpetuate basic needs security for this population, providing a case for individualized and targeted assistance.[39] For example, a survey by the Hope Center concluded that nationally, LGBTQ+ undergraduates are 10 percentage point more likely to experience some form of basic needs insecurity than heterosexual students (65 percent LGBTQ+ versus 56 percent non-LGBTQ+).[40] Transgender and non-binary students have the greatest risk of basic needs insecurity, and homosexual and bisexual students are at much greater risk than heterosexual students.[41]
Limited access to or the complete absence of basic needs like housing and food can impede student success through multiple avenues including cognition, health, and logistical barriers, making it harder to concentrate on coursework.[42] Studies have found that students struggling with housing insecurity are 10 percentage points less likely to be educationally successful, and those coping with food insecurity are more likely to report lower GPAs and experience adverse effects on their academic performance.[43] Other studies have found that housing insecurity is associated with an eight to 12 percentage point decline in the probability of earning a degree or being enrolled in college four years later.[44] These hardships are exacerbated if students are unfortunate to experience both housing and food insecurity, two challenges that are far from being mutually exclusive. As stopped-out students re-enroll in college with basic needs insecurity, these struggles further underscore the necessity of basic needs support that is now more distinctly acknowledged as an essential service for student success.
Gender and racial disparities cited earlier in this report pointedly show the very real struggle and disproportionate impact in the absence of basic needs. A survey by the Hope Center found Black students are 16 percentage points more likely than non-Hispanic whites to experience some form of food and housing insecurity.[45] The survey also finds that female students, first-generation students, Pell recipients, and part-time students have a far greater risk of being food and housing insecure. [46]
A lack of awareness and utilization of social support programs by students who require them the most results in continued inequities and calls for stronger communication and targeted outreach. The Supplemental Nutrition Assistance Program (SNAP) is the primary program to help college students address food insecurity. However, complex eligibility requirements and misalignment in federal work-study funds often make it difficult for college students to access SNAP benefits.[47] Besides SNAP, food pantries and other campus-based initiatives such as meal share programs and campus gardens are common solutions at many institutions.[48] However, students may not use these services despite their availability. Research suggests that social stigma, a dearth of knowledge, and inconvenient hours of operation contribute to the lack of student awareness of food assistance available at their institution.[49]
Housing assistance is also scarce and insufficient. Direct assistance programs and housing supports are often time limited or require employment. At other times, the most affordable options are usually farther away from campus, increasing travel time which can add an additional layer of burden for students who lack reliable transportation.[50] To combat these limitations, colleges have initiated homegrown programs or partnered with community-based organizations to expand resources and support. For example, the College Housing Assistance Program by the Tacoma Housing Authority and Tacoma Community College provides public housing support for college students who are housing insecure or homeless.[51] Other institutions have partnered with Single Stop, a national nonprofit, to build and utilize a technology platform that identifies students who may need public assistance and supports staff in case management.[52]
The fickleness of childcare availability and the irregularity of students’ basic needs can be taxing and trigger a host of mental health struggles, affecting academic outcomes like grades and retention.[53] Not only are they a significant predictor of functional outcomes, but certain mental health struggles are also correlated with students’ increased likelihood to stop out of college.[54] Studies have shown that mental health problems are associated with twice the likelihood of dropping out, taking more frequent breaks between their education, lower GPA, and delaying graduation.[55]
Though we did not explicitly ask questions about mental health in our survey, mental health challenges were a common reason cited for stopping out in the open-ended responses. Over the past decade, the number of college students coping with mental health has steadily risen. Between 2016 and 2020, the prevalence of depression and anxiety rose 14 and 13 percentage points, respectively.[56] One in five college students meet the criteria for alcohol use disorder, and up to 11 percent suffer from ADHD.[57]
Many students needing mental health support may be afraid to seek help because of personal stigma, lack of time, or simply not perceiving the problem as urgent. However, solutions like intensive personal counseling or technology-based programs that are available on the go, such as telehealth, can make a difference between a student stopping out and continuing their studies. Research finds that colleges receptive and supportive of mental health see a smaller population of students experiencing problems and higher rates of access.[58] Additionally, training staff to understand the circumstances and lifestyles of adult learners can go a long way in ensuring students get the support they need.[59] Stopped-out students are often older, hold greater responsibilities, and come from historically underserved communities where mental health is seen as a stigma and therefore goes undiagnosed or underdiagnosed. These factors make it more important to provide a range of support services that are accessible and ensure that staff are equipped with the cultural competence necessary to support students.
Academic Hurdles Can Limit Student Success
Academic obstacles such as improper advising and inflexibility in course schedule and availability can impede students from persisting and completing their degree, especially stopped-out students who are juggling personal responsibilities. In this section, we discuss why flexibility in course modality and proper advising are necessary to retain and support stopped-out students, providing examples of successful initiatives in higher education.
For many stopped-out students, flexibility is key to their success. Classes need to be accommodated around students’ existing lives, often prompting the question: “how can I minimize the amount of time I spend in class while maximizing the economic value of time spent in school?”[60] Almost all respondents in our survey stated flexibility in course availability and course schedule as a moderately to extremely important factor to their re-enrollment decisions.
Having the agency to build a schedule that is adaptable to specific needs is critical to support stopped-out students’ persistence and completion rates. Completion rates for adult learners in the 2015 cohort reached 51 percent, a promising data point.[61] But, this statistic masks an accurate understanding of completion and persistence rates of a smaller subset of this population. A separate analysis by the National Student Clearinghouse focused on the stopped-out learner population to identify completion rates of those who re-enrolled after December 2013 and graduated with a credential over a five-year period. Of the students who returned to pursue a postsecondary degree, 25 percent earned a degree, and an additional 29 percent were still enrolled as of December 2018.[62]
To ensure stopped-out students can persist, more attention needs to be paid to flexibility in course scheduling and course accessibility. Nearly 70 percent of all higher education institutions offer some form of varied course offering from evening and weekend only classes, accelerated program options, self-paced curriculum formats, or online classes.[63] These options allow stopped-out students to take classes at their own pace and even outside of the classroom, relieving the need to find childcare and enabling them to continue working to support their families. Adaptable course modalities, shorter-duration programs offered in “chunks,” or more lenient open-entry, open-exit policies that let adult learners drop out and return at a later point are all policies that can support adult learners in maximizing the economic value of their college experience and aid to their success in obtaining a postsecondary degree.[64]
Another form of academic support that is determinant of students’ success is academic advising. Ninety-one percent of survey respondents cite academic advising as a moderately to extremely important factor in their re-enrollment decisions. Similar to our results, 80 percent of participants in a survey by Sally Ann Goncalves and Dunja Trunk state that having an advisor specifically for nontraditional students would be beneficial in helping them navigate their educational journey.[65] Advisors are usually the only people who come face to face with students on a regular basis and who influence their retention at the institution. Many researchers have found that persistence and retention rates are influenced by the quality and level of interactions students have with faculty and staff, and high-touch advising during the first term of enrollment.[66]
Examples of successful initiatives include CUNY’s Accelerated Study in Associate Programs (ASAP), Monitoring Advising Analytics to Promote Success (MAAPS), and Stay the Course (STC). All three initiatives offered intensive and targeted advising and career services support to students and saw varying levels of success. The MAAPS initiative, conducted at 11 public universities, found that the graduation rate for the treatment group at Georgia State was seven percentage points higher than the control group. This increase was primarily driven by Black students whose graduation and persistence rates were 15 and 11 percentage points higher, respectively, than the control group.[67] CUNY ASAP and STC, in addition to individualized advising, offered comprehensive services like free MetroCards and textbooks, tuition waivers, emergency financial assistance, and mentoring outside of the classroom. CUNY ASAP almost doubled graduation rates and STC tripled associate degree completion for women.[68]
The quality and intensity of advising and wraparound services can help students stay on track and graduate. For students with stranded credits, this approach signifies commitment to their success and provides the level of support needed to stay on course while also managing their day-to-day responsibilities.
Financial Realities May Bar Re-Entry to Higher Education
Stopped-out students see increased value in the benefits gained from a postsecondary degree; however, the cost of an education compounded with costs related to personal obligations can be burdensome and push potential students away from re-enrolling. In this section we discuss financial obstacles like financial aid and tuition prices that prevent stopped-out students from enrolling and provide examples of aid that can be leveraged to support re-enrollment, persistence, and completion.
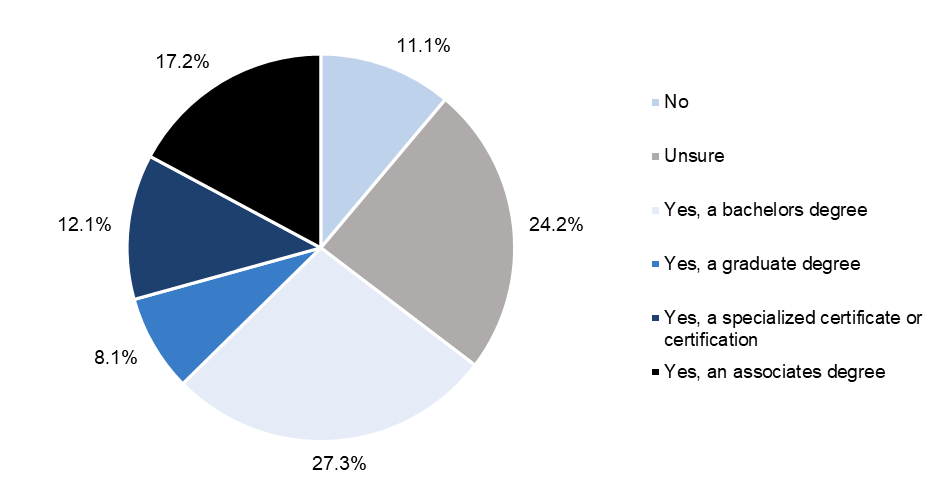
Despite difficulties associated with re-enrollment, persistence, and completion, Figure 10 illustrates that over two-thirds of survey respondents recognize a postsecondary credential is vital to their career growth and to achieve their professional goals. Furthermore, at the time of the survey, 58 percent of survey respondents indicated they were interested in re-enrolling in college in the future, suggesting interest in pursuing higher education. A report recently published by Lumina Foundation and Gallup, “The State of Higher Education,” conveys similar findings, showing that almost 70 percent of stopped-out students in 2023 believe that a postsecondary degree is equally or more important for a successful career today than it was 20 years ago.[69] Moreover, community college students who have obtained an associate degree or transferred to a four-year institution have been found to value their education at a higher rate than students who do not have a credential, which may be due to the increased labor market opportunities resulting from a credential.[70]
Figure 10: Respondents belief that their intended career path requires a postsecondary credential (n=99)
The recognition of a degree is mirrored in respondents’ perceptions of the value and cost of a degree, though the relationship between the two is not exactly linear. Approximately 74 percent of survey respondents believe that a college degree is worth the time, but considerably less (38 percent) believe it is worth the cost, approximately equal to the percentage of respondents who perceive a degree is not worth the cost. A 2021 survey by the Association of American Colleges and Universities (AAC&U) and Bipartisan Policy Center notes that six in 10 Americans say that a college degree is worth the time and money,[71] though the perception of worth varies across age, income, and political affiliation. Additionally, 71 percent of undergraduates currently enrolled nationwide believe the education they are receiving is worth the cost.[72]
Though these findings are aligned with our survey results, students with stranded credits are less likely to see the pursuit of a postsecondary degree as worth the cost, despite acknowledging its utility. One reason for this could be that stopped-out students are generally more financially independent than traditional college-aged students, often bearing full financial responsibility for pursuing an education in addition to other obligations. These findings may also reflect rising tuition costs, making college comparatively more expensive than when they were enrolled. Given the evidence of the financial benefits of a credential, it is important for researchers to continue examining the underlying explanation to better inform stopped-out students of the value proposition of a postsecondary education.
This opportunity cost of a degree is reflected among respondents who are employed and across the gender and racial spectrum. Similar to the overall survey group, 72 percent of employed respondents agree that a degree is worth the time, but when asked about cost, a large share (42 percent) report that a degree is not worth the cost. Disaggregating the data by gender, male (75 percent) and female (74 percent) respondents are both more likely to agree that a degree is worth the time it takes to pursue. There is an even split among female respondents when it comes to the cost of a degree (35 percent), but male respondents are more inclined to disagree that a college degree is worth the cost (47 percent).
Across race and ethnicity, mostly all survey respondents agree that a degree is worth the time, but not the cost. However, in comparison to other races and ethnicities, Black respondents perceive the utility of a degree to be higher than others, with respect to both time (75 percent) and money (47 percent). The 2023 State of Higher Education report by Lumina Foundation similarly found that a higher percentage of Black (72 percent) stopped-out adults considered re-enrolling in a college in the past two years than white stopped-out adults (55 percent).[73] These findings point to Black adults’ greater emphasis on the value of a postsecondary degree, arising from systemic conditions that dictate the need for higher levels of credentials to land positions comparable to their non-Hispanic white counterparts.
The reality of college affordability, however, continues to be a reason for pause for many stopped-out students. Almost all the survey respondents report the price of education and financial aid as moderately to extremely important factors in their decision to re-enroll. Similar conclusions were put forth in a survey by Lumina Foundation, where unenrolled adults identified financial barriers including the cost of their intended program (55 percent) and affordability due to inflation (45 percent), as reasons for remaining unenrolled.[74] Although many students pay a net price that is lower than published sticker prices after financial aid is applied, the cost of college is still unattainable for many students.[75]
For stopped-out students with dependent children, the cost of college often becomes a distant dream. A report by Education Trust calculated the “affordability gap” for student parents—the price of college tuition after grants, scholarships, and earnings from working 10 hours per week and accounting for the cost of childcare. The bottom line: there is no state in which a student parent can work for 10 hours per week at minimum wage and afford both tuition at a public college or university and child care.[76] On average, student parents would need to work anywhere between 30 to 90 hours a week to comfortably cover child care and tuition costs at a public college or university.[77] Having to pay for child care, food, housing, and other expenses, student parents are still left with a tuition bill amounting to thousands of dollars.
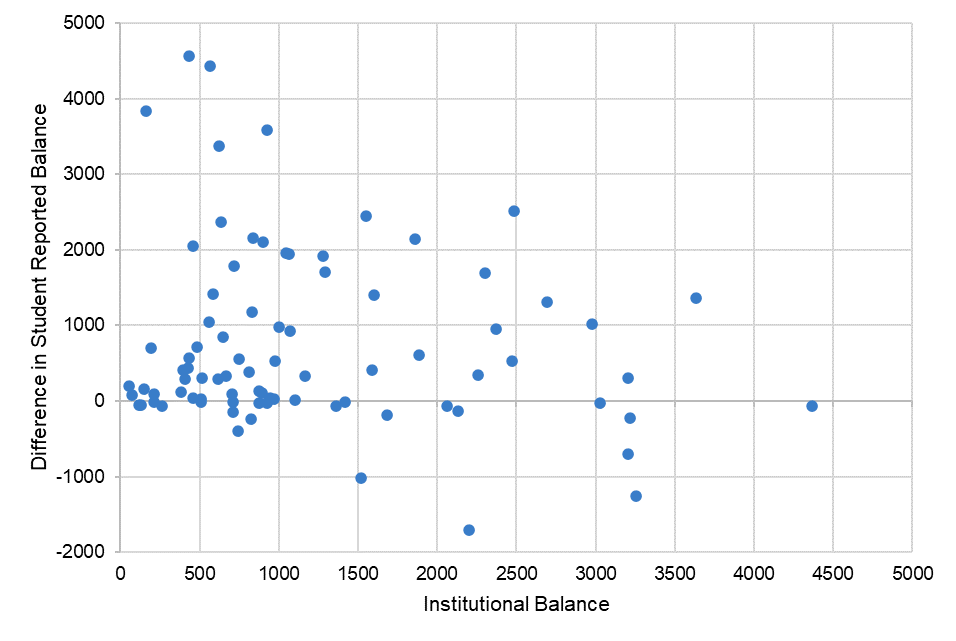
The perceived cost of education has been shown to prevent students from applying and shapes their enrollment decisions.[78] This is an issue that persists in the context of institutional debt. Figure 11 shows students with stranded credits overestimate their debt, sometimes by thousands of dollars. The mismatch in debt estimation is more pronounced for Black survey respondents than for white survey respondents. These findings provide more evidence for why the small investment in emergency aid or debt forgiveness can lower a hurdle that students think is insurmountable—especially for underrepresented minorities who are often lower-income and face financial hurdles more frequently than non-Hispanic white students. Supplementing assistance with accurate debt information at the beginning of the enrollment process may also influence students’ decision to enroll.
Figure 11: Respondents estimation of debt compared to their institutional balance (n=84)
Unfortunately, financial aid distribution in the form of grants, loans, and work-study is not always equitable. Recent research highlights the disparity in aid distribution, with more grant-based aid allocated towards students from higher-income households than those from lower-income backgrounds.[79] In some cases, students from lower-income backgrounds may never receive the aid for which they are eligible. In 2017, an analysis by The Hechinger Report found that more than 900,000 low-income students who applied for aid and found to be eligible, failed to receive any simply because states ran out of money.[80] This shortfall in the receipt of aid forces students to take responsibility for the remaining tuition and other expenses like food, housing, books, transportation, and childcare. The implications of these unequal policies make it more important that institutions allocate various types of aid to assist with expenses beyond tuition during a student’s time in college. For students with stranded credits, aid received to help pay for extra expenses can mean the difference between staying enrolled and dropping out.
Emergency aid programs are popular initiatives devoted to providing specific services from housing vouchers, household bill payments, childcare stipends, etc. Such support can prevent students from derailing on their path to success, compelling many institutions, especially community colleges, to offer more comprehensive aid. For example, Amarillo College’s No Excuses Poverty Initiative, which provides a variety of support services, saw an increase in student retention and graduation rates after providing wraparound financial support.[81] Other types of support include retention and completion grants to support students who need modest amounts of aid to continue their education. Different from other types of aid, these grants typically only cover tuition and are offered to students who may be at risk of stopping out and after all other sources of financial aid have been exhausted.[82]
Coupled with emergency aid or other grants, debt forgiveness programs can serve as an avenue for jumpstarting students’ educational journeys. These programs encourage students to make a second attempt, removing past debt that may be a barrier to re-enrollment efforts. The most prominent example of such a program is Wayne State’s Warrior Way Back program aimed at students who have been out of school for at least two years and owe less than $1,500 to their former institution. As of 2020, the program had 209 enrollees, 28 graduates, and 20 transfers. Not only did the program result in positive returns for students, but Wayne State University also saw a substantial return on investment of approximately $750,000.[83]
Conclusion
Our findings show that students with stranded credits who were deemed eligible to re-enroll in the Ohio Compact need comprehensive social, academic, and financial assistance to support their ability to successfully obtain a credential. These supports, however, cannot occur in silos. The success of programs like CUNY ASAP and Amarillo College’s No Excuses Poverty Initiative are a result of the immediacy of emergency aid distribution, the coupling of academic and non-academic support together to provide extensive services to aid students’ lives inside and outside of the college campus, and proactiveness and dedication by college staff in working with students the moment they arrive. For example, CUNY ASAP not only provides dedicated support in the form of dedicated advising or block scheduling, but students are given money for transportation and purchasing books.[84] Amarillo’s initiative works with students the moment they arrive, reaching out to students rather than waiting for students to come to them to assess their needs and provide solutions that can be accessed quickly.
We find that Compact eligible students recognize the merit of a postsecondary degree for their intended career goals but are hampered by multiple barriers that can thwart their efforts to re-enroll. Assistance such as childcare, food pantries, housing support, or even on-the-go mental health services can help stopped-out students focus on their academic future. Flexibility in course modality and scheduling creates a sense of agency, meeting the needs of stopped-out students whose day to day may look vastly different than that of first-time students. Finally, financial support like emergency aid, grants, and debt forgiveness are critical to help students stay on track.
The Ohio Compact is a novel program designed to accelerate students’ journey back to higher education. The promise of eliminating a debt can sometimes be enough to encourage students to re-enroll, especially considering that many students overestimate how large their debt is. In fact, just the existence of debt has been linked to increased financial stress, attrition, and a host of mental health challenges.[85] This risk factor is exacerbated along racial and gender lines with female, Black, and Hispanic adults citing cost and affordability as a barrier to enrollment more than their peers, widening the equity gap and pointing to a more pronounced need for support.[86] With the first hurdle overcome, the question now becomes: “how can institutions guarantee these students’ renewed educational journey is not disrupted once again?”
Wraparound services are integral for students’ immediate needs and their long-term aspirations, as well as institutional and state strategic priorities. Earning a postsecondary degree can lead to an earnings boost of $70,000 annually and $2.8 million over a lifetime[87]—income that can go a long way towards helping students of color, low-income students, and students from marginalized communities build stable and secure financial futures. Beyond financial stability, a bachelor’s degree can increase civic participation, lead to improved health outcomes, and even increase homeownership, substantially improving the physiological well-being of students and their families.[88]
For institutions, well-designed programs that provide comprehensive support are shown to improve retention and persistence rates, especially for community college students.[89] Enrolling stopped-out students is also important for institutional diversity, equity, and inclusion (DEI) efforts. Two-year institutions enroll more than a third of undergraduate Black students, approximately half of Native American and Hispanic students, and 64 percent of first-generation students, making them ground zero for students aiming for a postsecondary degree.[90] Encouraging these populations to re-enroll, and providing the necessary supports to help them succeed, makes sense when aiming to serve a diverse class of students and fulfill DEI initiatives.
Many states have developed ambitious postsecondary attainment goals based on projected workforce needs, and increasing re-enrollment provides a direct return on their investment in higher education. States often can lose out when providing financial aid, subsidies, and grants to students who ultimately leave higher education.[91] By removing barriers to enable students’ return, states can benefit from their investment and realize their workforce objectives. Most states are not on track to meet their goals, indicating the imperative of addressing barriers to enrollment and retention.[92] Additionally, the completion of a degree can mean more local and state tax revenue since postsecondary degrees lead to higher purchasing power and less government dependence.[93]
The COVID-19 pandemic has exacerbated the perils and difficulties of ordinary life, pushing adult learners further away from successful degree completion and disrupting state and institutional efforts to meet attainment goals. To push towards progress, it is vital to consider institutional programs that eliminate barriers to entry and retention. Forgiving institutional debt is the initial step to bringing students with stranded credits back. Programs like the Ohio Compact are crucial interventions and, when supplemented with comprehensive support, are more likely to help students stay on course and accomplish their dreams.
Appendix A: Fall 2022 Ohio College Comeback Compact Student Survey
Survey Questions
The Ohio College Comeback Compact is a collaboration among eight public colleges and universities, supported by nonprofits Ithaka S+R and College Now Greater Cleveland, as well as the Ohio Department of Higher Education. The eight participating institutions are Cleveland State University, Cuyahoga Community College, Kent State University, Lakeland Community College, Lorain County Community College, Stark State College, The University of Akron, and Youngstown State University. The Compact allows students to re-enroll at any of the eight participating colleges or universities, and have up to $5,000 of their institutional debt forgiven and their transcript hold released after the completion of two terms or upon graduation.
The following questions in this survey aim to ask you about your experience and decision to re-enroll (or not re-enroll) in college through the Ohio College Comeback Compact, as well as to understand how the debt you owe to your previous institution led you to put your education on hold. Questions related to debt refer to institutional debt that you owe directly to your previous college or university. Institutional debt is commonly the result of a past library fine, overdue parking ticket, or unpaid tuition fees. Federal, state, or private loans are not considered institutional debt and should not be accounted for when answering the questions. Additionally, these are debts that the institution has sent to the Ohio Attorney General’s Office, but are still owed to the institution.
Ithaka S+R is a nonprofit research and advisory organization based out of New York. We are conducting this survey as part of our research efforts to improve opportunities for students like you. We plan to report compiled and anonymous survey results.
Your participation in this survey is completely voluntary and will not impact your eligibility for the Ohio Compact or any other debt relief service. It should take you roughly 10 minutes to complete the survey. To compensate you for your time, we will be giving away one $25 gift card for every 25 responses (up to $800). At the end of the survey, we will also ask for volunteers to have follow-up interviews about their experiences with institutional debt and returning to college. Participation in these interviews are completely voluntary and will come with additional compensation for your time.
By clicking “Next” you give Ithaka S+R consent to use your survey responses for research purposes. Your responses will only be used to better understand the Ohio Compact and improve future programs that can help reduce student debts. Your identity and the information submitted through this form will remain confidential (required by rule 3332-1-14(D) of the Ohio Administrative Code).
Current Higher Education Enrollment/Opinions
We would like to ask you questions about your current opinions about education and enrollment status.
- Are you currently enrolled in a college or university program?
- Yes, I re-enrolled via the Ohio College Comeback Compact at one of the eight participating institutions (Cleveland State University, Cuyahoga Community College, Kent State University, Lakeland Community College, Lorain County Community College, Stark State College, The University of Akron, and Youngstown State University)
- Yes, I re-enrolled at one of the eight participating institutions, but not via the Ohio College Comeback Compact
- Yes, I am enrolled in a different institution that is not affiliated with the Ohio Compact
- No, but I am interested in re-enrolling in the future
- No, I am not interested in any additional education
- Do you think a college degree is worth the time it takes to earn one?
- Yes
- No
- Unsure
- Do you think a college degree is worth the cost it takes to earn one?
- Yes
- No
- Unsure
- How important do you think each of the following aspects of your educational experience is for your success at your current or future institution, if you were to re-enroll?
- Course schedule
- Course availability
- Academic advising
- Career services
- College coach or navigator
- Price of education
- Financial aid
- Campus amenities (e.g., community centers, athletic facilities, etc.)
- Social supports (e.g., childcare, food pantry, etc.)
- Feeling like you belong in the campus community
- Other ___________
- Likert 1-5 scale (not at all important – extremely important)
Previous Higher Education Enrollment
Now, we will ask you questions about your previous education experience.
5. When you were last enrolled at your institution, what were the reason(s) for not continuing your education (select all that apply)?
-
- Finances
- Family obligations
- Work obligations
- Transportation issues
- Food insecurity
- Homelessness/lack of stable housing
- Class schedules or availability
- Academic probation
- Other ______
6. What credential were you pursuing when you were at your last institution?
-
- A certificate
- Associate’s
- Bachelor’s
7. During your previous enrollment in higher education, how would you rate your satisfaction with the following aspects of your educational experience
a. Course schedule
b. Course availability
c. Academic advising
d. Career services
e. College coach or navigator
f. Price of education
g. Financial aid
h. Campus amenities (e.g., community centers, athletic facilities, etc.)
i. Social supports (e.g., childcare, food pantry, etc.)
j. Feeling like you belonged in the campus community
k. Other ___________
-
-
- Likert 1-5 scale (not at all satisfied – extremely satisfied)
-
Student’s Awareness of Their Debt, Amount Owed, To Which Institutions
Now we are going to ask you some questions about institutional debt. These are debt owed directly to institutions for a past due bill. These are not student loan debts.
8. To the best of your knowledge, in July 2022, did you have an outstanding debt to any of the following institutions:
a. Cleveland State University
b. Cuyahoga Community College
c. Kent State University
d. Lakeland Community College
e. Lorain County Community College
f. Stark State College
g. The University of Akron
h. Youngstown State University
i. I did not have an outstanding debt at any of the institutions listed above
9. What was your total outstanding debt owed directly to Ohio Compact institutions in July 2022 (an estimation is fine):
-
- Open ended
10. What were the reason(s) for incurring debt (select all that apply)?
-
- My institution made an error that resulted in debt
- I intended to enroll at my institution, but did not attend the semester
- I left my institution in the middle of the semester or withdrew after the deadline and owe money to my institution
- I was forced to leave my institution due to personal obligations (e.g., caring for a family member)
- My financial aid did not fully cover my tuition and fees
- I received unexpected financial charges from the institution (e.g., library fines)
- I encountered unexpected financial costs (e.g., car repair, health expenses) other than educational expenses that prevented me from fully paying my tuition and fees
- Other
- Open ended
Current Employment Status and Future Plans
We’d like to understand your current employment status and future plans.
11. Are you currently employed?
a. Yes
b. No, and I am not actively searching for employment
c. No, and I am actively searching for employment
-
-
- If yes (11a), Which industry best describes your employment?
- Management Occupations
- Business and Financial Operations Occupations
- Computer and Mathematical Occupations
- Architecture and Engineering Occupations
- Life, Physical, and Social Science Occupations
- Community and Social Service Occupations
- Legal Occupations
- Educational Instruction and Library Occupations
- Arts, Design, Entertainment, Sports, and Media Occupations
- Healthcare Practitioners and Technical Occupations
- Healthcare Support Occupations
- Protective Service Occupations
- Food Preparation and Serving Related Occupations
- Building and Grounds Cleaning and Maintenance Occupations
- Personal Care and Service Occupations
- Sales and Related Occupations
- Office and Administrative Support Occupations
- Farming, Fishing, and Forestry Occupations
- Construction and Extraction Occupations
- Installation, Maintenance, and Repair Occupations
- Production Occupations
- Transportation and Material Moving Occupations
- Are you employed full-time or part-time?
- Full-time
- Part-time
- To the best of your knowledge, does your current employer offer financial assistance for your education?
- Yes, my employer offers financial assistance or other supports related to my education
- No, my employer does not offer any assistance related to my education
- If no, (11b), why are you not seeking employment?
- I am disabled and unable to work
- I am a full-time parent
- I have full-time caregiver responsibilities for someone other than my children
- I am enrolled full-time in the Compact or a non-Compact related institution
- I do not have access to reliable transportation
- Other: ______________
- If no (11c), in which industry are you seeking employment?
- Management Occupations
- Business and Financial Operations Occupations
- Computer and Mathematical Occupations
- Architecture and Engineering Occupations
- Life, Physical, and Social Science Occupations
- Community and Social Service Occupations
- Legal Occupations
- Educational Instruction and Library Occupations
- Arts, Design, Entertainment, Sports, and Media Occupations
- Healthcare Practitioners and Technical Occupations
- Healthcare Support Occupations
- Protective Service Occupations
- Food Preparation and Serving Related Occupations
- Building and Grounds Cleaning and Maintenance Occupations
- Personal Care and Service Occupations
- Sales and Related Occupations
- Office and Administrative Support Occupations
- Farming, Fishing, and Forestry Occupations
- Construction and Extraction Occupations
- Installation, Maintenance, and Repair Occupations
- Production Occupations
- Transportation and Material Moving Occupations
- If yes (11a), Which industry best describes your employment?
-
12. Does your intended career path require a post-high school credential?
-
- Yes, a specialized certificate or certification
- Yes, an associate’s degree
- Yes, a bachelor’s degree
- Yes, a graduate degree
- No
- Unsure
Motivation Scale
We would now like to ask you some questions about how you deal with problems and tasks you encounter.
13. To what extent do the following statements apply to you?
-
- When I hear or read about new ideas, I try to relate them to real life situations to which they might apply.
- I like learning new things.
- When I come across something new, I try to relate it to what I already know.
- I like to get to the bottom of difficult things.
- I like to figure out how different ideas fit together.
- If I don’t understand something, I look for additional information to make it clearer.
- Answers:
- Not at all
- Very little
- To some extent
- To a high extent
- To a very high extent
- Answers:
Current Living Situation
Now we’re going to ask you some questions about your living situation in the past 12 months.
14. In July 2022, how would you describe your residential environment?
-
- I lived in a large, metropolitan area
- I lived in a suburban area
- I lived in a rural area
15. In the past 12 months, was there a rent or mortgage increase that made it difficult to pay?
-
- Yes
- No
16. In the past 12 months, did you not pay or underpay your rent or mortgage?
-
- Yes
- No
17. In the past 12 months, have you moved two times or more?
-
- Yes
- No
18. Where did you sleep last night?
-
- In an emergency shelter, safe haven, or transitional housing project?
- In an institution (including hospital, jail, prison, juvenile detention facility, long-term care facility, or nursing home)?
- In a place not meant for human habitation (including in a car, unsheltered on the street or under a bridge, etc.)
- In housing you shared with others, but you do not own or rent, and can only stay temporarily?
- In housing you shared with others, but you do not own or rent, and you can stay permanently?
- In housing you rented?
- In housing you owned?
19. Has the difficulty in paying your mortgage or rent, being homeless, or being forced to move more than once made it more difficult to attend class, take an exam, or participate in campus life while being enrolled in a Compact institution?
-
- Yes
- No
- Unsure
20. Was the difficulty in paying your mortgage or rent, being homeless, or being forced to move more than once a factor in your decision not to re-enroll in a Compact institution?
-
- Yes
- No
- Unsure
21. Are you a parent?
-
- Yes
- No
- I and/or my partner are expecting a child
- Are your childcare needs being met?
- Yes
- No
- Has the lack of proper childcare prevented you from re-enrolling in the Compact or made it more difficult to attend class, take an exam, or participate in campus life while being enrolled in a Compact institution?
- Yes
- No
- Unsure
- Are your childcare needs being met?
22. Are you currently taking care of someone other than yourself?
-
- Yes, I have dependent children
- Yes, I am a caregiver to my spouse or other family member
- No, I do not have caregiver responsibilities
- Has your responsibility as a parent or caregiver made it more difficult to attend class, take an exam, or participate in campus life while being enrolled in a Compact institution?
- Yes
- No
- Unsure
- Has your responsibility as a parent or caregiver made it more difficult to attend class, take an exam, or participate in campus life while being enrolled in a Compact institution?
23. Were your parental or caregiver responsibilities, or lack thereof, a factor in your Compact enrollment decision?
-
- Yes
- No
- Unsure
Transportation
Now we would like to ask you some questions about your transportation options.
24. Do you currently have consistent access to a reliable car or bike or public transportation like a bus, train, or subway to commute to class?
-
- Yes, I have access to and use a bike, car or public transportation to commute to and from class
- No, I do not have access to consistent and reliable transportation to commute to and from class
- Has the lack of access to consistent and reliable transportation made it more difficult to attend class, take an exam, or participate in campus life while being enrolled in a Compact institution?
- Yes
- No
- Unsure
- Was the lack of access to consistent and reliable transportation a factor in your decision not to re-enroll in a Compact institution?
- Yes
- No
- Unsure
- Has the lack of access to consistent and reliable transportation made it more difficult to attend class, take an exam, or participate in campus life while being enrolled in a Compact institution?
Food Insecurity
This section asks about your experiences with food over the past 30 days.
25. The food that I bought just didn’t last, and I didn’t have money to get more. Was that often, sometimes, or never true for you in the last 30 days?
-
- Often True
- Sometimes True
- Never True
- Unsure
26. I couldn’t afford to eat balanced meals. Was that often, sometimes, or never true for you in the last 30 days?
-
- Often True
- Sometimes True
- Never True
- Unsure
27. In the last 30 days, did you ever cut the size of your meals or skip meals because there wasn’t enough money for food?
-
- Yes
- No
- Unsure
- How often did this happen?
- Almost every day
- Some days but not every day
- Only 1 or 2 days
- Unsure
- How often did this happen?
28. In the last 30 days, did you ever eat less than you felt you should because there wasn’t enough money for food
-
- Yes
- No
- Unsure
29. In the last 30 days, were you ever hungry but didn’t eat because there wasn’t enough money for food?
-
- Yes
- No
- Unsure
30. Has the lack of money and/or access to buy food or eat a balanced meal, made it more difficult to attend class, take an exam, or participate in campus life while being enrolled in a Compact institution?
-
- Yes
- No
- Unsure
31. Did the lack of money and/or access to buy food or eat a balanced meal factor into your decision not to re-enroll in a Compact institution?
-
- Yes
- No
- Unsure
Identity/Demographics
We are almost done! Just a few demographic questions to answer:
32. How do you describe your race and/or ethnicity?
-
- Open ended question
33. How do you best identify your immigration or citizenship status?
-
- U.S.-born citizen, with at least one non-U.S. born parent
- U.S. -born citizen, with U.S. born parents
- Naturalized U.S. citizen
- Permanent resident
- Foreign-born citizen, with at least one U.S. born parent
34. Do you consider yourself a member of the LGBTQ+ community?
-
- Yes
- No
35. Income status
-
- What is your annual household income?
- $0 – $30,000
- $30,001-$48,000
- $48,001-$75,000
- $75,001-$110,000
- $110,001 and above
- What is your annual household income?
Interview Participation
36. As part of the research process, we are conducting individual interviews to understand the lived experiences of having stranded credits. We are seeking interview participants that did and did not re-enroll as part of the Ohio Compact. Participating in an interview will not impact your eligibility for the Compact. Participation is completely optional and participants will receive compensation for their time. Are you interested in being contacted to be a potential interview participants?
-
- Yes. My email address is: _____________. My phone number is: ____________
- No.
Closing Message
Thank you for participating in this survey! Your feedback is valuable and will help in making sure the Ohio Compact meets students’ needs. If you would like to learn more about our research, you can find our previous research reports on this important topic here.
Endnotes
- Melanie Hanson, “Student Loan Debt Statistics,” Education Data Initiative, 17 July 2023, https://educationdata.org/student-loan-debt-statistics. ↑
- Julia Karon, James Dean Ward, Catharine B. Hill, and Martin Kurzweil, “Solving Stranded Credits: Assessing the Scope and Effects of Transcript Withholding on Students, States, and Institutions,” Ithaka S+R, 5 October 2020, https://doi.org/10.18665/sr.313978. ↑
- Ibid. ↑
- Sosanya Jones and Melody Andrews, “Stranded Credits: A Matter of Equity,” Ithaka S+R, 17 August 2021, https://doi.org/10.18665/sr.315765. ↑
- Wendy Kilgore, “Stranded Credits: Another Perspective on the Lost Credits Story,” American Association of Collegiate Registrars and Admissions Officers (AACRAO), August 2020, aacrao-stranded-credits-report-2020.pdf. ↑
- Sarah Pingel, “Lost and Found: State and Institutional Actions to Resolve Stranded Credits,” Ithaka S+R, 7 July 2022, https://doi.org/10.18665/sr.316883; Alessandra Cipriani-Detres and Sarah Pingel, “Stranded Credits: State-Level Actions and Opportunities,” Ithaka S+R, 15 August 2022, https://sr.ithaka.org/blog/stranded-credits-state-level-actions/; “Biden-Harris Administration Releases Final Rules That Strengthen Accountability for Colleges and Consumer Protection for Students | U.S. Department of Education,” US Department of Education, accessed November 1, 2023, https://www.ed.gov/news/press-releases/biden-harris-administration-releases-final-rules-strengthen-accountability-colleges-and-consumer-protection-students. ↑
- “College Comeback,” The Ohio Department of Higher Education, 2023, https://highered.ohio.gov/initiatives/affordability/college-comeback. ↑
- The terms “stopped-out students,” “students with stranded credits,” and “survey respondents,” are used interchangeably throughout this report. For the purposes of this report, these terms refer to Compact eligible students who have stopped out, owe an institutional debt to their institution, and have a hold on their account. ↑
- “Census Profile: Ohio,” Census Reporter, accessed 18 October 2023, http://censusreporter.org/profiles/04000US39-ohio/. ↑
- “Three Key Challenges To Meeting Adult Learners’ Needs—And How To Solve Them,” Guild Education and Higher Ed Div, n.d. Guild-Higher Ed Dive-Survey Report-021422-WEB (2).pdf (guildeducation.com). ↑
-
A comprehensive evaluation report will be released in 2024.
- There were approximately 2,000 students who were identified by institutions, but were not identified in OAG records. These students were later added to the Fall 2022 eligibility list in September 2022 and were not part of our outreach for the survey. ↑
- “2020-2021 Enrollment Trends by Race/Ethnicity and Gender,” National Center for Education Statistics, IPEDS, n.d.; “Census Profile: Ohio,” Census Reporter, accessed 18 October 2023, http://censusreporter.org/profiles/04000US39-ohio/. ↑
- Bradley R. Curs, Casandra E. Harper, and Justin Kumbal, “Institutional Inequities in the Prevalence of Registration Sanctions at a Flagship Public University,” Journal of Diversity in Higher Education, 21 July 2022, https://doi.org/10.1037/dhe0000432; Sosanya Jones and Melody Andrews, “Stranded Credits: A Matter of Equity,” Ithaka S+R, 17 August 2021, https://doi.org/10.18665/sr.315765. ↑
- A. J. Causey, A. Gardner, M. Pevitz, Ryu, and D. Shapiro, “Some College, No Credential Student Outcomes: Annual Progress Report–Academic Year 2021/22,” National Student Clearinghouse, April 2023, https://nscresearchcenter.org/wp-content/uploads/SCNCReport2023.pdf. ↑
- David Cantor, Bonnie Fisher, and Susan Chibnall, “Report on the AAU Campus Climate Survey on Sexual Assault and Misconduct,” Westat, 17 January 2020, https://www.aau.edu/sites/default/files/AAU-Files/Key-Issues/Campus-Safety/Revised%20Aggregate%20report%20%20and%20appendices%201-7_(01-16-2020_FINAL).pdf. ↑
- Jeffrey M. Jones, “LGBT Identification in U.S. Ticks Up to 7.1%,” Gallup, 17 February 2022, https://news.gallup.com/poll/389792/lgbt-identification-ticks-up.aspx. ↑
- “The State of Higher Education 2023,” Lumina Foundation and Gallup, 4 May 2023, https://www.luminafoundation.org/wp-content/uploads/2023/05/State-of-Higher-Education-2023.pdf. In the report “unenrolled” students are classified as students who do not have a college degree because they stopped out or because they have never enrolled in any postsecondary institution. ↑
- “Return of Title IV Funds (R2T4) | Library | Knowledge Center,” Federal Student Aid, US Department of Education, accessed 17 October 2023, https://fsapartners.ed.gov/knowledge-center/library/functional-area/Return%20of%20Title%20IV%20Funds%20%28R2T4%29. ↑
- Sosanya Jones and Melody Andrews, “Stranded Credits: A Matter of Equity,” Ithaka S+R, 17 August 2021, https://doi.org/10.18665/sr.315765. ↑
- Ibid. ↑
- “Ohio Employment Report,” Joint Economic Committee, accessed 17 October 2023, https://www.jec.senate.gov/cards/__employment-updates/Ohio%20Employment%20Report.html. Labor force participation rate is defined as those who are employed and actively seeking employment. ↑
- Lindsay M. Woodbridge, Byeolbee Um, and David K. Duys, “Women’s Experiences Navigating Paid Work and Caregiving During the COVID‐19 Pandemic,” The Career Development Quarterly 69, no. 4 (December 2021): 284–98, https://doi.org/10.1002/cdq.12274; Diana Boesch and Katie Hamm, “Valuing Women’s Caregiving During and After the Coronavirus Crisis,” Center for American Progress, 3 June 2020, https://www.americanprogress.org/article/valuing-womens-caregiving-coronavirus-crisis/. ↑
- “The Hope Center Survey 2021: Basic Needs Insecurity During the Ongoing Pandemic,” The Hope Center for College, Community, and Justice, 31 March 2021, https://hope.temple.edu/sites/hope/files/media/document/HopeSurveyReport2021.pdf. ↑
- “The Hope Center Survey 2021: Basic Needs Insecurity During the Ongoing Pandemic,” The Hope Center for College, Community, and Justice, 31 March 2021, https://hope.temple.edu/sites/hope/files/media/document/HopeSurveyReport2021.pdf. ↑
- Alvaro Mezza, Daniel Ringo, Shane Sherlund, and Kamila Sommer, “Student Loans and Homeownership,” Journal of Labor Economics 38, no. 1 (January 2020): 215–60, https://doi.org/10.1086/704609. ↑
- Gender information was collected through institution administrative data which reports in accordance with IPEDS. Therefore, we only report gender as male and female. ↑
- “DataLab,” National Center for Education Statistics, accessed 17 October 2023, https://nces.ed.gov/datalab/powerstats/152-national-postsecondary-student-aid-study-administrative-collection-2018-undergraduates/percentage-distribution. Post-traditional students are typically over the age of 24 and have one or more of the following characteristics: they delayed enrollment in college after high school, attend college part-time for at least part of the academic year, work full-time while enrolled, are financially independent, or have dependents (spouse and/or children). ↑
-
“Experiences of US Households With Children During the Delta Varient Outbreak,” NPR, Robert Wood Johnson Foundation, and Harvard T.H. Chan School of Public Health, October 2021, households-children-virus-poll.pdf.
- Jean Johnson and Jon Rochkind, “With Their Whole Lives Ahead of Them: Myths and Realities about Why So Many Students Fail to Finish College,” Public Agenda, 2009, https://files.eric.ed.gov/fulltext/ED507432.pdf; “Time Demands of Single Mother College Students and the Role of Child Care in Their Postsecondary Success,” Institute for Women’s Policy Research, May 2018, IWPR #C468, https://iwpr.org/wp-content/uploads/2020/10/C468.pdf. ↑
- Kristi Johns, Marlee Breakstone, and Nicole Lynn Lewis, “The Child Care Barrier: The Impacts of Inaccessible and Costly Child Care for Student Parents,” Generation Hope, n.d. ↑
- Ben Wildavsky, “Meeting the Needs of Working Adult Learners,” The Chronicle of Higher Education and Guild Education, 2021, https://connect.chronicle.com/rs/931-EKA-218/images/ServingPostTraditionalStudents_GuildEducation.pdf. ↑
- Kristi Johns, Marlee Breakstone, and Nicole Lynn Lewis, “The Child Care Barrier: The Impacts of Inaccessible and Costly Child Care for Student Parents,” Generation Hope, n.d. ↑
- “Student Parents’ Access to Campus Child Care Continued to Decline in 2015,” Institute for Women’s Policy Research, July 2016, https://iwpr.org/wp-content/uploads/2020/09/Q051-Campus-Child-Care-2002-15.pdf. ↑
- “Revisiting CCAMPIS During COVID-19: The Untapped Potential of On-Campus Child Care,” Bipartisan Policy Center, 28 July2020, https://bipartisanpolicy.org/explainer/revisiting-ccampis-during-covid-19-the-untapped-potential-of-on-campus-child-care/; Elissa Nadworny, “Vital Federal Program To Help Parents In College Is ‘A Drop In The Bucket,’” NPR, 24 October 2019, https://www.npr.org/2019/10/24/772018032/vital-federal-program-to-help-parents-in-college-is-a-drop-in-the-bucket; Nina Besser Doorley, Salma Elakbawy, and Afet Dundar, “State Policy for Student Parent Success: A Landscape Scan of Policy Solutions Enacted at the State Level,” Institute for Women’s Policy Research, August 2023, https://iwpr.org/wp-content/uploads/2023/08/Student-Parent-State-Policy-Brief-FINAL.pdf. ↑
- Brittani Williams, Jinann Bitar, Portia Polk, Andre Nguyen, Gabriel Montague, Carrie Gillispie, Antoinette Waller, Azeb Tadesse, and Kayla C. Elliott, “For Student Parents, The Biggest Hurdles to A Higher Education Are Costs and Finding Child Care,” The Education Trust and Generation Hope, August 2022, https://edtrust.org/wp-content/uploads/2014/09/For-Student-Parents-The-Biggest-Hurdles-to-a-Higher-Education-Are-Cost-and-Finding-Child-Care-August-2022.pdf. ↑
- Ibid; “Paying for College as a Student Parent Is…Complicated,” Wellesley Centers for Women, accessed 18 October 2023, https://www.wcwonline.org/WCW-Blog-Women-Change-Worlds/Paying-for-college-as-a-student-parent-is-complicated. ↑
- A.H. Maslow, “A Theory of Human Motivation,” Psychological Review 50, no. 4 (1943): 370–96, https://doi.org/https://doi.org/10.1037/h0054346. ↑
- William G. Tierney and James Dean Ward, “Coming Out and Leaving Home: A Policy and Research Agenda for LGBT Homeless Students,” Educational Researcher 46, no. 9 (2017): 498-507. ↑
-
“The Hope Center Survey 2021: Basic Needs Insecurity During the Ongoing Pandemic,” The Hope Center for College, Community, and Justice, 31 March 2021, https://hope.temple.edu/sites/hope/files/media/document/HopeSurveyReport2021.pdf.
- Sara Goldrick-Rab, Christine Baker-Smith, Elizabeth Looker, Tiffani Williams, and Vanessa Coca, “College and University Basic Needs Insecurity: A National #RealCollege Survey Report,” The Hope Center for College, Community, and Justice, April 2019, https://www.insidehighered.com/sites/default/files/media/HOPE_realcollege_National_report_EMBARGOED%20UNTIL%20APRIL%2030%203%20AM%20EST%20(1).pdf. ↑
- Katharine Broton, “Poverty in American Higher Education: The Relationship Between Housing Insecurity and Academic Attainment,” Journal of Postsecondary Student Success 1, no. 2 (14 December 2021): 18–45, https://doi.org/10.33009/fsop_jpss129147; Rebecca L. Hagedorn-Hatfield, Lanae B. Hood, and Adam Hege, “A Decade of College Student Hunger: What We Know and Where We Need to Go,” Frontiers in Public Health 10 (25 February 2022): https://doi.org/10.3389/fpubh.2022.837724. ↑
- Maya E. Maroto, Anastasia Snelling, and Henry Linck, “Food Insecurity Among Community College Students: Prevalence and Association With Grade Point Average,” Community College Journal of Research and Practice 39, no. 6 (3 June 2015): 515–26, https://doi.org/10.1080/10668926.2013.850758. ↑
- Katharine Broton, “Poverty in American Higher Education: The Relationship Between Housing Insecurity and Academic Attainment,” Journal of Postsecondary Student Success 1, no. 2 (14 December 2021): 18–45, https://doi.org/10.33009/fsop_jpss129147. ↑
-
“The Hope Center Survey 2021: Basic Needs Insecurity During the Ongoing Pandemic,” The Hope Center for College, Community, and Justice, 31 March 2021, https://hope.temple.edu/sites/hope/files/media/document/HopeSurveyReport2021.pdf.
- Ibid. ↑
- Essie Ladkau and James Ward, “Supporting Low-Income Students with SNAP,” Ithaka S+R, 28 April 2022, https://doi.org/10.18665/sr.316676. ↑
- Rebecca L. Hagedorn-Hatfield, Lanae B. Hood, and Adam Hege, “A Decade of College Student Hunger: What We Know and Where We Need to Go,” Frontiers in Public Health 10 (25 February 2022) https://doi.org/10.3389/fpubh.2022.837724. ↑
- Ibid. ↑
- Katharine Broton, “Poverty in American Higher Education: The Relationship Between Housing Insecurity and Academic Attainment,” Journal of Postsecondary Student Success 1, no. 2 (14 December 2021): 18–45, https://doi.org/10.33009/fsop_jpss129147. ↑
- Ibid. ↑
- Sara Goldrick-Rab, Jed Richardson, Joel Schneider, Anthony Hernandez, and Clare Cady, “Still Hungry and Homeless in College,” Wisconsin Hope Lab, April 2018, https://www.bhcc.edu/media/03-documents/voicesofhunger/Wisconsin-HOPE-Lab-Still-Hungry-and-Homeless-April-2018.pdf. ↑
- Paola Pedrelli, Maren Nyer, Albert Yeung, Courtney Zulauf, and Timothy Wilens, “College Students: Mental Health Problems and Treatment Considerations,” Academic Psychiatry: The Journal of the American Association of Directors of Psychiatric Residency Training and the Association for Academic Psychiatry 39, no. 5 (October 2015): 503–11, https://doi.org/10.1007/s40596-014-0205-9; Sara Abelson, Sarah Ketchen Lipson, and Daniel Eisenberg, “Mental Health in College Populations: A Multidisciplinary Review of What Works, Evidence Gaps, and Paths Forward,” In Higher Education: Handbook of Theory and Research, Vol. 37, Springer Nature Switzerland AG, 2022. ↑
- Sara Abelson, Sarah Ketchen Lipson, and Daniel Eisenberg, “Mental Health in College Populations: A Multidisciplinary Review of What Works, Evidence Gaps, and Paths Forward,” In Higher Education: Handbook of Theory and Research, Vol. 37, Springer Nature Switzerland AG, 2022. ↑
- Daniel Eisenberg, Ezra Golberstein, and Justin B Hunt, “Mental Health and Academic Success in College,” The B.E. Journal of Economic Analysis & Policy 9, no. 1 (September 15, 2009), https://doi.org/10.2202/1935-1682.2191; Amelia M. Arria, Kimberly M. Caldeira, Kathryn B. Vincent, Emily R. Winick, Rebecca A. Baron, and Kevin E. O’Grady, “Discontinuous College Enrollment: Associations with Substance Use and Mental Health,” Psychiatric Services 64, no. 2 (2013): 165–72, https://doi.org/10.1176/appi.ps.201200106. ↑
- Sara Abelson, Sarah Ketchen Lipson, and Daniel Eisenberg, “Mental Health in College Populations: A Multidisciplinary Review of What Works, Evidence Gaps, and Paths Forward,” In Higher Education: Handbook of Theory and Research, Vol. 37, Springer Nature Switzerland AG, 2022. ↑
- As cited in Arthur D. P. Mak, Sue Lee, Nancy A. Sampson, Yesica Albor, Jordi Alonso, Randy P. Auerbach, Harald Baumeister et al., “ADHD Comorbidity Structure and Impairment: Results of the WHO World Mental Health Surveys International College Student Project (WMH-ICS),” Journal of Attention Disorders 26, no. 8 (2022): 1078-1096. ↑
- Lisa Sontag-Padilla, Michelle W. Woodbridge, Joshua Mendelsohn, Elizabeth J. D’Amico, Karen Chan Osilla, Lisa H. Jaycox, Nicole K. Eberhart, Audrey M. Burnam, and Bradley D. Stein, “Factors Affecting Mental Health Service Utilization Among California Public College and University Students,” Psychiatric Services 67, no. 8 (August 2016): 890–97, https://doi.org/10.1176/appi.ps.201500307. ↑
- “Three Key Challenges To Meeting Adult Learners’ Needs—And How To Solve Them,” Guild Education and Higher Ed Dive, n.d., https://biz.guildeducation.com/rs/003-XMG-066/images/Guild-Higher%20Ed%20Dive-Survey%20Report-021422-WEB%20%282%29.pdf. ↑
- Elaine L. Chao, Emily Stover DeRocco, and Maria K. Flynn, “Adult Learners in Higher Education Barriers to Success and Strategies to Improve Results,” US Department of Labor, March 2007, https://files.eric.ed.gov/fulltext/ED497801.pdf. ↑
- “Completing College: National and State Reports,” National Student Clearinghouse Research Center, February 2022, https://nscresearchcenter.org/wp-content/uploads/Completions_Report_2021.pdf. ↑
- D. Shapiro, M. Ryu, F. Huie, and Q. Liu, “Some College, No Degree: A 2019 Snapshot for the Nation and 50 States,” National Student Clearinghouse Research Center, October 2019, https://nscresearchcenter.org/wp-content/uploads/SCND_Report_2019.pdf. ↑
- Elaine L. Chao, Emily Stover DeRocco, and Maria K. Flynn, “Adult Learners in Higher Education Barriers to Success and Strategies to Improve Results,” US Department of Labor, March 2007, https://files.eric.ed.gov/fulltext/ED497801.pdf. ↑
- Ibid. ↑
- Sally Ann Goncalves and Dunja Trunk, “Obstacles to Success for the Nontraditional Student in Higher Education,” Psi Chi Journal of Psychological Research 19, no. 4 (2014): 164–72, https://doi.org/10.24839/2164-8204.JN19.4.164. ↑
- Jayne K. Drake, “The Role of Academic Advising in Student Retention and Persistence,” About Campus: Enriching the Student Learning Experience 16, no. 3 (July 2011): 8–12, https://doi.org/10.1002/abc.20062. ↑
- Daniel Rossman, Julia Karon, and Rayane Alamuddin, “The Impacts of Emergency Micro- Grants on Student Success,” Ithaka S+R, 31 March 2022, https://sr.ithaka.org/publications/the-impacts-of-emergency-micro-grants-on-student-success/#:~:text=Early%20adopters%20of%20retention%20or,students%20who%20receive%20the%20grants. ↑
- Susan Scrivener, Michael J. Weiss, Alyssa Ratledge, Timothy Rudd, Colleen Sommo, and Hannah Fresques, “Doubling Graduation Rates: Three-Year Effects of CUNY’s Accelerated Study in Associate Programs (ASAP) for Developmental Education Students,” MDRC, February 2015, https://www.mdrc.org/sites/default/files/doubling_graduation_rates_fr.pdf; William N. Evans, Melissa S. Kearney, Brendan C. Perry, and James X. Sullivan, “Increasing Community College Completion Rates among Low-Income Students: Evidence from a Randomized Controlled Trial Evaluation of a Case Management Intervention,” National Bureau of Economic Research, December 2017, https://doi.org/10.3386/w24150. ↑
- “The State of Higher Education 2023,” Lumina Foundation and Gallup, 4 May 2023, https://www.luminafoundation.org/wp-content/uploads/2023/05/State-of-Higher-Education-2023.pdf. ↑
- “The Value of Community Colleges: Recent Students’ Motivations and Outcomes,” Strada Education Foundation, 7 September 2023, https://stradaeducation.org/report/the-value-of-community-colleges-recent-students-motivations-and-outcomes/. ↑
- “Is College Worth the Time and Money?” Association of American Colleges and Universities (AAC&U) and the Bipartisan Policy Center, September 2021, https://dgmg81phhvh63.cloudfront.net/content/user-photos/Research/PDFs/BPC_Fed-State_Brief_R04.2.pdf. ↑
- “Current College Students Say Their Degree Is Worth the Cost,” Gallup, 1 June 2023, https://news.gallup.com/poll/506384/current-college-students-say-degree-worth-cost.aspx. ↑
- “The State of Higher Education 2023,” Lumina Foundation and Gallup, 4 May 2023, https://www.luminafoundation.org/wp-content/uploads/2023/05/State-of-Higher-Education-2023.pdf. ↑
- Ibid. “Unenrolled adults” refers to both adults who have never enrolled in college and those who are stop-outs and were previously enrolled. ↑
- Philip Levine, “College Prices Aren’t Skyrocketing—but They’re Still Too High for Some,” Brookings, 24 April 2023, https://www.brookings.edu/articles/college-prices-arent-skyrocketing-but-theyre-still-too-high-for-some/. ↑
- Brittani Williams, Jinann Bitar, Portia Polk, Andre Nguyen, Gabriel Montague, Carrie Gillispie, Antoinette Waller, Azeb Tadesse, and Kayla C. Elliott, “For Student Parents, The Biggest Hurdles to A Higher Education Are Costs and Finding Child Care,” The Education Trust, August 2022, https://edtrust.org/wp-content/uploads/2014/09/For-Student-Parents-The-Biggest-Hurdles-to-a-Higher-Education-Are-Cost-and-Finding-Child-Care-August-2022.pdf. ↑
- Ibid. ↑
- James Dean Ward and Daniel Corral, “Resetting Prices: Estimating the Effect of Tuition Reset Policies on Institutional Finances and Enrollment,” Research in Higher Education 64, no. 6 (September 2023): 862–92, https://doi.org/10.1007/s11162-022-09723-6; Daniel Corral and James Dean Ward, “Calibrating Costs: Do Tuition Reset Policies Affect Diverse Student Enrollment at Private Baccalaureate Colleges?” The Review of Higher Education, 2023, https://doi.org/10.1353/rhe.0.a909286. ↑
- Philip Levine and Dubravka Ritter, “The Racial Wealth Gap, Financial Aid, and College Access,” Brookings, 27 September 2022, https://www.brookings.edu/articles/the-racial-wealth-gap-financial-aid-and-college-access/; Benjamin Weintraut, Catharine Bond Hill, Martin Kurzweil, and Elizabeth Davidson Pisacreta, “Comparing Public Institution-Level Data on Students’ Family Income and Financial Aid,” Ithaka S+R, 16 November 2020, https://doi.org/10.18665/sr.314398; David Dill, “Access and Inequality in US Higher Education: Policy Issues,” In Equity Policies in Global Higher Education, edited by Orlanda Tavares, Carla Sá, Cristina Sin, and Alberto Amaral, 47–70, Springer International Publishing, 2022, https://doi.org/10.1007/978-3-030-69691-7_3. ↑
- Meredith Kolodner, “Eligible for Financial Aid, Almost One-Third of Students Never Get It,” The Hechinger Report, 23 May 2018, https://hechingerreport.org/eligible-for-financial-aid-almost-one-third-of-students-never-get-it/. ↑
- Joe Wyatt, “AC Acquires $250,000 Grant to Support Student Emergency Fund,” Amarillo College, 2 April 2020, https://www.actx.edu/blog/id/434. ↑
- Daniel Rossman, Julia Karon, and Rayane Alamuddin, “The Impacts of Emergency Micro- Grants on Student Success,” Ithaka S+R, 31 March 2022, https://sr.ithaka.org/publications/the-impacts-of-emergency-micro-grants-on-student-success/#:~:text=Early%20adopters%20of%20retention%20or,students%20who%20receive%20the%20grants. ↑
- James Dean Ward, Julia Karon, Catharine Bond Hill, and Martin Kurzweil, “Solving Stranded Credits: Assessing the Scope and Effects of Transcript Withholding on Students, States, and Institutions,” Ithaka S+R, 5 October 2020, https://doi.org/10.18665/sr.313978. ↑
- Elizabeth Davidson Pisacreta and Katherine Giardello, “OPINION: A New York Model Helps Community College Students Reach Their Goals,” The Hechinger Report, July 10, 2023, https://hechingerreport.org/opinion-a-new-york-model-helps-community-college-students-reach-their-goals/. ↑
- Sonya L. Britt, David Allen Ammerman, Sarah F. Barrett, and Scott Jones, “Student Loans, Financial Stress, and College Student Retention.” Journal of Student Financial Aid 47, no. 1 (April 3, 2017), https://doi.org/10.55504/0884-9153.1605. ↑
- “The State of Higher Education 2023,” Lumina Foundation and Gallup, 4 May 2023, https://www.luminafoundation.org/wp-content/uploads/2023/05/State-of-Higher-Education-2023.pdf. ↑
- Anthony P. Carnevale, Ban Cheah, and Emma Wenzinger, “The College Payoff: More Education Doesn’t Always Mean More Earnings,” Georgetown University McCourt School of Public Policy, Center of Education and the Workforce, 2021, https://cew.georgetown.edu/wp-content/uploads/cew-college_payoff_2021-fr.pdf. ↑
- Elizabeth Lawrence, “Why Do College Graduates Behave More Healthfully Than Those Who Are Less Educated?” Journal of Health and Social Behavior 58, no. 3 (September 2017): 291–306, https://doi.org/10.1177/0022146517715671; “Education For What?” Lumina Foundation and Gallup, 2023, https://www.luminafoundation.org/wp-content/uploads/2023/08/Education.for_.What_.pdf. ↑
- Rachel Fulcher Dawson, Melissa S. Kearney, and James X. Sullivan, “Why Expanded Student Supports Can Improve Community College Outcomes and Boost Skill Attainment,” Brookings, 7 April 2021, https://www.brookings.edu/articles/why-expanded-student-supports-can-improve-community-college-outcomes-and-boost-skill-attainment/. ↑
- “The Value of Community Colleges: Recent Students’ Motivations and Outcomes,” Strada Education Foundation, 7 September 2023, https://stradaeducation.org/report/the-value-of-community-colleges-recent-students-motivations-and-outcomes/. ↑
- Mark Schneider, “Finishing the First Lap: The Cost of First-Year Student Attrition in America’s Four-Year Colleges and Universities,” American Institutes for Research, October 2010, https://www.air.org/sites/default/files/AIR_Schneider_Finishing_the_First_Lap_Oct101.pdf. ↑
- James Dean Ward, Jesse Margolis, Benjamin Weintraut, and Elizabeth Davidson Pisacreta, “Raising the Bar: What States Need to Do to Hit Their Ambitious Higher Education Attainment Goals,” Ithaka S+R, 13 February 2020, https://doi.org/10.18665/sr.312647. ↑
- James Dean Ward, Benjamin Weintraut, and Elizabeth Davidson Pisacreta, “It’s Complicated: The Relationship between Postsecondary Attainment and State Finances,” Ithaka S+R, 19 January 2021, https://doi.org/10.18665/sr.314677. ↑