The Impacts of Emergency Micro-Grants on Student Success
Evaluation Study of Georgia State University’s Panther Retention Grant Program
-
Table of Contents
- Acknowledgements
- Executive Summary
- Introduction
- Emergency Aid Programs
- Panther Retention Grant Program
- Data Collection
- Data Analyses
- Outcome Measures
- OLS Regression Analysis and Results
- Difference-in-Difference Analysis and Results
- Additional Analyses
- Challenges and Limitations
- Discussion
- Appendix A: Additional Methodological Details
- Appendix B: Results Tables: Additional Analyses
- Appendix C: Event Studies
- Endnotes
Acknowledgements
This project was generously funded by the Bill & Melinda Gates Foundation.[1] We thank our partners at Georgia State University, who we have had the privilege of working with on multiple projects dedicated to testing the impacts of programs and interventions aimed at promoting student success and equity. We would like to thank a few Georgia State administrators and staff in particular: Dr. Timothy Renick and Dr. Allison Calhoun-Brown, who were deeply involved in the creation and development of the program and who provided important information on the program’s history and administration; Ben Brandon, who created the project’s dataset, which involved multiple complicated steps to collect historical student administrative and financial data in a manner conducive to analysis; and James Blackburn, who provided pertinent details on student financial data and its impact on the program. We would also like to acknowledge the contributions of Ithaka S+R staff members Martin Kurzweil and Dr. James Dean Ward, who provided valuable feedback on initial drafts of the analyses and report.
Finally, we would like to extend a special thanks to Dr. Ben Ost of the University of Illinois at Chicago, who served as the project’s technical consultant. His expertise and assistance on the data collection and analyses components of the project and his review of an initial draft of the report were paramount to the success of this project.
Executive Summary
The Panther Retention Grant (PRG) program at Georgia State University (Georgia State) is one of the nation’s pioneering examples of a retention or completion grant program, a type of emergency financial aid program aimed at supporting students with immediate financial need. The program, which specifically targets students who are in good academic standing and have exhausted all other sources of aid, automatically awards up to $2,500 to clear students’ unpaid balances and allow them to remain enrolled for the term. Since the program was piloted in 2011, it has awarded over 10,000 grants to Georgia State students and has undergone many changes in scope, focus, and eligibility criteria. This study is the first to attempt to estimate the causal impacts of the grant on student outcomes and institutional finances.
This report presents impact findings from two sets of regression analyses on the main analytic sample of 80,130 observations, as well as subgroups of interest: Pell recipients and students from underrepresented racial and ethnic minority groups.[2] We collected historical, de-identified student administrative and financial data from Georgia State and because the program has operated as a completion grant program for most of its existence, we limited the analytic sample to students close to graduating. We employed ordinary least squares (OLS) regression analyses and difference-in-difference (DID) regression analyses to estimate the impact of receiving a grant on three graduation outcomes and one cumulative debt outcome. We also conducted additional analyses on two new analytic samples to estimate the impact on retention and financial return on investment (ROI).
Across both analyses, we observed that receiving Panther Retention Grants had large significant impacts on graduation within one term and three terms for the full analytic sample and both subgroups of interest. While we also observed significant impacts on graduation within six terms in the OLS analysis, we did not observe similar findings on potential PRG receipt in the DID analysis. These findings indicate that PRG receipt reduced students’ time to degree but do not definitively determine whether the grant helped students graduate who otherwise would not have. We also observed significant impacts of PRG receipt on cumulative debt in the OLS analysis for the full analytic sample and subgroups, decreasing the amount of debt incurred post-receipt by an average of $3,700. In the DID analysis, while we did not find significant impacts of potential PRG receipt on cumulative debt for the full sample, we did find that potential grant receipt decreased the amount of debt incurred by Pell recipients and students from underrepresented minority backgrounds specifically. Follow-up analyses revealed that this is likely due to grant recipients enrolling in fewer terms post-receipt and, as a result, being responsible for fewer tuition payments. Looking at a broader sample that included non-seniors, we did not find evidence that PRG recipients persisted to the subsequent term at higher rates than non-recipients. Additionally, our analysis of the program’s impact on institutional finances produced mixed results depending on how the control group (i.e., the counterfactual) was defined.
While we found significant impacts on multiple outcomes, the study faced a number of challenges and limitations that may have biased the results. Specifically, there were changes to the program’s administration and eligibility criteria, and the student financial data was incomplete and at times inaccurate. We present these analyses as a first comprehensive look into the impacts of the Panther Retention Grant program and have identified a number of areas for future research on emergency micro-grant programs that may address some of the limitations of this study and contribute to a broader understanding of the efficacy of such programs.
Introduction
Despite rising completion rates over the last decade, nearly 40 percent of students who enroll in a postsecondary institution do not graduate,[3] leaving approximately 36 million individuals in the United States with some college experience but no degree.[4] This “college dropout crisis” is troubling for several reasons—students who do not have a postsecondary degree are more likely to lose their job in a recession, earn less than bachelor’s degree holders, and default on their loans.[5] While there are many reasons students may leave college without a degree, financial barriers have become more prominent as college prices have increased faster than families’ ability to pay.[6] The combination of increased college prices and insufficient financial assistance means that it is more difficult for students, especially those already struggling to cover basic needs like housing and food, to afford to remain in college in the face of unexpected financial trouble.[7] The COVID-19 pandemic has exacerbated these financial hurdles, and many students have chosen not to enroll or continue their education due to affordability concerns.[8]
Some institutions have responded to this problem by implementing micro-grant or emergency aid programs that immediately alleviate financial distress of students with high need. There are several different types of emergency grants, with different goals, eligibility criteria, and types of expenses covered (described in more detail in the next section). Retention or completion grant programs target students who are otherwise on track to persist and/or graduate but are at risk of stopping out due to an unpaid balance to the institution. One of the pioneering examples of a retention or completion grant, and one of the largest, is Georgia State University’s Panther Retention Grant (PRG) program. Since the program’s inception in 2011, it has awarded grants to thousands of Georgia State students and is estimated to have produced between $4 million and $7.8 million in revenue for the university.[9] The program is unique in that students do not have to apply for or accept a grant but rather are rewarded funding if they meet the relevant eligibility criteria. While the initial results of the program have been positive, the program has yet to be rigorously evaluated. This study, generously funded by the Bill & Melinda Gates Foundation, is the first attempt to estimate the causal impact of the Panther Retention Grant program on student outcomes and institutional finances.
This report presents 1) background information on the motivations and characteristics of emergency aid programs more broadly; 2) the history of the Panther Retention Grant program; 3) detailed descriptions of our data collection process and methodological approach; 4) findings from our impact analyses on student outcomes for the analytic sample and subgroups of interest; 5) challenges and limitations of our approach; and 6) a discussion of the results and avenues for future research.
Emergency Aid Programs
The earliest well-studied examples of emergency aid initiatives emerged in the early 2000s.[10] Limited funding and a reluctance to provide assistance to students who were perceived as having made poor financial decisions resulted in programs that were poorly advertised and underutilized.[11] The growing realization that issues as “small” as an overdue electric bill or a broken down car can derail a student’s path toward their degree has led to a recent focus on more comprehensive and generous aid distribution. As a result, a growing list of institutions, especially at the community college level, have increased the scope and budget of their emergency aid programs. These range from programs devoted to providing one specific form of assistance, like housing vouchers for homeless students, to programs that provide a robust set of services. The best-known example of the latter is Amarillo College’s No Excuses Poverty initiative, which provides clothing, food pantries, childcare, utility bill payments, and more to its students.[12] Amarillo’s wraparound approach to student supports has been correlated with a dramatic increase in their retention and graduation rates, attracting national attention and additional external funding to continue to provide these services to students.[13]
The trend toward comprehensive support has been coupled with an increase in the use of data to proactively identify students who may benefit from relatively small amounts of aid. Institutions are increasingly using their wealth of student data to examine student characteristics and identify those who are on track to graduate but are at risk of dropping out due to financial difficulties. Some have gone as far as to employ advanced predictive analytics to identify and support at-risk students who are close to graduating.[14] Others, such as Georgia State, use early alert systems to examine student data and target assistance accordingly. While institutional capabilities for data and analytics may vary, the use of data to identify students and conduct proactive outreach can increase the efficacy and reach of aid programs.[15]
Retention and Completion Grants
While emergency aid can take a variety of forms, one type of grant in particular has been adopted by institutions looking to retain students who need a modest amount of aid to pay their tuition and fees and continue their studies. These grants, often referred to as retention or completion grants, are typically offered to students with unmet financial need who have exhausted all other sources of financial aid and are at risk of stopping out or being dropped for non-payment but are otherwise on track to graduate.[16] Unlike other emergency aid programs, retention or completion grants often only cover tuition and, in the case of completion grants, are predominantly targeted at students who are close to graduating.
Completion and retention grants differ in both the type and amount of aid awarded. Some institutions offer aid in the form of emergency loans, which can be forgiven if the student graduates from the institution within a certain period of time.[17] While there is no evidence that loans are more or less effective than grants, many are wary of providing emergency loans to low-income students who are likely already burdened with loans from other sources. For that reason, the majority of institutions award aid in the form of grants that do not have to be repaid to the institution. The amount awarded to students also differs across institutions—some offer more modest amounts (under $1,000) while others provide upwards of $2,500 for eligible students.[18]
Another differentiator between programs is the specific set of requirements students must meet to be eligible for a grant. Some programs require that all grant recipients participate in financial counseling sessions with a staff member before they receive aid.[19] Other programs have stricter requirements, such as in-state residency, minimum GPA, or minimum number of credits accumulated at the institution.[20] Critics of this approach argue that these requirements can discourage or prevent the very students the programs would benefit the most from applying for or receiving aid. Institutions, on the other hand, view these requirements as a better way to target aid by awarding it to students most likely to be retained. Some institutions, in an effort to have a positive impact on students’ finances beyond the term in which the grant is awarded, require financial counseling. This is especially relevant for programs in which a student can only receive one grant in their lifetime.
Results and Efficacy
Early adopters of retention or completion grant programs have reported promising results both for students and institutions. Many schools have reported relatively high graduation rates for students who receive the grants.[21] In addition to helping students themselves, increasing graduation rates, especially of those from traditionally underserved groups, can raise an institution’s ranking and prestige and increase state funding.[22] These programs can also be financially beneficial to institutions and yield a positive return on investment (ROI) if the tuition revenue generated by retaining grant recipients who otherwise would have dropped out exceeds the program’s costs.[23]
While descriptive results of the programs suggest that they improve students’ academic outcomes and benefit institutions financially, there has been little research on the causal impacts of such grants. The Hope Center for College, Community, and Justice at Temple University has conducted the first such study at eleven large public universities across the United States. Using a randomized controlled trial, the study found no evidence that completion grants impacted completion or time to degree.[24] Still, these programs are relatively new, and there is much to be learned about programs, including Georgia State’s, that were implemented in other institutional settings and with different design features, as well as the conditions under which they are most effective.
Panther Retention Grant Program
The Panther Retention Grant program emerged as one of several data-driven programs undertaken by Georgia State to increase student success and completion. As part of its exploration of student data, the university discovered that more than 1,000 otherwise qualified students were being dropped each semester due to the state of Georgia’s mandate that institutions drop students who fail to pay their full tuition balance by the first week of classes. To address this, Georgia State decided to pilot a retention grant program, using seed funding from the university’s president, in which students identified during the add/drop period in good academic standing (i.e., meeting satisfactory academic progress (SAP)) but at risk of being dropped because of a modest unpaid balance of $2,500 or less were automatically provided a grant that cleared the balance so they could remain enrolled.
Today, the program operates as a collaboration between the financial aid, advising, and registrar’s offices at Georgia State. The financial aid office identifies students who are at risk of being dropped due to an outstanding balance and shares a list with the other offices. After removing students who have not yet exhausted all other forms of aid, the remaining students are then cross-checked against a list of students who meet the additional eligibility requirements (i.e., SAP, modest balance) to determine the final set of PRG recipients for each term.[25] This process occurs at least twice each term—immediately before the late payment deadline and again later in the term to identify students who have developed balances after the late payment deadline that would prevent them from registering for the subsequent term.[26] A key feature of this program is that students do not have to identify, apply for, or accept a grant. Students are notified of their grant award and the money is immediately transferred into their account.
The program has changed significantly over the years in terms of its scope and target population. The program grew rapidly early on, going from 214 grants awarded in the 2011-12 academic year to over 1,300 in just two years. In recent years, the program has scaled to distribute nearly 10 times the number of awards given in its inaugural year. In the 2017-18 academic year, the most recent one in which we have complete data, more than 2,000 grants were awarded. This growth was coupled with a change in the program’s target population. The program initially focused on increasing retention rates of freshmen who were facing financial difficulties. However, the program team realized that this might not be the best use of limited institutional dollars since these students would likely continue to face financial hurdles beyond their first year at Georgia State. Further examination of the data also showed that a large portion of students who were being dropped for nonpayment were seniors. In 2014, the program team determined that they could maximize impact by targeting seniors who were at risk of being dropped one or two terms prior to graduation.[27] Today, the majority of grants are awarded to seniors while a smaller share is given to underclassmen (see Table 1).
Table 1: Number of PRG Awards by Academic Year and Standing[28]
| Academic Year | First Year | Second Year | Third Year | Fourth Year | Total |
| 2011-12 | 73 | 73 | 17 | 51 | 214 |
| 2012-13 | 142 | 354 | 144 | 472 | 1,112 |
| 2013-14 | 139 | 318 | 184 | 695 | 1,336 |
| 2014-15 | 52 | 172 | 244 | 1,144 | 1,612 |
| 2015-16 | 57 | 102 | 128 | 1,172 | 1,459 |
| 2016-17 | 51 | 98 | 101 | 1,077 | 1,327 |
| 2017-18 | 166 | 208 | 230 | 1,307 | 1,911 |
| 2018-19[29] | 154 | 257 | 163 | 741 | 1,315 |
| Total | 834 | 1,582 | 1,211 | 6,659 | 10,286[30] |
As the size and nature of the program changed, so did its eligibility requirements. Early on, eligible students were only expected to meet SAP and have balances under $2,500, and these were treated more as guidelines and not strictly enforced. Around the time the grant shifted its focus to seniors, an additional requirement was added: students had to have exhausted all other forms of aid for which they were eligible in order to receive a grant.[31] Since seniors were more likely to have already exhausted all other forms of aid, this requirement further cemented the program’s focus on upperclassmen. These requirements became more strictly enforced in 2017 when the new financial aid director strengthened adherence to the eligibility criteria.[32]
Additional changes to the administration of the grant were also made throughout the program to maximize impact. In the early years, students were required to complete a financial aid module before they could receive grant aid, but the increased volume of grants made this difficult to implement and so the requirement was eventually dropped.[33] Changes were also made to the lifetime maximum amount of grant aid. Initially, students could receive up to three grants, but the team realized that some students require more than three installments of relatively small amounts of aid. Around 2017, the three-grant limit was replaced with a lifetime maximum of $7,500 in aid.
Preliminary analyses conducted by Georgia State staff and consultants suggest that the program has positively impacted both students and the institution itself. According to Georgia State, seniors who receive a grant are more than twice as likely to graduate within three terms compared to seniors who did not receive one.[34] Furthermore, an analysis by the Boston Consulting Group reported that for every 1,500 grants disbursed, the university receives an additional $5.4 million to $9.2 million in revenue.[35] Even after including the costs of the grants themselves and the costs associated with the administration of the program, the Boston Consulting Group estimated that Georgia State’s return on investment was between $4 million and $7.8 million. This analysis uses retention as the mechanism for ROI and operates under the key assumption that the vast majority of students who receive aid would otherwise not have enrolled at the institution. While these estimates are promising, they do not establish the causal effect of the program. This study is the first analysis to attempt to estimate the causal impact of the Panther Retention Grant program on student outcomes and its broader effects on institutional ROI.
Data Collection
Due to changes in the program over time and uncertainty around the details of its actual administration, we collected a broad set of data in collaboration with the senior director of student success analytics at Georgia State to allow for different types of data analyses as appropriate. More specifically, we collected historical, de-identified student administrative and finance data, drawing on demographic, outcome, and finance data from students who entered the university as bachelor’s degree-seeking undergraduates and were enrolled as of Georgia State’s census date in at least one term between Fall 2008 and Spring 2019.
To understand how students’ financial status fluctuated and to capture students’ eligibility for a grant, we collected data on various “snapshot dates” throughout each term. To do this, we first reviewed the distribution of Panther Retention Grant awards by date to identify days in which relatively large numbers of grants were awarded. We then selected the day before each spike in grants in order to recreate students’ financial picture when their eligibility status for a grant was most likely reviewed. We collected data on students’ cumulative charges, cumulative payments, unpaid balances, and whether they had exhausted all other sources of aid on 120 dates, with each term having between two and six dates. The first snapshot date of each term fell on the term’s late payment deadline since that was typically the date that the program team awarded the first, and often largest, set of grants to students in a given term.
Data Analyses
We intended to employ a regression discontinuity (RD) design to estimate the impact of Panther Retention Grant receipt on our outcomes of interest by utilizing the unpaid balance cutoff of $2,500 or less as an artificial quantitative threshold to mimic random assignment to the treatment and control groups. However, once we received and explored the data, we discovered that there was no clear and predictable discontinuity around the cutoff and that differences in the probability of receipt between students around the cutoff were similar and not random, meaning that the cutoff was not strictly adhered to. As a result, we could not employ a RD. See Appendix A for additional details.
Instead, we employed ordinary least squares (OLS) regressions and difference-in-difference (DID) regressions to estimate the effect of PRG receipt on our outcomes of interest. We present the results of each analysis in the next sections.
Analytic Sample
The initial dataset of student administrative data included 577,223 observations (or student-term combinations), representing 89,745 unique students across 32 terms. The dataset included 11,063 Panther Retention Grant awards distributed to 7,998 students between the program’s inception in the Fall 2011 term and the end of the Spring 2019 term. Excluding students who were deemed ineligible, grants that were deemed ineligible, and students missing key financial data resulted in an analytic sample of 506,179 observations, representing 89,047 students, and 10,298 PRG awards. More details about the sample restriction process can be found in Appendix A.
We made additional changes to the analytic sample after further investigation of the data revealed that the PRG program functioned primarily as a completion grant program, especially in recent years. Between the Fall 2014 and Spring 2019 terms, 71 percent of awards were given to students who were categorized as fourth-year standing (i.e., seniors), 87 percent of whom were categorized as such for at least three terms and were very close to graduating (see Table 1). As a result, we limited our sample to “super seniors,” defined in this analysis as students categorized as fourth-year standing in the given term for at least the third time.[36] We further restricted our sample to those who were meeting satisfactory academic progress and who had exhausted all other sources of aid in the given term, since these were requirements to be eligible for a grant. This led to a final analytic sample of 80,130 observations, representing 30,122 students and 4,808 awards. Additional descriptive information on the analytic sample can be found in Table 2.
Table 2 – Descriptive Statistics of Student Characteristics: Full Analytic Sample
| Student Characteristic | Mean
(SD) |
n |
| Number terms senior | 4.5
(1.6) |
80,130 |
| Age | 21.9
(6.5) |
80,126 |
| Enrollment, t-1 | 0.97
(0.17) |
80,130 |
| Institutional credit accumulation, t-1 | 87.3
(34.3) |
80,124 |
| Total credit accumulation, t-1 | 123.6
(21.0) |
80,125 |
| Cumulative GPA, t-1 | 3.06
(0.56) |
80,108 |
| URM | 0.54
(0.50) |
80,130 |
| Female | 0.62
(0.48) |
80,130 |
| Has balance | 0.88
(0.33) |
80,130 |
| Functional balance[37] | 3,141
(1,986) |
80,130 |
| Pell receipt, t-1 | 0.66
(0.47) |
80,129 |
| Cumulative debt, t-1 | 20,032
(17,478) |
80,129 |
Outcome Measures
The four measures used to capture student outcomes fall under the categories of completion and cost. Three of the four measures explicitly focus on graduation and are grouped under the completion category given that the program functioned as a completion grant for most of its existence. The fourth outcome measure, which falls under the cost category, captures the amount of debt accumulated from the given term until exit or completion.[38] All outcome measures and categories were chosen in alignment with the Postsecondary Metrics Framework developed by the Institute of Higher Education Policy (IHEP).[39]
Outcome Measures: Completion
Graduation within one term: Whether the student earned a bachelor’s degree from Georgia State by the end of the subsequent term (i.e., t+1), or not. Binary variable.[40]
Graduation within three terms: Whether the student earned a bachelor’s degree from Georgia State within three terms (i.e., t+3), or not. Binary variable.[41]
Graduation within six terms: Whether the student earned a bachelor’s degree from Georgia State within six terms (i.e., t+6), or not. Binary variable.[42]
Outcome Measures: Cost
Cumulative debt: Amount of debt accumulated by the student at Georgia State in the given term until exit or completion; solely based on total amount borrowed by students. Continuous variable.[43]
OLS Regression Analysis and Results
This section describes the analytic approach of the OLS regression analysis and presents key findings from the analysis in the full analytic sample and subgroups of interest.
Analytic Approach
We employed linear regression analyses to estimate the treatment-on-the-treated (TOT) effect of Panther Retention Grant receipt on each outcome of interest. The primary model is a multivariate regression that includes covariates to control for differences in student demographic characteristics and prior academic performance between the treatment group (i.e., received a PRG award in the given term) and control group (i.e., did not receive a PRG award in the given term). Examples of covariates include age at time of enrollment at Georgia State, cumulative GPA as of last term, and students’ functional balance on the first snapshot date of the given term.[44]
The primary model for the full sample is estimated as follows:
Yi = δ+ β*TREATMENTi + αXi + εi
Where Y is an outcome for individual i, TREATMENT indicates whether the student is in the treatment or control group, and X is a vector of control variables.
Table 3 presents descriptive statistics of student characteristics by treatment and control groups.
Table 3 – Descriptive Statistics of Student Characteristics by Treatment and Control Groups: Full Analytic Sample
| Student Characteristic | Control (non-PRG recipients) | Treatment (PRG recipients) | ||
| Mean
(SD) |
n | Mean
(SD) |
n | |
| Number terms senior | 4.4
(1.6) |
75,322 | 5.1
(1.9) |
4,808 |
| Age | 21.9
(6.6) |
75,318 | 21.0
(6.0) |
4,808 |
| Enrollment | 0.97
(0.17) |
75,322 | 0.97
(0.18) |
4,808 |
| Institutional credit accumulation, t-1 | 86.6
(34.3) |
75,316 | 97.1
(32.6) |
4,808 |
| Total credit accumulation, t-1 | 123.3
(21.1) |
75,317 | 128.0
(19.6) |
4,808 |
| Cumulative GPA, t-1 | 3.06
(0.56) |
75,300 | 2.94
(0.51) |
4,808 |
| URM | 0.53
(0.50) |
75,322 | 0.70
(0.46) |
4,808 |
| Female | 0.62
(0.48) |
75,322 | 0.66
(0.47) |
4,808 |
| Has balance | 0.87
(0.34) |
75,322 | 0.99
(0.08) |
4,808 |
| Functional balance | 3,134
(2,000) |
75,322 | 3,252
(1,749) |
4,808 |
| Pell receipt, t-1 | 0.65
(0.48) |
75,321 | 0.87
(0.33) |
4,808 |
| Cumulative debt, t-1 | 19,609
(17,335) |
75,321 | 26,658
(18,352) |
4,808 |
There are a number of differences between the treatment and control groups that are worth noting.[45] Students in the treatment group were, on average, seniors for more terms compared to control group students and as such had accumulated slightly more credits overall, which suggests that program administrators targeted students who were very close to graduating. Treatment group students were also more likely to come from underrepresented minority backgrounds, to have received a Pell Grant in the previous term, and to have an outstanding balance in the given term. These differences are not surprising considering that the grants are targeted to students with high financial need.[46]
Table 4 – Outcomes by Treatment and Control Groups: Full Analytic Sample
| Outcome Measure | Control (non-PRG recipients) | Treatment (PRG recipients) | ||
| Mean
(SD) |
n | Mean
(SD) |
n | |
| Graduation (t+1) | 0.46
(0.50) |
72,502 | 0.65
(0.48) |
4,613 |
| Graduation (t+3) | 0.68
(0.47) |
68,539 | 0.80
(0.40) |
3,753 |
| Graduation (t+6) | 0.77
(0.42) |
60,716 | 0.84
(0.37) |
3,013 |
| Cumulative debt | 7,318
(8,376) |
70,809 | 2,787
(4,573) |
4,447 |
We find substantial differences in average outcomes between the treatment and control groups. While these differences may be partially driven by PRG receipt, it is also possible that outcome differences are in part due to differences in student characteristics between the treatment and control groups shown in Table 3.
Results
We present the estimated effects of Panther Retention Grant receipt on student academic outcomes for the full analytic sample, as well as for two subgroups of interest: Pell recipients and students from underrepresented racial and ethnic minority groups. Each table presents the results of a multivariate regression that includes the controls described above. We then present additional exploratory analyses.
Results: Full Analytic Sample
For the full analytic sample, there were significant impacts on all outcomes of interest. After controlling for observable differences between the two groups, students who received a Panther Retention Grant award in the given term had a higher graduation rate than their counterparts (see Table 5). Within one term of PRG receipt, they had a graduation rate that was 15 percentage points higher than non-recipients, who graduated within one term at a rate of 46 percent. This effect diminishes over time—within three terms of receipt, the graduation rate of recipients is nine percentage points higher, and within six terms it is five percentage points higher than the graduation rate of non-recipients. The fact that differences in graduation rates between the two groups persisted but decreased as the time horizon increases suggests that PRG receipt has a large impact on decreasing time to degree and a more modest impact on increasing the total number of students who graduate.
Table 5 – Treatment-on-Treated Effect of PRG Receipt on Completion Outcomes: Full Analytic Sample
| Variables | Graduation (t+1) | Graduation (t+3) | Graduation (t+6) |
| Mean
(SD) |
Mean
(SD) |
Mean
(SD) |
|
| Treatment | 0.15***
(0.01) |
0.09***
(0.01) |
0.05***
(0.01) |
| Control Mean | 0.46 | 0.68 | 0.77 |
| Observations | 77,089 | 72,266 | 63,703 |
| R-squared | 0.18 | 0.19 | 0.16 |
| Controls | Yes | Yes | Yes |
Grant receipt also had an impact on cumulative debt, with recipients, on average, accumulating $3,728 less debt following receipt compared to non-recipients (see Table 6).
Table 6 – Treatment-on-Treated Effect of PRG Receipt on Cost Outcome: Full Analytic Sample
| Variables | Cumulative Debt |
| Mean
(SD) |
|
| Treatment | -3,728***
(86) |
| Control Mean | 7,318 |
| Observations | 75,232 |
| R-squared | 0.30 |
| Controls | Yes |
To test whether differences in graduation rates within one term, three terms, and six terms of receipt were due to differences in sample size, we conducted the same OLS regression analyses described above and set the samples used to analyze graduation rates within one term and three terms to match the sample used to analyze graduation rate within six terms.[47] The results were very similar to the results derived using the initial sample sizes, which suggests that differences in graduation rates were not due to differences in sample size. More details on the results from these additional analyses can be found in Appendix B.
We also conducted follow-up analyses to better understand the factors driving the observed effects on debt in Table 5. We postulated that in addition to receiving direct financial relief from grant receipt, grant recipients enrolled in fewer terms and therefore were responsible for fewer tuition payments because they graduated at faster rates. To test this, we conducted the same OLS regression analyses described above with one new outcome variable: the number of future terms in which the student was enrolled. For the full analytic sample, PRG recipients, on average, were enrolled for 0.44 fewer future terms than non-recipients. Similar findings emerged for our subsamples of interest, with Pell recipients who received a grant enrolling for 0.41 fewer terms and underrepresented minority students enrolling for 0.37 fewer terms. These results support our hypothesis that PRG recipients accumulated less debt because they received direct financial relief when their balance was cleared and were responsible for fewer tuition payments because they graduated sooner and enrolled in fewer terms. More details on the results from these additional analyses can be found in Appendix B.
Results: Student Subgroups of Interest
Pell Recipient Subgroup
Similar to the full analytic sample, there were significant impacts on all outcomes of interest among Pell recipients. After controlling for observable differences between the two groups, Pell recipients who received an award in the given term had a higher graduation rate than their counterparts (see Table 7). Within one term of PRG receipt, they had a graduation rate that was 14 percentage points higher than non-recipients, who graduated within one term at a rate of 44 percent. This effect diminishes over time—within three terms of receipt, the graduation rate of recipients is eight percentage points higher and within six terms it is five percentage points higher than the graduation rate of non-recipients.
Table 7 – Treatment-on-Treated Effect of PRG Receipt on Completion Outcomes: Pell Recipient Subgroup
| Variables | Graduation (t+1) | Graduation (t+3) | Graduation (t+6) |
| Mean
(SD) |
Mean
(SD) |
Mean
(SD) |
|
| Treatment | 0.14***
(0.01) |
0.08***
(0.01) |
0.05***
(0.01) |
| Control Mean | 0.44 | 0.66 | 0.76 |
| Observations | 43,087 | 40,356 | 35,632 |
| R-squared | 0.20 | 0.20 | 0.17 |
| Controls | Yes | Yes | Yes |
Grant receipt also had an impact on cumulative debt, with recipients, on average, accumulating $3,650 less debt following receipt compared to non-recipients (see Table 8).
Table 8 – Treatment-on-Treated Effect of PRG Receipt on Cost Outcome: Pell Recipient Subgroup
| Variables | Cumulative Debt |
| Mean
(SD) |
|
| Treatment | -3,650***
(108) |
| Control Mean | 7,949 |
| Observations | 41,885 |
| R-squared | 0.28 |
| Controls | Yes |
Underrepresented Racial and Ethnic Minority Student Subgroup
Similar to the full analytic sample and Pell recipient subgroup, there were significant impacts on all outcomes of interest among students from underrepresented racial and ethnic minority subgroups. After controlling for observable differences between the two groups, underrepresented minority students who received an award in the given term had a higher graduation rate than their counterparts (see Table 9). Within one term of PRG receipt, they had a graduation rate that was 14 percentage points higher than non-recipients, who graduated within one term at a rate of 43 percent. This effect diminishes over time—within three terms of receipt, the graduation rate of recipients is nine percentage points higher and within six terms it is six percentage points higher than the graduation rate of non-recipients.
Table 9 – Treatment-on-Treated Effect of PRG Receipt on Completion Outcomes: Underrepresented Racial and Ethnic Minority Student Subgroup
| Variables | Graduation (t+1) | Graduation (t+3) | Graduation (t+6) |
| Mean
(SD) |
Mean
(SD) |
Mean
(SD) |
|
| Treatment | 0.14***
(0.01) |
0.09***
(0.01) |
0.06***
(0.01) |
| Control Mean | 0.43 | 0.64 | 0.73 |
| Observations | 41,200 | 38,359 | 33,486 |
| R-squared | 0.20 | 0.22 | 0.19 |
| Controls | Yes | Yes | Yes |
Grant receipt also had an impact on cumulative debt, with recipients, on average, accumulating $3,820 less debt following receipt compared to non-recipients (see Table 10).
Table 10 – Treatment-on-Treated Effect of PRG Receipt on Cost Outcome: Underrepresented Racial and Ethnic Minority Student Subgroup
| Variables | Cumulative Debt |
| Mean
(SD) |
|
| Treatment | -3,820***
(111) |
| Control Mean | 8,625 |
| Observations | 39,993 |
| R-squared | 0.28 |
| Controls | Yes |
Difference-in-Difference Analysis and Results
This section describes the analytic approach of the DID regression analysis and presents key findings from the analysis in the full analytic sample and subgroups of interest. The primary reason we conducted a DID analysis is because it does not suffer from the same potential source of bias as an OLS analysis. Specifically, the OLS analysis will produce biased results if Panther Retention Grant recipients differ from non-recipients in unobserved ways that we fail to account for in our models. This particular bias is mitigated by employing a DID design, although it introduces its own potential sources of bias (as described in more detail below and in the Challenges and Limitations section).
Analytic Approach
We first assigned students who had an outstanding balance on the first snapshot date in the given term to the treatment group and students who did not have a balance on the first snapshot date in the given term to the control group. Unlike the OLS analysis in which we compared students who received a Panther Retention Grant in the given term to those who did not, the DID analysis compares students who might have received a PRG to students who are very unlikely to have received one since students without a balance should not receive an award.
We use the program start date of the Fall 2011 term to create a pre-period and post-period and compare the change over time of the treatment group to the change over time of the control group. We do this by regressing the outcomes against a set of binary variables for each term in the dataset (i.e., term dummies), a binary variable indicating whether the student is in the treatment group (i.e., had a balance on the first snapshot of the given term), and an interaction between the treatment variable and a binary variable indicating whether the given term is in the post-period (i.e., on or after the Fall 2011 term).[48] Assuming that the two groups changed over time in similar ways prior to the program and would have continued to had it not been for the implementation of the program, differences in outcomes between the groups in the post-period can at least be partially attributed to PRG receipt since the vast majority of awards were given to students in the treatment group. This assumption, known as the parallel trends assumption, is explored in Appendix C.
The primary model includes the same set of controls included in the OLS regressions, less students’ functional balance since the balance of every student in the control group is by definition zero. While controls are not strictly required for a difference-in-difference analysis, we opt to include them to test the robustness of the estimates.
The primary model for the full sample is estimated as follows:
Yi = δ+ β*TREATMENTi + γ*TERMi + (β*TREATMENTi x β*POSTi) + αXi + εi
Where Y is an outcome for individual i, TREATMENT indicates whether the student was in the treatment or control group, TERM represents a set of term dummies, TREATMENT x POST represents the interaction, and X is a vector of control variables.
Because the DID analysis compares how the treatment group changed over time to how the control group changed over time, it is important that the groups’ average characteristics not affected by PRG receipt changed over time in similar ways. Overall, the pre- and post-period trends between the control and treatment groups are very similar, with some minor yet noteworthy differences (see Table 11).[49] The number of terms students are seniors increases from pre- to post-period at a faster rate for the control group compared to the treatment group. This is accompanied by a difference in the trend of credit accumulation, with treatment group students’ average credit accumulation decreasing slightly more than that of control group students.
Table 11 – Descriptive Statistics of Student Characteristics by Treatment and Control Groups and Pre- and Post-Periods: Full Analytic Sample
| Student Characteristic | Control (no balance on first snapshot date of the term) | Treatment (balance on the first snapshot date of the term) | ||||||
| Pre-PRG Program | Post-PRG Program | Pre-PRG Program | Post-PRG Program | |||||
| Mean
(SD) |
n | Mean
(SD) |
n | Mean
(SD) |
n | Mean
(SD) |
n | |
| Number terms senior | 4.2
(1.3) |
2,053 | 5.1
(1.9) |
7,713 | 4.0
(1.1) |
12,629 | 4.5
(1.7) |
57,735 |
| Age | 23.5
(6.4) |
2,053 | 21.8
(7.4) |
7,713 | 23.3
(6.4) |
12,629 | 21.5
(6.4) |
57,731 |
| Enrollment, t-1 | 0.98
(0.12) |
2,053 | 0.95
(0.21) |
7,713 | 0.98
(0.14) |
12,629 | 0.97
(0.17) |
57,735 |
| Institutional credit accumulation, t-1 | 92.0
(34.0) |
2,053 | 91.8
(35.7) |
7,712 | 89.2
(33.6) |
12,629 | 86.0
(34.1) |
57,730 |
| Total credit accumulation, t-1 | 130.6
(23.3) |
2,053 | 130.0
(23.4) |
7,712 | 124.0
(21.3) |
12,629 | 122.4
(20.3) |
57,731 |
| Cumulative GPA, t-1 | 3.05
(0.52) |
2,053 | 3.06
(0.53) |
7,711 | 3.03
(0.55) |
12,624 | 3.06
(0.56) |
57,720 |
| URM | 0.34
(0.48) |
2,053 | 0.37
(0.48) |
7,713 | 0.53
(0.50) |
12,629 | 0.57
(0.50) |
57,735 |
| Female | 0.61
(0.49) |
2,053 | 0.56
(0.50) |
7,713 | 0.66
(0.47) |
12,629 | 0.63
(0.48) |
57,735 |
| Pell receipt, t-1 | 0.32
(0.47) |
2,053 | 0.51
(0.50) |
7,713 | 0.54
(0.50) |
12,629 | 0.72
(0.45) |
57,734 |
| Cumulative debt, t-1 | 13,639
(14,696) |
2,053 | 16,542
(18,211) |
7,713 | 17,574
(15,528) |
12,629 | 21,263
(17,701) |
57,734 |
Results
We present the intent-to-treat effects of potential Panther Retention Grant receipt based on the DID regression analyses for the full analytic sample, as well as for Pell recipients and students from underrepresented racial and ethnic minority groups. Each table presents the results of two regression models. Model 1 is a regression that does not include control variables and model 2 is a regression that includes the controls described earlier, less functional balance. The tables include the coefficient estimate on the treatment variable—whether a student has a balance—as well as the estimate on the interaction of the treatment and post-period binary variable. Discussion of the results focuses primarily on model 2. We then calculate the implied effect for statistically significant findings and conduct additional analyses to further explore certain results.
Results: Full Analytic Sample
For the full analytic sample, there were significant impacts on graduation within one term and three terms. Specifically, students in the treatment group had a graduation rate within one term of potential Panther Retention Grant receipt that was six percentage points higher and a graduation rate within three terms that was three percentage points higher than non-recipients in the control group (see Table 12). Similar to the OLS, this effect diminishes over time, with no significant impact on graduation within six terms. This suggests that potential grant receipt decreased time to degree but did not help students graduate who otherwise would not have. There were no significant impacts on cumulative debt following potential PRG receipt (see Table 13).
Table 12 – Difference-in-Difference Intent-to-Treat Effect of Potential PRG Receipt on Completion Outcomes: Full Analytic Sample
| Variables | Graduation (t+1) | Graduation (t+3) | Graduation (t+6) | |||
| Model 1 | Model 2 | Model 1 | Model 2 | Model 1 | Model 2 | |
| Mean
(SD) |
Mean
(SD) |
Mean
(SD) |
Mean
(SD) |
Mean
(SD) |
Mean
(SD) |
|
| Treatment | -0.10***
(0.01) |
-0.07***
(0.01) |
-0.05***
(0.01) |
-0.04***
(0.01) |
-0.03**
(0.01) |
-0.02**
(0.01) |
| Post x Treatment | 0.06***
(0.01) |
0.06***
(0.01) |
0.03**
(0.01) |
0.03**
(0.01) |
0.01
(0.01) |
0.01
(0.01) |
| Observations | 77,115 | 77,089 | 72,292 | 72,266 | 63,729 | 63,703 |
| R-squared | 0.01 | 0.18 | <0.01 | 0.19 | <0.01 | 0.16 |
| Controls | No | Yes | No | Yes | No | Yes |
Table 13 – Difference-in-Difference Intent-to-Treat Effect of Potential PRG Receipt on Cost Outcome: Full Analytic Sample
| Variables | Cumulative Debt | |
| Model 1 | Model 2 | |
| Mean
(SD) |
Mean
(SD) |
|
| Treatment | 3,789***
(213) |
2,773***
(193) |
| Post x Treatment | 189
(229) |
-312
(208) |
| Observations | 75,256 | 75,232 |
| R-squared | 0.06 | 0.26 |
| Controls | No | Yes |
The implied PRG effect is derived by first employing the DID regression model with a binary indicating whether the student received a PRG award in the given term as the outcome variable to capture the proportion of students in the treatment group who received a PRG award, represented below as “Proportion Captured.” To calculate the implied effect, we then take the result from the standard DID regression and multiply by 100 / “Proportion Captured” to get the final estimate. While this allows us to determine the implied effect of PRG receipt, any bias in the standard DID estimate—potentially resulting from differences in trends or other shocks that affect the treatment and control groups differently over time—is scaled up. The relatively low proportion captured across our sample and subsamples means that any biases in the initial estimates could substantially impact our implied effect estimates. As such, these results should be interpreted with caution.
The estimates in Table 14 suggest that had everyone in the treatment group received a PRG award, the graduation rate within one term of students eligible to receive an award would increase by 50 percentage points and the graduation rate within three terms would increase 25 percentage points.
Table 14 – Implied Effect of PRG Receipt on Statistically Significant Outcomes: Full Analytic Sample
| Variables | Difference-in-Difference Estimate | Proportion Captured | Implied Effect |
| Graduation (t+1) | 0.06***
(0.01) |
0.12 | 50 pct points |
| Graduation (t+3) | 0.03**
(0.01) |
0.12 | 25 pct points |
We conducted the same follow-up analyses described in the OLS section earlier to test whether differences in graduation rates within one term, three terms, and six terms were due to differences in sample size. We conducted the same OLS regression analyses described above and set the samples used to examine graduation rate within one term and three terms to be identical to the sample used to examine graduation rate within six terms. The results are very similar to those derived using the initial sample sizes, suggesting that the differences in graduation rates are not due to differences in sample size. More details on the results from these additional analyses can be found in Appendix B.
Results: Student Subgroups of Interest
Pell Recipient Subgroup
There were no significant impacts of potential Panther Retention Grant receipt on graduation within three terms and graduation within six terms among Pell recipients. However, students in the treatment group had a graduation rate within one term that was five percentage points higher than non-recipients in the control group (see Table 15). Similar to the results for the full analytic sample, this suggests that potential PRG receipt decreased time to degree among Pell recipients but did not help students graduate who would otherwise not have.
Table 15 – Difference-in-Difference Intent-to-Treat Effect of Potential PRG Receipt on Completion Outcomes: Pell Recipient Subgroup
| Variables | Graduation (t+1) | Graduation (t+3) | Graduation (t+6) | |||
| Model 1 | Model 2 | Model 1 | Model 2 | Model 1 | Model 2 | |
| Mean
(SD) |
Mean
(SD) |
Mean
(SD) |
Mean
(SD) |
Mean
(SD) |
Mean
(SD) |
|
| Treatment | -0.10***
(0.02) |
-0.07***
(0.02) |
-0.07***
(0.02) |
-0.05**
(0.02) |
-0.04**
(0.02) |
-0.02
(0.02) |
| Post x Treatment | 0.07***
(0.02) |
0.05**
(0.02) |
0.04**
(0.02) |
0.02
(0.02) |
0.02
(0.02) |
0.01
(0.02) |
| Observations | 43,107 | 43,087 | 40,376 | 40,356 | 35,652 | 35,632 |
| R-squared | 0.01 | 0.20 | 0.01 | 0.20 | <0.01 | 0.17 |
| Controls | No | Yes | No | Yes | No | Yes |
There were also significant impacts on cumulative debt following potential PRG receipt among Pell recipients (see Table 16).
Table 16 – Difference-in-Difference Intent-to-Treat Effect of Potential PRG Receipt on Cost Outcome: Pell Recipient Subgroup
| Variables | Cumulative Debt | |
| Model 1 | Model 2 | |
| Mean
(SD) |
Mean
(SD) |
|
| Treatment | 3,621***
(340) |
2,814***
(308) |
| Post x Treatment | -436
(369) |
-697**
(335) |
| Observations | 41,904 | 41,885 |
| R-squared | 0.07 | 0.25 |
| Controls | No | Yes |
The estimates in Table 17 suggest that had every Pell recipient in the treatment group received a PRG award, the graduation rate within one term of Pell recipients eligible to receive an award would increase by 33 percentage points and average cumulative debt would decrease by $4,647.
Table 17 – Implied Effect of PRG Receipt on Statistically Significant Outcomes: Pell Recipient Subgroup
| Variables | Difference-in-Difference Estimate | Proportion Captured | Implied Effect |
| Graduation (t+1) | 0.05**
(0.02) |
0.15 | 33 pct points |
| Cumulative debt | -697**
(335) |
0.15 | -4,647 |
Underrepresented Racial and Ethnic Minority Student Subgroup
There were significant impacts on graduation within one term and graduation within three terms among underrepresented minority students. Specifically, students in the treatment group had a graduation rate within one term that was six percentage points higher and a graduation rate within three terms that was four percentage points higher than non-recipients in the control group (see Table 18). There were no significant impacts on graduation within six terms. Again, this finding suggests that potential Panther Retention Grant receipt decreased time to degree but did not help underrepresented minority students graduate who otherwise would not have.
Table 18 – Difference-in-Difference Intent-to-Treat Effect of Potential PRG Receipt on Completion Outcomes: Underrepresented Racial and Ethnic Minority Student Subgroup
| Variables | Graduation (t+1) | Graduation (t+3) | Graduation (t+6) | |||
| Model 1 | Model 2 | Model 1 | Model 2 | Model 1 | Model 2 | |
| Mean
(SD) |
Mean
(SD) |
Mean
(SD) |
Mean
(SD) |
Mean
(SD) |
Mean
(SD) |
|
| Treatment | -0.09***
(0.02) |
-0.07***
(0.02) |
-0.06***
(0.02) |
-0.05***
(0.02) |
-0.02
(0.02) |
-0.02
(0.02) |
| Post x Treatment | 0.07***
(0.02) |
0.06***
(0.02) |
0.06**
(0.02) |
0.04*
(0.02) |
0.03
(0.02) |
0.01
(0.02) |
| Observations | 41,218 | 41,200 | 38,377 | 38,359 | 33,504 | 33,486 |
| R-squared | 0.01 | 0.20 | 0.01 | 0.21 | <0.01 | 0.19 |
| Controls | No | Yes | No | Yes | No | Yes |
Potential PRG recipients also accumulated $990 less debt than non-recipients following receipt (see Table 19).
Table 19 – Difference-in-Difference Intent-to-Treat Effect of Potential PRG Receipt on Cost Outcome: Underrepresented Racial and Ethnic Minority Student Subgroup
| Variables | Cumulative Debt | |
| Model 1 | Model 2 | |
| Mean
(SD) |
Mean
(SD) |
|
| Treatment | 4,557***
(395) |
3,762***
(363) |
| Post x Treatment | -814*
(422) |
-953**
(389) |
| Observations | 40,010 | 39,993 |
| R-squared | 0.08 | 0.24 |
| Controls | No | Yes |
The estimates in Table 20 suggest that had all students from underrepresented minority backgrounds in the treatment group received a PRG, the graduation rate among these students within one term would increase by 38 percentage points, the graduation within three terms would increase by 25 percentage points, and average cumulative debt would decrease by $5,956.
Table 20 – Implied Effect of PRG Receipt on Statistically Significant Outcomes: Underrepresented Racial and Ethnic Minority Student Subgroup
| Variables | Difference-in-Difference Estimate | Proportion Captured | Implied Effect |
| Graduation (t+1) | 0.06***
(0.02) |
0.16 | 38 pct pts |
| Graduation (t+3) | 0.04*
(0.02) |
0.16 | 25 pct pts |
| Cumulative debt | -953**
(389) |
0.16 | -5,956 |
Additional Analyses
Calculating Retention of Non-Seniors
We also estimated the impact of Panther Retention Grant receipt on retention. We made a few changes to the sample for this analysis. While continuing to restrict the sample to students who were meeting satisfactory academic progress and who had exhausted all other sources of aid in the given term, we included only non-seniors in the dataset since awards given to seniors are typically intended to increase completion while awards to non-seniors are intended to increase retention. Second, we included students in the dataset who did not make it to Georgia State’s census in a given term but recorded some enrollment activity in that term, in order to estimate the impact of PRG receipt on enrollment in the given term.[50] These changes resulted in an analytic sample with 158,757 observations, representing 46,865 students and 2,455 PRG awards (analytic sample 2). It is worth noting that since the program primarily focused on seniors, the sample of awards for this analysis is relatively small.
We chose to estimate the impact of PRG receipt on retention by conducting the same OLS regression analyses described earlier with two new outcome variables: enrollment in the given term and persistence to the subsequent term, defined as whether the student earned a bachelor’s degree by the subsequent term or was enrolled in the subsequent term.[51] There were significant impacts on enrollment in the given term. After controlling for observable differences between the two groups, PRG recipients had an enrollment rate of nearly 100 percent, two percentage points higher than non-PRG recipients. In other words, PRG receipt in a given term essentially guaranteed that the student would be enrolled through the university’s census for that term. However, after controlling for observable differences between the two groups, PRG recipients had a persistence rate in the subsequent term that was not statistically different from non-PRG recipients. This finding suggests that while PRG receipt may provide temporary financial relief that allows students to remain enrolled in the current term, it did not help eligible students continue to enroll in future terms at rates higher than non-recipients. One possible explanation is that PRG recipients continued to face financial hardship. The program team made a similar conclusion during the early years of the program when they awarded a majority of grants to underclassmen and found that those students continued to struggle to afford to stay in college.
Estimating Impacts on ROI
We also attempted to estimate the program’s return on investment to better understand its effect on institutional finances. To estimate the revenue generated by the program, we turned to the general model employed by the Boston Consulting Group, which relies on retention rate increases in the current and subsequent terms and corresponding tuition payment increases as the mechanism for a positive ROI. For this analysis, we returned to a sample consisting of super seniors (similar to the Boston Consulting Group analysis, which focused on seniors) who were meeting satisfactory academic progress and who had exhausted all other sources of aid in the given term. However, we expanded it to include students in the dataset who did not make it to Georgia State’s census in the given term but recorded some enrollment activity in that term, since students who dropout are refunded payments made in the given term.[52] These changes resulted in an analytic sample with 83,700 observations, representing 30,415 students and 4,837 PRG awards (analytic sample 3).
An essential part of estimating ROI is calculating the amount of revenue that a program generates and comparing it to the amount of revenue that would have been generated had the program not existed (i.e., the counterfactual). This is done by estimating the additional revenue generated by the program and then deducting program cost. To measure the amount of revenue generated by the program, we created a new outcome variable: cumulative payments made by the student at Georgia State in the given term exit or completion. While previous analyses of student balances are based on the first snapshot date of the term, we calculated cumulative payments as of the last snapshot date of the term to provide a more complete picture of student expenditures. The best approach to estimating the revenue that would have been generated had the program not existed is less clear. We employ two different methods to estimate this.
Method 1
The first method, perhaps most closely aligned with accounting practices, examines the revenues and expenses applied to a balance sheet by comparing payments made by PRG recipients (i.e., revenue) to the PRG award amount (i.e., expenses). Implicit in this approach is the assumption that payments would not have been made by the student if they did not receive an award. Among the 4,451 PRG awards given to students in analytic sample 3 who eventually exited the university or graduated, the average amount spent on tuition post-receipt was $7,524 and the average award was $1,435, totaling approximately $33.5 million in revenue and $6.4 million in expenses, representing $27.1 million in additional revenue. These findings are similar to those in an earlier analysis by the Boston Consulting Group, which found that the program generated a large and positive ROI. That analysis also operates under the assumption that most of these payments would not have been made by the student if the program did not exist because it assumes that the vast majority of grant recipients otherwise would not have enrolled in the current term and subsequent terms at Georgia State.[53]
Method 2
An alternative approach is to apply the framework that we used in the main analyses, which in this context would be to compare the revenue of PRG recipients to non-PRG recipients, while controlling for key observable differences between the two groups (i.e., the counterfactual). The difference serves as an estimate of the additional revenue generated by the program. To do that, we conducted the same OLS regression analyses described earlier with the new payments outcome variable.
After controlling for observable differences between the two groups, PRG recipients spent $4,450 less than non-PRG recipients, which suggests that the program did not yield a positive financial ROI, in contrast to the Boston Consulting Group analysis and the findings from method 1.[54] There are two reasons for these conflicting results. First, this method takes into account the fact that PRG recipients did not enroll at higher rates in the subsequent term than otherwise similar non-recipients, likely driven by continued financial struggles. Second, after making the same discovery, the program team changed the retention grant program to a completion grant program focused on giving awards to students who were very close to graduating. This change is important because it meant the majority of awards were given to students who had relatively few terms remaining, resulting in a decline in the potential impact on subsequent retention and therefore tuition revenue. This is borne out in the data—super seniors who received a PRG award enrolled in fewer terms and exited the university with less debt following PRG receipt than non-recipients, likely driven by fewer payments. In summary, method 1 is suggestive that the program generated a positive ROI while method 2 is not. More details on the results from these additional analyses can be found in Appendix B.
While it is common for higher education researchers to employ either of these models to estimate the ROI of interventions aimed at increasing retention, relying solely on tuition payments may offer only a narrow and limited understanding of a program’s financial impact. Specifically, it ignores the potential benefits that may arise from increases in student success, including increased state funding, national acclaim, and increased alumni donations, among other things. It also fails to capture the financial benefits to students. Students who graduate in fewer terms can enter the labor market, accrue earnings, and begin paying back loans at faster rates than they otherwise would. Regardless of its direct financial impact, the program has likely contributed to student success and benefited the university in ways that are not captured in our analysis.
Challenges and Limitations
While we found significant impacts of PRG receipt on several outcomes of interest, there are limitations to this study that are important to note. The primary goal of the program is, understandably, to help students in financial need. In practice, this meant that the eligibility criteria were not always strictly enforced and were treated more as guidelines rather than requirements. For instance, academic advisors were allowed to identify and nominate students for a grant who they believed would greatly benefit from additional financial support. As a result, some students who received a grant did not meet all eligibility criteria. Second, the eligibility requirements themselves fluctuated over the years. While these changes may have produced larger benefits for students, they make it more difficult to establish a causal link between PRG receipt and student outcomes.
Second, the snapshot date data we used to capture students’ financial status provided an incomplete—and at times inaccurate—financial picture. A more accurate representation of the financial status of grant recipients is the snapshot date that most closely precedes the grant award date. That date could not be used, however, since we needed to establish a control group consisting of students who did not receive a grant and those students do not have such a date. As an alternative, we used the first snapshot date of each term since that was typically the day before the largest spike in awards. That had at least one significant drawback, namely that the program team reviewed eligibility and awarded grants at multiple junctures throughout a term. Since balances and eligibility fluctuate, this meant that students who were ineligible as of the first snapshot date, and therefore identified as ineligible in our analysis, could become eligible later in the term and receive a grant. In addition, the program administration team and financial aid office had additional information on incoming and pending financial support that made some students eligible for a grant (i.e., funding that lowered their balance to under the cutoff) that was not available to us. These students appeared in the dataset to be ineligible due to our inability to capture any support that was not in students’ accounts on the first snapshot date. This likely contributed to the lower-than-expected share of grant recipients who had a balance at or below the $2,500 cutoff, which ultimately prevented us from employing a regression discontinuity design.
Third, even after restricting the sample to super seniors who were meeting SAP and had exhausted other sources of financial aid, there are significant differences, on average, between those who did and did not receive a PRG. While we accounted for observable differences in the primary OLS models with the inclusion of controls, it is likely that there are unobserved differences between the two groups that we failed to control for. Support for this assumption lies in the fact that many students who received the grant were very close to graduation, suggesting that grant administrators examined student characteristics that determined students’ likelihood of graduating in that term. Since we did not have access to all of those characteristics, it is possible that differences in outcomes identified in the OLS analyses between PRG recipients and non-PRG recipients were at least partially influenced by unobserved differences between the two groups and not by PRG receipt.
Finally, in order for a difference-in-difference analysis to produce unbiased estimates, differences between the treatment and control groups must be constant over time prior to the implementation of the PRG program and would have continued to be had the PRG program never been implemented. While the event studies in Appendix C provide some evidence that the trends in the pre-period were fairly similar between the treatment and control groups, and Table 11 shows similar trends in student characteristics, they do not provide definitive proof, and it is not possible to determine the counterfactual if the program was never created. Over the last two decades, Georgia State has implemented a number of programs aimed at supporting students and increasing their success, which may have disproportionately impacted various subgroups of students, including those with and without a balance at the beginning of a term.
Another reason to be cautious of the difference-in-difference findings is the low treatment intensity (i.e., the fact that only a small share of students in the treatment group received a PRG award in the post-period). One of the primary reasons we restricted our sample to fourth-year standing students and ultimately to super seniors was to increase the share of treatment group students who received a grant in an effort to better isolate the effect of the grant on outcomes. Even after such restrictions, only 12 percent of the treatment group received a grant, which resulted in extremely—and implausibly—high implied effects. Additional analyses revealed that the vast majority of students in our sample who were eligible for a grant as of the first snapshot date but did not receive one no longer had a balance by the second snapshot date, which typically fell immediately after the payment deadline. It is possible that the program team did not award grants to these students because they were aware of incoming and pending payments that would clear their balance by the payment deadline. Even after accounting for these students, there were additional cases in which students, most commonly among seniors, were permitted to carry balances through the term because they had a track record of paying their balance.
Discussion
Key Takeaways
In both the OLS and DID analyses, we observed large significant impacts of Panther Retention Grant receipt on graduation within one term and three terms for the full analytic sample and subgroups of interest, with the size of the effect diminishing as the time horizon increased. While we observed significant impacts of PRG receipt on graduation within six terms in the OLS analysis, we did not find significant impacts on that outcome when employing a DID. These findings provide evidence that PRG receipt reduced students’ time to degree but do not definitively determine whether the grant helped students graduate who otherwise would not have.
We also observed significant impacts of PRG receipt on cumulative debt in the OLS analysis for the full analytic sample and subgroups of interest, decreasing the amount of debt incurred by an average of about $3,700. In the DID analysis, while we did not find significant impacts of potential PRG receipt on cumulative debt for the full sample, we found that potential grant receipt decreased the amount of debt incurred by Pell recipients and students from underrepresented minority backgrounds. Follow-up analyses revealed that this is likely due to grant recipients enrolling in fewer terms post-receipt and, as a result, being responsible for fewer tuition payments. This suggests that in addition to improving academic outcomes, emergency grant aid programs such as the PRG program have the potential to improve students’ financial well-being.
Despite finding positive impacts on completion and cumulative debt, we did not find evidence that the grant helped students enroll beyond the term in which the grant was awarded. While PRG receipt did have a positive impact on retention in the term of receipt, non-seniors who received a grant persisted to the subsequent term at the same rate as non-recipients, likely driven by financial difficulties that could not be addressed by the grant alone. Our analysis of the program’s impact on institutional finances produced mixed results depending on how the control group (i.e., the counterfactual) was defined.
Avenues for Future Research
Our evaluation serves as one of the first looks into the impacts of emergency micro-grant programs on student success and institutional finances. We have identified a number of areas for future research that will be essential in understanding the effects of these programs nationwide.
Examine the impact of emergency micro-grants on a variety of outcomes. One area of investigation missing from this evaluation is the longer-term impacts of grant receipt. We found that students who received an award graduated sooner than their peers who did not receive one. This likely results in earlier entry into the labor force, which could potentially have impacts on employment, earnings, and other longer-term financial outcomes. Examining the impact of emergency micro-grant programs on these outcomes would certainly be a fruitful area for future evaluators to explore.
Another potential area of investigation is the impact on students’ psychological well-being. There has been a lot of research recently, especially since the COVID-19 pandemic, on the impact of financial stress on mental health. It is possible that providing at least temporary financial relief reduces the stress that comes with not knowing whether you can afford to stay in college. This is another set of outcomes worth exploring.
Elucidate grant impacts on retention specifically. As the Panther Retention Grant was primarily given to seniors, we did not focus our analysis on the grant’s impact on retention for students or for underclassmen in particular. Ancillary analyses suggest that the grant may not have had positive impacts on retention, but this is certainly worth further exploring among programs that are targeted toward students earlier in their college careers. An investigation into the impact of grants on retention will also illuminate their broader fiscal impact, as institutional ROI in many cases is tied to retaining students and collecting future tuition revenue.
Employ both quantitative and qualitative methodologies to assess grant programs. While these analyses provide an initial picture on the grant’s impact overall, more granular quantitative and mixed-methods analyses would provide a more in-depth view of how this grant affects recipients. Conducting student focus groups, interviews, and administering surveys could provide key insights into how the grant has impacted students’ college experiences and career trajectories and would provide an excellent supplement to more traditional quantitative evaluations, as well as help improve program design and administration.
Study specific program characteristics that lead to student success. Retention and completion grants operate in a myriad of ways, and it is worth determining which program features best serve students and which might be serving as unnecessary barriers to student success. This is especially important considering the fact that The Hope Center’s study on completion grants at eleven institutions found no evidence of impacts on completion or time to degree, which may have been driven by differences in program implementation or design. The proliferation of these programs at institutions nationwide provides researchers an opportunity not only to continue to evaluate their impact more broadly but also to isolate the individual program characteristics and conditions under which these programs are most beneficial to students and institutions.
Appendix A: Additional Methodological Details
Sample Restrictions
We made a number of changes to the main analytic sample before restricting it to super seniors who were meeting satisfactory academic progress and had exhausted all relevant sources of aid. We first excluded the following types of observations from the dataset:
- Observations in which a student was exclusively enrolled at Perimeter College prior to the consolidation of Perimeter College and Georgia State in the given term.[55]
- Observations in which a student had graduated with a bachelor’s degree from Georgia State in a past term and was a graduate student in the given term.
- Observations in which a student was missing snapshot date data in the given term.
- Observations in which a student recorded some enrollment activity but did not make it to Georgia State’s census in the given term. Including these observations would have introduced a major omitted variable, namely whether the student is actually enrolled in a real way, since a student with minimal activity is unlikely to graduate soon. While it introduces the possibility of bias if PRG receipt causes students to make it to the university’s census, the main outcomes of interest do not focus on the given term. In addition, we conducted the same set of analyses on the main outcomes with these observations included, which did not have a substantive impact on the results.
We then included the following types of observations when generating outcomes of interest but excluded them from the OLS and DID analyses:
- Observations in which a student’s cumulative charges were zero or negative in the given term. Including these observations also would have introduced a major omitted variable, namely whether the student is actually enrolled in a real way because zero cumulative charges is typically an indication that a student did not register for courses. Students who do not register for courses and are not charged cannot be dropped for nonpayment. Further, PRG receipt, at least theoretically, should not cause students to have zero charges, so it is unlikely that the exclusion of these observations introduced bias.
In addition, we excluded from the OLS and DID analyses observations in which a student received a PRG award under the following circumstances:
- Awards distributed before the first snapshot of the given term, meaning the possible effect preceded the cause.
- Awards in which the date that the grant was distributed was at least 14 days (for summer and spring terms) or 30 days (for fall term) after the last day of the term that the balance was incurred, indicating an award given to students who had dropped out in the given term and expressed interest in re-enrolling in a future term.
- Awards distributed to address a HOPE Scholarship processing error in which students were awarded PRGs who otherwise were ineligible.
Regression Discontinuity Exploration
We initially intended to perform a regression discontinuity study of the impacts of Panther Retention Grant receipt on our outcomes of interest. We expected the vast majority of balances on the first snapshot date of the term to be $2,500 or less. Upon examination of the data, we discovered that only 30 percent of balances fell under that threshold. Even when we changed our sample to balances on the day that most closely preceded the award date, only 65 percent were $2,500 or less. Limiting our sample to only fourth-year standing students who had exhausted aid and were meeting SAP did not meaningfully change the results. In other words, we found little evidence of a discontinuity in the probability of PRG receipt around the balance cutoff that would suggest that students at or below the cutoff had a much higher probability than those above the cutoff.
Figure 1 displays the relationship between a student’s balance on the first snapshot date of the given term and the share of students with that particular balance who received a PRG award among fourth-year standing students who were meeting SAP and had exhausted all aid in the given term. In order for a regression discontinuity design to be feasible in this context, there needs to be a sharp decline in the proportion of students with a balance over $2,500 who received a PRG. While we do find a drop in the proportion of students who received a PRG, it is primarily driven by the relatively large share of students at or immediately below the cutoff point at the cutoff who received a PRG, with the remaining bins having comparable shares. In addition, the fact that many of the shares are below 10 percent suggest that relatively few students received an award around the cutoff, which would significantly decrease the power of a RD.
Figure 1 – Share of Students With a Given Balance who Received a PRG Award: Fourth-Year Standing Students Meeting SAP and Exhausted Aid
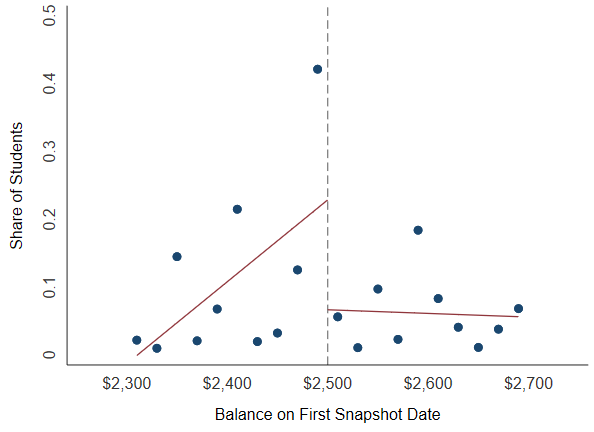
In addition to not finding a first stage for the regression discontinuity, we found that the distribution of balances often adhered to charges for a given term. Specifically, unpaid balances often reflected the amount students were charged for the given term (which could be greater than or less than $2,500), driven by students who had yet to make any tuition payments as of the first snapshot of the term. This meant that the probability of falling just below or just above the threshold was systematically related to the term of enrollment, meaning that whether a student fell above or below the threshold was not random.
We also investigated the possibility of replacing the balance cutoff with an entering cumulative GPA cutoff of 2.0 because students are required to be in good academic standing in order to be eligible for a grant. However, there was strong evidence of students clustering at or slightly above the cutoff, suggesting that the groups of students just above and just below the threshold are not similar and not random, which is required for an RD to produce unbiased results. As shown in the figure below, the number of students with an entering cumulative GPA between 2.0 and 2.02 jumps significantly, likely driven by unobserved factors that would bias the results of a RD.
Figure 2 – Number of Students with a Given Entering Cumulative GPA: Fourth-Year Standing Students Meeting SAP and Exhausted Aid
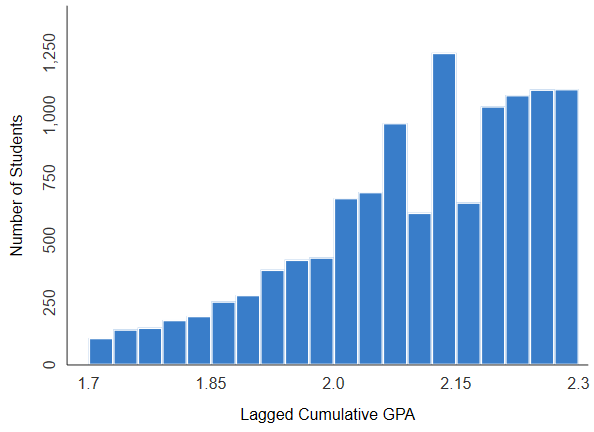
Appendix B: Results Tables: Additional Analyses
Table 21 – Treatment-on-Treated Effect of PRG Receipt on Completion Outcomes: Full Analytic Sample of Graduation Within Six Terms
| Variables | Graduation (t+1) | Graduation (t+3) | Graduation (t+6) |
| Mean
(SD) |
Mean
(SD) |
Mean
(SD) |
|
| Treatment | 0.16***
(0.01) |
0.09***
(0.01) |
0.05***
(0.01) |
| Control Mean | 0.45 | 0.67 | 0.77 |
| Observations | 63,703 | 63,703 | 63,703 |
| R-squared | 0.18 | 0.19 | 0.16 |
| Controls | Yes | Yes | Yes |
Table 22 – Treatment-on-Treated Effect of PRG Receipt on Future Terms Enrolled: Full Analytic Sample and Subgroups of Interest
| Variables | Full Analytic Sample | Pell Recipient Subgroup | URM Student Subgroup |
| Mean
(SD) |
Mean
(SD) |
Mean
(SD) |
|
| Treatment | -0.44***
(0.02) |
-0.41***
(0.02) |
-0.37***
(0.02) |
| Control Mean | 1.57 | 1.65 | 1.67 |
| Observations | 77,089 | 43,087 | 41,200 |
| R-squared | 0.17 | 0.18 | 0.18 |
| Controls | Yes | Yes | Yes |
Table 23 – Difference-in-Difference Intent-to-Treat Effect of Potential PRG Receipt on Completion Outcomes: Full Analytic Sample of Graduation Within Six Terms
| Variables | Graduation (t+1) | Graduation (t+3) | Graduation (t+6) | |||
| Model 1 | Model 2 | Model 1 | Model 2 | Model 1 | Model 2 | |
| Mean
(SD) |
Mean
(SD) |
Mean
(SD) |
Mean
(SD) |
Mean
(SD) |
Mean
(SD) |
|
| Treatment | -0.10***
(0.01) |
-0.07***
(0.01) |
-0.05***
(0.01) |
-0.04***
(0.01) |
-0.03**
(0.01) |
-0.02**
(0.01) |
| Post x Treatment | 0.05***
(0.01) |
0.05***
(0.01) |
0.03**
(0.01) |
0.03**
(0.01) |
0.01
(0.01) |
0.01
(0.01) |
| Observations | 63,729 | 63,703 | 63,729 | 63,703 | 63,729 | 63,703 |
| R-squared | 0.01 | 0.18 | <0.01 | 0.19 | <0.01 | 0.16 |
| Controls | No | Yes | No | Yes | No | Yes |
Table 24 – Treatment-on-Treated Effect of PRG Receipt on Enrollment and Persistence Outcomes: Full Analytic Sample 2
| Variables | Enrollment (t) | Persistence (t+1) |
| Mean
(SD) |
Mean
(SD) |
|
| Treatment | 0.02***
(<0.01) |
-0.01
(0.01) |
| Control Mean | 0.98 | 0.90 |
| Observations | 137,899 | 130,291 |
| R-squared | 0.03 | 0.07 |
| Controls | Yes | Yes |
Table 25 – Treatment-on-Treated Effect of PRG Receipt on Cumulative Payments (ROI Method 2): Full Analytic Sample 3
| Variables | Cumulative Payments |
| Mean
(SD) |
|
| Treatment | -4,450***
(113) |
| Control Mean | 13,097 |
| Observations | 78,189 |
| R-squared | 0.23 |
| Controls | Yes |
Appendix C: Event Studies
In order for difference-in-difference estimates to be unbiased, among other things, the trends in the outcome measures for the treatment and control groups in the pre-period must be very similar. This is known as the parallel trends assumption. We employed event studies to test this assumption.
While the OLS and DID analyses were conducted term-by-term, the event studies compare changes academic year-by-academic year (e.g., Fall 2011 to Summer 2012 terms) to reduce noise caused by large differences in average outcomes between fall, spring, and summer terms. Because the Fall 2008 and Spring 2009 terms were already excluded from the analysis, the first term in the dataset and the only term that is part of the 2008-09 academic year is the Summer 2009 term. As a result, the average outcomes of that academic year are very different than the average outcomes of the other academic years that include all three terms, so we removed the Summer 2009 term from the event studies (but included the Summer 2009 term in the term-by-term OLS and DID analyses throughout the report).
Figure 3 – Event Study of Graduation Within One Term Outcome: Full Analytic Sample
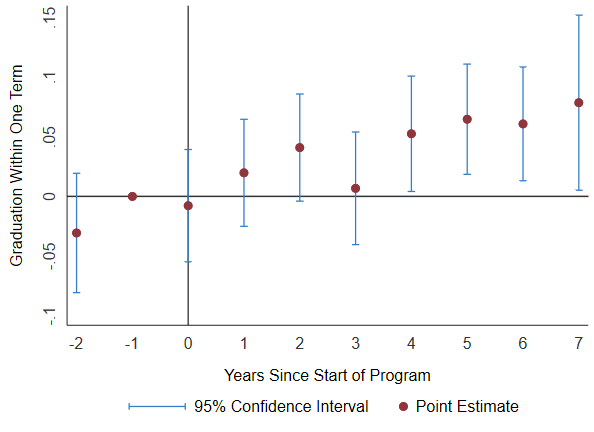
Figure 4 – Event Study of Graduation Within Three Terms Outcome: Full Analytic Sample
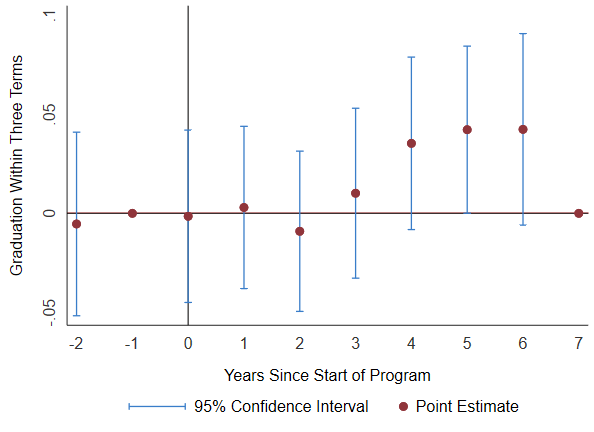
Figure 5 – Event Study of Graduation Within Six Terms Outcome: Full Analytic Sample
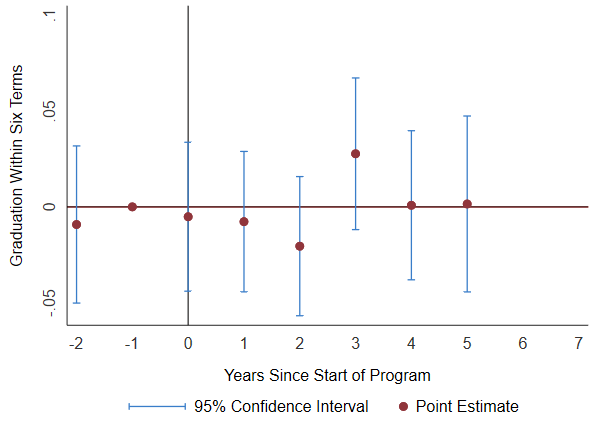
Figure 6 – Event Study of Cumulative Debt Outcome: Full Analytic Sample
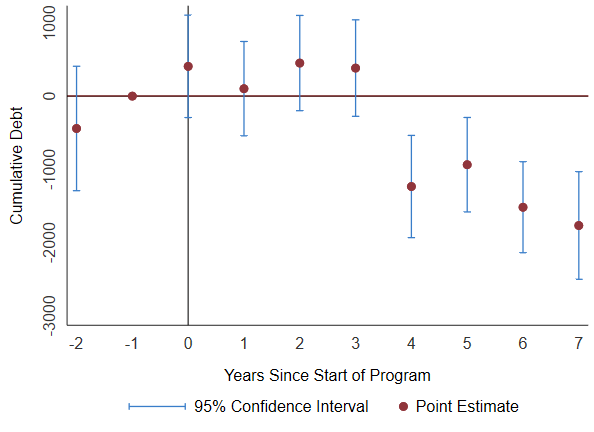
Endnotes
- The views expressed are those of the authors and should not be attributed to the foundation. ↑
- We define underrepresented racial and ethnic minority groups as Black or African American, Hispanic, Native Hawaiian or Other Pacific Islander, or American Indian or Alaska Native as defined by IPEDS reporting categories. ↑
- “Completing College: National and State Reports,” National Student Clearinghouse Research Center, December 2020, https://nscresearchcenter.org/wp-content/uploads/Completions_Report_2020.pdf. ↑
- “Some College, No Degree: A 2019 Snapshot for the Nation and 50 States,” National Student Clearinghouse Research Center, October 2019, https://nscresearchcenter.org/wp-content/uploads/SCND_Report_2019.pdf. ↑
- See “Unemployment Rises in 2020, as the Country Battles the COVID-19 Pandemic,” US Bureau of Labor Statistics, June 2021, https://www.bls.gov/opub/mlr/2021/article/unemployment-rises-in-2020-as-the-country-battles-the-covid-19-pandemic.htm; Jaison R. Abel and Richard Deitz, “Despite Rising Costs, College Is Still a Good Investment, Federal Reserve Bank of New York, 5 June 2019, https://libertystreeteconomics.newyorkfed.org/2019/06/despite-rising-costs-college-is-still-a-good-investment/; Elissa Nadworny, “These Are The People Struggling The Most To Pay Back Student Loans,” National Public Radio, July 9, 2019, https://www.npr.org/2019/07/09/738985632/these-are-the-people-struggling-the-most-to-pay-back-student-loans. ↑
- Over the past ten years, tuition and fees at America’s colleges and universities have jumped 24 percent, outpacing growth in grant aid and tax benefits, as well as median household income. The purchasing power of the Pell Grant, the largest source of federally funded aid, has been decreasing for decades. In 2019, a Pell Grant covered just 28 percent of the price of attending a four-year public college, compared to 40 percent in 2000. See “Table 330.10., Average Undergraduate Tuition, Fees, Room, and Board Rates Charged for Full-time Students in Degree-granting Postsecondary Institutions, by Level and Control of Institution: Selected Years, 1963-64 through 2019-20,” National Center for Education Statistics, 2020, https://nces.ed.gov/programs/digest/d20/tables/dt20_330.10.asp?current.asp; Jennifer Ma, Matea Pender, and CJ Libassi, “Trends in College Pricing and Student Aid 2020,” College Board, 2020, https://research.collegeboard.org/pdf/trends-college-pricing-student-aid-2020.pdf; “Real Median Household Income in the United States,” St. Louis Federal Reserve, 2021, https://fred.stlouisfed.org/series/MEHOINUSA672N; “How to Secure and Strengthen Pell Grants to Increase College Access and Success,” The Institute for College Access & Success, 16 October 2018, https://ticas.org/files/pub_files/pell_recs_one_pager.pdf. ↑
- Melissa Blankstein, “Basic Needs Data: A Guide for Higher Education,” Ithaka S+R, 2021, https://sr.ithaka.org/page/basic-needs-data/. ↑
- This is particularly true for low-income students and students of color, who left higher education at higher rates and may not return. See Jessica Dickler, “Fewer Kids Are Going to College Because They Say It Costs Too Much,” CNBC, 14 March 2021, https://www.cnbc.com/2021/03/14/fewer-kids-going-to-college-because-of-cost.html; “Current Term Enrollment Estimates: Fall 2020,” National Student Clearinghouse Research Center, 2020, https://nscresearchcenter.org/wp-content/uploads/CTEE_Report_Fall_2020.pdf; “Financial Aid Innovations for College Affordability and Mitigating Student Debt,” TIAA Institute and Association of Public & Land-Grant Universities, November 2020, https://www.tiaainstitute.org/sites/default/files/presentations/2021-02/TIAA%20Institue%20APLU_The%20pandemic%2C%20college%20affordability%2C%20and%20student%20debt_TI_November%202020.pdf. ↑
- “Panther Retention Grants: Georgia State University,” Georgia State University, 2018, https://success.gsu.edu/download/panther-retention-grant-roi-analysis-2018/?wpdmdl=6472129&ind=1536949019499. ↑
- “Emergency Financial Aid Programs,” MDRC, https://www2.ed.gov/documents/college-completion/emergency-financial-aid-programs.pdf; Christian Geckeler et al, “Helping Community College Students Cope with Financial Emergencies: Lessons from the Dreamkeepers and Angel Fund Emergency Financial Aid Programs,” MDRC, May 2008, https://www.mdrc.org/sites/default/files/full_383.pdf. ↑
- Christian Geckeler et al, “Helping Community College Students Cope with Financial Emergencies: Lessons from the Dreamkeepers and Angel Fund Emergency Financial Aid Programs,” MDRC, May 2008, https://www.mdrc.org/sites/default/files/full_383.pdf. ↑
- “College Housing Assistance Program (CHAP),” Tacoma Community College, https://www.tacomacc.edu/tcc-life/life-resources/college_housing_assistance_program; Julia Schmalz and Katherine Mangan, “A Culture of Caring: Amarillo College’s ‘No Excuses’ Program for Low-income Students Has Made It a National Model,” The Chronicle of Higher Education, 3 April 2019, https://www.chronicle.com/interactives/20190403-amarillo. ↑
- Joe Wyatt, “AC Acquires $250,000 Grant to Support Student Emergency Fund,” Amarillo College, 2 April 2020, https://www.actx.edu/blog/id/434. ↑
- Jill Barshay, “A ’Wildly Intrusive’ Way to Help Older College Students Get Their Degrees,” The Hechinger Report, 6 January 2020, https://hechingerreport.org/a-wildly-intrusive-way-to-help-older-college-students-get-their-degrees/. ↑
- Kevin Kruger, Amelia Parnell, and Alexis Wesaw, “Landscape Analysis of Emergency Aid Programs,” National Association of Student Personnel Administrators, 2016, https://www.naspa.org/files/dmfile/Emergency_Aid_Report.pdf. ↑
- “Foiling the Drop-out Trap: Completion Grant Practices for Retaining and Graduating Students,” Coalition of Urban Serving Universities and Association of Public & Land-Grant Universities, 2016, https://www.aplu.org/library/foiling-the-drop-out-trap-completion-grant-practices-for-retaining-and-graduating-students/File. ↑
- Paul Fain, “Small Grants, Big Impact,” Inside Higher Ed, 22 February 2016, https://www.insidehighered.com/news/2016/02/22/spread-emergency-aid-and-microgrants-show-strong-results. ↑
- See “CLA Student Emergency Microgrant Application,” Middle Tennessee State University, https://www.mtsu.edu/liberalarts/microgrant.php; Ryan Drawdy, ”Micro-Grants as Stop-Out Prevention at University of North Carolina at Charlotte,” Helix Education, 17 September 2018, https://www.helixeducation.com/resources/blog/micro-grant-tina-mcentire/; Marian Conway, “California Goes All Out to Boost College Completion Rates,” Nonprofit Quarterly, 10 December 2019, https://nonprofitquarterly.org/california-goes-all-out-to-boost-college-completion-rates/; “Panther Retention Grants,” Georgia State University, https://success.gsu.edu/initiatives/panther-retention-grants/. ↑
- Anne Krapfl, “Sixty ISU Seniors Receive First Completion Grants,” Iowa State University, 3 May 2018, https://www.inside.iastate.edu/article/2018/05/03/complete. ↑
- Ryan Drawdy, “Micro-Grants as Stop-Out Prevention at University of North Carolina at Charlotte,” Helix Education, 17 September 2018, https://www.helixeducation.com/resources/blog/micro-grant-tina-mcentire/; “CLA Student Emergency Microgrant Application,” Middle Tennessee State University, https://www.mtsu.edu/liberalarts/microgrant.php. ↑
- “Completion Grants: A College Affordability Innovation Worthy of Public Investment?” The Hope Center for College, Community, and Justice and the Association of Public & Land-Grant Universities, 12 December 2019, https://hope4college.com/wp-content/uploads/2019/12/Completion-Grant-Policy-Brief-layout-v3-12-12-19.pdf.; “Foiling the Drop-out Trap: Completion Grant Practices for Retaining and Graduating Students,” Coalition of Urban Serving Universities and Association of Public & Land-Grant Universities, 2016, https://www.aplu.org/library/foiling-the-drop-out-trap-completion-grant-practices-for-retaining-and-graduating-students/File. ↑
- Larry Gordon, “Colleges Offer Micro Grants to Get Cash-strapped Students Across Finish Line,” EdSource, 25 February 2018, https://edsource.org/2018/colleges-offer-micro-grants-to-get-cash-strapped-students-across-finish-line/593912. ↑
- Ibid. ↑
- Sara Goldrick-Rab et al, “Completion Grants: An Evaluation of Experimental Findings on College Attainment,” The Hope Center for College, Community, and Justice, Working Paper, December 2021, https://hope4college.com/completion-grants-an-evaluation-of-experimental-findings-on-college-attainment/. ↑
- Interview with Ben Brandon, Senior Director of Student Success Analytics, 8 November 2021. ↑
- Interview with Ben Brandon, Senior Director of Student Success Analytics, and James Blackburn, Associate Vice President of Student Financial Services, 4 February 2020. ↑
- Interview with Ben Brandon, Senior Director of Student Success Analytics, and James Blackburn, Associate Vice President of Student Financial Services, 25 September 2019; Interview with Allison Calhoun-Brown, Senior Vice President for Student Success, 20 February 2020. ↑
- For this analysis, we defined an academic year as beginning with the fall term and ending with the summer term. ↑
- The last term in the dataset is the Spring 2019 term so counts for the 2018-19 academic year do not include the Summer 2019 term. ↑
- Twelve students who received grants were missing their standing in the dataset, which brings the total number of grants up to 10,298. An additional two students received grants in terms in which they were not enrolled and were excluded from this table to match the full sample used for the analyses described below. ↑
- Types of aid include any institutional or federal grant aid, as well as subsidized or unsubsidized Stafford loans. ↑
- Interview with Allison Calhoun-Brown, Senior Vice President for Student Success, 20 February 2020; Interview with Ben Brandon, Senior Director of Student Success Analytics, and James Blackburn, Associate Vice President of Student Financial Services, 25 September 2019. ↑
- Interview with Allison Calhoun-Brown, Senior Vice President for Student Success, 20 February 2020. ↑
- “Panther Retention Grants: Georgia State University,” Georgia State University, 2018, https://success.gsu.edu/download/panther-retention-grant-roi-analysis-2018/?wpdmdl=6472129&ind=1536949019499. ↑
- Ibid. ↑
- Based on this definition, 0 students were categorized as a super senior in the Fall 2008 or Spring 2009 terms because those are the first two terms in the dataset. As a result, we removed all observations in those terms from the analysis. ↑
- The functional balance of a negative balance is 0. ↑
- We use debt accumulated from the given term until exit or completion instead of total cumulative debt at exit or completion because the latter for super seniors would primarily be borrowed prior to PRG receipt and therefore would serve as a poor outcome measuring the impact of PRG receipt. ↑
- See Amanda Janice and Mamie Voight, ”Toward Convergence: A Technical Guide for the Postsecondary Metrics Framework,” Institute for Higher Education Policy, May 2016, https://www.ihep.org/wp-content/uploads/2016/05/uploads_docs_pubs_ihep_toward_convergence_0.pdf. ↑
- We coded the last term as missing because the dataset does not include data through the term in which the event occurred. ↑
- We coded the last three terms as missing because the dataset does not include data through the term in which the event occurred. ↑
- We coded the last six terms as missing because the dataset does not include data through the term in which the event occurred. ↑
- We coded observations for students who were enrolled in the last term of the dataset and had yet to graduate as missing because it is unclear whether the student planned to return in subsequent terms. ↑
- The full list of controls are: number of terms as a senior, age at time of enrollment, binary for whether student is female, binary for each race/ethnicity category, lagged enrollment, lagged institutional credit accumulation, lagged total credit accumulation, lagged cumulative GPA, lagged Pell receipt, lagged cumulative debt, binary for whether student had an outstanding balance on the first snapshot date of the term, functional balance on the first snapshot date of the term, and binary for each term (i.e., term dummies). Lagged refers to a variable capturing the value of the previous term (i.e., lagged Pell receipt refers to whether a student received a Pell Grant in the previous term). ↑
- The shift in focus toward super seniors was beneficial to the OLS analysis in that it made the treatment and control groups more similar, thereby decreasing the likelihood of spurious correlations caused by omitted variable bias. However, it is likely that there are unobservable differences between the two groups that could produce biased estimates. ↑
- We also explored the possibility of further limiting our sample by adding another criterion: having a balance on the first snapshot date of the given term. However, that did not reduce the discrepancies between the treatment and control groups and would have further reduced the sample size, so we decided not to make that change. ↑
- The number of observations decreases (meaning the number of missing observations increases) as the time between the term of receipt and the outcome of interest increases because with longer time horizons, the number of observations in which the outcome is poorly defined increases (i.e., the dataset does not include data through the term in which the outcome occurred). ↑
- Rather than include a post-2011 variable in the regression, we use term dummies to control for unobserved changes each term common to all students. ↑
- The shift in focus toward super-seniors was also beneficial to the DID analyses. While this change reduced the sample size, it increased the share of students in the DID treatment group who received a PRG award, which has important consequences for understanding the implied effect of grant receipt described below. ↑
- As discussed in Appendix A, we excluded these observations from the main analytic sample because including them would have introduced a major omitted variable, namely whether the student is actually enrolled in a real way, since a student with minimal activity is unlikely to graduate soon. While it introduces the possibility of bias if PRG receipt causes students to make it to Georgia State’s census, the main outcomes of interest do not focus on the given term. In addition, we conducted the same set of analyses on the main outcomes with these observations included, which did not have a substantive impact on the results. ↑
- We included the same set of controls, less the number of terms the student was a senior since the sample only includes students who were not seniors. We looked at persistence in the subsequent term to account for the few hundred students who graduated in the given term despite being categorized in the dataset as either first-, second-, or third-year students. When the given term was in the spring, we categorized students as having persisted if they enrolled in either the subsequent summer or fall term since the summer term is optional for most students. ↑
- For accounting purposes, refunded payments to students continue to show up as payments on the balance sheet. To account for this, we coded cumulative payments on the last snapshot date to $0 for students marked as not enrolled in the given term. ↑
- ”Panther Retention Grant: Georgia State University,” Georgia State University, 2018, https://success.gsu.edu/download/panther-retention-grant-roi-analysis-2018/?wpdmdl=6472129&ind=1536949019499. ↑
- Using the same OLS analysis, we also found that PRG recipients spent less than non-recipients when looking only at the given term. ↑
- For more information about this consolidation, see Sosanya Jones, “A Georgia Case Study: A Look at the University System Consolidations with an Eye Towards Race, Ethnicity, and Equity,” Ithaka S+R, 30 August 2021, https://doi.org/10.18665/sr.315852. ↑