Overseeing the Overseers
Can Federal Oversight of Accreditation Improve Student Outcomes?
Introduction
Since the passage of the Higher Education Act (HEA) of 1965, the federal government has relied on the accreditation process to ensure quality at postsecondary institutions receiving federal dollars. In the ensuing decades, spending on higher education by the federal government—most significantly through federal student loans and grants—and by individuals has increased exponentially. Even as this spending helped fuel substantial growth in enrollment, a completion crisis has left many former students with debt but no degree,[1] and highly uncertain labor market prospects. If accreditors have failed to ensure an adequate level of quality control for students attending postsecondary institutions, increased oversight by the federal government is necessary to guarantee institutions are providing high-quality programs.
The accreditation process and the federal role in shaping it are clearly of critical importance for ensuring all students have access to quality postsecondary options. And yet, due to the complexity of the relationship among the federal government, accreditors, and institutions, and the opacity of the accreditation process itself, there is little systematic evidence about the effects on higher education institutions and their students of this quality assurance regime and the periodic federal policy changes that reorient it.
Ithaka S+R began a pilot study in 2021 to assess the feasibility of using publicly available data on the accreditation process and outcomes to evaluate the impact of federal oversight mechanisms on institutional and student outcomes. In this report, we provide an overview of accreditation in the US and assess the impact of changes in federal oversight. We focus on changes to oversight that were part of the 2008 reauthorization of the HEA and specifically look at the Southern Association of Colleges and Schools Commission on Colleges (SACSCOC) institutions given data availability. We also examine an oversight dashboard of accreditors launched in 2016 to understand if this form of public accountability may help improve student outcomes.
Our findings suggest that the 2008 reauthorization of the HEA resulted in no statistical improvement of student outcomes at institutions accredited by the agency we examine, but the 2016 NACIQI pilot project, as well as other efforts made by the Department of Education (ED) towards greater data transparency, may have led to improved student outcomes.
What is accreditation and how does it work?
In 2018 approximately $122.4 billion in Title IV funds were made available to students seeking a postsecondary education at an eligible institution. Institutions access these funds by passing through a “regulatory triad” comprised of state authorization, recognition by ED, and accreditation from an ED recognized accreditation agency. The state and federal government seek to ensure consumer protection and administrative compliance of institutions, respectively, while accreditation agencies are meant to provide “quality assurance” of the education provided by institutions.[2] Jointly, the triad is supposed to ensure that public and private investments into higher education are beneficial for taxpayers and students.
The lack of a centralized authority to monitor the quality and performance of schools has led to student outcomes that vary dramatically across the country. Currently there are no minimum expectations on metrics like graduation rates or loan default rates, and poor-performing institutions are rarely punished by accreditors. In 2014, $16 billion in government aid was sent to students at four-year institutions with a six-year graduation rate less than 33 percent, and a US Government Accountability Office (GAO) report found that, from 2009-2014, accreditors were no more likely to act against institutions with poor student outcomes than they were against institutions with strong outcomes.[3] Despite the important role accreditation plays in the regulatory triad, the current structure of accountability is not properly meeting the needs of students.
Currently there are no minimum expectations on metrics like graduation rates or loan default rates, and poor-performing institutions are rarely punished by accreditors.
There are two types of accreditation agencies: institutional and programmatic. Institutional accreditors are either regional, which cover most private and nonprofit colleges in the US, or national, which accredit most for-profit and religious institutions in the country. Eighty-five percent of students attend institutions accredited by a regional accreditor. Institutions that are accredited by a federally approved national or regional accreditor are eligible to receive Title IV funds (e.g., Pell grants and federal student loans).[4] Programmatic accreditation involves the review and approval of specific programs within an institution. Although programmatic accreditors can seek approval from ED and grant Title IV eligibility to institutions with a single programmatic focus, these types of accreditors more commonly serve as quality control for professional or graduate schools within a larger institution. For example, 19 states limit eligibility to take the bar exam (and therefore practice law) to students who have graduated from a law school that is accredited by the American Bar Association.[5] Because regional accreditors oversee the largest institutions and the most students, understanding how federal policy impacts the policies of these agencies is an important step towards analyzing how federal changes can best support student outcomes.
Although different accrediting agencies have different standards, accreditation usually works through a series of the same institutional checks. An institution first performs a self-assessment based on the standards of the agency through which they are seeking accreditation, then they are subject to a peer review conducted by a team of volunteers, usually made up of faculty and administrators from institutions accredited by the same agency. The accreditor then evaluates the materials compiled through the self-study and peer review, sometimes asking for clarification or further information from an institution, before administering a decision on accreditation. Schools that receive a favorable decision will then seek reaffirmation of accreditation once their allotted time is up, usually five to ten years.
For participating institutions to be eligible for Title IV funds, an accreditor must be recognized by ED, a process that reoccurs every five years. ED staff review each accreditation agency based on criteria set forth in the Higher Education Act (HEA) that require accreditors to maintain and enforce standards on student achievement, curricula, distance education, fiscal capacity, program length, and other factors. ED staff then submit their report to the National Advisory Committee on Institutional Quality and Integrity (NACIQI), an appointed group of educators and stakeholders who, after reviewing the ED staff report and conducting a public hearing, submit a recommendation to a senior department official (SDO) in ED who then makes the final recommendation on recognition, which is then approved by the Secretary of Education.[6] NACIQI, an integral piece of the accreditation process, was first formed after the 1992 reauthorization of the HEA as a part of a broader effort by Congress to strengthen the recognition process.[7] The reauthorization detailed new standards by which to assess institutions, and set the stage for increased government involvement in the accreditation process. It is important to understand what effects, if any, NACIQI oversight of accreditors has on the quality of postsecondary programs and student outcomes.
Despite accreditation’s key role in the disbursement of billions of dollars in federal money, little empirical research has been done to explore how student outcomes change in response to federal policy shifts.
Despite accreditation’s key role in the disbursement of billions of dollars in federal money, little empirical research has been done to explore how student outcomes change in response to federal policy shifts. One qualitative research study found that institutions reacted to changes in their accreditor’s policies most commonly by identifying the value of new or changed accreditation policies and implementing them in a way that is meaningful for the institution, leveraging existing committees to make recommendations, and integrating accreditation policy changes with existing internal institutional policies.[8] Other studies on accreditation policy focus on programmatic accreditation. One such study finds evidence that changing accreditation standards for engineering students in 2004 had a positive effect on student outcomes.[9] However, because programmatic accreditation is generally used as an industry-specific marker of quality rather than a general gatekeeper for Title IV funds, changes at these smaller agencies may not mirror changes to institutional accreditation standards. More evidence is needed to identify the extent to which federal changes have made a difference in student outcomes. As student loan debt continues to grow, instituting proper accountability for poor-performing schools and the accreditors who oversee them is of vital importance to ensure students have access to high-quality postsecondary opportunities and taxpayer dollars are spent effectively.
As student loan debt continues to grow, instituting proper accountability for poor-performing schools and the accreditors who oversee them is of vital importance to ensure students have access to high-quality postsecondary opportunities and taxpayer dollars are spent effectively.
In the next sections, we provide estimates of how federal actions related to accreditation may impact student outcomes using two case studies. First, we examine how the 2008 HEOA changes in accreditation standards were incorporated into an accreditor’s review process and estimate the effects of these changes on credential completion efficiency, median debt, and loan repayment rates. Second, we look at NACIQI’s 2016 accreditor dashboard pilot project to understand if this additional oversight influenced institutional behavior.
The 2008 Higher Education Opportunity Act (HEOA), the last time the HEA has been reauthorized, also marks the last time federal accreditation policy has been changed significantly in the US. Among other changes, the 2008 reauthorization granted institutions more flexibility to define “quality standards” on student achievement with which they are to be judged by accreditors, restructured NACIQI by splitting appointments up between the secretary of education and the two branches of Congress, required accreditors to address transfer of credit, introduced greater transparency to the public, outlined rules for due process for institutions, required all institutions publish definitions of credit hours, and explicitly required accreditors to monitor the enrollment growth of institutions.[10] Although the HEOA provided specific areas accreditors must consider in their review process, it strictly prohibited the secretary of education from “establishing any criteria that specifies, defines, or prescribes the standards that accrediting agencies use to assess any institution’s success with respect to student achievement.[11]” Without any strict guidelines, each accreditor has the ability to self-determine if it meets these standards, with the five-year NACIQI review being the only opportunity for the federal government to weigh in. This process is an example of how the patchwork accreditation system results in colleges across the country being held to different quality standards.
Data Availability
We began the study by looking for information on how regional accreditors responded to changes in federal accreditation policy. The scope of our study required that the information be publicly posted by an accreditor on their website. Although there are many ways to evaluate how an accreditor responded to federal policy changes, we found that analyzing meeting minutes and versions of an accreditor’s Standards of Accreditation from around the time new federal policy changes took place was the most useful practice. As the largest accrediting bodies, we focused our search on regional accreditors, most of whom have detailed Standards of Accreditation and other policy documentation from the most recent years readily available on their website. The Southern Association of Colleges and Schools Commission on Colleges (SACSCOC) had the most comprehensive historical meeting minutes and Standards of Accreditation available on their website. In fact, most regional accreditors had no historical documents publicly available. These documents from SACSCOC allowed us to evaluate how the accreditor responded to the 2008 reauthorization, making SACSCOC an ideal choice for our study. After reviewing documents, we manually coded accreditation actions and institutional outcomes. We have included these data as a downloadable appendix on our website.
Approach
In this section we descriptively analyze institutional outcomes following the 2008 HEOA and seek to understand if changes in federal oversight of accreditors influenced behaviors in ways that impacted student outcomes. We also seek to understand whether the reauthorization influenced accreditor behavior in ways that impacted an institutions likelihood for reaffirmation or sanction. We utilize a difference-in-differences quasi-experimental design to evaluate whether SACSCOC policy changes made in response to the HEOA resulted in statistically significant changes in various outcome measures chosen to reflect a theoretical increase in educational quality, efficiency, and labor market value of credentials.
Following the 2008 reauthorization, regional accreditation agencies such SACSCOC were required to update internal policies governing the accreditation of the institutions they oversee. In the case of SACSCOC, the board of trustees met multiple times over the course of several years to discuss the new law and update the agency’s policies to comply with federal mandates. These discussions culminated in several changes, most significantly an update to the agency’s “guiding document,” the Principles of Accreditation. Institutions accredited by SACSCOC would now be required to publish transfer criteria, provide the definition of a credit hour, evaluate student outcomes according to their mission, and take measures to protect against fraud in distance education. This change officially took effect January 1, 2012, and any institution that sought reaffirmation of their accreditation status after that date was subject to the new policies.
We hypothesize that the improvements in efficiency and quality of education that result from accreditation policy changes will manifest in increased productivity of degree completions (as measured by completions per 100 FTE), lower levels of undergraduate federal student loan debt, and greater levels of undergraduate federal loan repayment.
The sample for our analysis includes all institutions that received a decision on reaffirmation from SACSCOC from 2012 through 2017 (i.e., cohorts that began the reaffirmation process from 2009 through 2014). This provides us with a set of institutions subject to the old rules and a set of institutions subject to the new rules that went into effect January 1, 2012. We specify our model with and without fixed effects, as well as across our restrictive sample of data to test for differential effects. We also employ modelling techniques created by Cengiz and colleagues and Calloway and Sant’Anna to estimate the treatment effect of each cohort of institutions separately and create a weighted treatment effect that accounts for the staggered implementation of policies.[12]
To estimate accreditation outcomes, we use the same sample and implement a linear probability model to test if institutions that began the reaffirmation process after the 2012 changes were more likely to be denied reaffirmation. We use a binary variable equal to “1” if an institution going up for reaffirmation was denied and placed on sanction by SACSCOC as the main outcome variable. The model uses the same set of controls described earlier and was ran with and without fixed effects to check the robustness of our findings.
While this model only accounts for institutions that underwent the reaffirmation process, there are several “negative actions” that SACSCOC can take against an institution during the course of the year. Actions such as “denying the request for a substantive change” or “placing an institution on warning” operate on a different timeline than the reaffirmation process. These actions are broadly referred to as “Sanctions and Other Negative Actions” in the SACSCOC meeting minutes. To account for the various timelines associated with different negative actions, we have created an interrupted-time-series model aimed at understanding the difference in incidence of negative actions and sanctions handed down by SACSCOC before and after the 2012 policy changes. The sample for this model consists of every institution that was either reaffirmed or faced a negative action by SACSCOC from 2009 to 2016.
Findings
The following 2×2 tables outline the difference in outcomes across control and treatment groups in the period before and after the policy changes were implemented. Before sharing the results of the implemented model, this simple picture of the difference-in-differences approach provides an informative starting point.
Table 1: Simple DiD of Main Outcome Variables
| BA Completion per 100 FTE | Median Debt | ||||||
| Control (2009, 2010) | Treatment (2012-2014) | Treatment – Control | Control (2009, 2010) | Treatment (2012-2014) | Treatment – Control | ||
| Pre-Period (2009-2011) | 20.44 | 18.93 | -1.51 | 10058.83 | 9661.12 | -397.71 | |
| Post-Period (2012-2014) | 19.977 | 19.799 | -0.178 | 11529.55 | 11120.94 | -408.61 | |
| (Post-Period) – (Pre-Period) | -0.463 | 0.869 | 1.332 | 1470.72 | 1459.82 | -10.9 | |
| AA Completion per 100 FTE | 1 Year Repayment Rate | ||||||
| Pre-Period (2009-2011) | 23.3 | 23.2447 | -0.0553 | 0.48754 | 0.53372 | 0.04618 | |
| Post-Period (2012-2014) | 27.7823 | 28.1415 | 0.3592 | 0.41832 | 0.460535 | 0.042215 | |
| (Post-Period) – (Pre-Period) | 4.4823 | 4.8968 | 0.4145 | -0.06922 | -0.073185 | -0.003965 | |
Here we see the average level of each outcome variable for the control and treatment groups in the pre- and post-treatment periods, as well as the difference between these groups across periods. As a reminder, the control group is made up of any institution that received a decision on reaffirmation from SACSCOC in 2012 or 2013 (cohorts that began the reaffirmation process between 2009 and 2010), and the treatment group is any institution that received a decision on reaffirmation in 2015, 2016, or 2017 (cohorts 2012, 2013, 2014). Institutions in the 2011 cohort (received a decision in 2014) have been excluded from our analysis to account for fuzziness in implementation date because it is unclear from policy documents if they would have been subject to the new accreditation standards. The descriptive results show modest growth in each of the completions per FTE metrics for the treatment group compared to the control group. The level of median debt increased for both the treatment and control groups from the pre- to post-policy period at an almost identical rate. Similarly, the one-year repayment rate decreased for both groups, with a difference of only about 0.4 percent in the final difference.
Table 2 provides the estimates only for the main specification of the model, which includes institution and year fixed effects. The point estimates of the treatment X post-period interaction variable are not far from what the simple difference of averages shows. For example, on average, all else equal, the application of treatment is expected to increase bachelor’s degree credential production per 100 FTE by 1.03 degrees. However, none of these results are statistically significant, thus there is no statistical evidence that the SACSCOC policy changes resulted in improvements in credential production per FTE, median debt, or one year repayment rate.
Table 2: Main Specification of Differences-in-Differences Analysis
| (1) | (2) | (3) | (4) | (5) | |
| VARIABLES | Credential Efficiency | Bachelor’s per 100 FTE | Associate’s per 100 FTE | Median Debt | One Year Repayment Rate |
| Treat x Post | 0.518 | 1.030 | 0.185 | -47.17 | -0.00558 |
| (0.681) | (1.047) | (0.877) | (231.6) | (0.00546) | |
| Observations | 2,178 | 1,326 | 852 | 1,842 | 1,842 |
| R-squared | 0.033 | 0.035 | 0.290 | 0.336 | 0.641 |
| Number of Inst | 363 | 221 | 142 | 307 | 307 |
| Controls | YES | YES | YES | YES | YES |
| Year FE | YES | YES | YES | YES | YES |
| Inst FE | YES | YES | YES | YES | YES |
| Robust standard errors in parentheses *** p<0.01, ** p<0.05, * p<0.1 |
|||||
These estimates are robust to our other specifications. Running the model without fixed effects gave point estimates similar to those of the main specification. In addition, the statistical significance remained unchanged.
“Treatment” in this instance may not actually occur for each cohort of institutions at the same time. There is a possibility that institutions may not alter their behavior immediately following the SACSCOC policy changes but would instead react to the policy changes once they themselves began the reaffirmation process or that the time until the next reaffirmation may influence institutional behaviors. To investigate this, we replicate the strategy of Cengiz and colleagues to estimate the treatment effect of each cohort separately. The institutions in the 2012 cohort will be analyzed as the treatment group, then the institutions in the 2013 cohort, and finally the institutions in the 2014 cohort. Treatment, in this case, occurs when each cohort begins the reaffirmation process. The 2012 cohort undergoes treatment in 2012, the 2013 cohort in 2013, and the 2014 cohort has treatment year 2014. For the cohort-based analyses our control group will consist of the institutions that began the reaffirmation process prior to the accreditation policy changes in 2009 or 2010. We also follow Calloway and Sant’Anna’s approach using the stata code csdid, which creates a weighted average treatment effect that accounts for the staggered start of accreditation review across cohorts. The results of the Cengiz analysis give point estimates that mostly match those of the main specification in sign and magnitude, suggesting cohorts are responding similarly regardless of time until reaffirmation. The statistical significance of these estimates are, again, unchanged in our robustness checks. Similarly, our results of the Calloway and Sant ’Anna approach do not provide evidence that the staggered timing of review is impacting our primary estimates.
Table 3: Main Specification of Linear Probability Model
| (1) | (2) | |
| VARIABLES | LPM- Denial of Reaffirmation | LPM- Denial of Reaffirmation |
| Treat x Post | 0.0304*** | 0.0313*** |
| (0.00986) | (0.0101) | |
| Treatment | -0.0499** | |
| (0.0196) | ||
| Post-Period | -0.00657 | |
| (0.00506) | ||
| Constant | 0.140*** | -0.0937 |
| (0.0531) | (0.108) | |
| Observations | 2,178 | 2,178 |
| R-squared | 0.070 | |
| Number of Inst | 363 | 363 |
| Controls | YES | YES |
| Year FE | YES | |
| Inst FE | YES | |
| Robust standard errors in parentheses *** p<0.01, ** p<0.05, * p<0.1 |
||
The primary results of the linear probability model are shown in Table 3. The point estimates remain similar, and the statistical significance holds when the model is run with and without fixed effects. The results suggest institutions that began the reaffirmation process after 2012 are about 3.13 percentage points more likely to have been denied reaffirmation than those institutions that began the process prior to 2012.
The number of negative actions handed down to institutions varies by year but does not seem to increase after the policy changes in 2012. Figure 1 shows that there is considerable variability from year to year in terms of the number of negative actions delivered by SACSCOC, ranging from 26 in 2014 to 41 in 2011.
Figure 1: Negative Actions or Sanctions delivered by SACSCOC, by Year
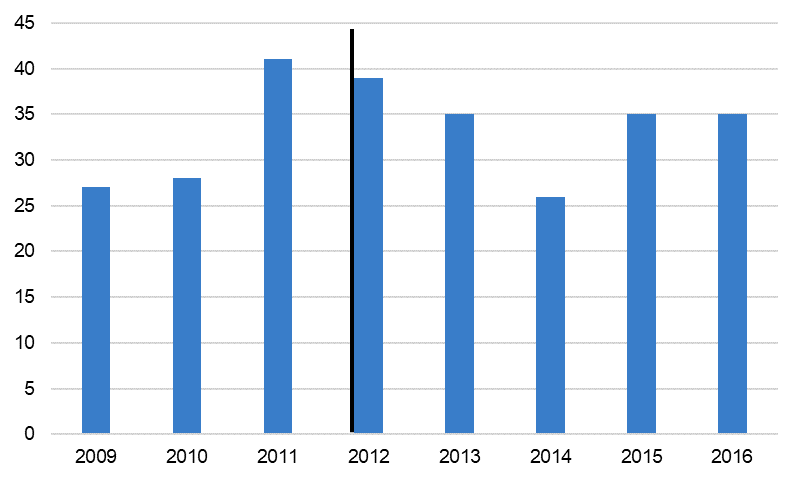
Table 4: Interrupted Time-Series Analysis of Negative Action
| (1) | (2) | (3) | (4) | (5) | |
| VARIABLES | Most Restrictive Sample | Less Restrictive Sample | Less Restrictive- Cohort 2015 | Less Restrictive- Cohort 2014 | Less Restrictive- Cohort 2013 |
| Time Trend | 0.00795 | 0.00990* | 0.0105** | 0.0105** | 0.0104* |
| (0.00587) | (0.00529) | (0.00527) | (0.00526) | (0.00539) | |
| Policy | -0.0247* | -0.0170 | -0.0173 | -0.0136 | -0.0116 |
| (0.0138) | (0.0128) | (0.0130) | (0.0132) | (0.0139) | |
| Time x Policy | -0.00802 | -0.0117** | -0.0141** | -0.0195*** | -0.0209* |
| (0.00682) | (0.00580) | (0.00624) | (0.00744) | (0.0121) | |
| Constant | 0.0479 | 0.0337*** | 0.0355*** | 0.0350*** | 0.0366*** |
| (0.0387) | (0.00737) | (0.00742) | (0.00744) | (0.00773) | |
| Controls | YES | ||||
| Observations | 4,888 | 5,240 | 4,599 | 3,948 | 3,300 |
| Number of Inst | 611 | 655 | 657 | 658 | 660 |
| Standard errors in parentheses *** p<0.01, ** p<0.05, * p<0.1 |
|||||
Table 4 provides estimates from out ITS model of the relationship between SACSCOC’s new accreditation standards and negative actions taken against member institutions. The coefficient on the variable Policy provides an estimate of the immediate effect of the change. The coefficient on Time x Policy provides an estimate of the annual effect following implementation. The resulting negative point estimates associated with the 2012 policy change imply that SACSCOC may have been less likely to deliver a negative action or sanction immediately following the policy. These results are, however, mostly insignificant, and small in size at a one percentage point decrease in the likelihood of receiving a sanction. The results of the most restrictive sample, our only model that includes controls beyond reaffirmation, only indicate statistical significance at the a=0.1 level for the policy change effect. While there is some evidence that the likelihood of receiving a negative action decreased over time, column 1 suggests these changes may be explained by institutional and state covariates. Overall, the results of this ITS analysis do not suggest a significant difference in the number of sanctions or negative actions handed down by SACSCOC following the 2012 policy changes, and certainly do not suggest any increase in the incidence of these actions.
The 2016 NACIQI Pilot Program
The need for greater accountability in the recognition of accreditation agencies has been debated by policymakers throughout the past two decades. Prior to the 2008 reauthorization, the Spellings Commission, an ED commission focused on creating recommendations for the future of higher education, recommended accreditors concentrate on students’ outcomes.[13] Despite an effort from ED to include minimum qualitative and quantitative performance standards in the HEOA, pushback from accrediting agencies blocked this provision.
Despite this, ED has taken explicit steps in recent years to strengthen the accreditation process in response to obvious failures to control educational quality. From 2010 to 2015 the Accrediting Council for Independent Colleges and Schools (ACICS) named institutions under investigation to its honor roll 90 times. In the three-year period from 2012 to 2015, ACICS approved 17 institutions, campuses, or corporate entities under investigation to receive over $5.7 billion in federal funds.[14] Following the collapse of ITT Tech and Corinthian Colleges, two entities approved by ACICS, the National Advisory Committee on Institutional Quality and Integrity (NACIQI) began exploring ways they could institute more effective standards with which to judge student achievement at institutions approved by the accrediting agencies NACIQI oversees. Their efforts culminated in a pilot project that established new “accreditor dashboards” and sought to “bring information about agency standards and practices about student achievement into greater focus in NACIQI deliberations.”[15]
This dashboard allowed NACIQI to quickly and easily compare accreditors to each other on key outcomes such as debt levels, default rates, and graduation rates. NACIQI also began asking accrediting agencies about these data points during their public hearings. Although accrediting agencies could not be denied recognition from ED strictly based on not meeting specific student achievement standards, NACIQI began using the power they had to hold accreditors more accountable. Some accreditors responded to NACIQI’s shift in approach by voluntarily setting minimum student learning standards or creating oversight groups to supervise poor-performing schools. For example, the Council of Regional Accrediting Commissions (C-RAC) announced in 2016 that the seven accreditors included in the group would systematically look at institutions they accredit with low graduation rates in a more formal review.[16] In addition, regional agencies like the Higher Learning Commission and Western Association of Schools and Colleges (WASC) have taken steps to incorporate student outcomes into their regular reviews of institutions.[17] In this section we examine the relationship between these public accountability measures and student outcomes.
Approach
We hypothesize that the enactment of a 2016 pilot program, which “establishes a more systematic approach to considering student achievement and other outcome and performance metrics in the hearings for agencies that come before NACIQI” will result in greater accountability for accreditation agencies and the institutions they accredit to produce better student outcomes. The higher standards set by NACIQI will result in higher graduation rates, and lower three-year cohort default rates.
We implement an interrupted time-series (ITS) quasi-experimental design to evaluate the 2016 pilot program enacted by NACIQI in response to the downfall of Corinthian Colleges and the increased federal scrutiny of for-profit accreditation. Our study examines the program’s effectiveness in holding accreditation agencies accountable for the outcomes of students at the institutions they accredit. We estimate the effects on specific metrics that are used in the NACIQI tool, including the three-year cohort default rate and graduation rates at 4-year and 2-year institutions. Our sample includes data from every Title IV eligible campus or separately listed branch campus in the IPEDS database from 2012 to 2019 with outcome data available for all eight years of our study.
Findings
Table 5: Interrupted Time-Series Analysis of NACIQI Pilot Project
| (1) | (2) | (3) | |||
| VARIABLES | Cohort Default Rate | 150% Graduation Rate (4-Year Inst.) | 150% Graduation Rate (Under 4-Year Inst.) | ||
| Time Trend | -0.00247*** | -0.00315*** | -0.00806*** | ||
| (0.000545) | (0.00120) | (0.00159) | |||
| Policy | -0.00484*** | -0.00256 | 0.0126*** | ||
| (0.00114) | (0.00244) | (0.00323) | |||
| Time x Policy | 0.000815 | 0.00705*** | 0.00899*** | ||
| (0.000537) | (0.00116) | (0.00154) | |||
| Constant | 0.0951*** | 0.573*** | 0.577*** | ||
| (0.00471) | (0.0131) | (0.0165) | |||
| Controls | YES | YES | YES | ||
| Observations | 30,219 | 14,144 | 16,075 | ||
| Number of Inst | 3,783 | 1,772 | 2,011 | ||
| Standard errors in parentheses *** p<0.01, ** p<0.05, * p<0.1 |
|||||
Table 5 presents the results of our ITS estimates of the relationship between the NACIQI pilot program and key student outcomes. The estimates show a statistically significant and immediate positive association of the 2016 NACIQI pilot program and graduation rates at institutions below the 4-year levels, and an immediate negative association with cohort default rates. The Time x Policy interaction term, arguably the most important in determining the relationship of this policy intervention and the outcome variables, shows a positive and statistically significant association with graduation rates at four-year and less-than-four-year institutions in the post-policy period, over time. We estimate the implementation of the tool is associated with nearly a one percentage point increase in graduation rates.
Figure 2
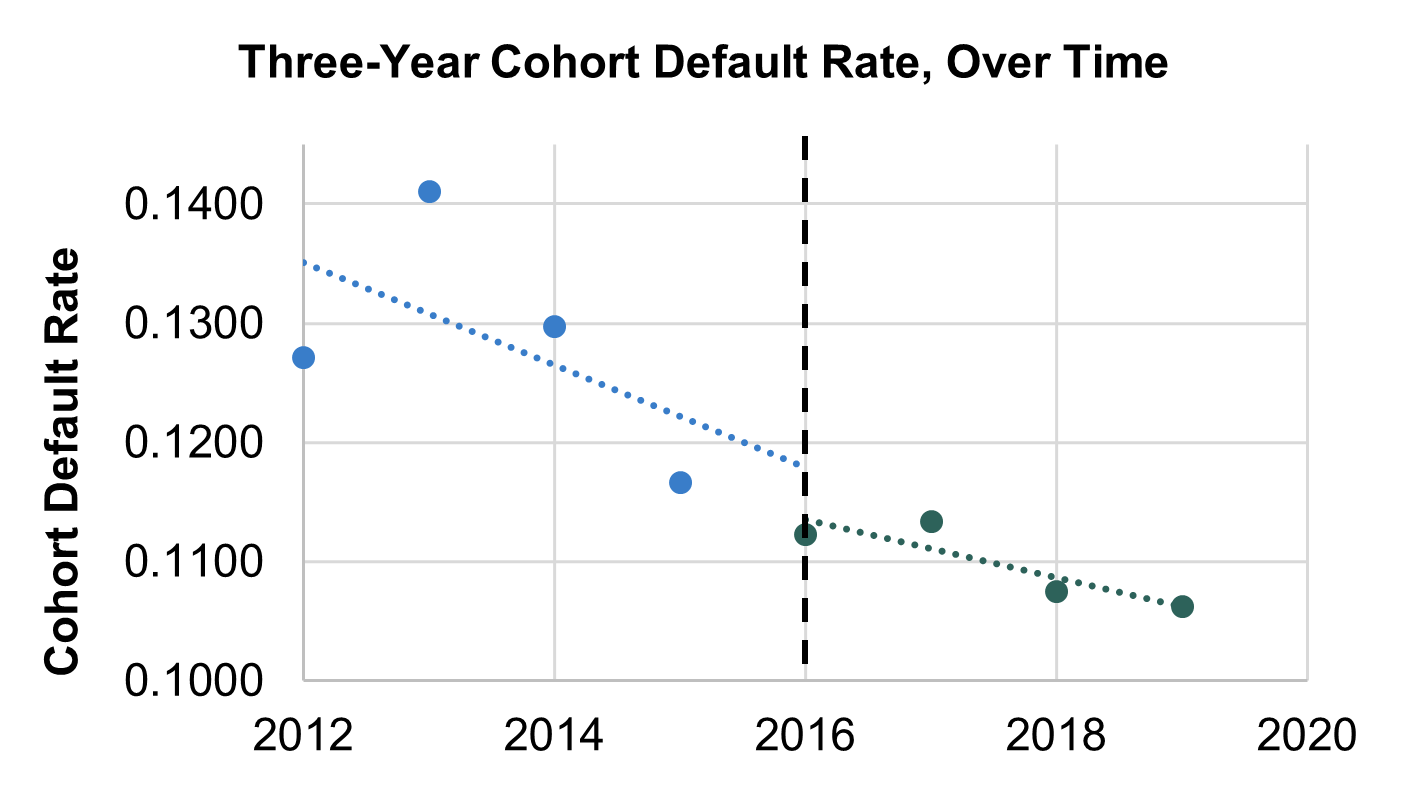
Figure 3
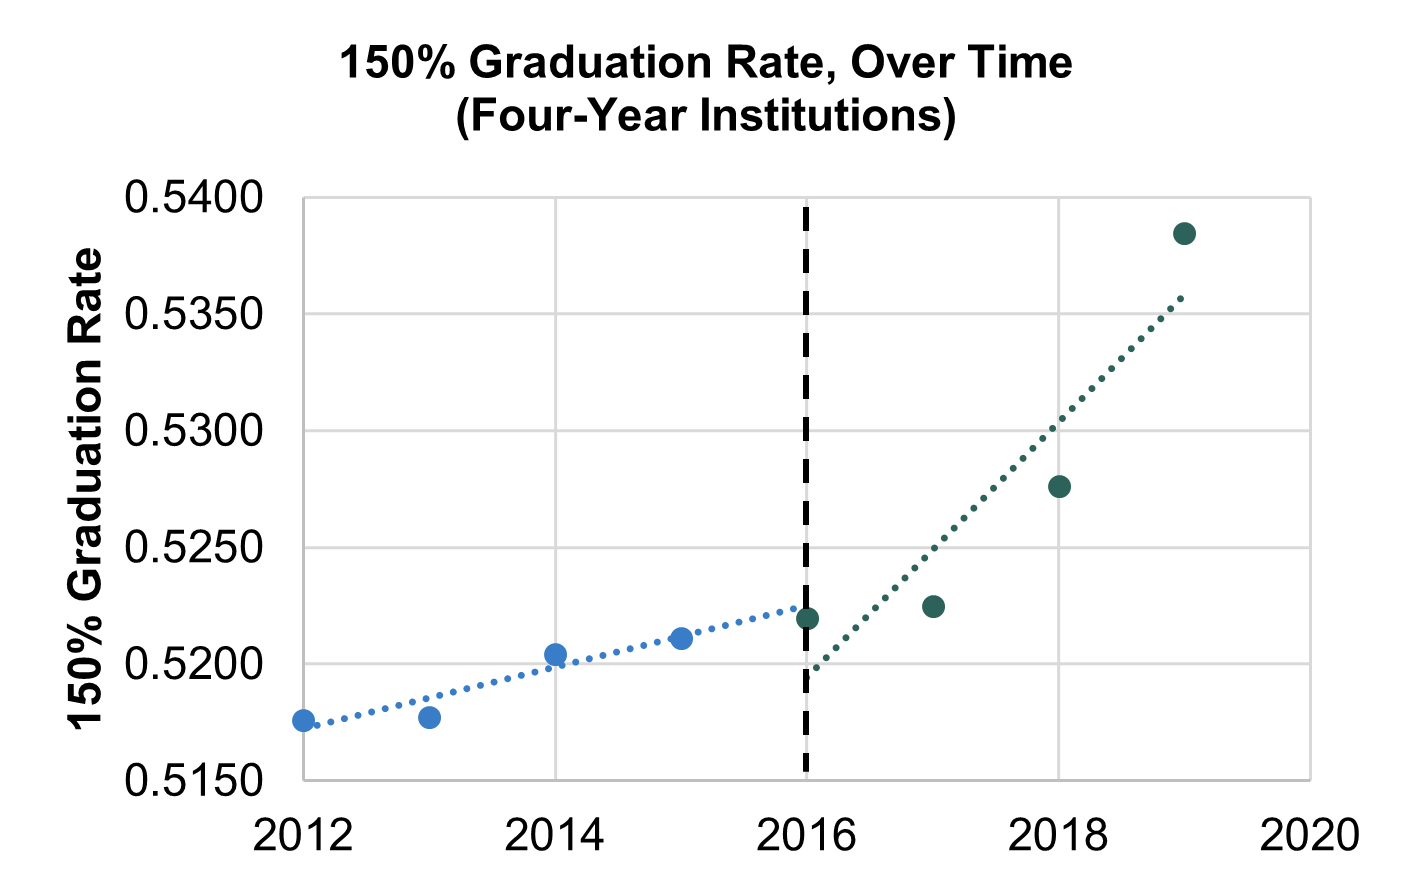
Figure 4
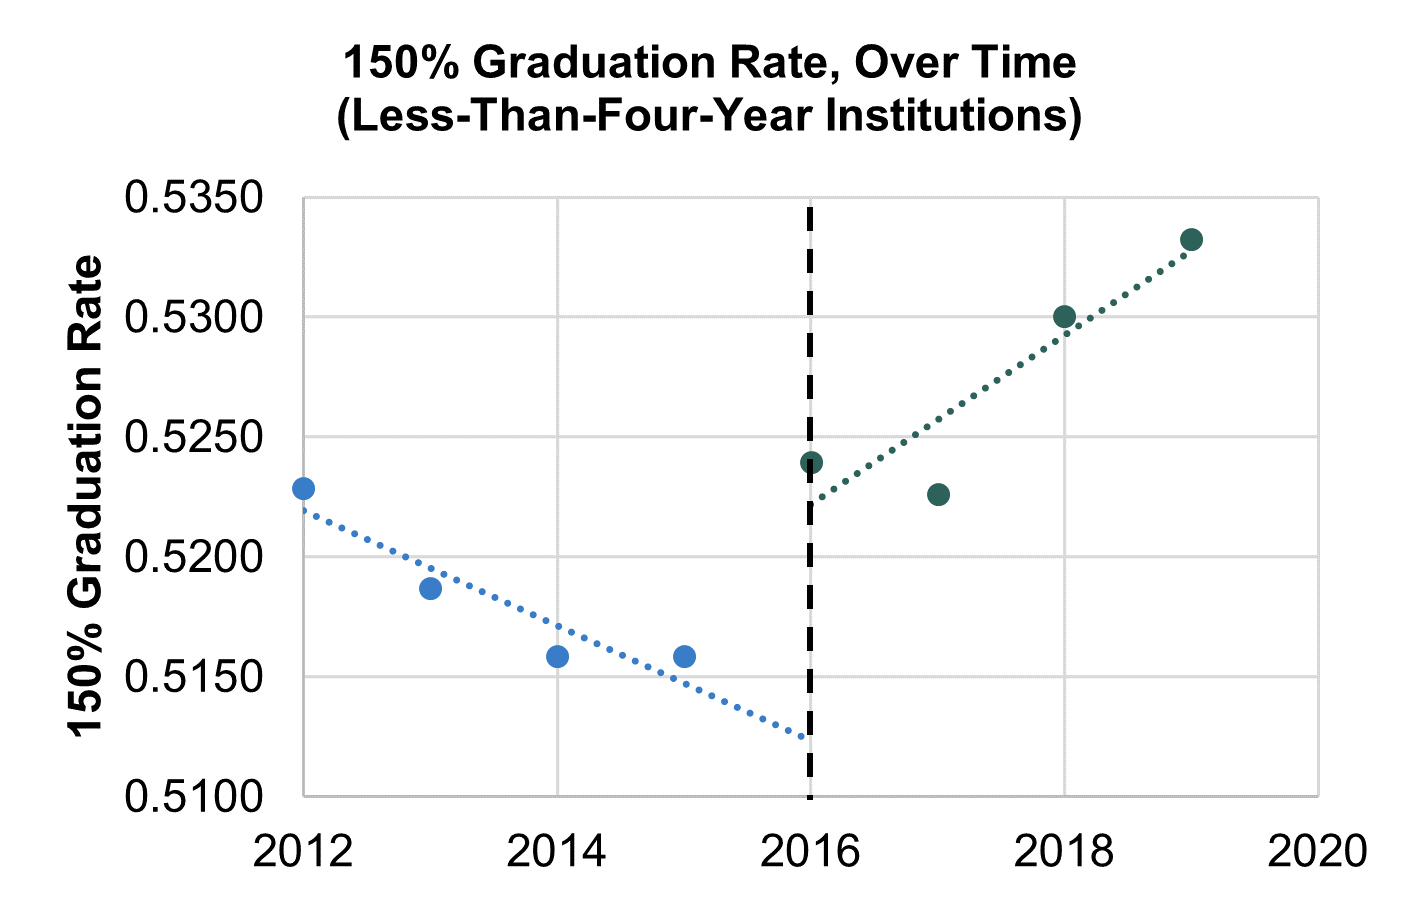
Figures 2 through 4 provide visual insight into how our outcome measures changed after the 2016 policy intervention. Here we can easily see how the cohort default rate jumps downward in 2016 before following a similar trajectory in the post-period as the pre. At four-year institutions, there is no statistically significant movement in 2016, but the data points rise as time goes on. And for less-than-four-year institutions there is large jump in 2016 followed by a steep upward trajectory. This visual evidence tracks closely with the sign and statistical significance of our model.
Although the results of our analysis show statistically significant results, interrupted time-series estimates should not be interpreted as causal. During the mid-2010s several different factors influenced accreditors to keep institutions more accountable for student outcomes. For instance, the College Scorecard, created in 2015, established data transparency on student outcomes at institutions across the country. To test for the association between the Scorecard release and key student outcomes, we reran our ITS analysis using 2015 as the policy treatment year. The resulting estimates indicate positive and statistically significant increases in graduation rates and decreases in cohort default rates, as shown in Table 8 of the appendix. These findings reinforce our belief that increasing data transparency and public pressure on institutions with poor outcomes may serve as an effective lever for accountability. However, the close timing of the NACIQI tool and the College Scorecard create a confounding issue that makes it difficult to disentangle the specific associations between each and student outcome.
Key Takeaways
Given the importance of accreditation as the predominant quality control mechanism for higher education, the lack of research on how student outcomes change following federal policy change is notable. Our study addresses this by using the 2008 Higher Education Opportunity Act, and SACSCOC’s response to it, as a case study to pilot our analytic approach. In our report we show the lack of convincing evidence that the 2008 reauthorization of the HEA resulted in substantial impacts on student outcomes. Regarding student achievement, the HEOA explicitly forbids ED from establishing criteria that define or specify the standards used by accreditors in assessing institutional success on student achievement.[18] The reauthorization instead gave institutions greater flexibility in defining their standards on student achievement. For example, following the HEOA, SACSCOC changed its Principles of Accreditation document by adding several ways that an institution may “evaluate success with respect to student achievement,” adding enrollment, retention, and graduation data, as well as student portfolios “or other means of demonstrating achievement goals.”[19] Increased flexibility in evaluating student achievement may theoretically lead to more innovation at institutions facing less of a regulatory burden. In this instance, statistical evidence does not support the idea that student success benefited from the changes to the Principles of Accreditation. More likely the absence of minimum bottom-level standards on student outcomes has allowed some poor performing institutions to operate without consequence.
The changes to standards on student achievement exemplifies the fuzzy timeline and tenuous causal chain that appears when attempting to link federal changes in accreditation policy to student outcomes. Using the 2008 reauthorization as an example, our study found that it was not so much the changes in legislation that mattered, but the way that accreditation agencies responded to these changes. Our investigation of SACSCOC’s meeting minutes shows that after the passage of the Act in 2008, and following a process of negotiated rulemaking, the accreditor did not begin codifying changes to their standards and procedures until 2011 to 2012. These ultimately culminated in the changes made to their Principles document in advance of their NACIQI review in June of 2012. In other words, our findings suggest that federal changes to policies do not matter as much as how an accrediting agency responds to those changes. The differential timing associated with NACIQI review also complicates the expedience by which federal policy can impact institutional behaviors.
Shining a spotlight on accreditors who give the stamp of approval to poor performing institutions may do more to immediately improve student outcomes than anything else.
The specific policies accreditors change and the elements of the accreditation review process that are impacted matter for the effectiveness of changes in oversight. Several aspects of accreditation review are likely to have differential effects on institutional behavior and student outcomes. Our study took institutions that began the reaffirmation process before and after the SACSCOC policy changes established in 2012 came into effect. But there are many other aspects of accreditation review that can take place. Understanding the effects of sanctions or other negative actions will be important to understand as this research moves forward.
Our analysis of the NACIQI Pilot Program established in 2016 lead us to believe that, in lieu of legislative policy changes, NACIQI may provide the best opportunity for establishing greater quality control in higher education. Concerns about student outcomes following evidence of widespread fraud in the for-profit sector led ED to make several changes resulting in greater data transparency. Although our estimates should not be interpreted as causal, our study does offer evidence that efforts on increasing data transparency and accountability, including the NACIQI tool and the release of College Scorecard data, may be related to improved outcomes. As we move forward in thinking about ways to introduce greater accountability in higher education accreditation, public accountability appears to be an effective option. Shining a spotlight on accreditors who give the stamp of approval to poor performing institutions may do more to immediately improve student outcomes than anything else.
Avenues for Future Research
As research on improving federal oversight of accreditation continues, understanding which types of changes accreditors make and how they affect student outcomes is vital to crafting recommendations on a broader scale. Following NACIQI’s call for greater accountability in minimum-level standards, some regional accreditors have introduced their own minimum expectations for student outcomes. Future studies on accreditation should focus on accreditors who introduced bright-line minimum standards. By comparing institutions whose accreditors have voluntarily introduced stricter accountability guidelines, an analytical model can be created to estimate the effect of specific standards. Quantitative proof of their success would strengthen the call for stricter measures to be introduced at the federal level.
As research on improving federal oversight of accreditation continues, understanding which types of changes accreditors make and how they affect student outcomes is vital to crafting recommendations on a broader scale.
Before an analytical study can be conducted, however, a comprehensive review and analysis of changes to accreditation standards, across all regional accreditors, is necessary. Based on the feasibility portion of our study, doing this will require cooperative work with accreditors to gain access to and understand and document changes in standards and procedures over time. This data can then be used to estimate the effects of various changes to inform accreditation policy and federal oversight. Systematic collection and documentation of changes to accreditation standards and procedures would also allow researchers to code and publish this data to provide greater transparency. This data would be useful, not only to facilitating additional research, but to help accreditors understand each other’s standards and how they’ve changed over time.
In addition to reviewing and analyzing changes accreditors have made to their standards, specifically understanding the accreditor’s role in financial oversight may lead to more concentrated recommendations on institutional health.
In addition to reviewing and analyzing changes accreditors have made to their standards, specifically understanding the accreditor’s role in financial oversight may lead to more concentrated recommendations on institutional health.[20] We suggest a mixed methods approach that includes interviews to understand the role accreditors play in overseeing the financial health of institutions. Additionally, case studies and synthetical control methods would allow researchers to analyze how sanctions related to finances impacted the future financial health and behaviors of institutions. We believe there is value in developing a set of new financial indicators/metrics that may be helpful for accreditors to monitor institutional finances.
Our study examines the effect that changes to accreditation standards had on student outcomes at institutions undergoing the reaffirmation process, but outcomes at institutions who have undergone different types of reviews may also be of interest. Some evidence suggests sanctions taken against institutions may result in decreased enrollment,[21] and taking a broader look at what the effects of negative actions and loss of accreditation are on student outcome can build on this evidence. Expanding our current analysis to understand how sanctions relate to institutional expenditures and student outcomes or modeling out the effects of different types of sanctions (e.g., financial, student learning, etc.) would help provide feedback that can improve oversight of accreditors and identify review tactics that improve student outcomes. Additionally, it is important to understand how the loss of accreditation impacts institutional outcomes in order to help provide a roadmap for struggling institutions seeking to change course and better serve students.
As it currently stands, NACIQI offers the best opportunity for operating policy change on federal oversight of accreditation. Understanding the ways that public accountability associated with the NACIQI data tool—or other public accountability measures like the College Scorecard— leads to improved student outcomes is an important extension of this project. Extending our ITS analysis to examine potential differences in effects across accrediting organizations and integrating qualitative methods to understand how accreditors thought about and responded to the NACIQI tool and other public data tools will help uncover potential improvements to the tool that can be included in future attempts at public accountability. In addition, conducting focus groups with parents and students to understand how they have or might use public accountability tools to evaluate an institution’s accreditation status will help us determine the importance of public accountability tools in an individual’s college choice process.
Methodological Appendix
To estimate the effects of the 2008 HEOA and 2016 NACIQI Pilot Program on student outcomes we utilized publicly available data from IPEDS, College Scorecard, the BLS, SHEF Finance data, and SACSCOC Annual Reports. We implement several different analytical strategies in our report, interrupted time-series (ITS), difference-in-differences (DiD), Linear-Probability Model (LPM) and modelling techniques used by Cengiz et al. and Calloway and Sant’Anna to test different treatment effects as a robustness check.[22] The methodological appendix is organized into the following sections: data overview, differences-in-differences approach, linear probability model, interrupted time-series approach, and ITS and analysis of SACSCOC accreditation effects. Following these sections all tables listed in the report will be listed.
Data Overview
Our difference-in-differences and linear probability models focus on estimating the effects of the 2008 reauthorization by using the same sample. The sample for our analysis includes all institutions that received a decision on reaffirmation from SACSCOC from 2012 through 2017 (i.e., cohorts that began the reaffirmation process from 2009 through 2014). Because of the need for a balanced panel of data, institutions are only kept in the dataset if outcome data is available from 2009 to 2014. We construct two samples of data to account for the differences in data availability across sources. Three of the studied outcomes are: bachelor’s degree completions per 100 FTE (at four-year institutions), associate degree completions per 100 FTE (at two-year institutions), and “credential efficiency,” an outcome calculated by combining bachelor’s production per 100 FTE and associate’s production per 50 FTE, allowing us to estimate efficiency in degree production across institution types. We collect this outcome data through IPEDS, resulting in minimal missing data. Our difference-in-differences model estimates these outcome variables used the “main sample” which includes 2,178 observations across 363 institutions. One hundred and forty-two of these institutions are two-year, and 221 are four-year. The main sample excludes 14 institutions that no longer report data to IPEDs, and 75 institutions which began the reaffirmation in 2011, our flex/control year. Out of 372 institutions that received a reaffirmation decision from SACSCOC from 2009-2014 (not including 2011), 363 remain in the main sample after addressing outcome data availability.
Data on median debt and one-year repayment rates is collected from the College Scorecard, a less complete dataset than IPEDS. We use the resulting “restrictive sample” to run our model when estimating median debt and repayment rates. This dataset includes 1,842 observations across 307 different institutions.[23]
Our ITS analysis on negative accreditor review outcomes utilizes a different sample. For this approach we collected data on every single institution that either received a decision on reaffirmation or a negative action from SACSCOC from 2009 to 2016. The same set of institutional and state controls variables from our first sample is used here, taking data from IPEDS, the BLS, and SHEF. This sample includes 4,888 observations from 611 different institutions. Fifty-four institutions that received a negative action or decision on reaffirmation were removed from the sample due to missing data or because the institution closed from 2009 to 2016. Because of the limited number of negative actions handed down by SACSCOC each year, we created an alternate data set, removing all control variables except reaffirmation, and placed a premium on including as many institutions in the sample as possible. The resulting sample reincluded 44 of the institutions that were removed, leaving out only the ten that closed. Five of the ten closed schools were then reintegrated into the sample during our “step-latter” analysis, described in greater detail later.
The sample utilized in our analysis of the 2016 NACIQI Pilot Program includes data from every Title IV eligible campus or separately listed branch campus in the IPEDS database from 2012 to 2019. Because NACIQI acts as a primary gatekeeper to Title IV eligibility, every institution with access to these federal funds will be subject to the policy change. The sample originally contained 52,234 observations reflecting data on 7,907 different institutions. Because our analysis requires a balanced panel data set, observations without data on either of our outcome measures has been removed. Additionally, observations were only kept in the data set if data is available for all 8 years of our analysis. The final data set includes 30,264 observations reflecting 3,783 different institutions.
Differences-in-Differences Approach
Utilizing a Difference-in-Differences (DiD) approach allows us to exploit the discreet policy change implemented by SACSCOC in 2012. By comparing institutions that began the reaffirmation process prior to the publishing of a new Principles of Accreditation document to those that began the reaffirmation after, we can determine any statistical differences in student outcomes that may be attributable to new policies.
To investigate these effects more thoroughly, the following models have been run:

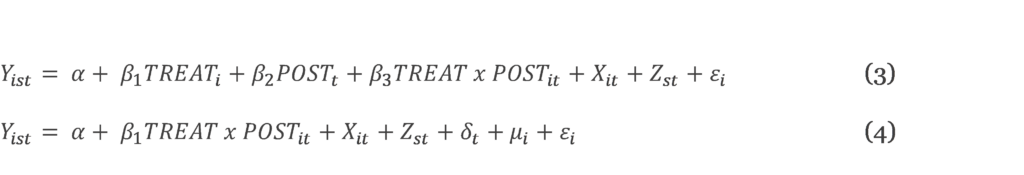
Yist is each of our outcomes of interest at institution i in state s and year t. TREATi is a binary indicator equal to 1 if an institution i begins the reaffirmation process after the SACSCOC policy changes. POSTt is a binary indicator equal to 1 if year t is after SACSCOC instituted its policy changes, and TREAT x POSTit is an interaction term between the two indicators. εi is an error term clustered at the institution level. Xit is a vector of time-varying institutional characteristics: proportion of the undergraduate student body who have received a Pell grant, the proportion of the undergraduate study body comprised of underrepresented or minority students, and the total FTE undergraduate enrollment of the institution. Zst is a vector of time-varying state characteristics: the state higher education appropriations per FTE and the state unemployment rate. δt is a year fixed effect and µi is an institution fixed effect. We estimated our model without (equation 1) and with (equation 2) institution and year fixed effects.
The following table displays the number of institutions included in each year, when the institutions began their reaffirmation process, and when a decision on reaffirmation was handed down by SACSCOC.
Table 6: Treatment and Control Groups of Difference-in-Differences Analysis
| Number of Schools | Year Approved | Estimated Start Date of Review | Analytic Group |
| 77 | 2012 | 2009 | Control |
| 76 | 2013 | 2010 | Control |
| 86 | 2014 | 2011 | Control Flex* |
| 83 | 2015 | 2012 | Treatment |
| 80 | 2016 | 2013 | Treatment |
| 76 | 2017 | 2014 | Treatment |
The results of the other specifications of this model can be found in appendix Tables 9 through 19.
Linear Probability Model
Using the same sample, we employ a linear probability model to test if institutions that began the reaffirmation process after the 2012 changes were more likely to be denied reaffirmation. We use a binary variable equal to 1 if an institution going up for reaffirmation was denied and placed on sanction by SACSCOC as the main outcome variable. The model uses the same set of controls described earlier and was ran with and without fixed effects to check the robustness of our findings.
This model is identical to the previous but replacing our continuous outcome variables with a binary one changes the interpretation of our findings.
In this case Yist is now a binary variable equal to 1 if an institution seeking reaffirmation was denied by SACSCOC.
Interrupted Time Series Approach
We first employ an interrupted time-series to study the effect of the NACIQI Pilot Program. Because all Title IV institutions are accredited, they’re accrediting agencies are all subject to review from NACIQI and any policy changes the committee advances. Because of this, we do not have a control group with which to compare our treatment group against. This leads us to the ITS, an analytical technique that allows us to estimate the effect of a policy change at the moment the change takes place and the effect of a change over time. ITS estimates are only interpreted as casual in specific circumstances. In our example, multiple factors can impact the trajectory of graduation rates over time. ITS can, however, give insight into the relationship between student outcomes and changes made by NACIQI in the interest of improving them.
The ITS analysis was conducted using the xtitsa command in Stata. The code takes advantage of institution level panel data offered through the IPEDS database and estimates a single-group treatment effect. Again, note that a comparison group is not available for this study, as the NACIQI program affects the accreditors of all Title IV eligible institutions. Estimates from the following model are calculated:

Where Yist is an outcome Y at institution i in state s and year t, Timet is the time since the start of the study, Policyt is a binary indicator representing the effect of the NACIQI Pilot Program intervention immediately following the change and is equal to one from 2016 onward, and TimexPolicyt is an interaction between the two, where the coefficient ß3 represents the difference between the preintervention and postintervention slopes of the outcomes. In other words, ß3 is interpreted as the effect of the policy change over time. Xit is a vector of time-varying institutional characteristics, Zst is a vector of time-varying state characteristics, and µi is an institution fixed effect, and εi is an error term clustered around institution i. We will also estimate effects with and without institution fixed effects to test the robustness of our findings.
The design of the xtitsa command did not allow us to control for institution fixed effects or cluster our standard errors at the institution level. We therefore replicated these analyses by manually creating the variables generated by the xtitsa command and adding clustered standard errors and institution fixed effects. The following table shows the resulting estimates of this analyses, which we provide as a robustness check for our main estimates. For comparison, refer to our main estimates in Table 5 in the body of the report.
Table 7: ITS Analysis of NACIQI Pilot Program, Estimates with Fixed Effects
| (1) | (2) | (3) | |
| VARIABLES | Cohort Default Rate | 150% Graduation Rate (4-Year Inst.) | 150% Graduation Rate (Under 4-Year Inst.) |
| Time Trend | -0.00219*** | -0.00368** | -0.00736*** |
| (0.000830) | (0.00164) | (0.00185) | |
| Policy | -0.00553*** | -0.00117 | 0.0118*** |
| (0.000978) | (0.00238) | (0.00323) | |
| Time x Policy | 0.000664 | 0.00662*** | 0.00851*** |
| (0.000668) | (0.00129) | (0.00171) | |
| Constant | 0.117*** | 0.505*** | 0.555*** |
| (0.00979) | (0.0210) | (0.0233) | |
| Observations | 30,219 | 14,144 | 16,075 |
| R-squared | 0.053 | 0.015 | 0.007 |
| Number of unitid | 3,783 | 1,772 | 2,011 |
| Controls | YES | YES | YES |
| Inst FE | YES | YES | YES |
| Robust standard errors in parentheses *** p<0.01, ** p<0.05, * p<0.1 |
|||
The point estimates in both cases are relatively similar, and the statistical significance at the 5 percent level is maintained after clustering standard errors and controlling for institution level fixed effects. These controls also address autocorrelation in the model and give us confidence in the estimates of the main specification.
ITS and Analysis of SACSCOC Accreditation Effects
We also employ an interrupted time-series model to study incidence of negative changes handed down by SACSCOC before and after their policy changes in 2012. The main specification of our model includes the same controls used in the difference-in-differences and Linear Probability Models, and also controls for whether or not an institution was up for reaffirmation in a given year as this may bring greater scrutiny to the institution. Data limitations lead us to also run our model without any controls other than reaffirmation. The latter model includes data from every institution in the SACSCOC universe from 2009 to 2016 except those institutions that were removed from membership or closed. To ensure that important information was not left out of our analysis in excluding institutions that closed, we instituted a “step-ladder analysis.” This analysis removed years from the end of our panel dataset and reintroduced the five institutions that were excluded because they closed during the 2013-2016 period.
These equations describe the model we utilize:

Where Yist is binary variable indicating if institution i in state s and year t received a negative action from SACSCOC, Timet is the time since the start of the study, Policyt is a binary indicator representing the effect of the 2012 policy changes immediately following the change and is equal to one from 2012 onward, and TimexPolicyt is an interaction between the two, where the coefficient ß3 represents the difference between the preintervention and postintervention slopes of the outcomes. In other words, ß3 is interpreted as the effect of the policy change over time. Reaf firmationit is a binary variable controlling for whether an institution i received a decision on reaffirmation in year t, Xit is a vector of time-varying institutional characteristics, Zst is a vector of time-varying state characteristics, and εist is an error term.
Because of the need for a balanced panel dataset, institutions that were closed during any year from 2009 to 2016 were removed. To estimate the results when including these closed institutions we conduct a “step-latter” analysis, removing a year from our dataset one at a time and reintroducing institutions that closed during that year back into the dataset, then rerunning our analyses using the less restrictive sample. For example, our estimates from the 2015 cohort are taken from a sample that has removed the year 2016 and reintroduced schools that were closed in 2016. The results of this, shown above in Table 4, illustrate the change in institutions that occurred.
Appendix of Supplementary Tables and Results
Table 8: ITS Analysis of NACIQI Pilot Program using 2015 Cutoff
| (1) | (2) | (3) | |||
| VARIABLES | Cohort Default Rate | 150% Graduation Rate (4-Year Inst.) | 150% Graduation Rate (Under 4-Year Inst.) | ||
| Time Trend | 0.00289*** | -0.00263* | -0.00928*** | ||
| (0.000678) | (0.00149) | (0.00196) | |||
| Policy | -0.0183*** | -0.00501* | 0.00501 | ||
| (0.00129) | (0.00278) | (0.00366) | |||
| Time x Policy | -0.00463*** | 0.00474*** | 0.0107*** | ||
| (0.000628) | (0.00135) | (0.00180) | |||
| Constant | 0.0907*** | 0.570*** | 0.578*** | ||
| (0.00471) | (0.0131) | (0.0166) | |||
| Controls | YES | YES | YES | ||
| Observations | 30,219 | 14,144 | 16,075 | ||
| Number of Inst | 3,783 | 1,772 | 2,011 | ||
| Standard errors in parentheses *** p<0.01, ** p<0.05, * p<0.1 |
|||||
Table 9: DiD Analysis of 2008 Reauthorization: Associates Degree Completion per 100 FTE at 2-year institutions.
| (1) | (2) | (3) | (4) | |
| VARIABLES | Main Sample | Main Sample | Restrictive Sample | Restrictive Sample |
| Treat x Post | 0.0944 | 0.185 | -1.692* | -1.463 |
| (0.902) | (0.877) | (0.971) | (0.973) | |
| Treatment | -1.228 | 1.473 | ||
| (1.902) | (1.812) | |||
| Post-Period | 2.282*** | 3.434*** | ||
| (0.778) | (0.923) | |||
| Constant | 44.88*** | 32.75*** | 45.44*** | 34.48*** |
| (5.402) | (9.244) | (6.489) | (11.27) | |
| Observations | 852 | 852 | 564 | 564 |
| R-squared | 0.290 | 0.376 | ||
| Number of Inst | 142 | 142 | 94 | 94 |
| Controls | YES | YES | YES | YES |
| Year FE | YES | YES | ||
| Inst FE | YES | YES | ||
| Robust standard errors in parentheses *** p<0.01, ** p<0.05, *p<0.1 |
||||
Table 10: DiD Analysis of 2008 Reauthorization: Associates Degree Completion per 100 FTE at 2-year institutions, Cengiz cohort analysis results
| (5) | (6) | (7) | (8) | (9) | (10) | |
| VARIABLES | Cengiz Cohort 2012 – Main Sample | Cengiz Cohort 2012 – Main Sample | Cengiz Cohort 2013 – Main Sample | Cengiz Cohort 2013 – Main Sample | Cengiz Cohort 2014 – Main Sample | Cengiz Cohort 2014 – Main Sample |
| Treat x Post | -0.967 | -0.612 | 0.765 | 0.764 | 0.517 | 0.778 |
| (1.186) | (1.117) | (1.194) | (1.189) | (1.319) | (1.282) | |
| Treatment | -2.559 | -2.841 | 3.867 | |||
| (2.175) | (2.296) | (3.307) | ||||
| Post-Period | 1.537* | 2.176** | 1.893* | |||
| (0.915) | (0.874) | (0.974) | ||||
| Constant | 45.67*** | 34.14*** | 44.48*** | 34.43*** | 47.52*** | 41.38*** |
| (6.916) | (12.59) | (6.851) | (11.76) | (8.430) | (14.07) | |
| Observations | 522 | 522 | 564 | 564 | 474 | 474 |
| R-squared | 0.271 | 0.299 | 0.276 | |||
| Number of Inst | 87 | 87 | 94 | 94 | 79 | 79 |
| Controls | YES | YES | YES | YES | YES | YES |
| Year FE | YES | YES | YES | |||
| Inst FE | YES | YES | YES | |||
| Robust standard errors in parentheses *** p<0.01, ** p<0.05, * p<0.1 |
||||||
Table 11: DiD Analysis of 2008 Reauthorization: Bachelor’s Degree Completions per 100 FTE at 4-Year institutions.
| (1) | (2) | (3) | (4) | |
| VARIABLES | Main Sample | Main Sample | Restrictive Sample | Restrictive Sample |
| Treat x Post | 1.163 | 1.030 | 0.914 | 0.751 |
| (1.244) | (1.047) | (1.276) | (1.073) | |
| Treatment | -2.185 | -2.222 | ||
| (2.430) | (2.547) | |||
| Post-Period | -1.678 | -1.408 | ||
| (1.721) | (1.790) | |||
| Constant | 36.09*** | 35.04** | 36.08*** | 37.26** |
| (8.500) | (14.20) | (9.224) | (15.00) | |
| Observations | 1,326 | 1,326 | 1,278 | 1,278 |
| R-squared | 0.035 | 0.040 | ||
| Number of Inst | 221 | 221 | 213 | 213 |
| Controls | YES | YES | YES | YES |
| Year FE | YES | YES | ||
| Inst FE | YES | YES | ||
| Robust standard errors in parentheses *** p<0.01, ** p<0.05, * p<0.1 |
||||
Table 12: DiD Analysis of 2008 Reauthorization: Bachelor’s Degree Completions per 100 FTE at 4-Year institutions, Cengiz et al. cohort analysis results.
| (5) | (6) | (7) | (8) | (9) | (10) | |
| VARIABLES | Cengiz Cohort 2012 – Main Sample | Cengiz Cohort 2012 – Main Sample | Cengiz Cohort 2013 – Main Sample | Cengiz Cohort 2013 – Main Sample | Cengiz Cohort 2014 – Main Sample | Cengiz Cohort 2014 – Main Sample |
| Treat x Post | 1.569 | 1.437 | 1.011 | 0.701 | 0.750 | 0.468 |
| (1.239) | (1.000) | (1.272) | (0.974) | (1.244) | (0.919) | |
| Treatment | -2.273 | -1.974 | -2.924 | |||
| (2.193) | (2.561) | (3.419) | ||||
| Post-Period | -2.299 | -2.348 | -2.110 | |||
| (2.132) | (2.069) | (1.984) | ||||
| Constant | 43.01*** | 46.65** | 41.85*** | 50.27** | 43.08*** | 47.26* |
| (13.08) | (21.76) | (12.89) | (24.15) | (13.39) | (25.47) | |
| Observations | 798 | 798 | 756 | 756 | 780 | 780 |
| R-squared | 0.055 | 0.058 | 0.043 | |||
| Number of Inst | 133 | 133 | 126 | 126 | 130 | 130 |
| Controls | YES | YES | YES | YES | YES | YES |
| Year FE | YES | YES | YES | |||
| Inst FE | YES | YES | YES | |||
| Robust standard errors in parentheses *** p<0.01, ** p<0.05, * p<0.1 |
||||||
Table 13: DiD Analysis of 2008 Reauthorization: Credential Efficiency
| (1) | (2) | (3) | (4) | |
| VARIABLES | Main Sample | Main Sample | Restrictive Sample | Restrictive Sample |
| Treat x Post | 0.506 | 0.518 | 0.466 | 0.440 |
| (0.733) | (0.681) | (0.879) | (0.794) | |
| Treatment | -0.644 | -1.407 | ||
| (1.647) | (1.889) | |||
| Post-Period | -0.467 | -0.279 | ||
| (0.953) | (1.151) | |||
| Constant | 27.01*** | 21.86*** | 28.24*** | 25.25*** |
| (5.580) | (8.139) | (6.582) | (9.576) | |
| Observations | 2,178 | 2,178 | 1,842 | 1,842 |
| R-squared | 0.033 | 0.035 | ||
| Number of Inst | 363 | 363 | 307 | 307 |
| Controls | YES | YES | YES | YES |
| Year FE | YES | YES | ||
| Inst FE | YES | YES | ||
| Robust standard errors in parentheses *** p<0.01, ** p<0.05, * p<0.1 |
||||
Table 14: DiD Analysis of 2008 Reauthorization: Credential Efficiency, Cengiz et al. cohort analysis results.
| (5) | (6) | (7) | (8) | (9) | (10) | |
| VARIABLES | Cengiz Cohort 2012 – Main Sample | Cengiz Cohort 2012 – Main Sample | Cengiz Cohort 2013 – Main Sample | Cengiz Cohort 2013 – Main Sample | Cengiz Cohort 2014 – Main Sample | Cengiz Cohort 2014 – Main Sample |
| Treat x Post | 0.711 | 0.700 | 0.491 | 0.483 | 0.148 | 0.118 |
| (0.734) | (0.643) | (0.752) | (0.734) | (0.738) | (0.594) | |
| Treatment | -0.679 | -1.429 | -0.0516 | |||
| (1.706) | (1.777) | (2.266) | ||||
| Post-Period | -0.883 | -0.671 | -0.943 | |||
| (1.125) | (1.062) | (1.091) | ||||
| Constant | 31.46*** | 27.45** | 29.26*** | 27.51** | 32.64*** | 27.56* |
| (8.215) | (12.85) | (7.765) | (12.61) | (8.509) | (14.23) | |
| Observations | 1,320 | 1,320 | 1,320 | 1,320 | 1,254 | 1,254 |
| R-squared | 0.039 | 0.034 | 0.026 | |||
| Number of Inst | 220 | 220 | 220 | 220 | 209 | 209 |
| Controls | YES | YES | YES | YES | YES | YES |
| Year FE | YES | YES | YES | |||
| Inst FE | YES | YES | YES | |||
| Robust standard errors in parentheses
*** p<0.01, ** p<0.05, * p<0.1 |
||||||
Table 15: DiD Analysis of 2008 Reauthorization: Median Debt
| (1) | (2) | |
| VARIABLES | Restrictive Sample | Restrictive Sample |
| Treat x Post | -47.21 | -47.17 |
| (231.1) | (231.6) | |
| Treatment | -597.6 | |
| (529.4) | ||
| Post-Period | 48.20 | |
| (206.0) | ||
| Constant | 18,562*** | 12,183*** |
| (1,281) | (1,636) | |
| Observations | 1,842 | 1,842 |
| R-squared | 0.336 | |
| Number of Inst | 307 | 307 |
| Controls | YES | YES |
| Year FE | YES | |
| Inst FE | YES | |
| Robust standard errors in parentheses *** p<0.01, ** p<0.05, * p<0.1 |
||
Table 16: DiD Analysis of 2008 Reauthorization: Median Debt, Cengiz et al. cohort analysis results
| (3) | (4) | (5) | (6) | (7) | (8) | |
| VARIABLES | Cengiz Cohort 2012 – Restrictive Sample | Cengiz Cohort 2012 – Restrictive Sample | Cengiz Cohort 2013 – Restrictive Sample | Cengiz Cohort 2013 – Restrictive Sample | Cengiz Cohort 2014 – Restrictive Sample | Cengiz Cohort 2014 – Restrictive Sample |
| Treat x Post | -132.2 | -91.00 | -167.7 | -207.9 | 186.3 | 190.8 |
| (277.5) | (279.5) | (283.9) | (278.4) | (324.2) | (323.8) | |
| Treatment | -574.5 | -954.2 | -309.3 | |||
| (676.6) | (746.0) | (721.0) | ||||
| Post-Period | -95.22 | 98.54 | 14.70 | |||
| (207.1) | (217.0) | (239.0) | ||||
| Constant | 18,364*** | 13,246*** | 18,467*** | 12,990*** | 18,449*** | 10,820*** |
| (1,464) | (2,047) | (1,586) | (2,091) | (1,747) | (2,322) | |
| Observations | 1,098 | 1,098 | 1,080 | 1,080 | 1,056 | 1,056 |
| R-squared | 0.328 | 0.323 | 0.321 | |||
| Number of Inst | 183 | 183 | 180 | 180 | 176 | 176 |
| Controls | YES | YES | YES | YES | YES | YES |
| Year FE | YES | YES | YES | |||
| Inst FE | YES | YES | YES | |||
| Robust standard errors in parentheses *** p<0.01, ** p<0.05, * p<0.1 |
||||||
Table 17: DiD Analysis of 2008 Reauthorization: One Year Repayment Rate
| (1) | (2) | |
| VARIABLES | Restrictive Sample | Restrictive Sample |
| Treat x Post | -0.00885 | -0.00558 |
| (0.00566) | (0.00546) | |
| Treatment | 0.0352** | |
| (0.0145) | ||
| Post-Period | -0.00181 | |
| (0.00487) | ||
| Constant | 0.463*** | 0.581*** |
| (0.0453) | (0.0468) | |
| Observations | 1,842 | 1,842 |
| R-squared | 0.641 | |
| Number of Inst | 307 | 307 |
| Controls | YES | YES |
| Year FE | YES | |
| Inst FE | YES | |
| Robust standard errors in parentheses
*** p<0.01, ** p<0.05, * p<0.1 |
||
Table 18: DiD Analysis of 2008 Reauthorization: One Year Repayment Rate, Cengiz et al. cohort analysis results
| (3) | (4) | (5) | (6) | (7) | (8) | |
| VARIABLES | Cengiz Cohort 2012 – Restrictive Sample | Cengiz Cohort 2012 – Restrictive Sample | Cengiz Cohort 2013 – Restrictive Sample | Cengiz Cohort 2013 – Restrictive Sample | Cengiz Cohort 2014 – Restrictive Sample | Cengiz Cohort 2014 – Restrictive Sample |
| Treat x Post | -0.00943 | -0.00854 | -0.0115 | -0.00762 | -0.00544 | -0.00136 |
| (0.00861) | (0.00798) | (0.00768) | (0.00718) | (0.00779) | (0.00782) | |
| Treatment | 0.0221 | 0.0354* | 0.0450** | |||
| (0.0178) | (0.0192) | (0.0196) | ||||
| Post-Period | -0.00513 | 0.00247 | -0.00546 | |||
| (0.00541) | (0.00521) | (0.00462) | ||||
| Constant | 0.474*** | 0.582*** | 0.410*** | 0.513*** | 0.530*** | 0.637*** |
| (0.0538) | (0.0597) | (0.0543) | (0.0518) | (0.0444) | (0.0472) | |
| Observations | 1,098 | 1,098 | 1,080 | 1,080 | 1,056 | 1,056 |
| R-squared | 0.655 | 0.667 | 0.669 | |||
| Number of Inst | 183 | 183 | 180 | 180 | 176 | 176 |
| Controls | YES | YES | YES | YES | YES | YES |
| Year FE | YES | YES | YES | |||
| Inst FE | YES | YES | YES | |||
| Robust standard errors in parentheses
*** p<0.01, ** p<0.05, * p<0.1 |
||||||
Table 19: Calloway and Sant’Anna Average Treatment Effect on the Treated Results
| (1) | (2) | (3) | (4) | (5) | |
| VARIABLES | Credential Efficiency | Bachelor’s per 100 FTE | Associate’s per 100 FTE | Median Debt | One Year Repayment Rate |
| ATT | 0.239 | 0.575 | -0.730 | -14.50 | -0.00448 |
| (0.355) | (0.594) | (0.878) | (167.5) | (0.00414) | |
| Controls | YES | YES | YES | YES | YES |
| Robust standard errors in parentheses *** p<0.01, ** p<0.05, * p<0.1 |
|||||
As part of this pilot study, Ithaka S+R collected data from SACSCOC historical documents on the dates of accreditation-related actions. You can download this data here: https://sr.ithaka.org/wp-content/uploads/2022/05/accreditation_actions_data_SACSCOC.xlsx.
Endnotes
-
Julia Karon, James Dean Ward, Catharine Bond Hill, and Martin Kurzweil, “Solving Stranded Credits: Assessing the Scope and Effects of Transcript Withholding on Students, States, and Institutions,” Ithaka S+R, 5 October 2020, https://doi.org/10.18665/sr.313978.↑
- Alexandra Hegji, “An Overview of Accreditation of Higher Education in the United States,” Congressional Research Service, 16 October 2020, https://crsreports.congress.gov/product/pdf/R/R43826. ↑
- Antoinette Flores, “The Unwatched Watchdogs: How the Department of Education Fails to Properly Monitor College Accreditation Agencies,” Center for American Progress, 19 September 2019, https://www.americanprogress.org/article/the-unwatched-watchdogs/; Andrea Fuller and Douglas Belkin, “The Watchdogs of College Education Rarely Bite,” The Wall Street Journal, 17 June 2015, https://www.wsj.com/articles/the-watchdogs-of-college-education-rarely-bite-1434594602. ↑
- Robert Kelchen, “Accreditation and Accountability” in Higher Education Accountability, (Johns Hopkins University Press, 2018), 97-98. ↑
- Ibid.,102-103. ↑
- Judith S. Eaton, “An Overview of U.S. Accreditation,” Council for Higher Education (CHEA), November 2015, 7, https://www.chea.org/sites/default/files/other-content/Overview%20of%20US%20Accreditation%202015.pdf. ↑
- Alexandra Hegji, “An Overview of Accreditation of Higher Education in the United States,” Congressional Research Service, 16 October 2020), 7, https://crsreports.congress.gov/product/pdf/R/R43826. ↑
- Kim Levey, “When Accreditation Policy Changes: An Exploration of How Institutions of Higher Education Adapt,” Pepperdine University Theses and Dissertations, 2019, 133-134, https://digitalcommons.pepperdine.edu/cgi/viewcontent.cgi?article=2053&context=etd. ↑
- J. Fredericks Volkwein, Lisa R. Lattuca, Betty J. Harper, and Robert J. Domingo, “Measuring the Impact of Professional Accreditation on Student Experiences and Learning Outcomes,” Research in Higher Education 48, no. 2 (2007): 251-282, https://link.springer.com/content/pdf/10.1007/s11162-006-9039-y.pdf. ↑
- Vincent Sampson, “Dear Colleague Letter: Summary of the Higher Education Opportunity Act, Office of Postsecondary Education, December 2008, 78, https://fsapartners.ed.gov/sites/default/files/attachments/dpcletters/GEN0812FP0810AttachHEOADCL.pdf. ↑
- Ibid. ↑
- See Doruk Cengiz, Arindrajit Dube, Attila Lindner, and Ben Zipperer, “The Effect of Minimum Wages on Low-Wage Jobs,” The Quarterly Journal of Economics 134, no. 3 (2019): 1405-1454, https://doi.org/10.1093/qje/qjz014, and Brantly Calloway and Pedro H.C. Sant’Anna, “Difference-in-Differences with multiple time periods,” Journal of Econometrics 225, no. 2 (2020): 200-230.Additional details on our data and estimation strategy can be found in the methodological appendix. ↑
- Robert Kelchen, “Accreditation and Accountability” in Higher Education Accountability, (Johns Hopkins University Press, 2018), 16. ↑
- Ben Miller, “ACICS Must Go: The Largest National Accreditation Agency Is a Deeply Troubled Organization That Should No Longer Serve as a Gatekeeper to Federal Financial Aid,” Center for American Progress, 6 June 2016, https://www.americanprogress.org/article/acics-must-go/. ↑
- “Considering Performance Data, Decision Activities, and Student Achievement: A Pilot Project,” The National Advisory Committee on Institutional Quality and Integrity (NACIQI), 2015, https://sites.ed.gov/naciqi/files/naciqi-dir/2016-spring/pilot-project-march-2016.pdf. ↑
- Antoinette Flores, “How College Accreditors Miss the Mark on Student Outcomes,” Center for American Progress, 25 April 2018, https://www.americanprogress.org/article/college-accreditors-miss-mark-student-outcomes/. ↑
- Simon Boehme, “Accreditor Accountability Changes ‘Could Be Undone in a Heartbeat’,” Higher Ed Dive, 30 July 2019, https://www.highereddive.com/news/accreditor-accountability-changes-could-be-undone-in-a-heartbeat/559801/. ↑
- “ACE Analysis of Higher Education Act Reauthorization,” American Council on Education, August 2008, https://www.acenet.edu/Documents/ACE-Analysis-of-2008-Higher-Education-Act-Reauthorization.pdf. ↑
- “The Principles of Accreditation: Foundations for Quality Enhancement,” Fifth Edition, Second Printing, Southern Association of Colleges and Schools Commission on Colleges, 2011, https://sacscoc.org/app/uploads/2019/08/2012PrinciplesOfAcreditation.pdf. ↑
- Through other research conducted by Ithaka S+R, conversations with institutional Chief financial Officers, and experts in accreditation, colleges appear to be particularly responsive to the financial review done by accreditors. ↑
- Christopher A. Burnett, “Accreditation Sanctions as Quality Signals in a Competitive Market for Students” Educational Policy, December 2021, https://doi.org/10.1177/0895904820983034. ↑
- Doruk Cengiz, Arindrajit Dube, Attila Lindner, and Ben Zipperer, “The Effect of Minimum Wages on Low-Wage Jobs,” The Quarterly Journal of Economics 134, no. 3 (2019): 1405-1454, https://doi.org/10.1093/qje/qjz014; Brantly Calloway and Pedro H.C. Sant’Anna, “Difference-in-Differences with multiple time periods,” Journal of Econometrics 225, no. 2 (2020): 200-230. ↑
- The 56 institutions removed from the sample due to lack of College Scorecard data show statistically significant differences in some control variables compared to the 307 institutions that remain in our sample including institutional size and percent Pell but are similar across other characteristics including student demographics. We do not believe there is a strong concern for bias in our estimates because of the continuity in our findings across a variety of different samples and modeling approaches. ↑