Underrepresentation of Black and Latino Undergraduates at America’s Most Selective Private Colleges and Universities
-
Table of Contents
- Introduction
- Selective, not-for-profit, private institutions and Black and Latino accessibility
- How accessible were selective private institutions for Black and Latino students between 2000-18?
- Reaching Benchmarks
- Conclusion
- Appendix A: About the Data
- Appendix B: The 178 Private, Not-for-Profit Colleges and Universities[29]
- Endnotes
Acknowledgements
This paper was in part motivated by “Segregation Forever?: The Continued Underrepresentation of Blacks and Latino Undergraduates at the Nation’s 101 Most Selective Public Colleges and Universities” by Andrew Howard Nichols, PhD, the late senior director of higher education research and data analytics at the Education Trust in whose honor this paper is humbly dedicated.
We also thank Martin Kurzweil and Elizabeth Davidson Pisacreta from Ithaka S+R for their constructive input.
Introduction
Attending a more selective college or university matters because these institutions graduate a larger share of their students. Attaining a bachelors’ degree in turn increases expected lifetime earnings by roughly 65 percent over attaining only a high school diploma.[1] Who has access to these selective institutions therefore has an impact on economic and social mobility in America, an objective that justifies the large federal, state and local support of higher education across the country. However, the evidence suggests that these selective schools could be doing more in terms of socioeconomic and racial and ethnic diversity.[2]
In “Segregation Forever?: The Continued Underrepresentation of Black and Latino Undergraduates at the Nation’s 101 Most Selective Public Colleges and Universities,” Andrew Howard Nichols traced the changes in shares of Black and Latino students at the most selective public institutions, from 2000 to 2017.[3] He found that, over that time period, 60 percent of the top 101 selective public institutions saw decreases in the percentage of Black students enrolled. While these institutions did see increases in the share of Latino students enrolled, 65 percent saw gains that did not keep up with the Latino population growth in their respective states.
In “Even With Affirmative Action, Blacks and Hispanics Are More Underrepresented at Top Colleges Than 35 Years Ago,” The New York Times examined the share of Black and Hispanic first-year students at 10o selective schools, including publics and privates, between 1980 and 2015.[4] The share of Black students remained unchanged over this period, while the share of the Black college age population increased. Over this same period, the share of Hispanic students increased at this set of institutions, but by less than their increase in the college age population.
In this paper, we extend these investigations to the top private, not-for-profit institutions across the country. Improved educational attainment for Black and Latino students depends on both sectors of higher education, both of which receive significant public support. Nichols graded the performance of the top 101 public institutions identified. Rather than replicating this grading exercise, we report on how the share of Black and Latino students at the top private, not-for-profit institutions has evolved over a similar period.[5] For public institutions, which are state supported, the Black and Latino population in the state was used as a benchmark to compare against each school’s results. When examining individual institutions, The New York Times compared the performance of public institutions to state demographics, while comparing private, non-profit institutions to the national college age population. For the private, not-for-profits, we compare their student bodies over time to the share of Black and Latino students in the national pools from which these institutions recruit their overall student bodies, consistent with a methodology that one of this paper’s authors (Catharine Bond Hill) and Gordon C. Winston used in 2010 to evaluate the share of low-income students at a set of selective private, non-profit colleges and universities.[6]
After a brief discussion of the methodology, we summarize the results, which show that the selective not-for-profit sector did not do better than the public sector in contributing to improved educational outcomes for Black and Latino students during the first two decades of this century.
Selective, not-for-profit, private institutions and Black and Latino accessibility
In 2010, Catharine B. Hill and Gordon C. Winston examined the representation of low-income students at 28 of the country’s most selective, private, non-profit colleges and universities that were members of the Consortium on the Financing of Higher Education (COFHE). Extending the number of selective, private, non-profit colleges and universities to a larger group and examining the representation of Black and Latino students recognizes the important role of a larger number of institutions in this sector and also allows for a comparison to the work of Andrew Howard Nichols on selective public colleges and universities over a similar time frame.
The institutions in our study met the following criteria (see Appendix A for more information):
- An institution was identified if they were classified as “Title IX,” “Private not-for-profit, 4-year or above,” and “US Only” institutions on IPEDS.
- An institution was considered if they consistently graduate at least 70 percent of their students in six years.
- Similar to the Education Trust ’s methodology, an institution was selected if their Carnegie classification scheme on IPEDs was listed as “Full-time, more selective, lower transfer-in OR higher transfer-in” and if their average 2017 SAT score (or 2017 ACT equivalent) was 1150 or higher.
This resulted in 178 institutions, compared to the 28 Consortium on the Financing of Higher Education (COFHE) institutions and Nichols’ 101 top public institutions. The schools included are listed in Appendix B.
Benchmarking against an appropriate applicant pool
Since public institutions have historically been expected to serve in-state students due to their public missions, Nichols compares the enrollment shares of Black and Latino students at the top 101 public institutions with the share of the respective states’ Black and Latino college-age residents as a benchmark. The Times used the state shares as a benchmark for the selective University of California universities, as well as other public institutions, but the national college age shares for the Ivy League and a set of selective liberal arts colleges.
For private, not-for-profits, the state in which they are located is not an appropriate benchmark because these institutions, to differing degrees, recruit from national pools. Some are more regional, and some recruit internationally, but few would consider their state’s location as their target applicant pool.
To benchmark against an appropriate applicant pool, we use the methodology used by Hill and Winston. We take the weighted distribution of the student body by state using IPEDS enrollment data from FY 2018-16 as representative of the institution’s applicant pool. The benchmark we use to compare the current racial and ethnic representation at a particular institution is a weighted average of the institution’s geographical distribution of students and the number of 18- to 24-year-old Black and Latino residents in those states. For example, if an institution’s entering first year class was exclusively recruited from California and New York in equal numbers (states where about 7 percent and 17 percent of the population of 18- to 24-year-olds identify as Black, respectively), we assume that equitable representation for Black students at this institution should be 12 percent of first-year student enrollment based on the weighted average of its geographical recruitment (i.e., weighted average = (0.07 x 0.50) + (0.17 x 0.50)).
For each of the 178 institutions in this report, we examined the percentage of Black and Latino students enrolled compared to a state-weighted benchmark based on the states from which they recruit their overall student bodies.[7] These benchmarks are discussed as “access ratios” in this paper. The comparison examines to what extent an institution has shares of Black and Latino students that reflect the population of Black and Latino college age students in the states from which they are recruiting their overall student bodies.
How accessible were selective private institutions for Black and Latino students between 2000-18?
While improving the representation of Black and Latino students at selective private institutions has become a stated priority for a number of institutions as they work to increase equity, many are still lagging. Since 2000, there remains a persistent underrepresentation of Black and Latino students at the most selective private institutions.
While many institutions have improved access for Latino students, access for Black students has largely remained unchanged or has gotten worse. Between 2000 and 2018, about 38 percent (n=67) of the 178 institutions identified saw a decrease in the percentage of Black students enrolled and about 21 percent (n=37) did not see any incremental change in their enrollment of Black students (see Figure 1). Nearly six out of ten institutions did not show improvement in enrolling more Black students.[8]
The average percentage change in Black student representation over 2000-2018 was a one percentage point increase as seen in Table 1. This does not align to the considerable demographic changes which have occurred in nearly every state since the year 2000. As Nichols noted, between 2000-17, nearly half of all states experienced a population share increase of Black residents by more than two percentage points.[9]
In comparison, since 2000, selective private institutions have enrolled more Latino students. About 95 percent (n=169) of institutions saw an increase in the percentage of Latino students enrolled while about 2 percent (n=4) saw a decrease in their enrollment of Latino students (see Figure 1). Five institutions did not see any changes in their Latino student enrollment during those years. The average percentage change in Latino student representation over 2000-18 was a five-percentage point increase (as seen in Table 1).
This also does not align with demographic changes that occurred between 2000-17 since more than half of all states saw a Latino population growth that exceeded five percentage points while at least seven states saw gains that exceeded ten percentage points. [10] The shares of Black and Latino students at nearly all these selective private institutions have not reflected these demographic changes.
Figure 1: Change in Share of Black and Latino Students Enrolled (2000-2018)
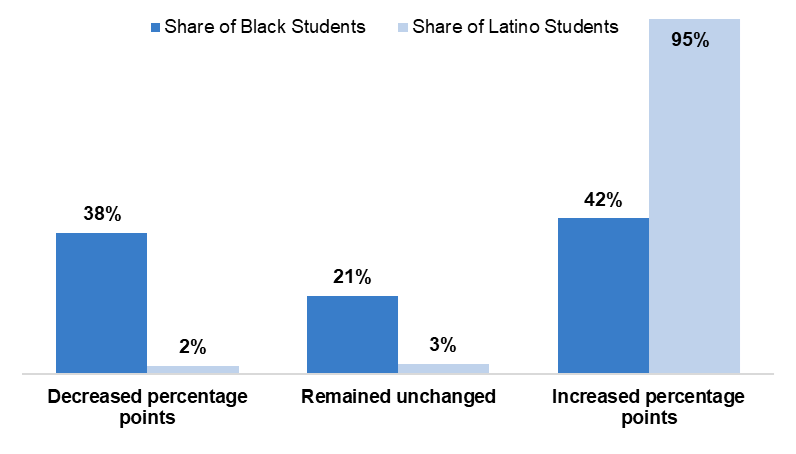
Source: Ithaka S+R analysis of 2000-2018 data from the Integrated Postsecondary Education Data System (IPEDS)
Table 1: Percentage Point Change in Black and Latino Student Representation
| Percentage Point Change of Black Student Representation (2000-18) | Percentage Point Change of Latino Student Representation (2000-18) | |
| Average | 0.01 | 0.05 |
| Min | -0.07 | -0.05 |
| Max | 0.07 | 0.19 |
As seen in Table 2, taking into account the states from which institutions recruit their students, the average share of 18–24-year-old Black people in the state-weighted population in 2000 was .13 compared to .04 enrolled in these selective colleges and universities. By 2018, the shares of Black students enrolled increased to .05, while the share of 18–24-year-old Black people in the state-weighted population increased to .14. In 2000, only 12 percent of the 178 colleges and universities reached more than the 60 percent benchmark share of Black students, and only this 6 percent reached this benchmark in 2018. [11]
Table 2: Percentage of Black Student Enrollment and Target Representation at Selective Institutions[12]
| %Target for Black Student representation (2018) | Percentage of Black Students Enrolled (2018) | Black Student Access Ratio (2018) | %Target for Black Student representation (2000) | Percentage Of Black Students Enrolled (2000) | Black Student Access Ratio (2000) | |
| Average | 0.14 | 0.05 | 0.36 | 0.13 | 0.04 | 0.37 |
| Median | 0.14 | 0.05 | 0.35 | 0.13 | 0.04 | 0.33 |
| Min | 0.05 | 0.00 | 0.00 | 0.03 | 0.00 | 0.00 |
| Max | 0.34 | 0.29 | 0.86 | 0.31 | 0.24 | >=1.00 |
| The average and the median report the data for the 178 identified institutions in the sample. The min and max report the smallest and the largest values for each column across all 178 institutions. The minimum is rounded down to zero. The institution with the minimum share of Black and Latino students of 0 has a strong religious affiliation which explains the small numbers. | ||||||
Again, taking into account the states from which institutions recruit their students (see Table 3), the average share of 18–24-year-old Latinos in the population in 2000 was .16 compared to .04 enrolled in these selective schools. By 2018, the share of Latinos enrolled increased to .10, while the share of 18–24-year-old Latinos in the state-weighted population increased to .21. In 2000, 3 percent of institutions enrolled 60 percent or more of their benchmark share of Latino students. Since 2000 access for Latino students has improved, but still only 13 percent of colleges and universities have reached their 60 percent benchmark share.[13]
Table 3: Percentage of Latino Student Enrollment and Target Representation at Selective Institutions (2000-2018)
| %Target for Latino student representation (2018) | Percentage of Latino Students (2018) | Latino Student Access Ratio (2018) | %Target for Latino student representation (2000) | Percentage of Latino Students (2000) | Latino Student Access Ratio (2000) | |
| Average | 0.21 | 0.10 | 0.46 | 0.16 | 0.04 | 0.27 |
| Median | 0.20 | 0.09 | 0.45 | 0.15 | 0.03 | 0.24 |
| Min | 0.07 | 0.00 | 0.01 | 0.03 | 0.00 | 0.01 |
| Max | 0.44 | 0.31 | >=1.00 | 0.39 | 0.28 | >=1.00 |
| The average and the median report the data for the 178 identified institutions in the sample. The min and max report the smallest and the largest values for each column across all 178 institutions. The minimum is rounded down to zero. The institution with the minimum share of Black and Latino students of 0 has a strong religious affiliation which explains the small numbers. | ||||||
Also as seen in Table 2, these selective private institutions had a median access ratio (% enrolled/benchmark) of 35 for Black students in 2018, which only slightly improved since 2000. Overall, most private selective institutions have about a ten-percentage point gap between their current representation of Black students and the benchmark to achieve representation based on the national recruiting pools of these institutions. Latino students fared slightly better. The median access ratio for the most selective private institutions was 45 percent in 2018, which improved by more than 20 percentage points since 2000 (see Table 3). However, Latino students also had about a 11-percentage point gap between their current representation at these selective institutions compared to their benchmark to achieve representation based on the national recruiting pools of these institutions.
Reaching Benchmarks
Between 2000 and 2018, some institutions made strides in recruiting and enrolling more Black and Latino students. For example, Amherst College and Pomona College increased their Black student populations by four to five percentage points over that period, while Loyola University Chicago increased their Latino student population by seven percentage points.
This can be attributed to shifting priorities to enroll more students of color. For example, Amherst College admitted a student body for their fall 2021 class with nearly 50 percent of students identifying as non-white.[14] With a strong commitment to admitting and enrolling students of color by increasing financial aid, last year Amherst committed to spend $61 million on financial aid, with an average grant award of $50,000. Others like Loyola University Chicago have adopted policies such as creating a two-year commuter program that was designed to specifically address first generation student needs.[15] This has led to inroads in recruiting and enrolling more Latino students. Of course, given the locations of many selective institutions, it will be important for them to search nationally and in locations with large numbers of Black and Latino students. While these examples demonstrate that some institutions have made advances in achieving more equitable representation, there is still much that needs to be done for private selective colleges to increase their diversity.
Across the 178 colleges and universities in this study, we estimated that to achieve parity with their benchmarks would require enrolling ~96,000 more Latino students and ~73,000 additional Black students. We estimated the additional number of students by comparing the target and actual representation of Black and Latino students and the number of students needed to achieve representation (Table 4 presents an example of institutional information and how this was calculated.) For example, at Pomona College, 9 percent of the student body identified as Black. However, based on the geographic recruitment of its first-year student body, we assume that an equitable representation for Black students at this institution should be 11 percent. Therefore, to achieve parity, we calculate that Pomona would need to increase its Black student body by 27 percent based on their national recruiting pool.
Table 4: Target vs Actual Representation of Black and Latino Students to Achieve Parity[16]
| Institution | % Target for Black student representation (2018) | % Of Black Students (2018) | Average Undergrad Enrollment (2018-15) | Average Black Student Enrollment (2018-15) | % Change to meet parity |
| Pomona College | 0.11 | 0.09 | 1,578 | 141 | 0.27 |
| Institution | % Target for Latino student representation (2018) | % Of Latino Students (2018) | Average Undergrad Enrollment (2018-15) | Average Latino Student Enrollment (2018-15) | % Change to meet parity |
| Loyola University Chicago | 0.19 | 0.16 | 11,489 | 1,805 | 0.18 |
In creating a benchmark, we assumed that the distribution of students by state at each institution defines the pool from which each institution recruits. This, of course, need not remain fixed. An alternative benchmark for these private, non-profit institutions could be the shares of Black and Latino students in the nation, rather than a weighted average of the states from which they currently matriculate students. The shares of Black and Latino 18- to 24-year-old students in 2000 and 2018 in the nation are reported here, alongside information based on calculating the benchmark based on where institutions currently recruit students. The national benchmark suggests nearly the same amount of underrepresentation of Blacks and Latinos at these institutions in the aggregate.
Table 5: National, State-Weighted, and Actual Representation of Black and Latino 18- to 24-year-olds
| 18-24 years old Black population | 18-24 years old Latino population | |||
| Year 2000 | Year 2018 | Year 2000 | Year 2018 | |
| National average | 0.14 | 0.15 | 0.17 | 0.22 |
| Target representation based on states recruited from | 0.13 | 0.14 | 0.16 | 0.21 |
| Actual representation of students across institutions | 0.04 | 0.05 | 0.04 | 0.10 |
Hill and Winston found that inadequate attention to geography on the part of a selective group of colleges and universities in their search and recruiting activities has contributed to a bias against low-income students at these schools.[17] Despite the overlap in socioeconomic status, this does not appear to be the case for Black and Latino students. The 178 private, not-for-profit colleges and universities discussed in this study are already recruiting on average from states with shares of Black and Latino students similar to the national average (see Table 5). On average, the states from which they are recruiting have only slightly lower shares of Black and Latino 18- to 24-year-olds. In addition, they are recruiting from many states with high shares of Black and Latino 18- to 24-year-olds (see Table 6). If they are to increase their shares of Black and Latino students, one strategy is to seek out greater numbers of Black and Latino students in the states from which they are already recruiting students. Another important strategy would be to increase their search and recruiting activities even further in those states with large numbers of these students, which could increase the likelihood of success.[18]
Table 6: Top 20 most recruited states for applicants[19]
| State | Share of Students from identified 178 Institutions | Share of nation’s 18–24-year-olds | Share of nation’s Black 18–24-year-olds | Share of nation’s Latino 18–24-year-olds | Latino % of state 18–24-year-olds | Black % of state 18–24-year-olds |
| California | 0.11 | 0.13 | 0.06 | 0.27 | 0.47 | 0.07 |
| New York | 0.11 | 0.06 | 0.06 | 0.06 | 0.22 | 0.17 |
| Illinois | 0.06 | 0.04 | 0.04 | 0.04 | 0.21 | 0.17 |
| Pennsylvania | 0.06 | 0.04 | 0.04 | 0.02 | 0.10 | 0.14 |
| Texas | 0.06 | 0.09 | 0.08 | 0.19 | 0.46 | 0.14 |
| Massachusetts | 0.06 | 0.02 | 0.01 | 0.02 | 0.16 | 0.09 |
| New Jersey | 0.05 | 0.03 | 0.03 | 0.03 | 0.24 | 0.16 |
| Ohio | 0.04 | 0.04 | 0.04 | 0.01 | 0.05 | 0.16 |
| Minnesota | 0.03 | 0.02 | 0.01 | 0.01 | 0.07 | 0.09 |
| Indiana | 0.03 | 0.02 | 0.02 | 0.01 | 0.09 | 0.12 |
| Connecticut | 0.03 | 0.01 | 0.01 | 0.01 | 0.20 | 0.13 |
| Washington | 0.03 | 0.02 | 0.01 | 0.02 | 0.17 | 0.06 |
| Florida | 0.02 | 0.06 | 0.08 | 0.08 | 0.29 | 0.21 |
| Georgia | 0.02 | 0.03 | 0.08 | 0.02 | 0.11 | 0.36 |
| Maryland | 0.02 | 0.02 | 0.04 | 0.01 | 0.11 | 0.33 |
| North Carolina | 0.02 | 0.03 | 0.05 | 0.02 | 0.12 | 0.25 |
| Michigan | 0.02 | 0.03 | 0.04 | 0.01 | 0.07 | 0.17 |
| Missouri | 0.02 | 0.02 | 0.02 | 0.01 | 0.06 | 0.15 |
| Tennessee | 0.02 | 0.02 | 0.03 | 0.01 | 0.07 | 0.22 |
| Virginia | 0.02 | 0.03 | 0.04 | 0.01 | 0.11 | 0.22 |
In earlier work focused on socioeconomic diversity, Hill and Winston compared the share and numbers of low-income students at selective schools with the share and numbers of low-income students at various SAT and ACT levels in the test-taking population.[20] This was to demonstrate that there were more high-ability low-income students in the national test taking population, achieving scores that met reasonable admissions standards, than were enrolled in these schools. The numbers of such students were more than adequate for these institutions to significantly increase their socioeconomic diversity.
While the use of SAT and other standardized tests in admissions is controversial for a host of reasons, they do shed light on high school students who are thinking about going on to college. Among the 2021 high school graduates who took an SAT exam, there were over half a million Black and Latino students. This is a pool of high school graduates with college aspirations. In addition, if the 2021 data are representative, over a four-year period, there would be almost a quarter of a million Black and Latino students with SAT scores at or above 1200.[21] Since many of the 178 colleges and universities in this study have many students with SAT scores below 1200, these data are conservative in terms of identifying a pool. At these selective schools on average, 25 percent of students have combined SAT scores below about 1225 and about 45 percent of students do not submit a standardized test score. Again, using the 2021 data, over a four-year period there would be almost 800,000 Black and Latino students with scores at or above 1000. This evidence suggests that there are large pools of college-ready Black and Latino students from which selective private colleges and universities can recruit, admit, matriculate, and graduate a more diverse student body.
Conclusion
The more selective private, not-for-profit colleges and universities across the country have increased their diversity by increasing their share of Latino students to a greater extent than Black students. But, for both groups, like the selective public institutions of the Education Trust study, their share of Black and Latino students compared to the demographics of the states from which they recruit still falls far short. This is problematic because Black and Latino students are still more likely to be tracked into underfunded and crowded colleges compared to their White peers.[22] Selective and more well-resourced colleges disproportionately enroll higher shares of White and Asian students compared to the shares of Black and Latino students they enroll.[23] This has resulted in more Black and Latino students attending institutions with reduced resources rather than those well-resourced institutions which deliver higher graduation rates, greater access to graduate studies, and generally better economic outcomes for students.[24]
We know that reallocating these students to more selective institutions, with their greater resources, would increase their graduation rates. While not all students at these other institutions would be adequately prepared for succeeding at these more selective institutions, we know that there is significant undermatching and that a very large number of them could succeed at these institutions. Given the evidence on the number of students who undermatch and the success of Black and Latino students when they attend selective schools, inadequate supply should not be used by institutions as an explanation for the numbers.[25]
The Education Trust’s “Segregation Forever?” offers a set of proposals for both institutions and policy makers to increase the representation of Black and Latino students in the most selective 101 public institutions across the country.[26] Many of their proposals are appropriate for the set of private, non-profit colleges and universities examined in this paper. For example, setting goals, taking race into account, amending recruitment strategies, and improving campus racial climate would all apply to private non-profit colleges and universities as well as to selective public institutions. There are a variety of ways to increase the racial diversity of these schools. What is needed is institutional commitment.
With nearly two million Black and Latino students enrolled in community colleges,[27] and more at less selective publics and not-for-profits, the pool of college-going Black and Latino students who could thrive at the more selective colleges and universities is large. That so little progress has been made over the last two decades calls for renewed efforts to do better starting now. As discussed in this paper, the 178 private, not-for-profit colleges and universities are already recruiting from states with equal or greater shares of Black and Latino students (see Table 6). Therefore, they can increase their shares of Black and Latino students by seeking a greater number of Black and Latino students from those recruiting pools. These institutions can also expand their search and recruiting activities even further in states with large numbers of Black and Latino students, which could increase the diversity of their campuses.
A key to improving educational attainment in America, important for equity and economic reasons, is improving post-secondary success for those demographic groups for whom it has been lagging. This includes Black and Latino students, for whom bachelor degree attainment falls far behind that of Whites and Asian Americans. In our efforts to do this, it is important to increase the representation of Black and Latino students at the selective public and private, not-for-profit colleges and universities across the country. These institutions are better resourced and have higher graduation rates. If we are to improve overall educational attainment, these institutions need to do more for currently underrepresented populations.[28]
While we consider this to be important, we also recognize that it is important to increase the resources at two-year and four-year institutions not included in these two lists of selective publics and private non-profits. Most Black and Latino students will continue to be educated in these institutions, which have fewer resources than their more selective peers. With more resources to devote to student success, from academic programs to other student support services, we can also contribute to improved overall educational attainment. Our two-pronged approach includes reallocating Black and Latino students to the selective schools with greater resources and increasing the resources to the colleges and universities where most students will continue to be educated over the coming years.
Appendix A: About the Data
Criteria
Ithaka S+R identified 178 selective private non-profit colleges and universities that were included in the analysis by using these criteria:
- An institution was identified if they were classified as Title IX, “Private not-for-profit, 4-year or above,” and “US Only” institutions on IPEDS.
- An institution was considered if they consistently graduate at least 70 percent of their students in six years.
- As in the Education Trust’s methodology, an institution was selected if their Carnegie classification scheme on IPEDs was listed as “Full-time, more selective, lower transfer-in OR higher transfer-in” and if their average 2017 SAT score (or 2017 ACT equivalent) was 1150 or higher.
Other data notes
- Under the Carnegie classification scheme, institutions are included if fall enrollment data indicate at least 80 percent of undergraduates are enrolled full time at institutions. It also notes if test score data for first-year students indicate that these institutions are more selective in admissions (80th to 100th percentile of selectivity among all baccalaureate institutions).
- As listed in the Education Trust’s report, an average score of 1150, or higher, places institutions among the top 20 percent of all institutions.
- As a departure from the Education Trust’s methods, we did not only include institutions classified as “Highest Research Activity” under Carnegie as that would have greatly reduced the sample size because many small liberal arts colleges are excluded.
- A three-year average of IPEDS enrollment data from 1998 to 2000 was used to create institutional estimates for the percentages of Black and Latino students at the colleges in 2000.
- IPEDS enrollment data from 2016, 2017, and 2018 were used to create estimates for enrollment in 2018. These three-year averages were used to soften the influence of any fluctuations in enrollment year-to-year.
- Using IPEDS’ fall enrollment data on the “residence and migration” of first-time freshman (fall 2018), we estimated the state distribution of students from the selected colleges.
- Skidmore College and Spelman College were excluded because distribution of freshmen and their geographical origin was not available.
- Data from the United States Census Bureau’s Census 2000 and American Community Survey (ACS, 2016-2018) was used.
- The Census 2000 and ACS data from 2016, 2017, and 2018 were used to create population estimates of the percentage of 18- to 24-year-old residents in each state who were Black and Latino in 2000 and 2018. Three years of ACS data were used to ensure the sample size was large enough to produce accurate estimates.
Appendix B: The 178 Private, Not-for-Profit Colleges and Universities[29]
- Allegheny College
- American University
- Amherst College
- Augustana University
- Austin College
- Barnard College
- Baylor University
- Belmont University
- Beloit College
- Bentley University
- Boston College
- Boston University
- Bradley University
- Brandeis University
- Brigham Young University-Provo
- Brown University
- Bucknell University
- Butler University
- California Institute of Technology
- Calvin University
- Carleton College
- Carnegie Mellon University
- Case Western Reserve University
- Cedarville University
- Centre College
- Chapman University
- Claremont McKenna College
- Clarkson University
- Coe College
- Colby College
- Colgate University
- Columbia University in the City of New York
- Concordia College at Moorhead
- Connecticut College
- Cooper Union for the Advancement of Science and Art
- Cornell University
- Creighton University
- Dartmouth College
- Davidson College
- Denison University
- DePauw University
- Dordt University
- Drake University
- Drexel University
- Duke University
- Duquesne University
- Earlham College
- Elizabethtown College
- Elon University
- Emerson College
- Emory University
- Fordham University
- Franciscan University of Steubenville
- Freed-Hardeman University
- Furman University
- George Washington University
- Georgetown University
- Gonzaga University
- Grinnell College
- Hamilton College
- Hanover College
- Harvard University
- Harvey Mudd College
- Haverford College
- Hendrix College
- Hobart William Smith Colleges
- Hope College
- Illinois Institute of Technology
- Illinois Wesleyan University
- John Brown University
- John Carroll University
- Johns Hopkins University
- Kenyon College
- Lafayette College
- Lawrence University
- Le Moyne College
- Lebanon Valley College
- Lehigh University
- Lipscomb University
- Loyola Marymount University
- Loyola University Chicago
- Loyola University New Orleans
- Luther College
- Macalester College
- Marquette University
- Massachusetts Institute of Technology
- Mercer University
- Messiah College
- Middlebury College
- Mount Holyoke College
- Muhlenberg College
- New York University
- Northeastern University
- Northwestern University
- Oberlin College
- Occidental College
- Ohio Northern University
- Oklahoma City University
- Pacific University
- Pepperdine University
- Point Loma Nazarene University
- Pomona College
- Princeton University
- Providence College
- Quinnipiac University
- Reed College
- Rensselaer Polytechnic Institute
- Rhodes College
- Rice University
- Rochester Institute of Technology
- Rockhurst University
- Saint Anselm College
- Saint John Fisher College
- Saint Joseph’s University
- Saint Louis University
- Saint Mary’s College
- Saint Mary’s College of California
- Salem College
- Samford University
- Santa Clara University
- Sarah Lawrence College
- Scripps College
- Seattle University
- Simmons University
- Southern Methodist University
- Southwestern University
- St John’s University-New York
- St Lawrence University
- St Olaf College
- Stanford University
- Stevens Institute of Technology
- Swarthmore College
- Syracuse University
- Taylor University
- Texas Christian University
- The College of Wooster
- Trinity College
- Trinity University
- Tufts University
- Tulane University of Louisiana
- University of Chicago
- University of Dallas
- University of Dayton
- University of Denver
- University of Miami
- University of Notre Dame
- University of Pennsylvania
- University of Portland
- University of Redlands
- University of Richmond
- University of Rochester
- University of San Diego
- University of San Francisco
- University of Scranton
- University of Southern California
- University of St Thomas
- University of Tulsa
- Ursinus College
- Valparaiso University
- Vanderbilt University
- Vassar College
- Villanova University
- Wabash College
- Warren Wilson College
- Washington and Lee University
- Washington University in St Louis
- Wellesley College
- Westmont College
- Wheaton College (Illinois)
- Wheaton College
- Whitman College
- Whitworth University
- William Jewell College
- Williams College
- Wofford College
- Xavier University
- Yale University
- Yeshiva University
Endnotes
-
“Variation in Earnings,” in Understanding College Affordability, Urban Institute, http://collegeaffordability.urban.org/after-college/variation-in-earnings/.↑
- Raj Chetty, John N. Friedman, Emmanuel Saez, Nicholas Turner, and Danny Yagan, “Income Segregation and Intergenerational Mobility Across Colleges in the United States (previously titled ‘Mobility Report Cards’),” Quarterly Journal of Economics, Forthcoming. ↑
-
Andrew Howard Nichols, “Segregation Forever?: The Continued Underrepresentation of Black and Latino Undergraduates at the Nation’s 101 Most Selective Public Colleges and Universities,” Education Trust, 21 July 2020, https://edtrust.org/resource/segregation-forever/.↑
-
Jeremy Ashkenas, Haeyoun Park, and Adam Pearce, “Even With Affirmative Action, Blacks and Hispanics Are More Underrepresented at Top Colleges Than 35 Years Ago,” The New York Times, 24 August 2017, https://www.nytimes.com/interactive/2017/08/24/us/affirmative-action.html.↑
-
In Summer 2022, the Education Trust is set to release a new report that builds upon Andrew Howard Nichols’ “Segregation Forever?” report by continuing its assessment of the accessibility and continued underrepresentation of Black and Latino students at America’s top colleges and universities. They will focus on private institutions instead of the public institutions it examined in its 2020 report.
-
Catharine B. Hill and Gordon C. Winston, “Low-Income Students and Highly Selective Private Colleges: Geography, Searching, and Recruiting,” Economics of Education Review 29, no. 4 (2010): 495-503, https://www.sciencedirect.com/science/article/abs/pii/S0272775710000026.
-
The state weighted benchmark is the three-year average of the state distribution of each institution’s entering classes from 2016 to 2018.
-
Data bounds for change in share of Black and Latino students: If an institution had a negative percentage point decrease (x<0), they were marked as an institution which had “decreased percentage points.” If an institution was nearing zero (x= 0.00), they were marked as an institution which had “remained unchanged.” If an institution had a positive percentage point increase (x>0.00), then they were marked as an institution which had “increased percentage points.”
-
Andrew Howard Nichols, “Segregation Forever?: The Continued Underrepresentation of Black and Latino Undergraduates at the Nation’s 101 Most Selective Public Colleges and Universities,” Education Trust, 21 July 2020, https://edtrust.org/resource/segregation-forever/.
-
Ibid.
-
Source: Ithaka S+R analysis of 2000 and 2018 data from the US Census Bureau and the Integrated Postsecondary Education Data System (IPEDS).
-
In this analysis, we did not include the enrollment data of students who identified as two races or more. However, we estimate based on IPEDS data that the range for students who identified as two or more races was between 0-3 percent across the 178 institutions. The median and average was about 1 percent. Therefore, we assume that not including the percentage of students who identify as two races or more does not underestimate the current representation level of Black and Latino students.
-
Source: Ithaka S+R analysis of 2000 and 2018 data from the US Census Bureau and the Integrated Postsecondary Education Data System (IPEDS).
-
Scott Jaschik, “Nonwhite Students Are Majority of Amherst’s Admitted Class,” Inside Higher Ed, 7 June 2021, https://www.insidehighered.com/admissions/article/2021/06/07/amherst-college-attracts-diverse-students.
-
Rosa Flores, “A Debt-Free College for Students Who Struggle Most,” CNN, 2 September 2016, https://www.cnn.com/2016/09/01/health/chicago-community-college-arrupe/index.html.
-
Based on actual numbers, not percentages, rounded to two decimal points as reported in the table.
-
Catharine B. Hill and Gordon C. Winston, “Low-Income Students and Highly Selective Private Colleges: Geography, Searching, and Recruiting,” Economics of Education Review 29, no. 4 (2010): 495-503, https://www.sciencedirect.com/science/article/abs/pii/S0272775710000026.
-
This may be particularly important for individual institutions, which may not currently be recruiting students from states with high shares of Black and Latino populations.
-
Three Year Average of 2018-16.
- Catharine B. Hill and Gordon C. Winston, “How Scarce Are High-Ability, Low-Income Students” in College Access: Opportunity or Privilege? eds. Michael S. McPherson and Morton Owen Schapiro (College Board, 2006). ↑
-
“SAT Participation and Performance: Score Distribution by Subgroup,” in 2021 SAT Suite of Assessments Annual Report, College Board, https://reports.collegeboard.org/media/2022-04/2021-total-group-sat-suite-of-assessments-annual-report%20%281%29.pdf. These data may be understated because of the COVID pandemic.
-
Anthony P. Carnevale and Jeff Strohl, “Separate & Unequal: How Higher Education Reinforces the Intergenerational Reproduction of White Racial Privilege,” (2013), https://cew.georgetown.edu/cew-reports/separate-unequal/.
-
Kelia Washington, “Racial Equity in Higher Education Starts in the Admissions Office,” (2020), https://www.urban.org/urban-wire/racial-equity-higher-education-starts-admissions-office.
-
Anthony P. Carnevale and Jeff Strohl, “Separate & Unequal: How Higher Education Reinforces the Intergenerational Reproduction of White Racial Privilege,” (2013), https://cew.georgetown.edu/cew-reports/separate-unequal/.
-
Caroline M. Hoxby and Christopher Avery, “The Missing ‘One-Offs’: The Hidden Supply of High-Achieving, Low-Income Students,” no. w18586, National Bureau of Economic Research, 2012.
-
Andrew Howard Nichols, “Segregation Forever?: The Continued Underrepresentation of Black and Latino Undergraduates at the Nation’s 101 Most Selective Public Colleges and Universities,” Education Trust (2020), https://edtrust.org/resource/segregation-forever/.
-
Ithaka S+R analysis of fall 2019 data from Integrated Postsecondary Education Data System (IPEDS).
-
US Department of Education, “Advancing Diversity and Inclusion in Higher Education” (2016). https://www2.ed.gov/rschstat/research/pubs/advancing-diversity-inclusion.pdf.
-
Institutions who wish to request information on their state weighted benchmark can contact Ithaka S+R at ithakasr@ithaka.org.