March Madness: Socioeconomic Diversity Edition
At Ithaka S+R, one of our primary missions is to expand educational opportunities for students from diverse backgrounds. Some of our programs, including the American Talent Initiative which aims to increase the number of lower-income students enrolled at the top colleges and universities in the country, focus on increasing socioeconomic diversity at higher education institutions, while others focus on improving outcomes for lower income, first generation, and underrepresented minority students at the colleges and universities where they are already more likely to enroll.
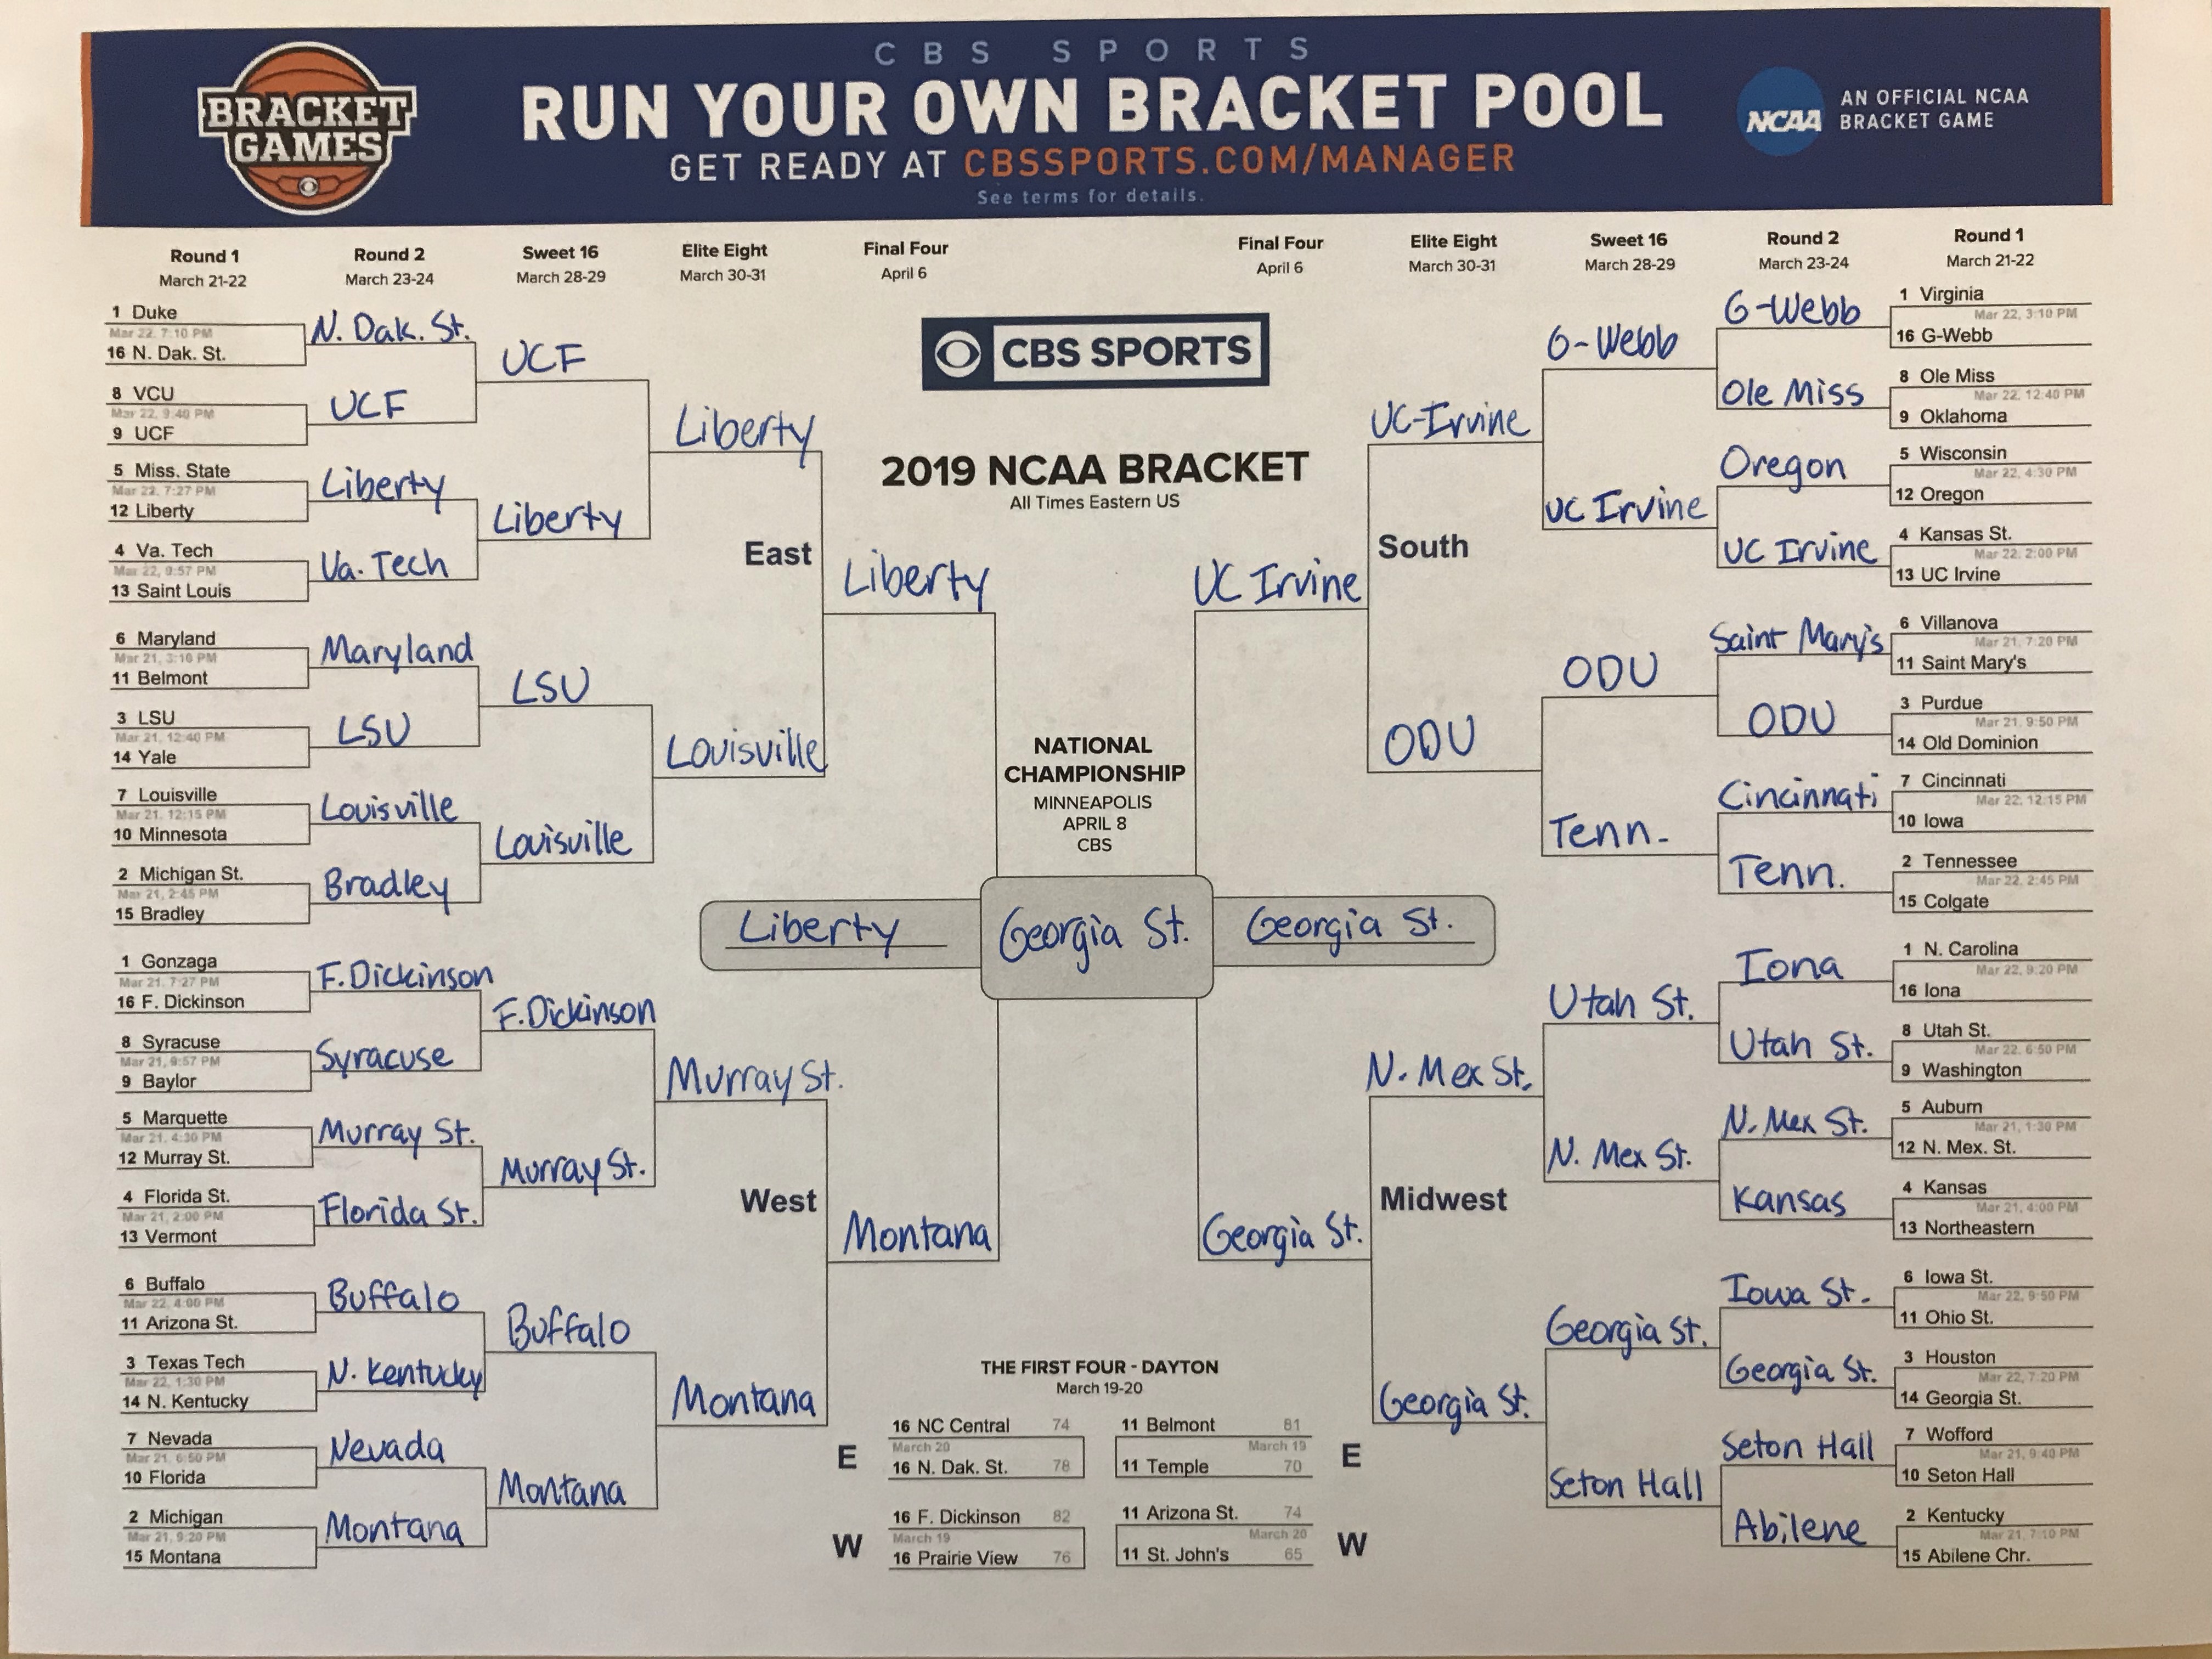
While most people were filling out their NCAA college basketball tournament brackets based on the athletic prowess of the teams, we at Ithaka S+R completed our bracket based on socioeconomic diversity. Using Integrated Postsecondary Education Data System (IPEDS) data, we chose the winner of each matchup based on which institution had a larger share of undergraduates who were awarded a Pell grant during the 2016-17 academic year.* If advancing in the 2019 NCAA Tournament was based on socioeconomic diversity, the national champions would be Georgia State University (49.3 percent Pell), beating out Liberty University (45.6 percent), the University of California-Irvine (42.3 percent), and The University of Montana (33.8 percent). It’s worth noting, however, that based on basketball skills alone, these four teams did not advance to the Sweet 16.
Coincidentally, our bracket’s winner, Georgia State University (GSU), is one of the 11 institutions that forms the University Innovation Alliance (UIA), a “leading national coalition of public research universities committed to increasing the number and diversity of college graduates in the United States.” These 11 institutions are currently part of the Monitoring Advising Analytics to Promote Success (MAAPS) project, which tests the impact of proactive, technology-enhanced advising for low-income and first-generation students, a project that Ithaka S+R serves as the independent evaluator.
We were not the only ones to buck tradition and pick winners based on something other than ability on the court. The Hechinger Report published a bracket by HCM Strategies that incorporated four metrics to measure institutions’ “track records of closing equity gaps and ensuring student success,” while The 74 Million used Opportunity Insights data to choose which institutions would progress based on the likelihood their students from families in the bottom 40 percent of the income distribution earned income in the top 40 percent as adults.
March Madness can be about more than just celebrating institutions with highly talented basketball teams of student-athletes. It also provides an opportunity to highlight schools that excel in promoting socioeconomic diversity, closing equity gaps, and increasing income mobility.
*While Pell is not a perfect proxy for socioeconomic status, we used it in this analysis because it is publicly available and comparable across all participating institutions.