Online Learning During COVID-19
Digital and Educational Divides Have Similar Boundaries
In 2018, nearly 78 percent of households in America had a desktop or laptop computer and 74 percent had a broadband Internet subscription, a significant increase in digital access over the last two decades. Yet, millions of Americans are without access, and the distribution is wildly uneven across geographic regions (as well as demographic subgroups). A digital divide has existed in America for years, but the COVID-19 pandemic has exposed it and made it more relevant than ever before.
As in many other areas, the digital divide is having a stark impact on higher education. As colleges and universities have shifted to remote learning, and with “safer at home” requirements in place, students without computer access or home Internet are at a serious disadvantage in continuing their studies. Indeed, many students without access to their campuses or public libraries have lost their only way of getting online.
Colleges and universities–with assistance from government and philanthropy–have made efforts to mitigate the divide for their students. But institutional capacity, just like digital access, varies with geography. And as it turns out, the relationship between colleges’ and universities’ resources and the local community’s digital access means that students in certain regions of the country are doubly disadvantaged.
To better understand this relationship between institutional resources and digital access, and how it may be currently impacting students, we explored 2018 computer and Internet access data at the county-level from the U.S. Census Bureau’s American Community Survey (ACS), and education and related spending at public institutions from the 2017-18 academic year using Integrated Postsecondary Education Data System (IPEDS) data, hypothesizing that the least-resourced institutions are located in counties with the lowest levels of digital access. Specifically, we drew on county-level five-year estimates[1] of the share of households that own either a desktop or laptop computer, and the share of households that have broadband Internet, including cable, fiber optic, DSL, and satellite service.[2] ACS data do not include institutional identifiers, so we were unable to calculate the share of students that lack access by institution. However, students who attend public institutions tend to go to schools close to home. This is especially true for those who attend community colleges, where the median distance between a student’s home and campus is eight miles. So county-level data on digital access is a reasonable proxy of digital access for the students of public colleges in that county. To get a sense of the ability of institutions to offer their students resources to bridge the digital gap, we used IPEDS finance data for public institutions[3] and calculated education and related spending per student,[4] aggregating the results to the county-level.
We found that there is a moderately positive relationship between digital access and educational spending, meaning that institutions with relatively low resources tend to be located in counties where household access to a desktop or laptop and broadband Internet are low.[5] This suggests, in other words, that the schools that enroll a disproportionate number of students who don’t have at-home digital access are the least-resourced institutions, making it even more challenging for those students to have their digital access needs met. While we did find positive correlations between digital access and institutional spending when limiting our sample to community colleges only, we were surprised to find the relationship to be stronger when looking across all public institutions, especially given that community colleges are the lowest-resourced institutions in the higher education sector and enroll the most disadvantaged students.[6]
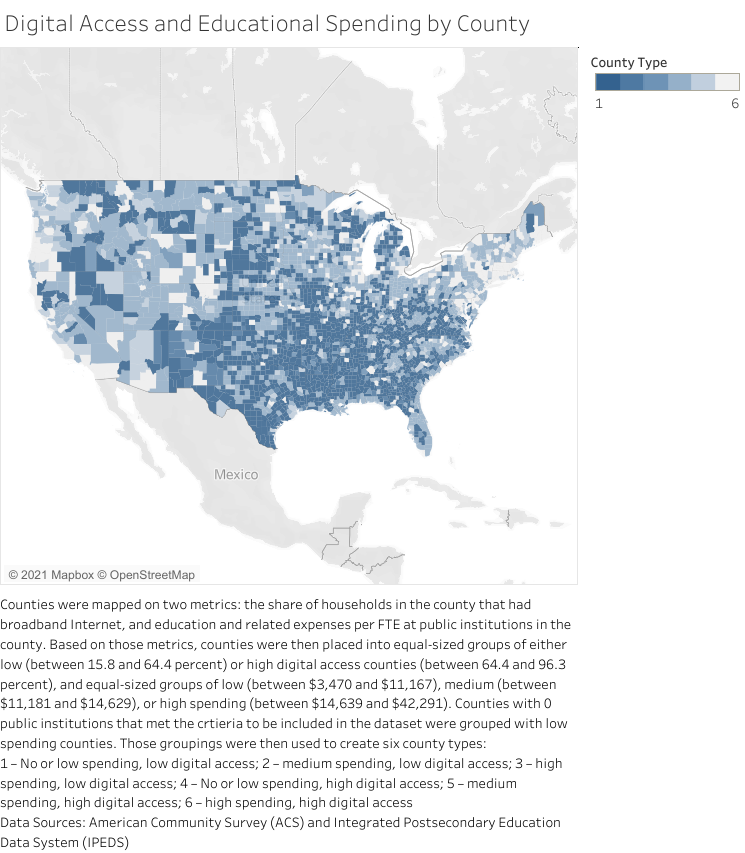
An interactive version of the map is available on the Tableau website.
The map above reflects levels of digital access and educational spending by county across the contiguous United States. Counties were placed into one of six county types, which were color-coded, with the darker colors representing less digital access and less educational spending. While 45 percent of counties are classified as having no or low spending and low digital access (county type 1), those counties represent only 11 percent of households across the country, indicating that these counties are sparsely populated. Conversely, while only nine percent of counties are classified as having high levels of spending and high digital access (county type 6), those counties are home to 35 percent of households. Please see the caption for additional details on how counties were categorized.
In our analysis we identified multiple counties with low digital access and relatively low levels of spending. In fact, there are four counties–Webster Parish in Louisiana, Holmes County and Kemper County in Mississippi, and Allendale County in South Carolina–where a majority of households do not have a desktop or laptop, a majority do not have broadband Internet, and educational spending is less than $10,000 per FTE student. At the same time, there are multiple counties that have low levels of digital access but relatively high educational spending, including three–Perry County in Alabama, St. Francis County in Arkansas, and Conecuh County in Alabama–where a majority of households lack digital access but educational spending is above average. In all seven counties, a single institution drove the results.
As we looked more closely at low-spending institutions in counties with low digital access, we were encouraged by institutions that have found workable solutions to support their students. For example, Amarillo College, a community college located in Potter County, Texas, where only 63 percent of households have a desktop or laptop and 57 percent have broadband Internet, enrolls predominantly low-income, first-generation, and minority students. In the 2017-18 academic year, it spent only $11,952 on education and related expenses per FTE student, nearly $3,500 less than the $15,285 across all public institutions in our sample. Yet, it provides its student body a robust set of wraparound services, and has added, along with other digital resources, Wi-Fi hotspots in campus parking lots to enable students to access the Internet. Caldwell Community College and Technical Institute (Caldwell County, NC) is another example of a community college with relatively low spending located in a county where about a third of households lack a laptop or desktop and a third lack broadband Internet. In response to the pandemic, Caldwell recently expanded its partnership with Google to provide Chromebooks to students and install additional Wi-Fi hotspots on buses and place them in remote areas of the county.
As the COVID-19 pandemic continues, and “safer at home” requirements remain in place, institutions have started to plan for upcoming terms. Many schools and systems have announced that all Summer 2020 courses will be online, and at least one, Cal State Fullerton, has already begun making plans for Fall 2020 courses to be virtual as well. Institutions, especially those that do not collect information on students’ at-home digital access, should make efforts to understand the size and scope of the digital divide at their institution by identifying, potentially through the deployment of a survey, enrolled students who lack access, strategizing ways to address their need, and developing plans and possibly partnerships to fund those strategies.
The authors are grateful to David Troutman from the University of Texas System for inspiring this analysis.
Endnotes
- We considered analyzing household-level ACS data to calculate county-level results, but about 40 percent of households in the dataset did not have county data because of rules that prohibit the U.S. government from releasing personally identifiable information. ↑
- Broadband is widely considered the fastest and most reliable, and is likely needed to ensure that students can consistently run video conferencing software and other tools with minimal disruption. ↑
- Only accredited, degree-granting institutions located in the United States that have a student body in which at least 50 percent of FTE students are undergraduates were included. Tribal colleges and institutions that don’t participate in Title IV federal financial aid programs were excluded. ↑
- We replicated as best we could the Delta Cost Project’s education and related spending per student metric. IPEDS recently made changes to its finance surveys in how it classifies expenses associated with operation and maintenance (O&M) of plant, so we used a slightly modified version that excludes O&M. ↑
- For laptop or desktop computer: r=0.30, n=1,030, p<0.0001; for broadband Internet: 0.26, n=1,030, p<0.0001 ↑
- For laptop or desktop computer: r=0.11, n=800, p=0.002; for broadband Internet: 0.08, n=800, p=.02 ↑