Veterans Enrollment: What Do the Data Show?
In 2019, Ithaka S+R published a paper discussing the underrepresentation of student veterans at high-graduation-rate institutions and outlining the various barriers—ranging from financial aid policies to transfer credit limitations—that prevent veterans from enrolling in such institutions. As we explained in that paper, these barriers partly explain why, as of 2015-16, only one in 10 veterans using GI Bill benefits were enrolling at institutions with graduation rates above 70 percent, while approximately one-third of veterans were using GI Bill benefits to attend for-profit institutions—schools with relatively low graduation rates.
Since we published the paper, the enrollment landscape for veterans has significantly changed. First, the COVID pandemic changed college-going decisions for many students, especially those from underrepresented backgrounds, which led to a serious decline in enrollment at community colleges nationwide. At the same time, institutions have been preparing for a “demographic cliff” in traditional 18-year old high school graduates by looking for new pipelines of students. And in March 2021, Congress closed the “90-10 loophole,” which significantly weakened the financial incentives for for-profit institutions to heavily recruit student veterans.[1]
In light of this evolving landscape, we asked ourselves, have the patterns in student veterans’ enrollment changed since our last analysis? In short, yes.
Data Availability
The most comprehensive national data on veteran use of GI Bill educational benefits come from the US Department of Veterans Affairs. These data include both veterans and their dependants, who are also eligible for educational benefits, and include students pursuing both undergraduate and graduate degrees. However, the data do not distinguish between these subgroups, which would be necessary to look specifically at trends in undergraduate veteran students. Despite this limitation, these are the best data to compare enrollments across higher education sectors, which we do in Figures 1, 2 and 3 below.[2] We also report on veterans enrollment data submitted directly to Ithaka S+R from a select set of institutions that are members of the American Talent Initiative (Figure 4 below). Other sources, like Wick Sloane’s annual survey and reports from organizations like Student Veterans of America, the Postsecondary National Policy Institute, and the US Chamber of Commerce add helpful context.
Findings
National Distribution
Only one in three veterans have at least a bachelor’s degree, an attainment rate lower than the national population age 25 and older. Yet, over half of respondents (53 percent) to a survey of active duty, reservists, National Guard, and veterans, launched by Syracuse’s Institute for Veterans and Military Families, indicated that “educational benefits” were the reason they entered military service. If the bachelor’s attainment rate for US veterans increased to 53 percent from its current 31 percent, that would mean an additional 3.6 million veterans would have a bachelor’s degree (of 16.5 million veterans in the country).
Veterans have a great diversity of perspectives and experiences and come from more diverse socioeconomic and racial backgrounds, relative to the typical high school graduate who enrolls directly in college. Demographic data on US veterans demonstrate that the share of post-9/11 veterans who are Black outpaces the share of the overall US population who are Black. At four-year institutions, compared to students who are not veterans, students who are veterans are more likely to be older, Black, Hispanic, and first-generation. For institutions looking to expand their pipelines and diversify their student bodies, student veterans are an important population to consider.
Despite the many reasons to consider enrolling a veteran, GI Bill benefit usage is declining overall. The VA reports that the number of Post-9/11 GI Bill beneficiaries (which is not the only benefit program from the VA, but currently the most utilized) has declined fairly steadily since 2016 (See Figure 1). The decline accelerated between 2019-2021 (14.6 percent) relative to 2016-2018 (10.4 percent decline), suggesting that the COVID-19 pandemic negatively affected benefit uptake just like it negatively affected higher education enrollment overall.
Figure 1: Post-9/11 GI Bill Users by Fiscal Year[3]
| 2016 | 2017 | 2018 | 2019 | 2020 | 2021 |
|---|---|---|---|---|---|
| 790,090 | 755,476 | 708,069 | 714,346 | 657,928 | 610,009 |
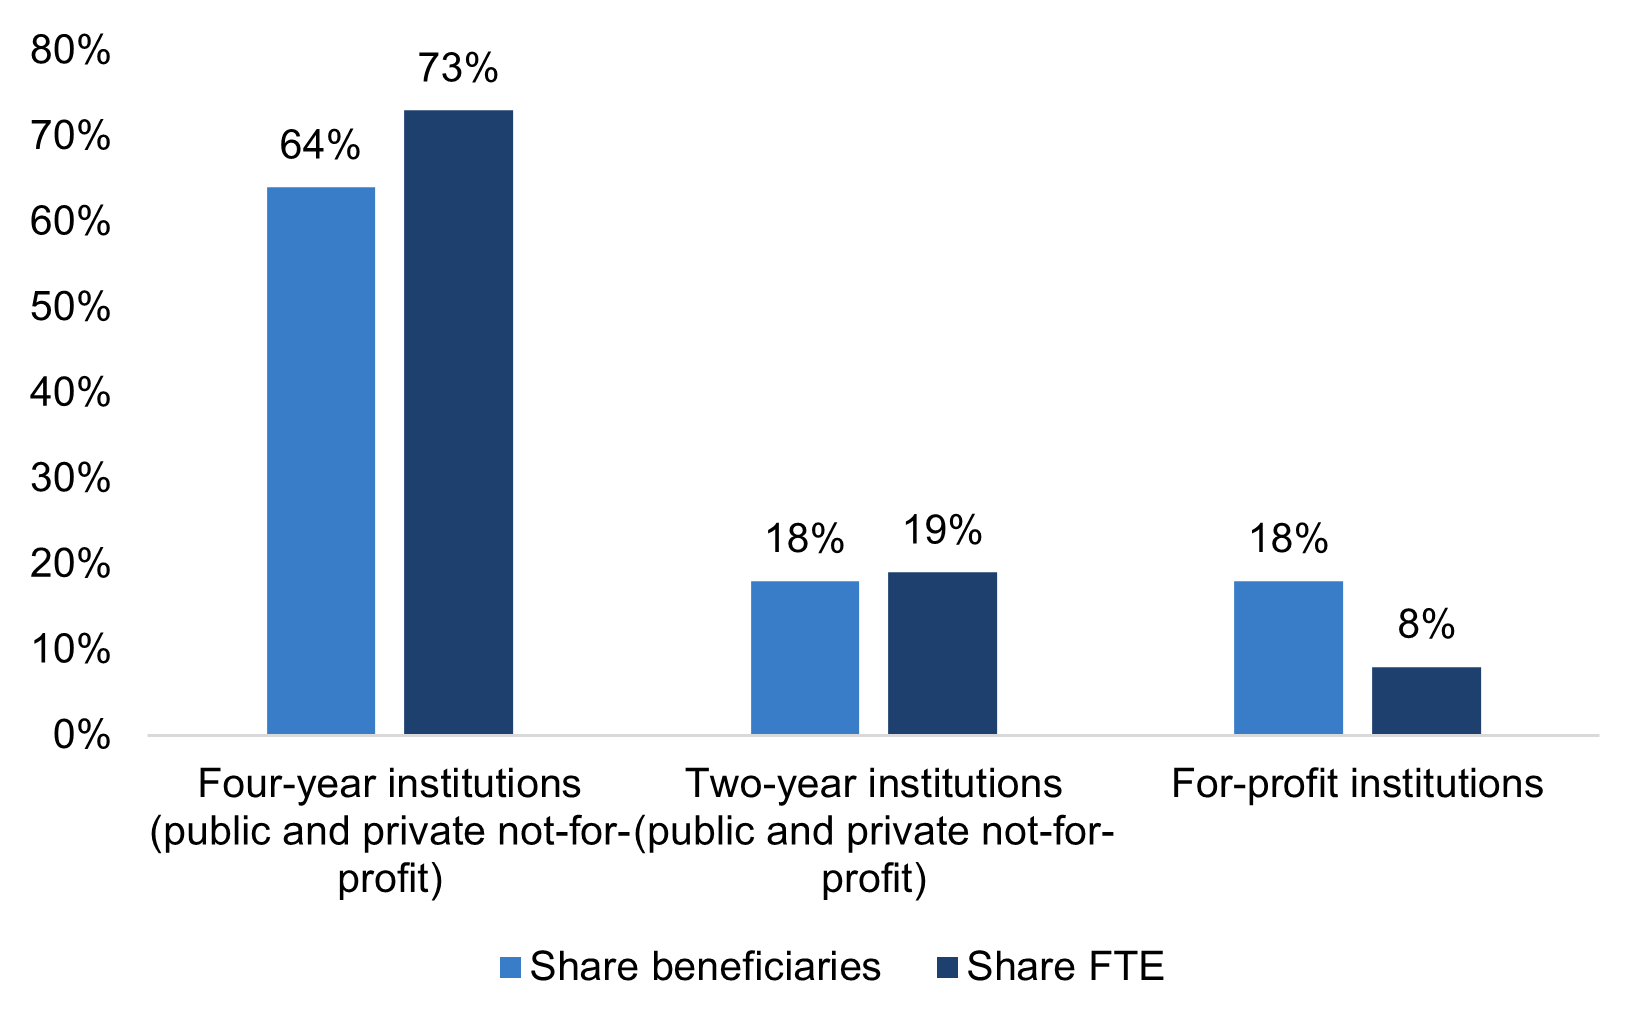
The VA’s data also allow for exploration of where GI Bill beneficiaries enroll. Figure 2 updates the analysis from our prior report, showing that the distribution of beneficiaries enrolled across sectors has shifted. In 2020-21, 18 percent of beneficiaries enrolled in for-profit institutions, down from 24 percent in 2015-16. Beneficiaries are now more likely to enroll in four-year public and not-for-profit institutions than in 2015-16, up to 64 percent of beneficiaries in 2020-21 compared to 47 percent in 2015-16. This rate is now closer to the enrollment rate at four-year publics and not-for-profits for all enrolled students than it used to be. The shift in beneficiaries’ enrollment away from for-profits is even greater than enrollment shifts amongst all students—the for-profit enrollment share amongst all students held steady at 8 percent between 2015-16 and 2020-21. We do not know the extent to which these shifts are the result of selection effects (veteran students mostly likely to enroll in for-profit institutions were also those less likely to use their GI Bill benefits or were most affected by COVID-19) or the result of meaningful shifts in enrollment behavior amongst student veterans and the institutions that recruit them.
Figure 2: Distribution of Enrollment by Sector, 2020-21
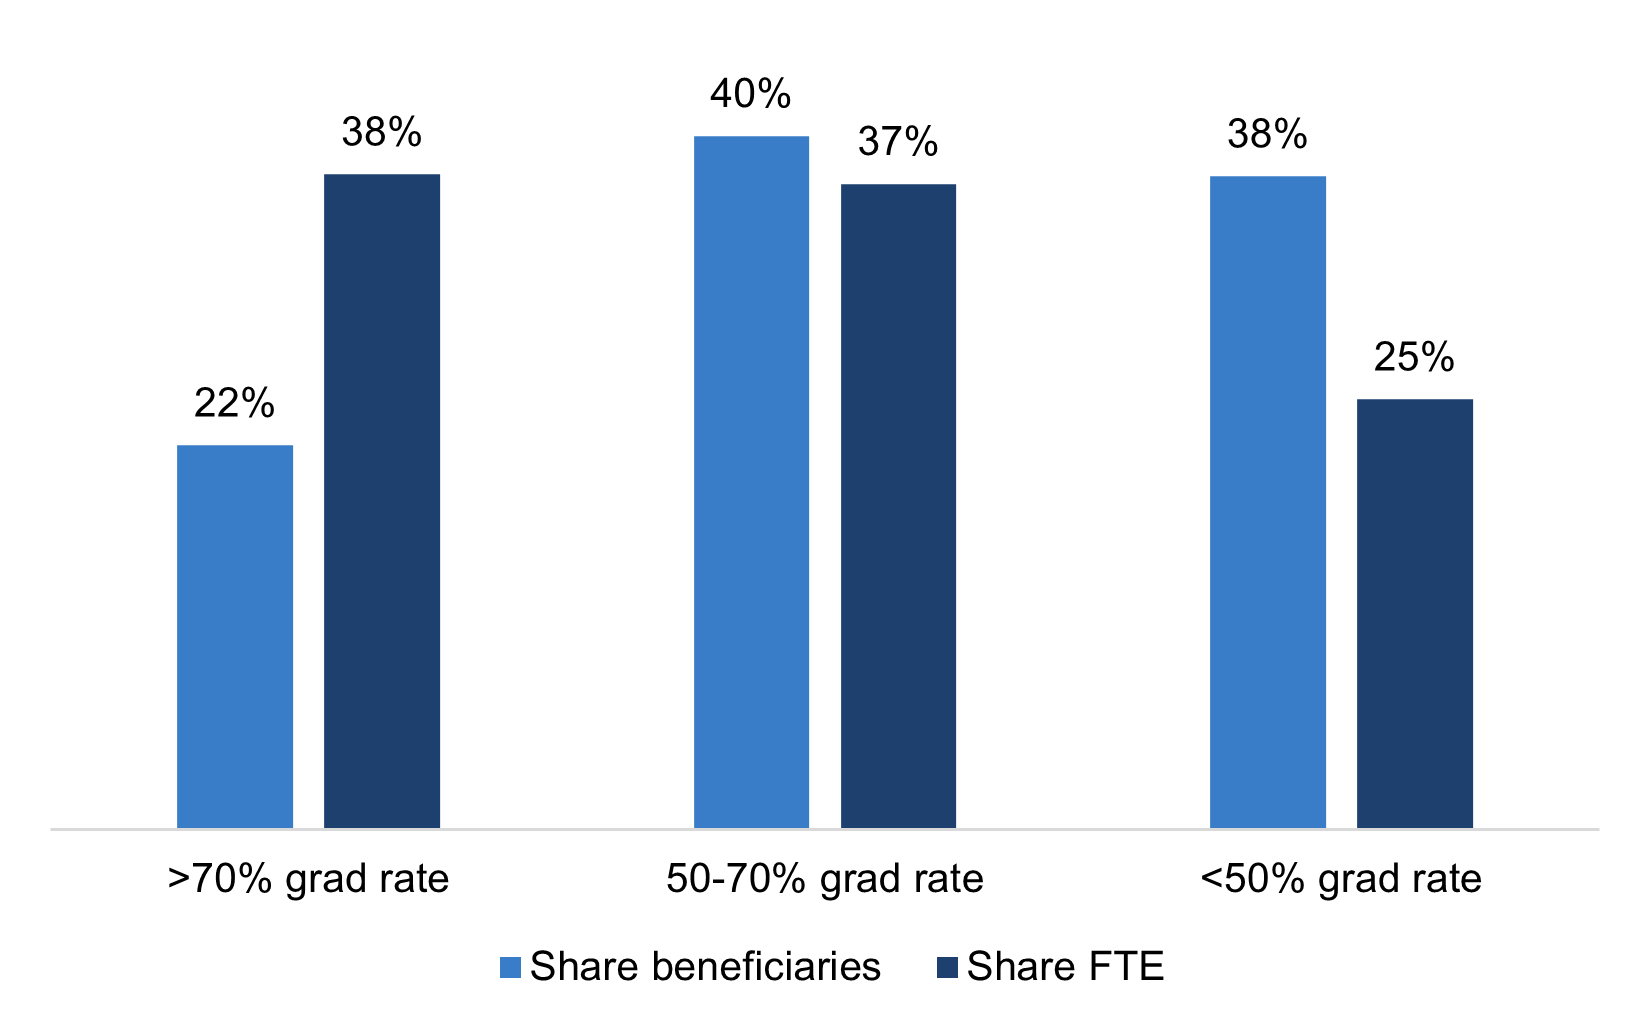
Narrowing the gap in four-year public and not-for-profit enrollment rates between student veterans and all students is certainly a positive development in improving access and opportunity for veteran students. However, graduation rates vary widely at four-year public and private not-for-profit institutions, so if veterans are more likely to enroll at four-year institutions with relatively low graduation rates, they may still be less likely to earn a degree than the typical student. In Figure 3, data show that GI Bill beneficiaries are still underrepresented at the institutions with graduation rates above 70 percent (22 percent of veteran enrollment, compared to 38 percent of all students) and overrepresented at institutions with graduation rates below 50 percent. One positive update in this analysis, compared with our prior report, is that both GI Bill beneficiaries and students overall are enrolling at institutions with higher graduation rates (also reflecting a national trend of increasing graduation rates). The share of GI Bill beneficiary enrollments at institutions with graduation rates above 70 percent has more than doubled (10 percent in our prior report to 22 percent here), which is more substantial growth than student enrollments overall (which shifted from 21 percent in our prior report to 38 percent here).
Figure 3: Distribution of Enrollment by Graduation Rate for Four-Year Public and Private Not-for-profits, 2020-21
ATI Member Institution Data
Thirty ATI member colleges and universities have submitted data on veteran enrollment. These institutions all self-selected into a community of practice focused on veterans enrollment, but they are in very different stages of enrolling veterans (for example, the participating institution with the fewest veterans enrolled has zero and the institution with the most has 699). Unlike the publicly available data, these data focus solely on undergraduate veterans, not graduate students or dependents (although we do include full- and part-time students in these counts).
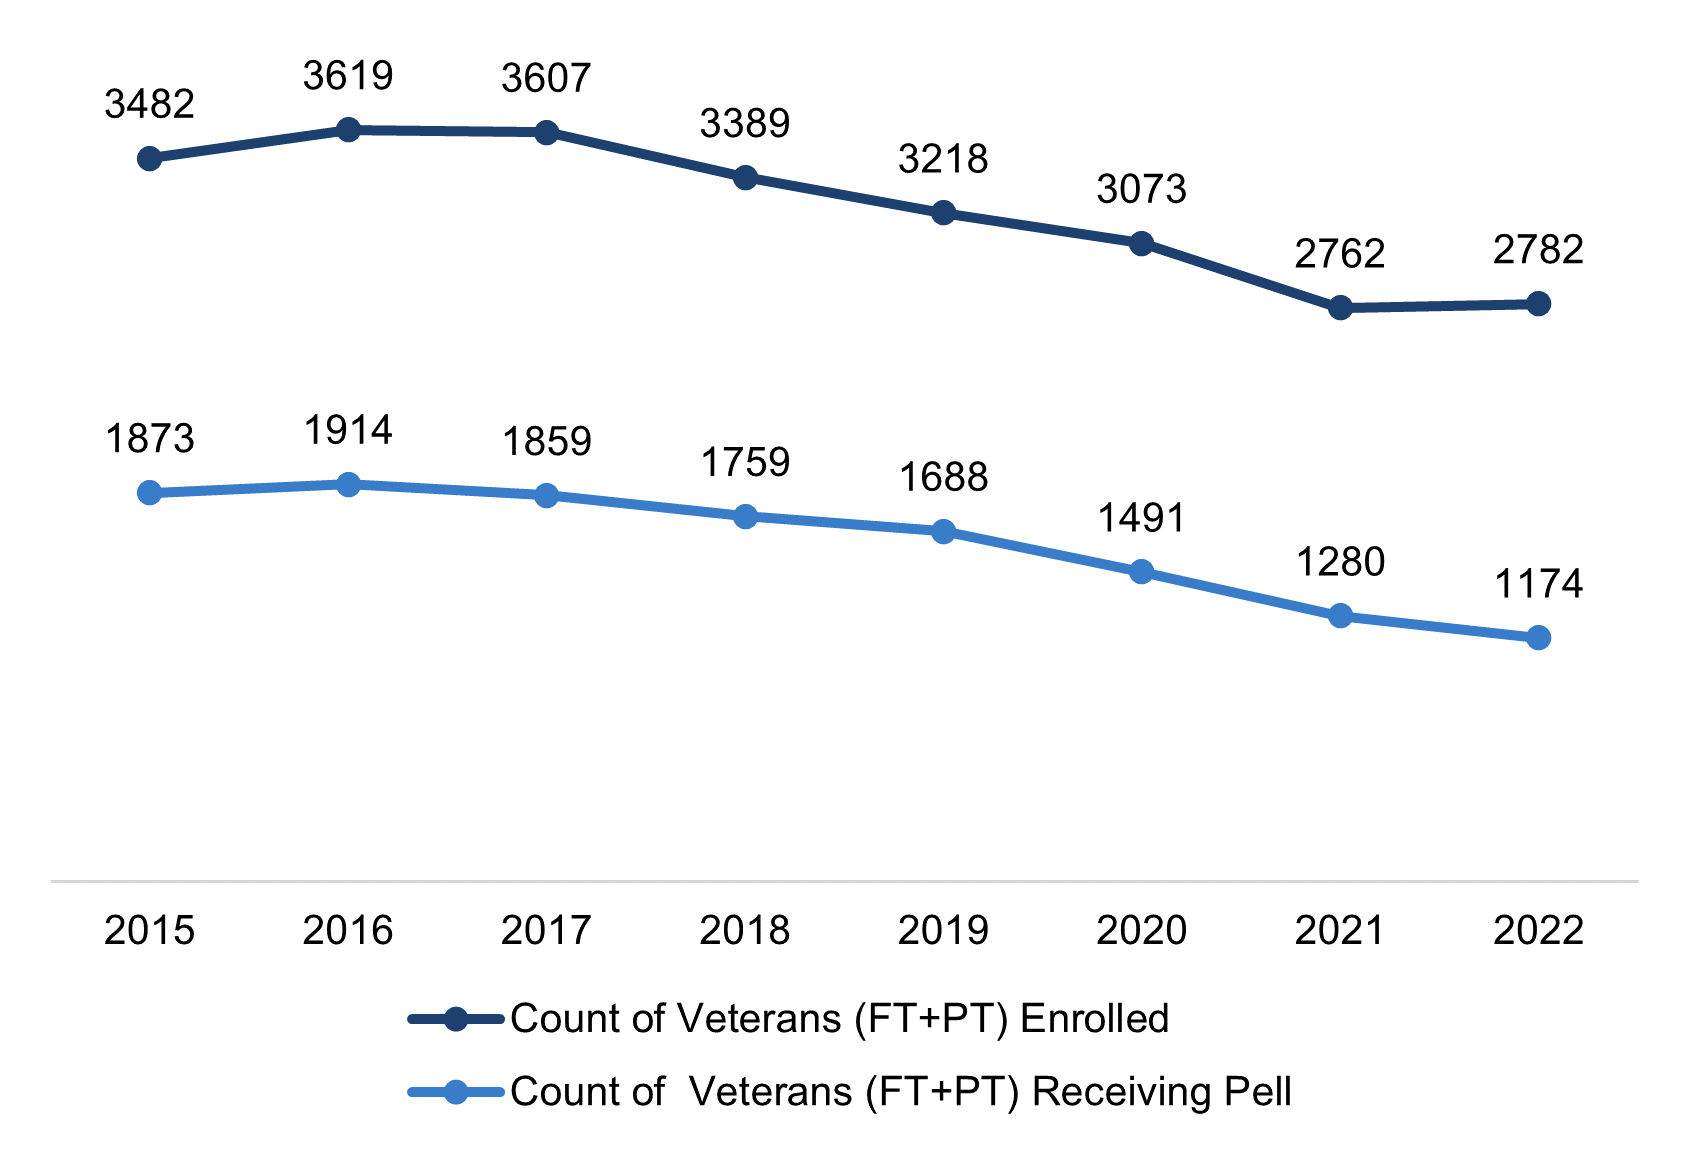
The data in Figure 4 show veterans’ enrollment and the share of those veterans who were Pell Grant recipients from 2015-2022 for the 30 ATI Institutions. Aligned with the decreasing GI Bill usage mentioned above, Figure 4 shows that, at these institutions, the aggregate number of enrolled veterans, including those receiving Pell Grants, began a steady annual decrease starting in 2016. For veterans as a whole, the counts begin to slowly rebound in 2022, but for student veterans who also receive Pell grants, declines continue through 2022 (although at a slower rate than in the prior year). This may be due to the impacts of the pandemic, which disproportionately affected lower-income students. Despite this decline in aggregate veteran enrollment counts, about half of the ATI institutions continued to add veteran enrollments in this time period, as shown in the examples below.
Figure 4. Total Full-Time and Part-Time Veteran Enrollment for Select ATI Institutions, 2015-2022
- The University of North Carolina – Chapel Hill has had large increases in total full-time and part-time veteran enrollment from 2015-2022. First, enrollment increased from 88 to 111 veterans between the years of 2016 and 2017, an increase of 26.1 percent. After maintaining fairly consistent enrollment of veterans for five years, the university’s total veteran enrollment increased substantially to 206 in 2022, an increase of 134 percent since 2016.
- Princeton University also reported a substantial increase in full-time and part-time veteran enrollment during this time period. Beginning with only one veteran enrolled in 2015, Princeton enrolled 24 veterans in 2020 and increased that number to 40 veterans enrolled in 2022, an increase of 66.7 percent over those two years.
- Finally, in additional analysis of other military-connected students on campus, which is not depicted in the figures above, the University of Illinois at Urbana-Champaign (UIUC) showed a notable increase in the number of students identifying as part of the Reserves/National Guard. In 2015, 50 students at UIUC identified as having affiliation with Reserves or the National Guard; in 2022 the number had increased to 122, an increase of 144 percent.
Conclusion
While the enrollment landscape for veterans has continued to evolve, the data show that underrepresentation of veterans at the institutions where they are most likely to graduate, and an overrepresentation of veterans at institutions where they have the least chance of graduating, still persists. As institutions look to rebound from the COVID pandemic, address the looming “demographic cliff,” and meet diversity goals, a focus on increasing enrollment and success for veterans is still important to consider. In future blog posts, we will delve into the barriers preventing a greater share of veterans from enrolling in high-graduation rate colleges and universities and strategies to overcome these roadblocks.
Notes
- The data analyzed for this publication likely do not capture the true impact of this change, since the rules did not go into effect until January 2023. However, it is possible that the messaging may have had some preliminary impact. ↑
- These data report beneficiaries who received GI Bill benefits by type of program over time, as well as beneficiaries by institution. The institution-level data are as of October 2021 and defined as from the “last calendar year.” We are not clear on the exact timeline, but utilize 2020-21 as a close approximation. The IPEDS FTE data we compare to are from the 2020-21 academic year. Note that in our 2019 analyses, we also utilized data from this source (https://news.va.gov/press-room/va-expands-transparency-efforts-of-institutions-receiving-gi-bill-payments/), but that source has not been updated since that 2019 analysis, so we did not use it here. ↑
- Sources: https://www.benefits.va.gov/REPORTS/abr/docs/2020_education.pdf, https://www.benefits.va.gov/REPORTS/abr/docs/2021_education.pdf ↑