A*CENSUS II All Archivists Survey Report
Executive Summary
Five thousand, six hundred and ninety-nine archivists and memory workers across the United States took the time to share their experiences within the archives profession by completing the A*CENSUS II All Archivists Survey. The All Archivists Survey, fielded 17 years after the original A*CENSUS collected foundational data for the field, provides a measure of how far the field has come in nearly two decades as well as introduces new or expanded areas of exploration, including sections on diversity, equity, inclusion, and accessibility, community archives, and student loan debt.
This report shares findings on the current employment, education, and demographic characteristics of archivists and memory workers. It examines their perspectives and experiences on topics including job placement, salaries, sector differences, attrition, and key issues in the field. Further, it compares demographic data across time, with a particular focus on how the distribution of race/ethnicity and gender has changed since the original A*CENSUS in 2004.
A*CENSUS II demonstrates the power of collaboration across the archives profession. In addition to the 5,699 individuals who responded to the All Archivists Survey, the project was made possible through the volunteer work of a dedicated project team, working group, and several partner organizations. This research study is funded by the Institution for Museum and Library Services (IMLS) and was jointly developed by the Society of American Archivists, Ithaka S+R, and the A*CENSUS II working group, whose members represent diverse sectors and roles within the archives profession.
It is our hope that the findings in this first report be shared widely and freely with the archives community so that they may be leveraged to positively impact the profession. The data may be used in myriad ways, from workforce planning, to diversifying the profession, increasing funding, to advocating for resources, to meeting professional development needs. Here we highlight the most striking key findings from the All Archivists Survey:
- The large majority (81 percent) of respondents are employed full-time and 9 percent are employed part-time. Eighty-nine percent of employed respondents are in permanent roles, and 71 percent of respondents in permanent roles are salaried.
- The MLS/MLIS degree has risen in importance in the archives profession while also being more likely to result in student loan debt. The proportion of MLS/MLIS degree holders increased 52 percent since 2004, representing the highest increase of any degree-type. Simultaneously, respondents with an MLS/MLIS degree are more likely to graduate with student loan debt compared with respondents graduating with other degrees, including those with a comparable degree such as an MA/MS/MFA.
- The proportion of BIPOC individuals in the archives profession has doubled since 2004. While the overwhelming majority of the archives profession is White and BIPOC respondents continue to be underrepresented in the archives profession, the proportion of BIPOC respondents doubled from 8 percent in 2004 to 16 percent in 2021.
- One in five respondents are considering leaving the archives profession within the next five years. An additional one in four respondents are not sure if they will stay or leave. Of the 20 percent of respondents planning to leave, the top three reasons are retirement, burnout, and limited compensation/salary or better compensation/salary elsewhere.
- The majority (61 percent) of respondents employed full-time make between $40,000 and $79,999 annually. The majority (69 percent) of respondents employed part-time make $29,999 or less each year.
- Approximately one in four respondents do not believe decisions related to salary, promotion, and hiring are equitable. And nearly four times as many respondents disagree that the archives profession has adequately addressed issues of diversity, equity, inclusion, and access than respondents who agree.
- While diversity, equity, inclusion, and accessibility goals have not yet been achieved in the archives profession, there is encouraging evidence that steps are being taken to reach them. Half of all respondents have witnessed others taking action to improve diversity, equity, inclusion, and accessibility in the archives profession.
- The top three challenges community archives face are funding, collection storage space, and generating awareness of the archives. Respondents, including both those who do and do not work in community archives, are relatively split on whether the challenges and opportunities in community archives are similar to the challenges and opportunities in traditional archives. Fifteen percent of respondents agree that they are similar while 18 percent disagree.
- The archives profession is highly educated. The overwhelming majority (86 percent) of respondents have an advanced degree. And more than one in four (27 percent) have two or more advanced degrees.
- The archives profession has become more women-dominated over time. Since 2004, the proportion of women in the archives profession has increased from 65 percent to 71 percent, representing a 6 percentage point increase. Conversely, the proportion of men in the archives profession has decreased by 11 percentage points, dropping from 34 percent in 2004 to 23 percent in 2021.
Introduction
The A*CENSUS II All Archivists Survey is the only national survey of individual archivists and memory workers in the US that has been fielded in the past 17 years. This census was administered in 2021 and builds on the foundation of the first A*CENSUS, which collected data for the archives profession in 2004. Five thousand, six hundred and ninety-nine individuals in the archives profession completed the All Archivists Survey in order to provide insight into their experiences within the archives profession. By sharing their experiences and perspectives, survey participants have created a strong dataset representative of the archives community.
The All Archivists Survey expands upon the first A*CENSUS by including new areas of exploration, including diversity, equity, inclusion, and accessibility, community archives, and student loan debt. This survey gathered data on key topics such as employment, salaries, educational background, and demographics as well as job placement, sector characteristics, attrition, and individual perspectives on key issues in the field. Importantly, the data collected in the survey also allows us to summarize changes in the demographic composition of the archival profession across time, with a particular focus on race/ethnicity and gender.
The findings brought forth from the All Archivists Survey can be leveraged across the field in myriad ways. The data provides evidence that can assist with workforce planning, benchmarking against peer institutions, advocating for resources, and diversifying the profession, among others. This report on the A*CENSUS II All Archivists Survey is the first of two A*CENSUS reports. Results from the second A*CENSUS II survey, the Archives Administrators Survey, will be published in the coming months. It is our hope that the data in this report be shared widely and freely with the archives community so that it may positively impact the profession.
Methodology
Survey Instrument Development
The first A*CENSUS, administered in 2004, provided the foundation for the A*CENSUS II All Archivists Survey. Through an iterative process, the project team and working group provided guidance and input on themes and issues important to the archives profession in the US. Based on this process, the A*CENSUS II All Archivists Survey expanded or added new sections to the survey instrument on topics including diversity, equity, inclusion, and accessibility, community archives, and student loan debt. As new questions were added to the survey instrument, other questions were retired.
After the survey instrument was drafted, it went through an extensive review process that included gathering feedback from the project team and working group and updating the survey draft. In a final review process, the survey was tested through cognitive interviews with 16 individuals representing different sectors (e.g. academic institutions, government agencies, nonprofit organizations, for-profit organizations, community archives) points in career (e.g. student, early-, mid-, late- career, and retired) and levels of seniority (e.g. individual contributor, manager/supervisor, senior administrator) within the archives profession. The cognitive interviews provided further feedback that strengthened the survey instrument. The final survey instrument was administered through the Qualtrics platform and included survey logic that activated depending on individual responses to specific questions. Additionally, answers to survey questions without a natural order were randomized to eliminate order bias.
Population and Distribution
The A*CENSUS II All Archivists Survey population includes all archivists, memory workers, and every person in the US who works with archival materials in any capacity, regardless of employment status or title. In order to obtain the broadest possible response, we constructed a two-pronged outreach approach.
First, the Society of American Archivists collaboratively generated an invitation list through the help of a number of partner organizations. This list was cleaned and deduped and ultimately resulted in 44,884 distinct emails, which received the initial invitation. Of the 44,884 email invitations, 5,401 bounced or failed, bringing the updated sample to 39,483.
Second, since our goal was to reach as many archivists, memory workers, and individuals working with archival materials in the US as possible, we created and distributed open-access links to the survey questionnaire. These links were widely publicized on social media platforms such as Twitter, Facebook, and LinkedIn by SAA, Ithaka S+R, the working group, and partner organizations. Some partner organizations, who were not able to participate in building the direct invitation list, generously helped promote the All Archivists Survey by publicizing an open-access link through their membership channels as well. All partner organizations participated in publicizing open-access links through social media channels.
Data gathered through both the direct email invitations and the open-access links is completely anonymous. Names and email addresses were used for the purposes of distribution of the survey only and are not linked to survey responses. Survey platform settings automatically removed names and email addresses before creating the resulting dataset, so at no point was personally identifiable data attached to survey responses. Neither researchers at Ithaka S+R nor project leads at SAA have access to survey responses that are linked to names or email addresses.
The survey launched on October 19, 2021, and closed December 13, 2021.
Participation
Of the 39,483 people who received survey invitations through direct email, 4,362 completed the survey. In addition to these responses, 1,348 individuals completed the survey via an open-access link, providing a combined total of 5,710 responses. After the data was cleaned, the final sample resulted in 5,699 valid, complete responses. Due to the nature of open-access links (i.e., since it is unknown how many archivists, memory workers, and persons who work with archival materials saw the open-access link and chose not to take the survey) it is not possible to calculate a response rate for the full sample of survey respondents.
The majority of All Archivists Survey respondents are White (84 percent), employed full-time (81 percent), women (71 percent), and straight/heterosexual (69 percent). The report and accompanying graphs and tables relay other demographic and employment characteristics in detail.
Data Analysis and Reporting
This report contains aggregate and stratified findings from the All Archivists Survey. We analyzed the findings using frequency and descriptive analyses. For questions where respondents were directed to generate a number (e.g. At what age did you retire?), we used the average (median) and used frequencies for all other questions. In figures, either we include all answer options, the top options, or, for figures relying on Likert scales, we include the high and low end of the scales used. For example, in a 7 point agreement Likert scale, we combine “Agree” and “Strongly agree” to indicate agreement and “Disagree” and “Strongly disagree” to indicate disagreement.
Percentages are rounded to the nearest whole number throughout the report; due to this, figure percentages may not add up to 100 percent and answer options with very low selection rates may round down to 0 percent. For unrounded percentages, see the aggregate tables in the appendix.
In order to protect the anonymity of survey participants when stratifying the data, categories with a low number (defined as having an n of 30 or less) were rolled up or removed. This approach mitigates the risk of re-identification by ensuring no individual participant can be recognized by their responses.
Given the length of time that passed from the administration of the first A*CENSUS (17 years), the language or answer choices of many survey questions have changed, making comparison across time difficult. However, there are several questions from the first A*CENSUS that were brought forward intact, or with minimal changes, which allow data to be analyzed over time. To that end, in some instances we have included frequencies over time in this report in order to see how the archives profession has changed or stayed the same since the first A*CENSUS in 2004. Additionally, in keeping with the methodology of the original A*CENSUS, retired individuals were directed to answer employment questions from the vantage of their last position.
The A*CENSUS II dataset will be deposited with the SAA Dataverse for long-term preservation and access. The Society of American Archivists is committed to encouraging and supporting archivists, students, and scholars to use and leverage the A*CENSUS II data in myriad ways to benefit the profession. The data can be used to create evidence-based and strategic action in a variety of ways from workforce planning to advocating for resources to benchmarking against peers to continuing education.
Collaboration
This research study was led by the project team, who guided the survey development process, facilitated working group meetings, created partner organization relationships, established subcommittees, shared and promoted content, and provided feedback on the analysis and accompanying report. The members of the project team are:
- Jacqualine Price Osafo, Executive Director, Society of American Archivists
- Beth Myers, Director of Special Collections, Smith College
- Rachel Vagts, Special Collections and Digital Archives Manager, Denver Public Library
- Makala Skinner, Senior Surveys Analyst, Ithaka S+R
Earlier members of the Project Team included:
- Nancy Beaumont, Former Executive Director, Society of American Archivists
- Christine Wolff-Eisenberg, Former Manager, Surveys and Research, Ithaka S+R
The A*CENSUS II working group provided guidance and feedback on this research study by reviewing and discussing previous survey instruments and findings to determine what information should be captured to enable longitudinal analyses, identifying new areas of interest to incorporate into the survey, developing thematic areas of interest for a new survey of archival institutions, and assisting in identification of groups and institutions that should be invited to participate in the survey. Through several discussion and playback sessions, the working group helped determine the scope of and themes included in the survey instrument, provided feedback at key stages of the process, and mobilized their networks to participate in the All Archivists Survey. The members of the A*CENSUS II working group are:
- Cheryl Beredo, Schomburg Center for Research in Black Culture, New York Public Library
- Paul Conway, University of Michigan
- Meredith Evans, Jimmy Carter Presidential Library and Museum
- Jennifer Johnson, Cargill Incorporated
- Meredith Lowe, University of Wisconsin-Madison
- Jamie Martin, IBM Corporation Archives
- Greta Pittenger, National Public Radio
- Aaron Ramirez, Pueblo City-County Library District
- Tom Ruller, New York State Archives
- Gayle Schechter, Council on Library and Information Resources
- Erin Passehl Stoddart, Michigan State University
- Audra Eagle Yun, University of California, Irvine Special Collections & Archives
Partner organizations across the profession generously helped to promote the A*CENSUS II All Archivists Survey through their membership and social media channels to ensure the survey reached the widest possible audience. The groups that make up the partner organizations are:
- Academy of Certified Archivists
- American Association for State and Local History
- Arizona Archives Alliance
- Association for the Study of African American Life and History
- Association of Catholic Diocesan Archivists
- Association of Hawai’i Archivists
- Association of Moving Image Archivists
- Association of St Louis Area Archivists
- Association of Tribal Archives, Libraries, and Museums
- Chicago Area Archivists
- Conference of Inter-Mountain Archivists
- Council of State Archivists
- Delaware Valley Archivists Group
- Kentucky Council on Archives
- Los Angeles Archivists Collective
- Louisiana Archives and Manuscripts Association
- Miami Valley Archives Roundtable
- Michigan Archival Association
- Mid-Atlantic Regional Archives Conference
- Midwest Archives Conference
- National Archives and Records Administration
- National Association of Government Archives and Records Administrators
- New England Archivists
- Northwest Archivists
- Rare Books and Manuscripts Section, ACRL Libraries, ALA
- Seattle Area Archivists
- Society of California Archivists
- Society of Florida Archivists
- Society of Georgia Archivists
- Society of Indiana Archivists
- Society of Mississippi Archivists
- Society of North Carolina Archivists
- Society of Ohio Archivists
- Society of Rocky Mountain Archivists
- Society of Southwest Archivists
- Society of Tennessee Archivists
- South Carolina Archival Association
- Twin Cities Archives Roundtable
Survey Findings
Employment Profile
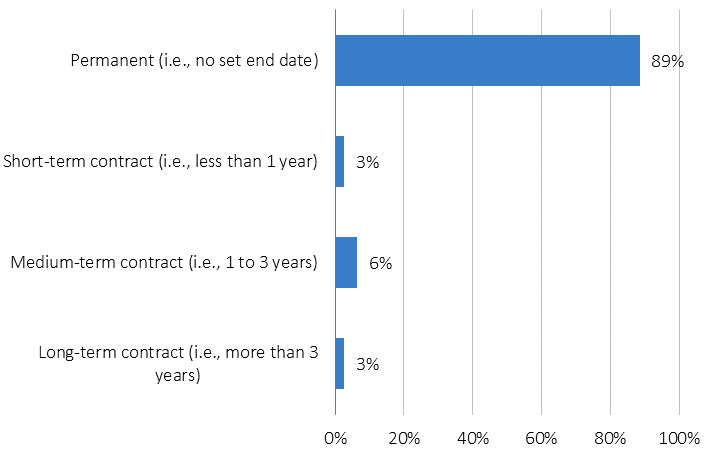
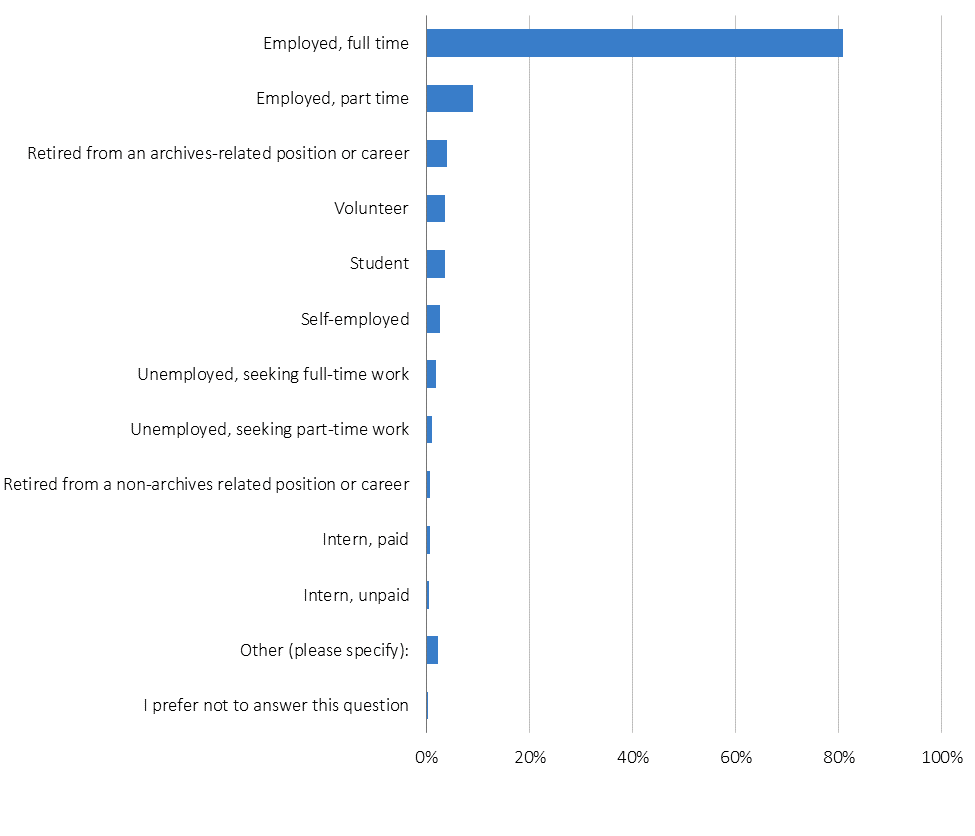
The majority of respondents (81 percent) are employed in full-time positions (see Figure 1), 9 percent are employed in part-time roles, and 4 percent are retired from an archives-related position or career. Of archivists in full time or part-time positions, or who are retired from an archives-related position or career, 89 percent are in permanent roles, while 11 percent are in contract positions (see Figure 2). Of those in permanent positions, 71 percent are salaried. Only 2 percent of those with a full time position also have another paid role, including a part time position, a paid internship, or self-employment.
Figure 1 – Which of the following describes your current employment status? Please select all that apply. Percentage of respondents that selected each item.
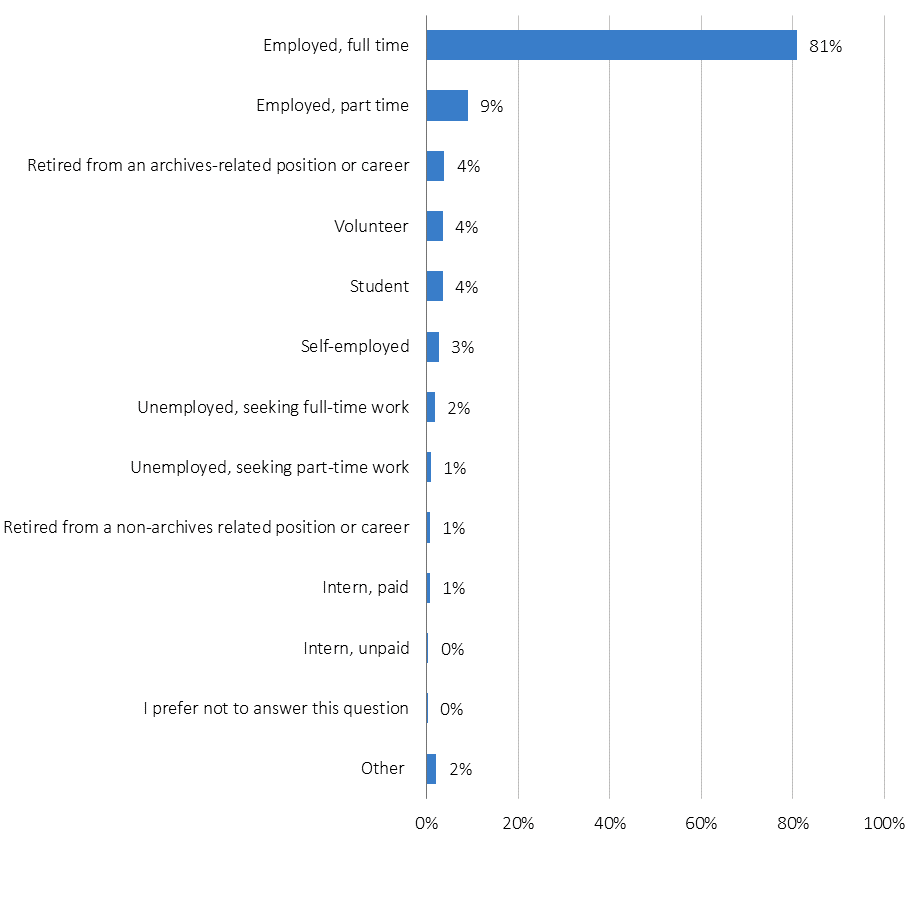
Figure 2 – Which of the following best describes your current job type?
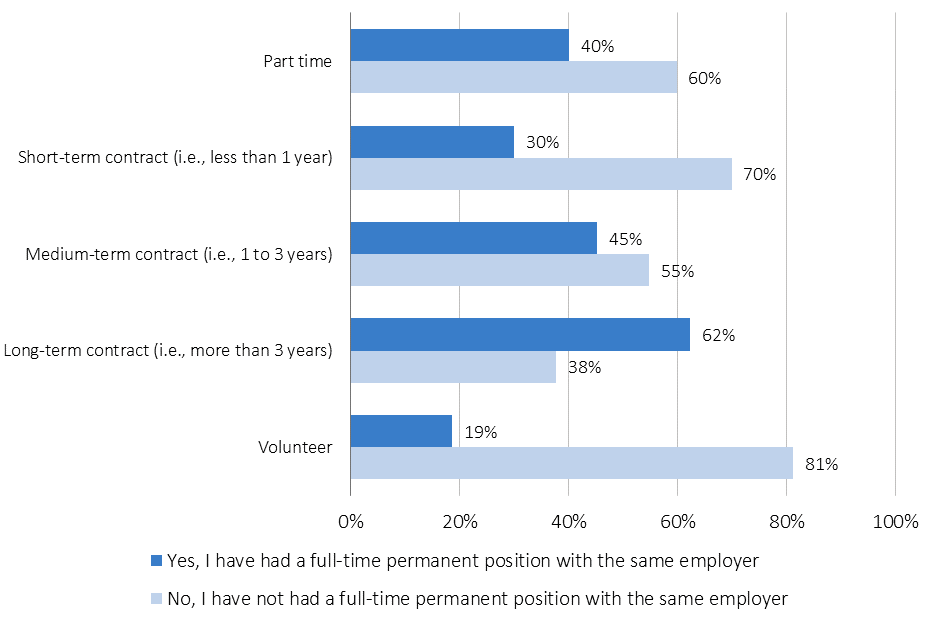
Fifteen percent of respondents in full-time positions held in addition to, or prior to their current role, a part-time position since January 1, 2017 (see Figure 3). Of these respondents, 40 percent ended up with a full-time permanent position with the same employer (see Figure 4). Of the 11 percent of full-time respondents with a short-term contract position since 2017, only 30 percent ended up in a full-time permanent position. The short-term work that was most likely to result in a full-time permanent position was a long-term contract. Though only 3 percent of full-time employees had a long-term contract since 2017, 62 percent of those that did ended up in a full-time permanent position with the same employer. Volunteering was the least likely to result in a full-time permanent position (19 percent).
Figure 3 – You indicated that you are currently in a full-time permanent position. In addition to, or prior to your current position, have you been in any of the following position types in an archives-related position since January 1, 2017? Please select all that apply.
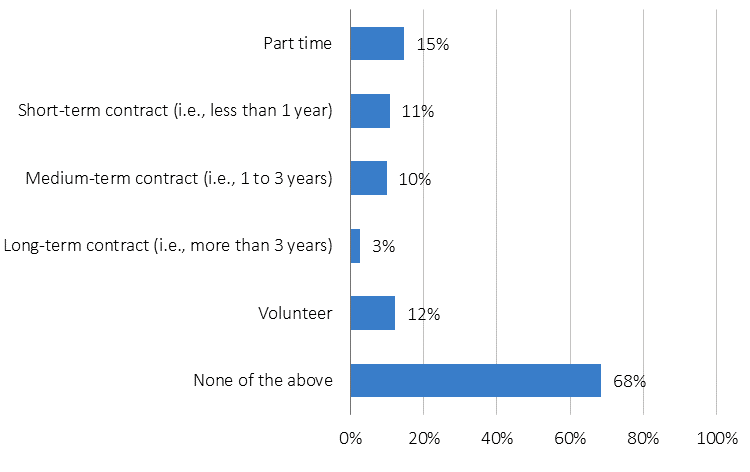
Figure 4 – You indicated that, prior to your current position, you were employed in the following position type(s). At any point during or after your work in that role, have you had a full-time permanent position with the same employer? Percentage of respondents who did and did not have a full-time permanent position with the same employer.
Of all individuals with a part-time position, two-thirds (67 percent) have one part-time position, and 33 percent have two or more part-time positions (see Figure 5).
Figure 5 – You indicated that you are employed part-time. How many part-time positions do you currently hold?

The majority of respondents who are employed in a part-time position (83 percent) did not report having an additional income-generating role, such as a full-time position, a paid internship, or self-employment. Of these respondents, about one third (34 percent) are currently seeking full-time work, while 55 percent are not (see Figure 6).
Figure 6 – You indicated that you are employed part-time. Are you currently seeking full-time work? Percentage of respondents who are solely employed part-time; excluding respondents who have another paid position in addition to their part-time employment.
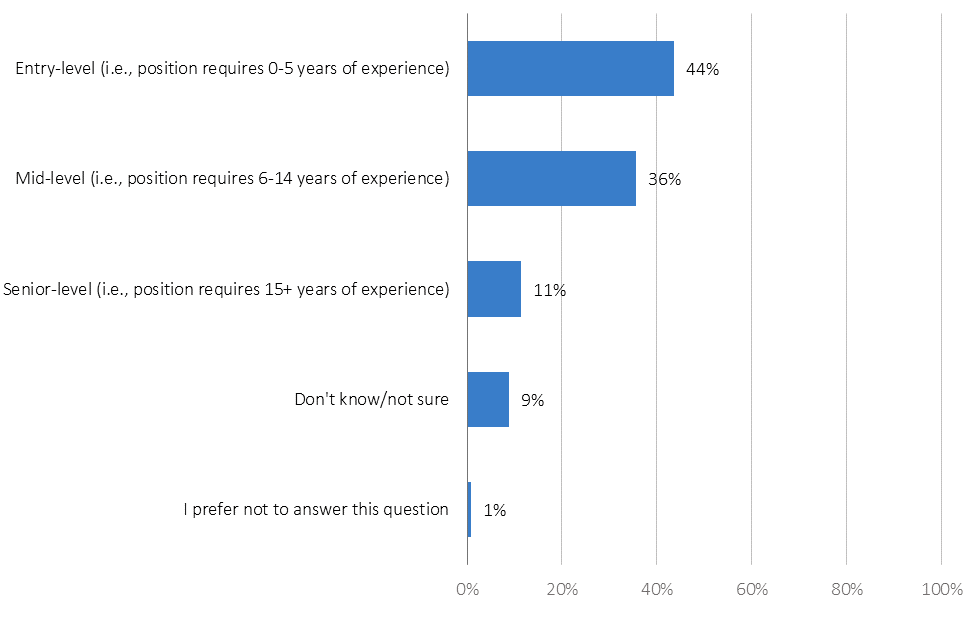
More than half (56 percent) of respondents are in an individual contributor role and a quarter are a manager or supervisor (see Figure 7). Senior administrators or executives make up 17 percent of respondents. Of individual contributors, 44 percent are in an entry-level position requiring five years or less experience and 36 percent are in mid-level roles requiring six to 14 years of experience (see Figure 8). Only 11 percent of individual contributors are in a senior-level position requiring 15 or more years of experience.
Figure 7 – Please select which of the following best describes your current position.
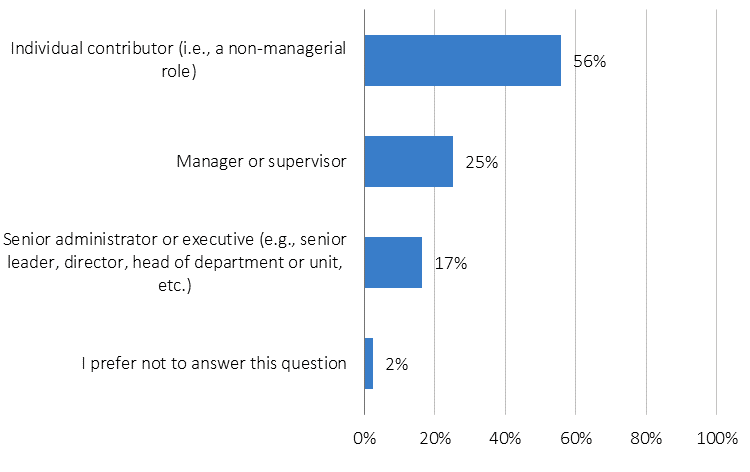
Figure 8 – You indicated that you are an individual contributor (i.e., a non-managerial role). Please select the level of your position.
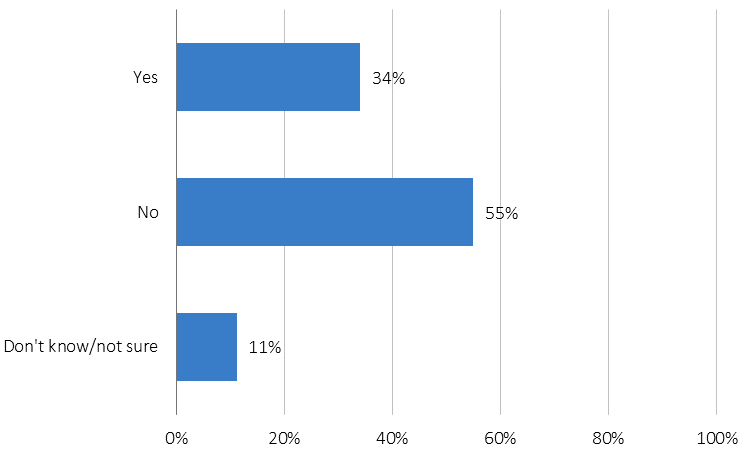
Only 17 percent of respondents are a member of a union compared with 81 percent who are not. Respondents who are not union members are split as to whether they would like to join one. About one third of respondents are interested in becoming a member of a union (33 percent), about one third are not interested (35 percent) and about one third are not sure (32 percent) (see Figure 9).
Figure 9 – Are you interested in becoming a member of a union?

Sector
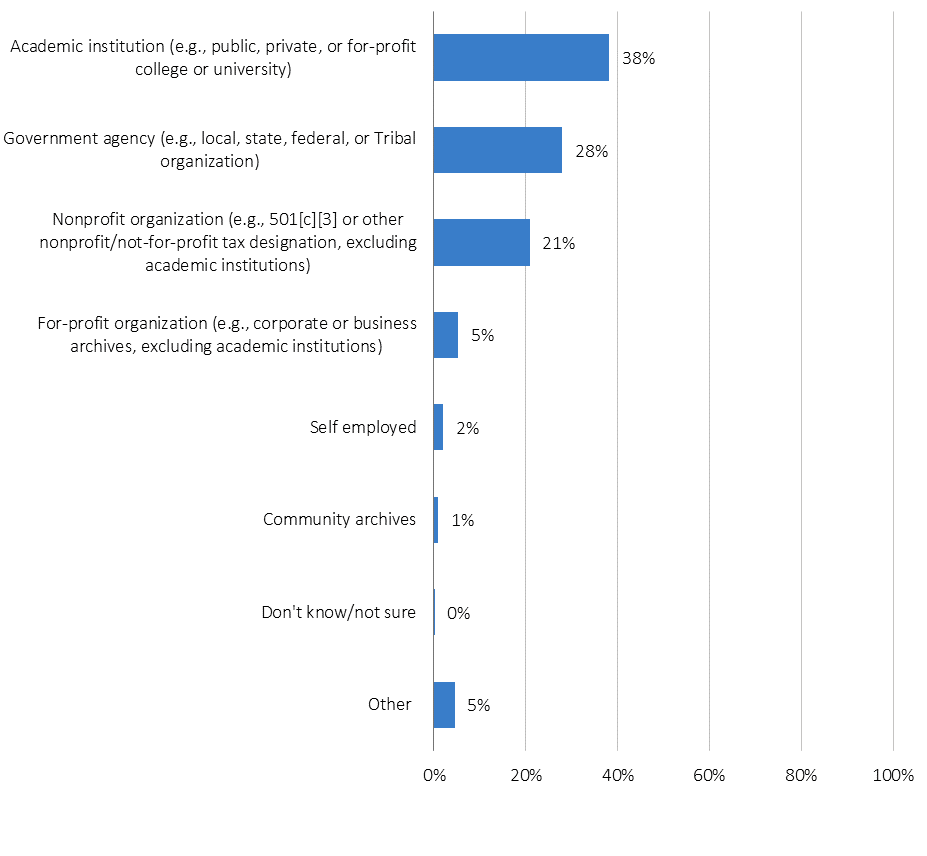
Employed respondents most commonly work for academic institutions (38 percent), government agencies (28 percent) and nonprofit organizations (21 percent) (see Figure 10). Fewer respondents are employed at for-profit organizations, community archives, or are self-employed.
Figure 10 – Which of the following best describes your current employer?
Academic institutions
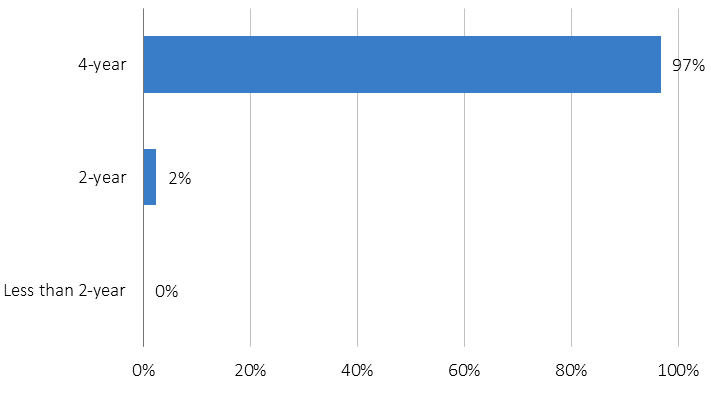
The vast majority (96 percent) of respondents working for an academic institution are employed at a college or university (see Figure 11). A very small proportion of respondents work at an elementary or secondary school (1 percent) or a seminary (1 percent). Of respondents who work at a college or university, only 1.2 percent are employed by a historically black college or university (HBCU) and only 0.6 percent are employed by a Tribal college or university. The majority of respondents work at a public institution (58 percent) and nearly two in five (39 percent) work for a private not-for-profit academic institution (see Figure 12). The overwhelming majority (97 percent) of respondents work at four-year institutions with only a small percentage of individuals coming from the two-year space (2 percent) (see Figure 13).
Figure 11 – Which of the following best describes the academic institution that is your current employer?
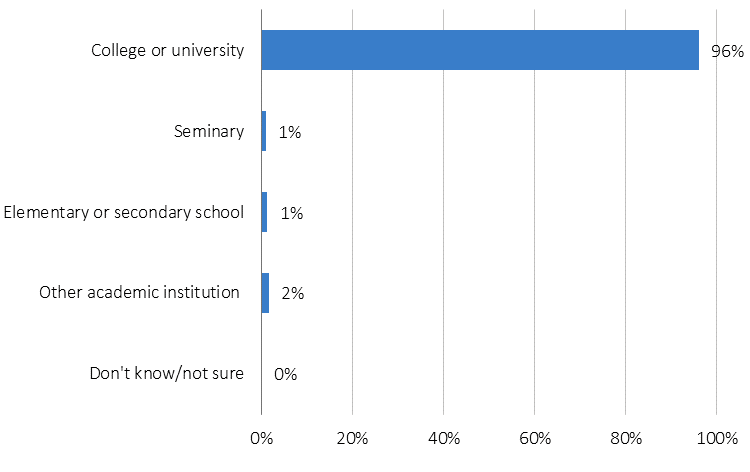
Figure 12 – Which of the following best describes the college or university that is your current employer?
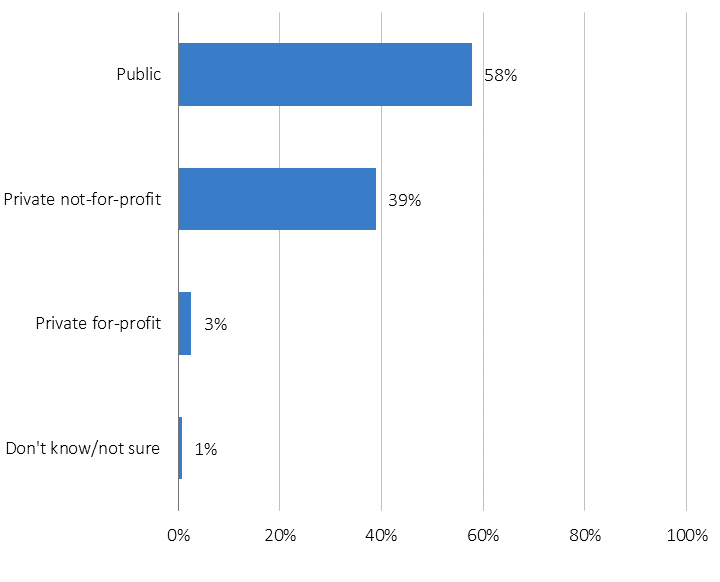
Figure 13 – Which of the following best describes the college or university that is your current employer?
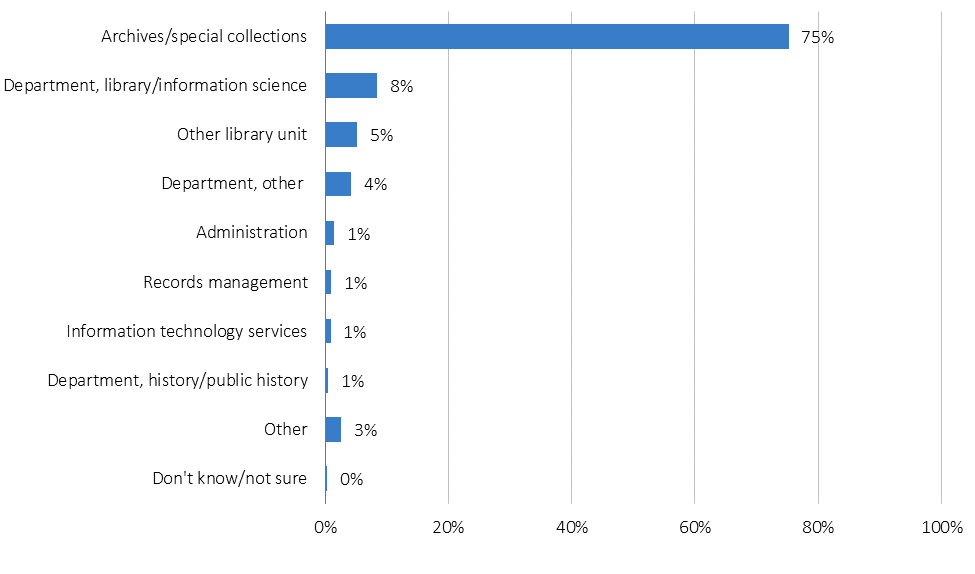
Archives/special collections are by far the most common functional units employing respondents within an academic institution (75 percent) (see Figure 14). An additional 8 percent of respondents work in the library/information science department and 5 percent work in another library unit.
Figure 14 – Which of the following best describes the functional unit within the academic institution that is your current employer?
Government agencies
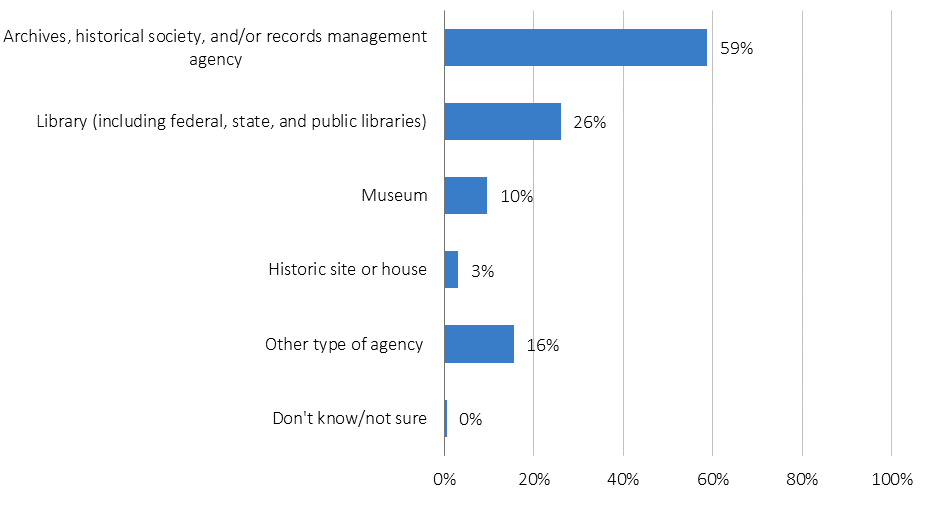
Forty-seven percent of respondents working for government agencies work at the federal level of government (see Figure 15). Approximately one fourth each work at the state or territory government level (28 percent) and the local government level (23 percent). Just 1 percent of respondents work for a tribal government agency. The majority of government employees work for an archives, historical society, and/or records management agency (59 percent) (see Figure 16). Twenty-six percent work for a library, and 10 percent work for a museum.
Figure 15 – Which of the following best describes the level of the government agency that is your current employer?
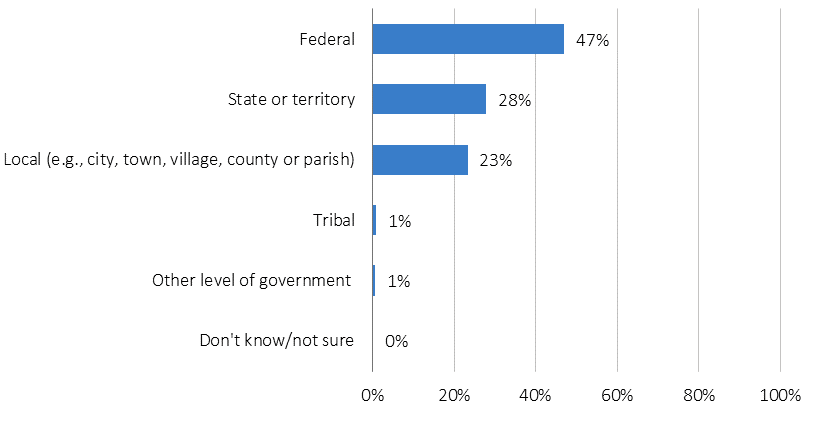
Figure 16 – Which of the following best describes the type of government agency that is your current employer? Please select all that apply.
Nonprofit organizations
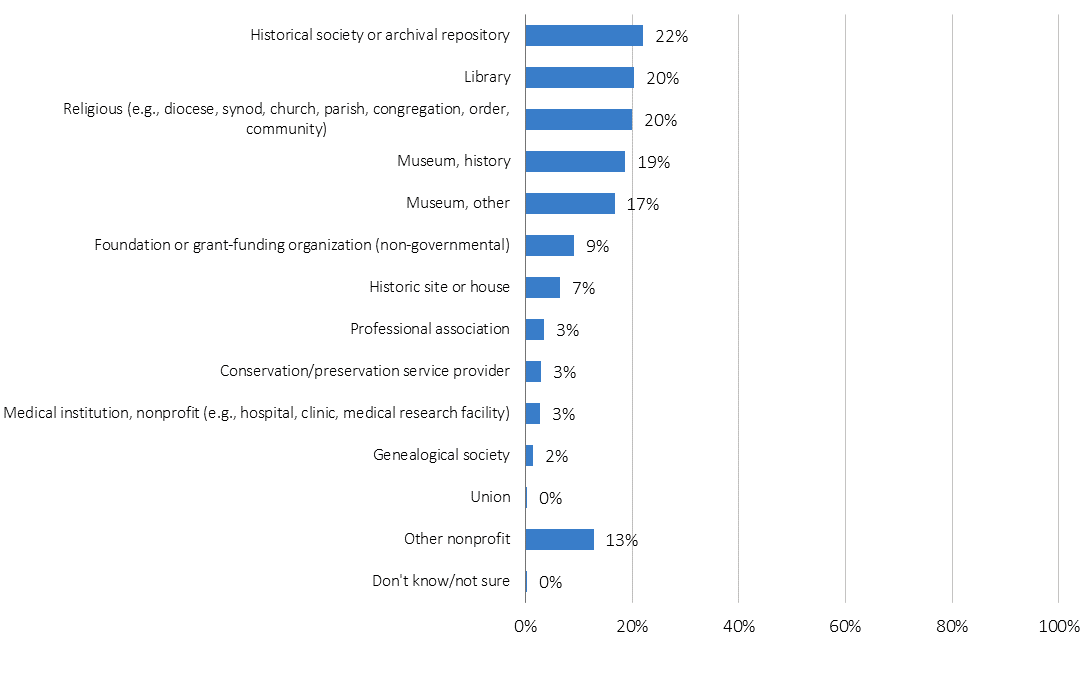
Unlike for academic institutions and government agencies where a clear majority of respondents work in a particular area, respondents from nonprofit organizations are spread out across several different employer types. Twenty-two percent work for a historical society or archival repository, 20 percent work for a library, and 20 percent work for a religious organization (see Figure 17). Further still, 19 percent work at a history museum, and 17 percent work for another kind of museum. Relatively few nonprofit organization employees work for a medical institution (3 percent) or genealogical society (2 percent).
Figure 17 – Which of the following best describes the nonprofit organization that is your current employer? Please select all that apply.
For-profit organizations
Of respondents working at for-profit organizations, 19 percent work for an archives-related organization, while 81 percent work for an archives or records function within a for-profit organization. Of those working for an archives-related organization, more than half (54 percent) work for an archival consulting firm/service provider and 14 percent work for a conservation/preservation consulting firm/service provider (see Figure 18). Respondents performing an archives or records function within a for-profit organization are in a variety of different industries. Nearly one in four (24 percent) are in art, media, publishing, or entertainment (see Figure 19). Twelve percent are in consumer products, and 10 percent are in financial services, banking, or securities.
Figure 18 – Which of the following best describes the for-profit organization that is your current employer?
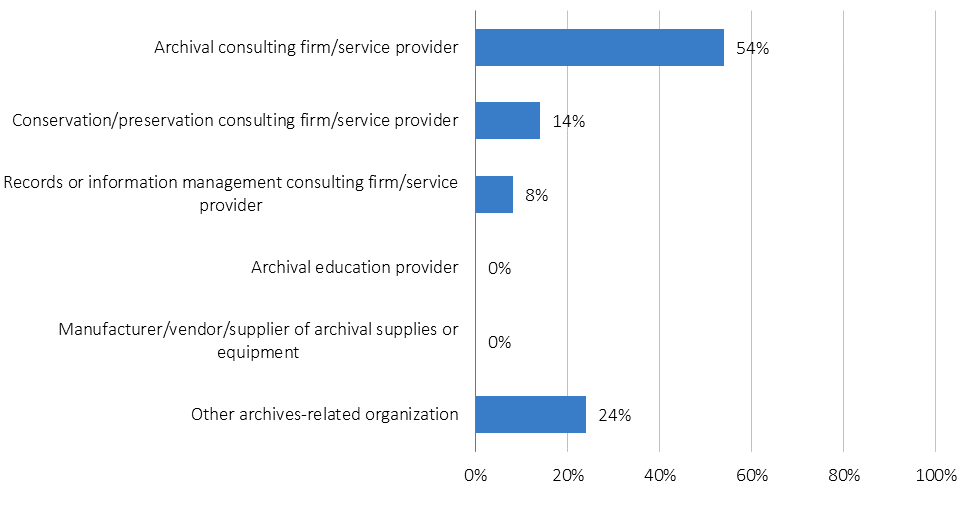
Figure 19 – Which of the following best describes the for-profit organization that is your current employer? 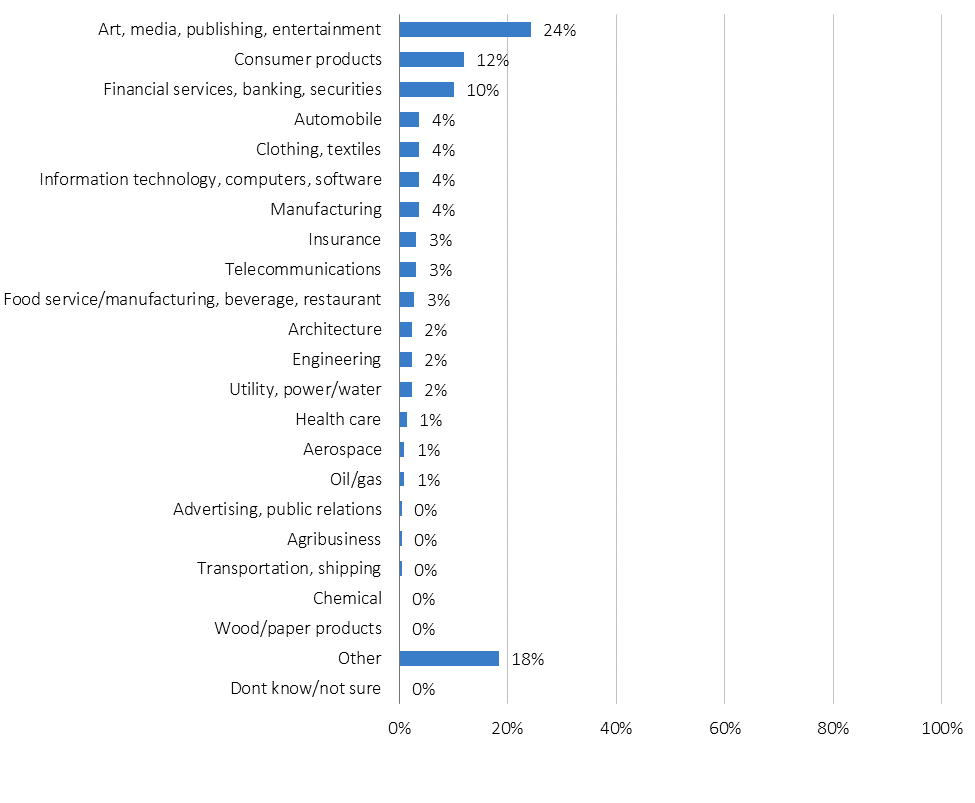
Self-employment
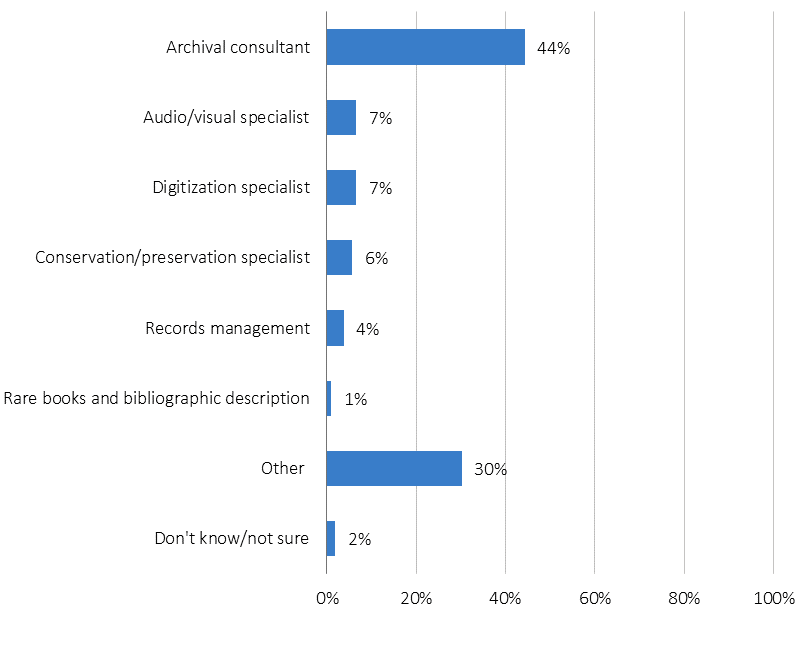
Of respondents who are self-employed, archival consultant is the most common role (44 percent) (see Figure 20). Fewer individuals are self-employed as audio/visual specialists (7 percent), digitization specialists (7 percent) and conservation/preservation specialists (6 percent).
Figure 20 – Which of the following best describes the focus of your self-employed work?
Job role
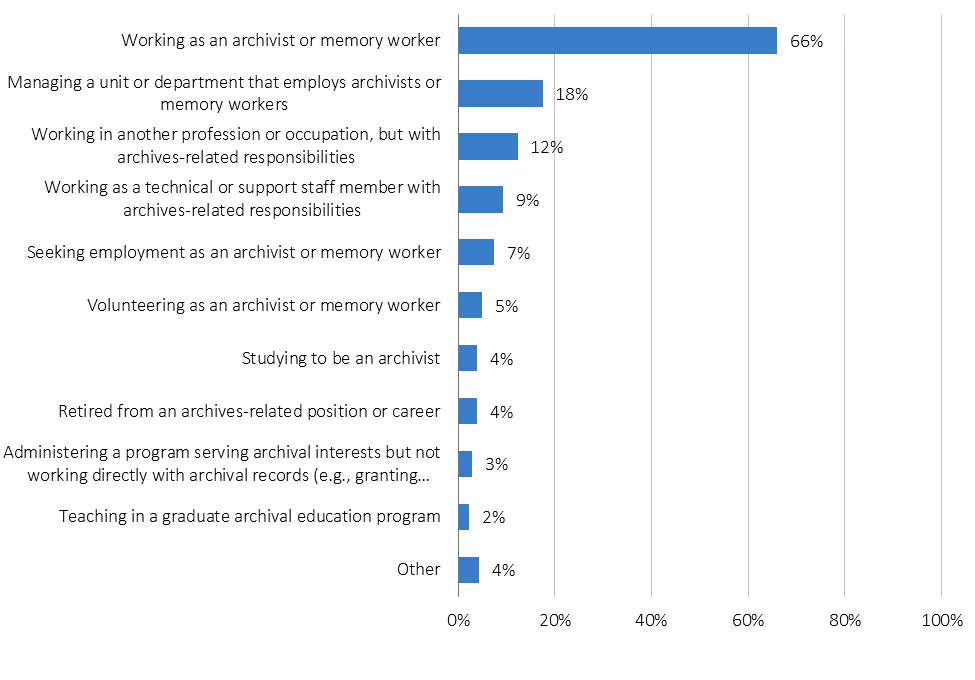
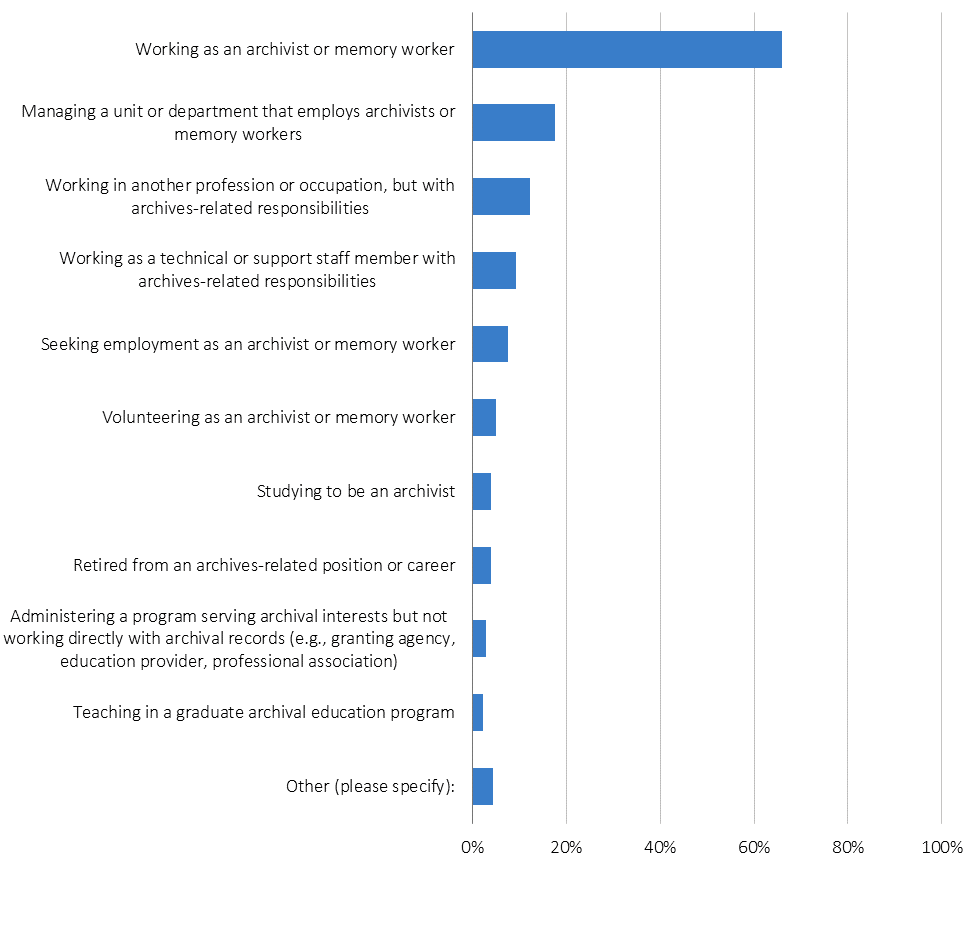
Two-thirds (66 percent) of respondents are currently working as an archivist or memory worker and 18 percent are managing a unit or department that employs archivists or memory workers (see Figure 21). There is also some overlap between the archives profession and other related occupations. This is shown through the 12 percent of respondents who work in another profession or occupation but who hold archives-related responsibilities. Very few respondents are teaching in a graduate archival education program (2 percent), administering a program serving archival interests but not working directly with archival records (3 percent), or retired from an archives-related position or career (4 percent).
Figure 21 – Please indicate if you are currently doing any of the following in regard to archival and/or memory work. Please select all that apply.
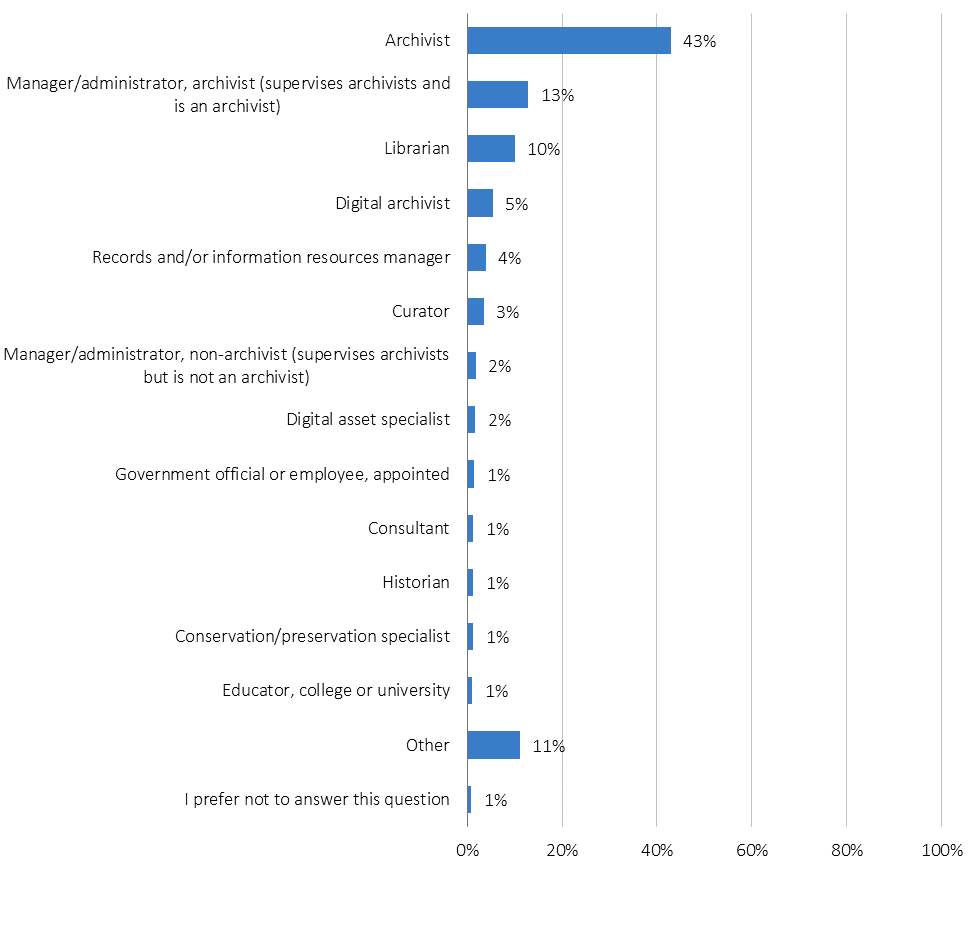
While all respondents received the question in Figure 21 and were encouraged to select all answer choices that apply to them, in Figure 22 respondents were directed to select the position that is most central to their role in the organization. Figure 22 was also only asked of respondents who are employed, self-employed, or retired from an archives-related position. Of these respondents, 43 percent indicated that their primary position is archivist. The second and third most common roles are those who are both managing archivists and are archivists themselves (13 percent) and librarians (10 percent).
Figure 22 – Please indicate your primary position below.
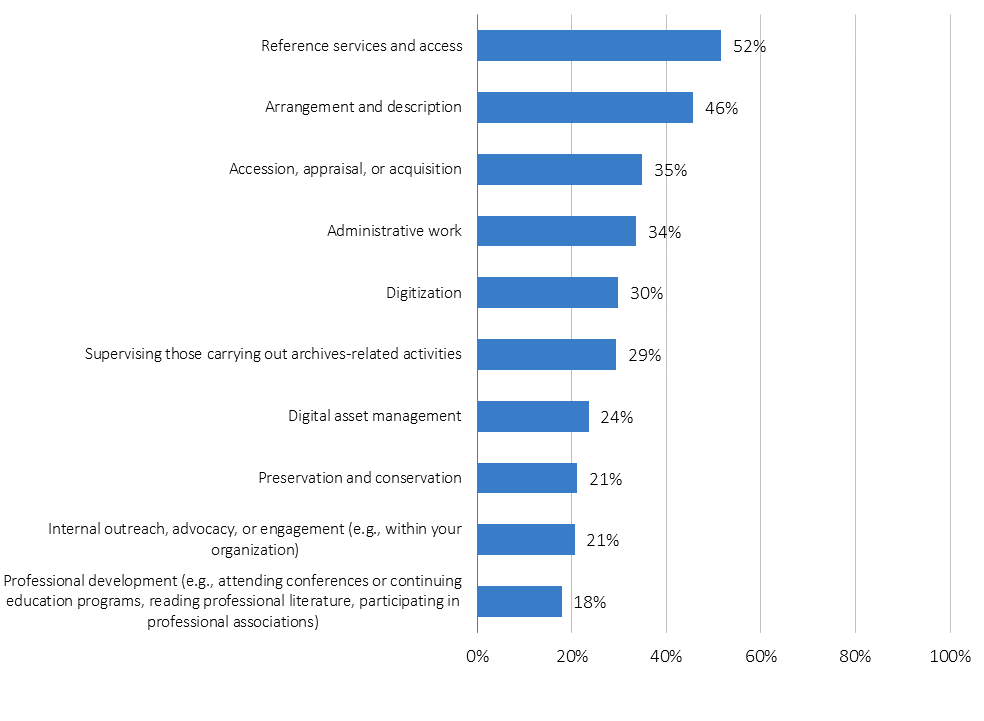
Within the last 12 months, the most common function respondents have spent time one is reference services and access (52 percent), followed closely by arrangement and description (46 percent) (see Figure 23). The wide distribution among functions illustrates that most respondents fulfill multiple roles within their organization.
Figure 23 – Identify the functions you have spent the most time on during your primary employment within the last 12 months. Please select up to five items.
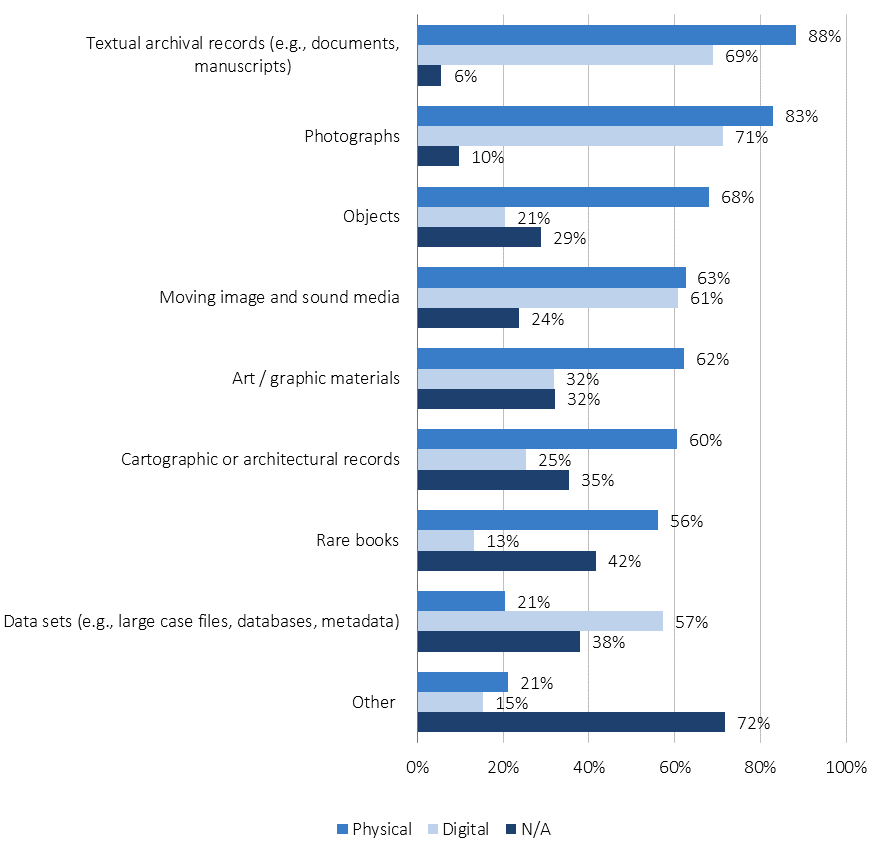
Respondents work with a large variety of physical and digital materials. Most commonly, with physical materials, respondents work with textual archival records such as documents and manuscripts (88 percent), photographs (83 percent), and objects (68 percent) (see Figure 24). Among physical materials, respondents reported working with data sets the least (21 percent). Among digital records, respondents are most likely to work with photographs (71 percent), textual archival records (69 percent), and moving image and sound media (61 percent), and least likely to work with rare books (13 percent).
Figure 24 – Which of the following kinds of records do you work with? Please select all that apply and indicate if the records you work with are physical or digital. If you do not work with a particular kind of record, select N/A.
Salary
Full-time salary
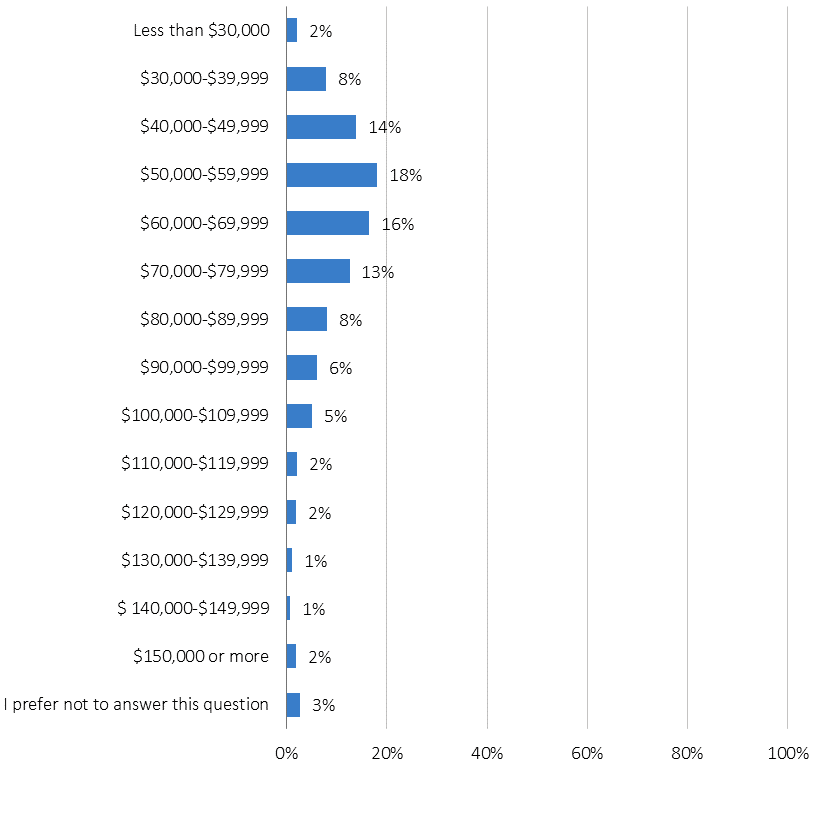
There is considerable range in the salaries of full-time respondents. While the majority (61 percent) of respondents in full-time positions make between $40,000 and $79,999 a year, 27 percent make $80,000 or more a year and 10 percent make less than $40,000 each year (see Figure 25).
Figure 25 – Please indicate your expected total gross annual salary/income in 2021 for your full-time position.
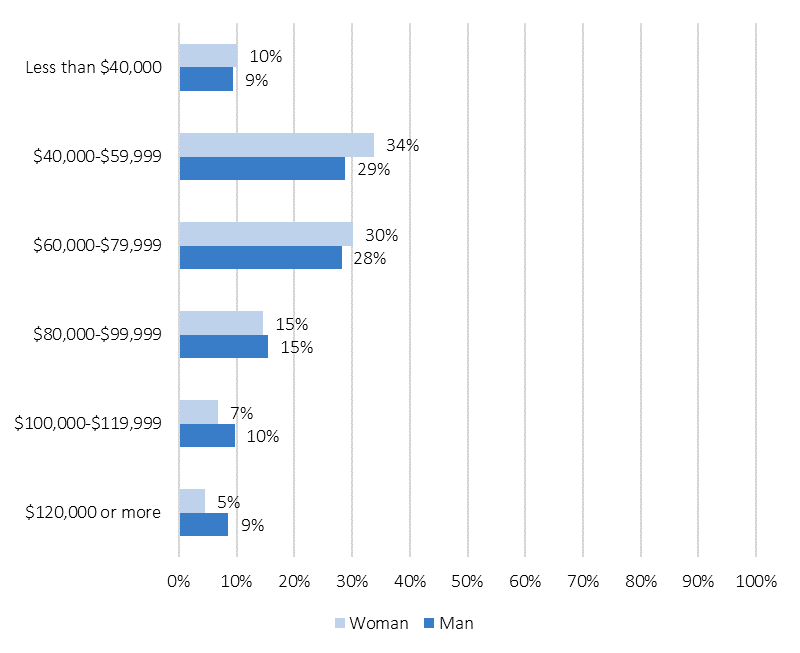
For most pay ranges, there are no major salary differences between men and women. There are two exceptions. The first is at the $40,000-$59,999 salary level, where women (34 percent) are more likely than men (29 percent) to earn a salary in this range (see Figure 26). The second is when we look closely at who is making salaries above $100,000. Eighteen percent of men in full-time positions earn six figures compared with only 11 percent of women. This may be partially explained by differences in position, with men being overrepresented in leadership positions (see Figure 60). The ratio of women to men among all respondents is 3.07 compared with the ratio at the senior administrator or executive level, which is 2.44.
Figure 26 – Please indicate your expected total gross annual salary/income in 2021 for your full-time position. Percentage of respondents that selected each item by gender.
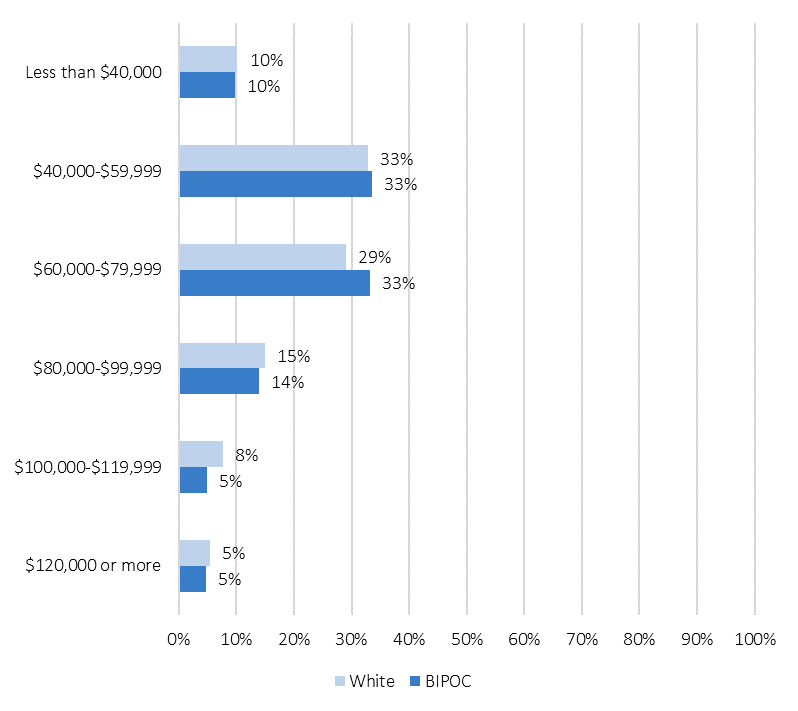
There are no major differences in salary between White and BIPOC respondents in full-time positions (see Figure 27). The same proportion of White and BIPOC respondents make less than $40,000 a year (10 percent), and $40,000-$59,000 a year (33 percent). The largest difference is still quite small, only differing by 4 percentage points with 33 percent of BIPOC respondents reporting earning a salary between $60,000-$79,999 versus 29 percent of White respondents. Even when we roll up the data further and look at who is making $100,000 or more, the difference is still quite small, with 13 percent of White respondents earning six figures and 10 percent of BIPOC respondents earning this amount.
Figure 27 – Please indicate your expected total gross annual salary/income in 2021 for your full-time position. Percentage of respondents that selected each item by race/ethnicity.
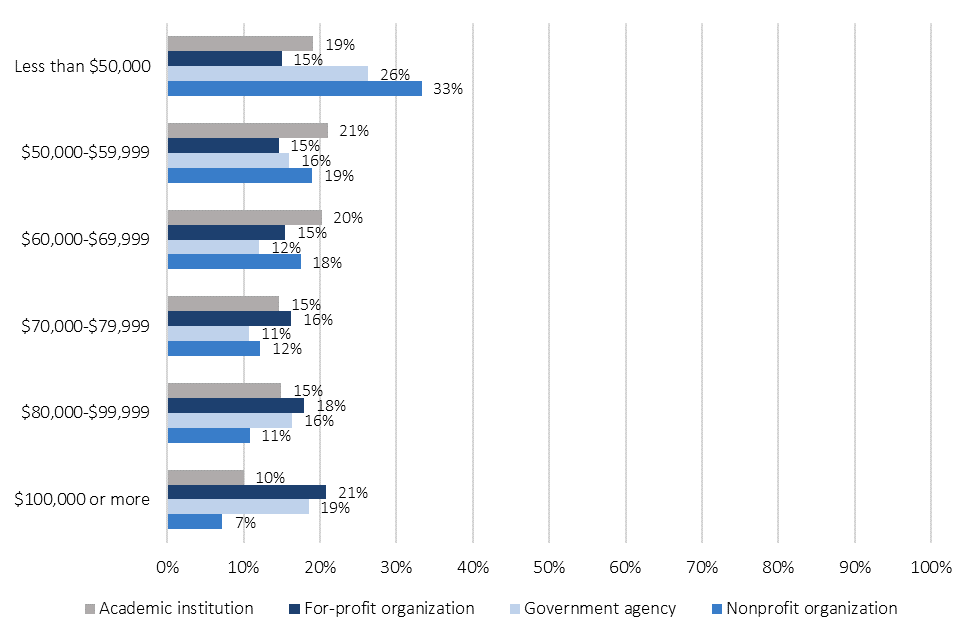
Full-time salaries vary considerably by sector. One third of respondents working for nonprofits earn less than $50,000 annually (see Figure 28). Comparatively, only 15 percent of respondents at for-profit organizations earn that amount. Full-time respondents at academic institutions are most likely to earn between $50,000-$59,999 (21 percent) or $60,000-$69,999 (20 percent). Government agencies perhaps have the greatest variation; while the highest proportion of government agency employees earn less than $50,000 (26 percent), the next highest proportion earn $100,000 or more (19 percent). Respondents employed at government agencies (19 percent) and for-profit organizations (21 percent) are considerably more likely to earn $100,000 or more than employees of nonprofit organizations (7 percent) and academic institutions (10 percent).
Figure 28 – Please indicate your expected total gross annual salary/income in 2021 for your full-time position. Percentage of respondents that selected each item by sector.
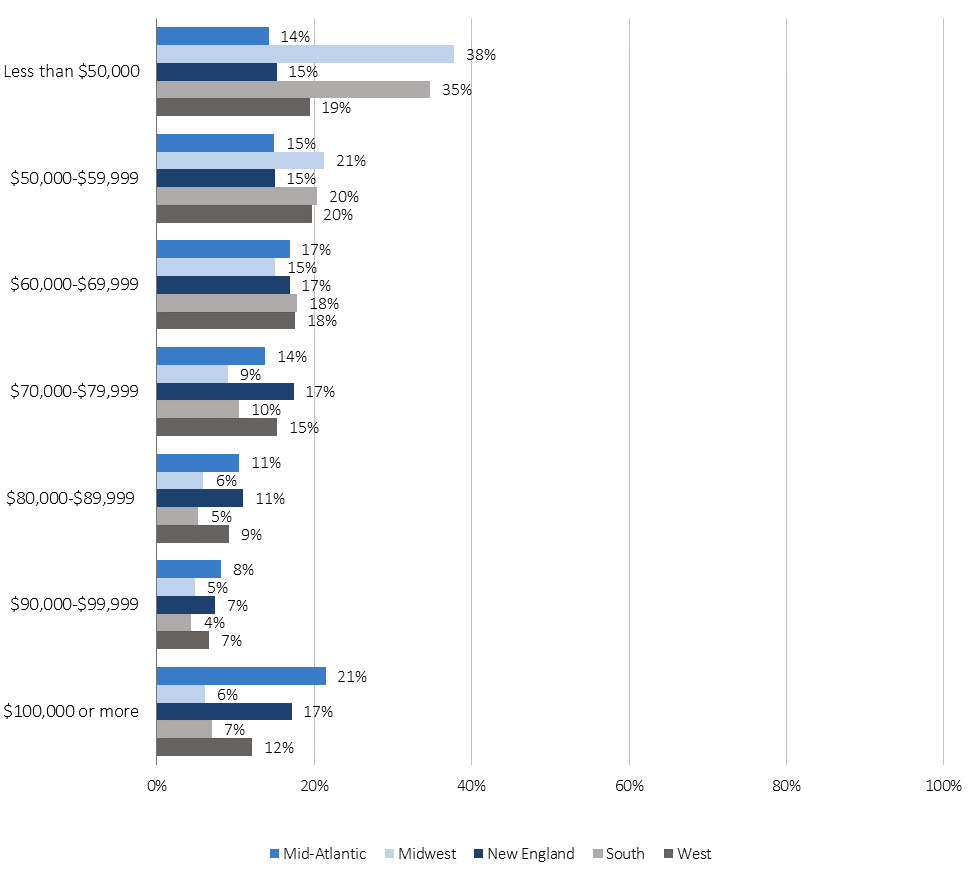
Approximately half of respondents in all regions make between $50,000 and $79,999 a year, with the Midwest (45 percent) having the smallest proportion of respondents in this range and the West having the highest proportion (53 percent) (see Figure 29). Forty-nine percent of both respondents in the South and New England fall in this category, and 46 percent of those in the Mid-Atlantic region do as well. While the bulk of respondents fall within this middle range across regions, there are significant differences between regions for those who earn the least as well as those who earn the most. Respondents living in the Midwest (38 percent) and South (35 percent) are much more likely to earn less than $50,000 annually compared with respondents in the Mid-Atlantic (14 percent), New England (15 percent), or West (19 percent). Conversely, respondents in the Mid-Atlantic (21 percent) and New England (17 percent) are the most likely to earn $100,000 or more a year compared with other regions. And those in the West (12 percent) are more likely to earn six figures compared with those in the South (7 percent) and Midwest (6 percent).
Figure 29 – Please indicate your expected total gross annual salary/income in 2021 for your full-time position. Percentage of respondents that selected each item by region.
Part-time salary
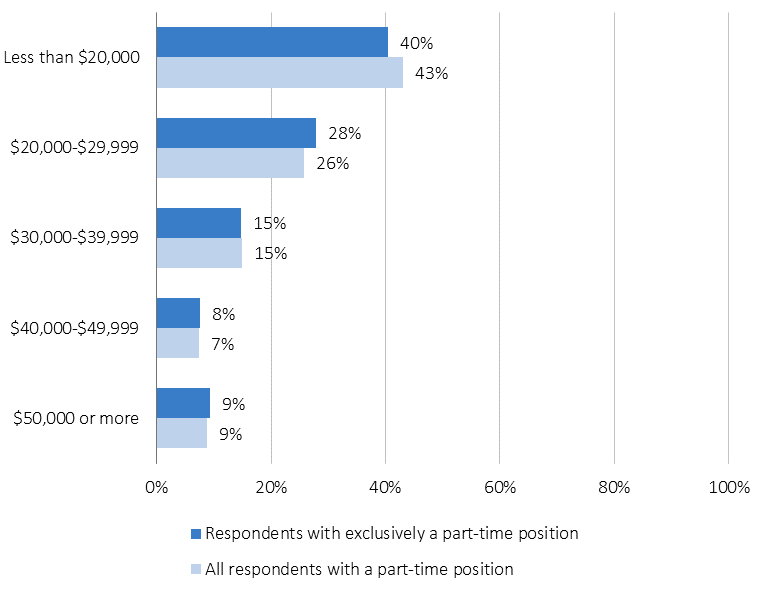
Of all people with a part-time position, including those who hold another paid position, 43 percent made less than $20,000 in gross employment-related wages in 2021 and about a quarter (26 percent) make between $20,000 and $29,999 (see Figure 30). Nine percent make more than $50,000 annually. When we exclude individuals who have additional paid positions, such as a full-time role or a paid internship, and focus on respondents who exclusively have a part-time role for their income, the results are nearly identical.
Figure 30 – Please indicate your expected total gross employment-related wages for 2021 for your part-time position(s). Percentage of respondents that selected each item by all respondents with a part-time position and respondents who exclusively have a part-time position.
The total number of respondents with a part-time position, regardless of whether they have another income-generating role, who also provided salary information is 502. Since this is a relatively small n, we rolled up the salary categories to be less than $20,000 and $20,000 or more to eliminate risk of identification when we stratified part-time salary by other variables. There is no difference in part-time income by gender, with 43 percent of men and 42 percent of women earning less than $20,000 and 57 percent of men and 58 percent of women earning $20,000 or more. The n is too small for BIPOC part-time employees to be able to conduct salary analysis by race/ethnicity. There are no significant differences in part-time income for respondents working at academic institutions, government agencies, and nonprofit organizations (see Figure 31).
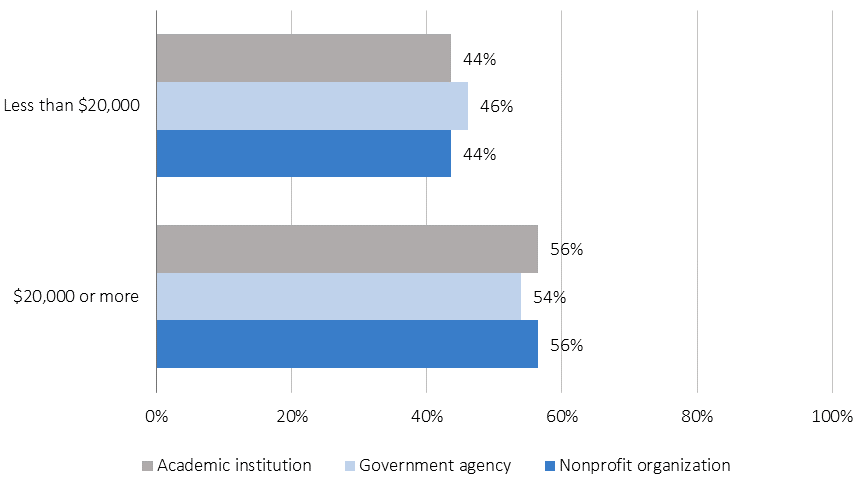
Figure 31 – Please indicate your expected total gross employment-related wages for 2021 for your part-time position(s). Percentage of respondents that selected each item by sector.
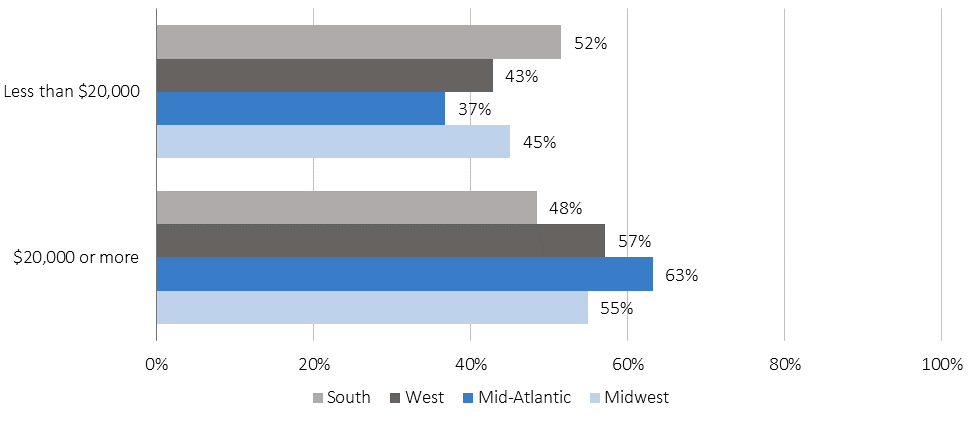
Part time employees in the Mid-Atlantic are the most likely to earn $20,000 or more (63 percent) and the least likely to earn less than $20,000 (37 percent) (see Figure 32). Conversely, part-time employees in the South are the most likely to earn less than $20,000 (52 percent) and the least likely to earn $20,000 or more (48 percent). Respondents located in the West and Midwest have similar proportions earning less than $20,000 (43 percent and 45 percent respectively) as well as earning $20,000 or more (57 percent and 55 percent respectively). New England was excluded from this analysis due to a low n.
Figure 32 – Please indicate your expected total gross employment-related wages for 2021 for your part-time position(s). Percentage of respondents that selected each item by region.
Education
The archives field is highly educated. An overwhelming majority of respondents (86 percent) have an advanced degree, and more than one in four (27 percent) have two or more advanced degrees. Fewer respondents hold an Archives Certification (22 percent) and just 3 percent of respondents have a Records Manager Certification. The proportion of archivists holding high school, Associate, BA/BS/BFA, and MLS/MLIS degrees increased since the original A*CENSUS (see Figure 33). The MLS/MLIS degree has become particularly important in recent years. Since 2004, the proportion of archivists with an MLS/MLIS degree has increased from 39.4 percent to 60 percent—the largest rise of any degree-type (52 percent increase).
Figure 33 – Please indicate ALL of the degrees you hold. Please select all that apply. Percentage of respondents that selected each item in 2021 and 2004.
| Degrees held | A*CENSUS II 2021 | A*CENSUS 2004 |
| High school | 79.7% | 61.8% |
| Associate | 8.9% | 8.1% |
| BA/BS/BFA | 86.4% | 76.3% |
| MA/MS/MFA | 43.6% | 46.3% |
| MLS/MLIS | 60.0% | 39.4% |
| MBA | 0.7% | 0.9% |
| PhD | 6.0% | 8.4% |
| JD | 0.6% | 0.7% |
| None of the above | 0.1% | 0.1% |
| I prefer not to answer this question/Rather not say | 0.1% | 0.7% |
| n | 5,696 | 5,620 |
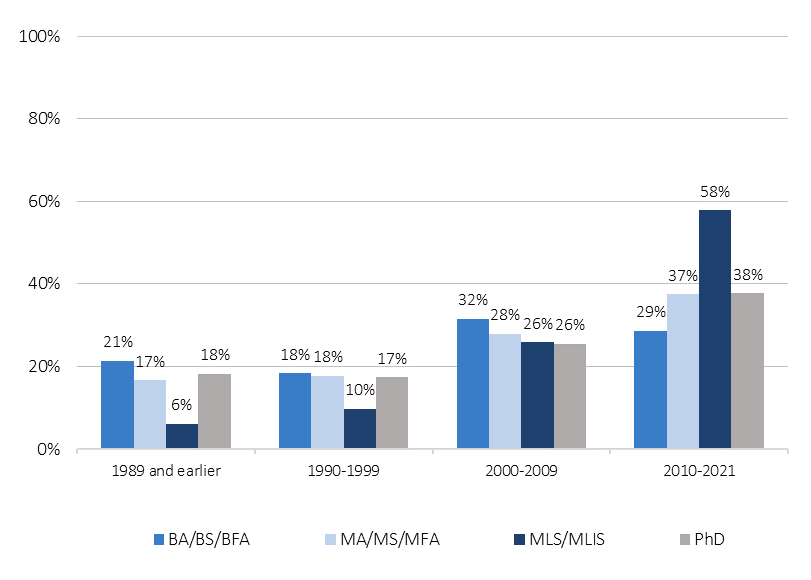
Much of the increase in MLS/MLIS degrees has taken place in recent years. More than half (58 percent) of respondents with an MLS/MLIS earned their degree since 2010 compared with 37 percent of MA/MS/MFA and 38 percent of PhD degree holders over the same time period (see Figure 34). From 2000-2009 to 2010-2021, the proportion of people earning their MA/MS/MFA increased 34 percent compared with a staggering 124 percent increase in people earning their MLS/MLIS. When we look at currently enrolled students (3 percent of all respondents) it becomes clear that the proportion of archivists with an MLS/MLIS degree is likely to continue to rise. Of currently enrolled students, nearly three-quarters (72 percent) are enrolled in an MLS/MLIS program.
Figure 34 – Please indicate in what year you were awarded the following degrees. Percentage of respondents that selected each item by degree.
Respondents are educated in a variety of disciplines, but history is far and away the top major of study for both MA/MS/MFA (37 percent) (see Figure 35) and PhD (39 percent) (see Figure 37) degree holders. Since 2004, the proportion of those studying history for their MA/MS/MFA degree decreased slightly from 43 percent. At the same time, public history has increased from 4 percent in 2004 to 10 percent in 2021. Fifty percent of MLS/MLIS degree holders concentrated in library and/or information science and 47 percent concentrated in archives (see Figure 36).
Figure 35 – Please indicate your major/concentration for each degree listed below. Frequency and percentage of respondents selecting each item for MA/MS/MFA degrees.
| Total number who identified major | % of total reporting majors | |
| Total reporting MA/MS/MFA degrees | 2,481 | |
| Total identifying major/concentration | 2,452 | 100% |
| History | 912 | 37.2% |
| Public history | 252 | 10.3% |
| Museum studies | 153 | 6.2% |
| Archives | 148 | 6.0% |
| Literature | 112 | 4.6% |
| Library and/or information science | 88 | 3.6% |
| Fine arts | 73 | 3.0% |
| Education | 61 | 2.5% |
| American studies | 50 | 2.0% |
| Religious studies | 38 | 1.6% |
| Film studies | 37 | 1.5% |
Figure 36 – Please indicate your major/concentration for each degree listed below. Frequency and percentage of respondents selecting each item for MLS/MLIS degrees.
| Total number who identified major | % of total reporting majors | |
| Total reporting MLS/MLIS degrees | 3,417 | |
| Total identifying major/concentration | 3,369 | 100% |
| Library and/or information science | 1699 | 50.4% |
| Archives | 1597 | 47.4% |
Figure 37 – Please indicate your major/concentration for each degree listed below. Frequency and percentage of respondents selecting each item for PhD degrees.
| Total number who identified major | % of total reporting majors | |
| Total reporting PhD degrees | 340 | |
| Total identifying major/concentration | 337 | 100% |
| History | 132 | 39.2% |
| Library and/or information science | 41 | 12.2% |
Student Loans
With the national student loan debt standing at approximately 1.6 trillion dollars,[1] it is no surprise that student loan debt is a widely discussed topic not only on the national stage but within the archives profession. As shown above, archivists are highly educated, with the majority (86 percent) holding an advanced degree. Thus it should come as no surprise that student loan debt is highly relevant to many individuals in the archives profession. Of respondents who provided student loan information, 67 percent graduated, or left their degree program prior to graduation, with student loan debt for at least one degree. In addition, of respondents who acquired graduate credits but did not complete the degree, 41 percent accrued student loan debt at the time of leaving their program while 59 percent did not accrue debt.
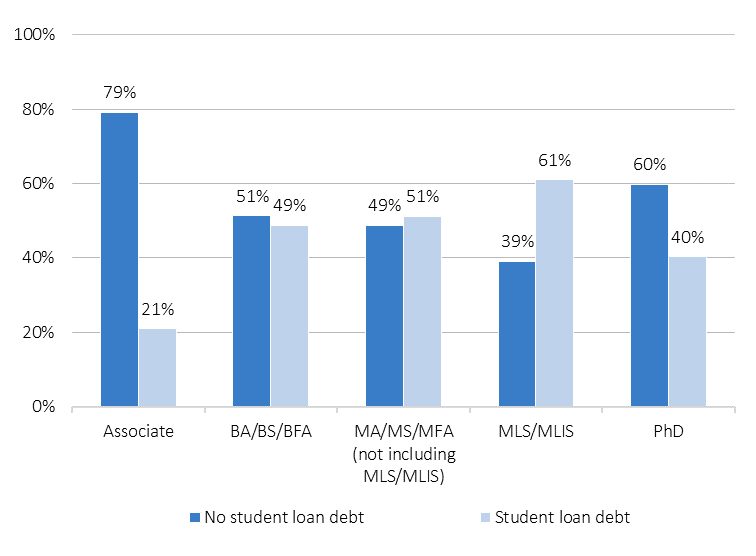
Whether loans were taken out varies considerably by degree type (see Figure 38). More than three quarters (79 percent) of those with Associate degrees and almost two-thirds (60 percent) of those with PhDs graduated without any student debt, for example, while BA/BS/BFA and MA/MS/MFA holders were more evenly split. Approximately half of BA/BS/BFA degree holders graduated with student debt (49 percent) and about half did not (51 percent); the same is true for MA/MS/MFA degree holders. Importantly, MLS/MLIS degree holders were more likely to graduate with student debt (61 percent) compared to respondents with any other degree.
Figure 38 – You indicated that you have the following degree(s) or some credits but no degree. Upon graduation (or leaving the program), how much did you have in student loan debt in your name for each degree(s)? Percentage of respondents who reported having and not having student loan debt.
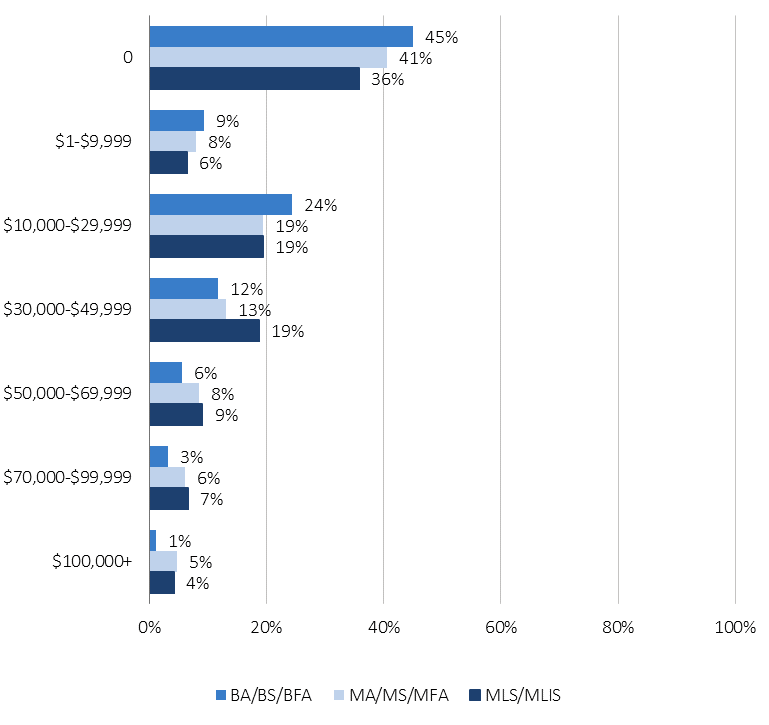
That MLS/MLIS degree holders are more likely to graduate with student debt compared with other degree types is partially a reflection of the fact that MLS/MLIS degree holders are more likely to have graduated relatively recently. However, even when we look at individuals who graduated since 2000, respondents with an MLS/MLIS degree were more likely to have taken out student loans than both MA/MS/MFA and BA/BS/BFA holders (see Figure 39). Only 36 percent of MLS/MLIS degree holders who graduated from 2000-2021 did so without debt compared with 41 percent of MA/MS/MFA degree holders from the same period. And while 32 percent of MA/MS/MFA degree holders graduated with $30,000 or more in student debt, 39 percent of MLS/MLIS degree holders did. This has important implications for the archives profession as the proportion of MLS/MLIS degree holders saw the largest percentage point increase of any other degree since the first A*CENSUS. If the MLS/MLIS degree is becoming more central to the archives profession, and it also is more likely to require student loans to finance the degree, this may increase the proportion of archivists with student debt over time.
Figure 39 – You indicated that you have the following degree(s) or some credits but no degree. Upon graduation (or leaving the program), how much did you have in student loan debt in your name for each degree(s)? Percentage of respondents that selected each item by degree-type from 2000-2021.
Diversity, Equity, Inclusion, and Access
Findings from the All Archivists Survey reveal a nuanced picture of diversity, equity, inclusion, and access within the archives profession. Responses indicate that while the archives profession has not yet reached its goals of diversity, equity, inclusion, and accessibility (DEIA), some steps are being taken to reach those goals.
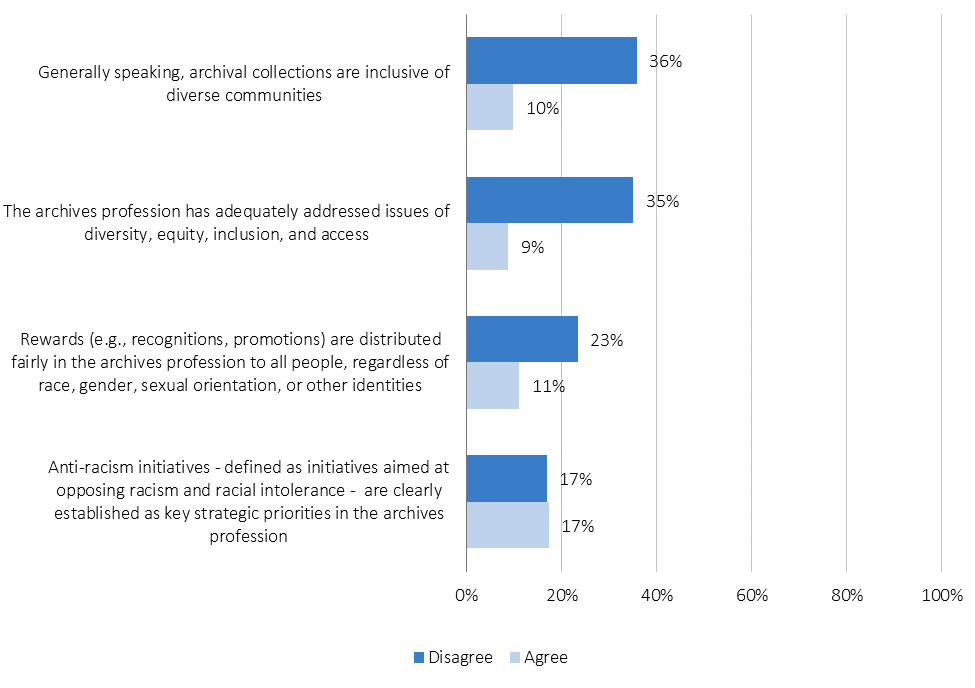
More than one third of respondents disagree that archival collections are inclusive of diverse communities (36 percent) or that the archives profession has adequately addressed issues of diversity, equity, inclusion, and access (35 percent) compared with approximately 1 in 10 respondents who do agree with these statements (see Figure 40). Nearly a quarter (23 percent) of respondents disagree that rewards such as recognitions or promotions are distributed fairly in the archives profession to all people, regardless of race, gender, sexual orientation, or other identities, while 11 percent agree. Conversely, respondents are split on agreeing (17 percent) and disagreeing (17 percent) that anti-racism initiatives—defined as initiatives aimed at opposing racism and racial intolerance—are clearly established as key strategic priorities in the archives profession. Notably, this statement had the highest level of agreement among these four statements. This suggests that the archives profession has made more progress on establishing some DEIA-related goals as key priorities than on achieving those goals at this juncture.
Figure 40 – Please read the following statements and indicate the extent to which you agree or disagree with each. Percentage of respondents that Agree or Disagree with each statement.
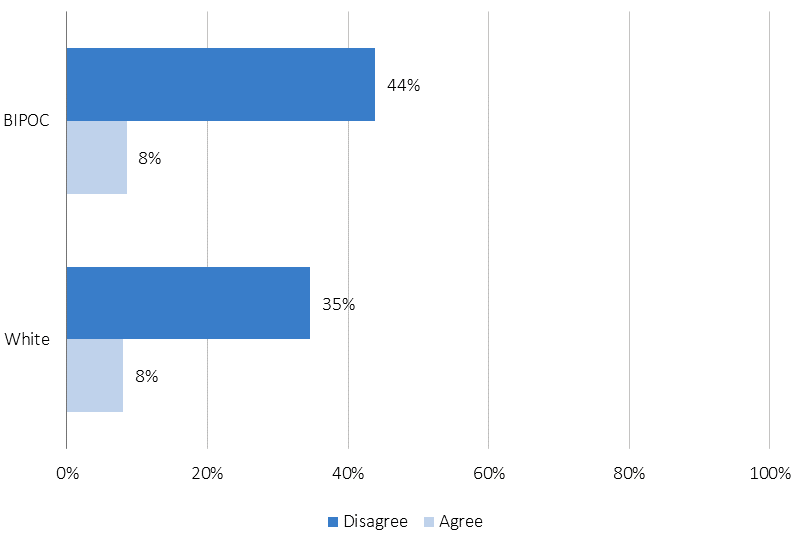
Interestingly, the same proportion of BIPOC and White respondents agree that the archives profession has adequately addressed issues of diversity, equity, inclusion, and access; however, BIPOC respondents were more likely to disagree (44 percent) compared with White respondents (35 percent) (see Figure 41).
Figure 41 – Please read the following statements and indicate the extent to which you agree or disagree with each. The archives profession has adequately addressed issues of diversity, equity, inclusion, and access. Percentage of respondents that Agree or Disagree with this statement by race/ethnicity.
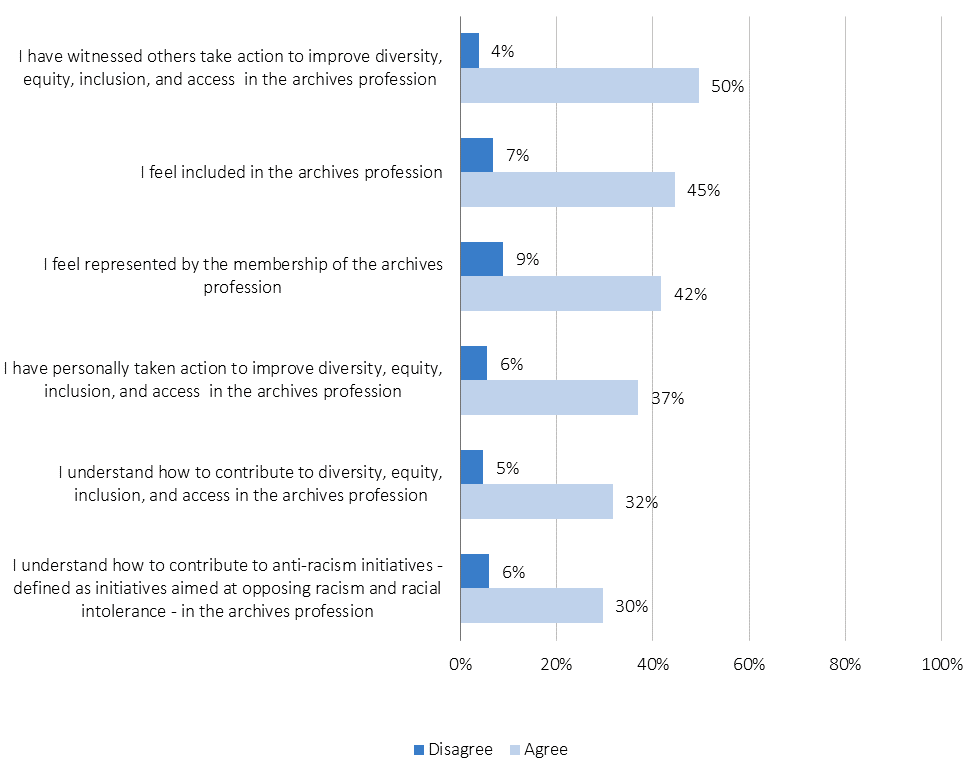
While DEIA goals have not yet been achieved, there is encouraging evidence that steps are being taken to reach them. Half of all respondents have witnessed others taking action to improve DEIA in the archives profession, and 37 percent have personally taken action in this area (see Figure 42). Nearly one third of respondents understand how to contribute to DEIA (32 percent) and anti-racism initiatives (30 percent) in the archives profession, compared with just 5 and 6 percent respectively who do not understand how to contribute to these areas. Significantly more people feel included in (45 percent) and represented (42 percent) by the archives profession as well.
Figure 42 – Please read the following statements and indicate the extent to which you agree or disagree with each. Percentage of respondents that Agree or Disagree with each statement.
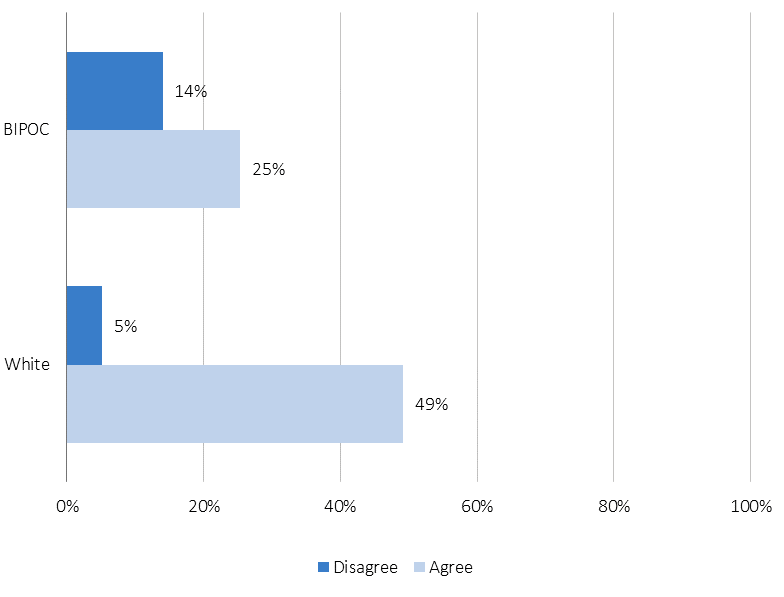
Since the archives profession is overwhelmingly White and female, further analysis is needed to understand if inclusion and representation is felt evenly across respondents with different demographic backgrounds. When we dive further into the data, a significant difference arises by race/ethnicity in regard to feeling included in the archives profession. While 49 percent of White respondents agree that they feel included in the archives profession, just 25 percent of BIPOC respondents feel the same (see Figure 43). Similarly, BIPOC respondents were almost three times as likely to disagree with this statement compared with White respondents. Interestingly, there is little difference by gender, with men (49 percent) and women (45 percent) reporting similar levels of agreement in regard to feeling included.
Figure 43 – Please read the following statements and indicate the extent to which you agree or disagree with each. I feel included in the archives profession. Percentage of respondents that Agree or Disagree with this statement by race/ethnicity.
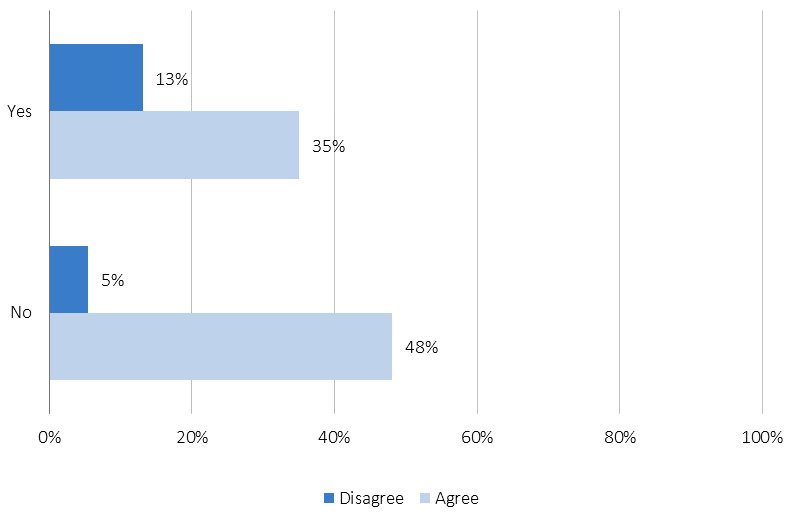
There are also differences in feeling included by other demographic variables, such as disability. Respondents who have a disability (including but not limited to physical, psychological, developmental, and sensory disabilities) are less likely to feel included (35 percent) in the archives profession than respondents without a disability (48 percent) (see Figure 44).
Figure 44 – Please read the following statements and indicate the extent to which you agree or disagree with each. I feel included in the archives profession. Percentage of respondents that Agree or Disagree with this statement by disability status. “Yes” means respondents reported having a disability and “No” means respondents reported not having a disability.
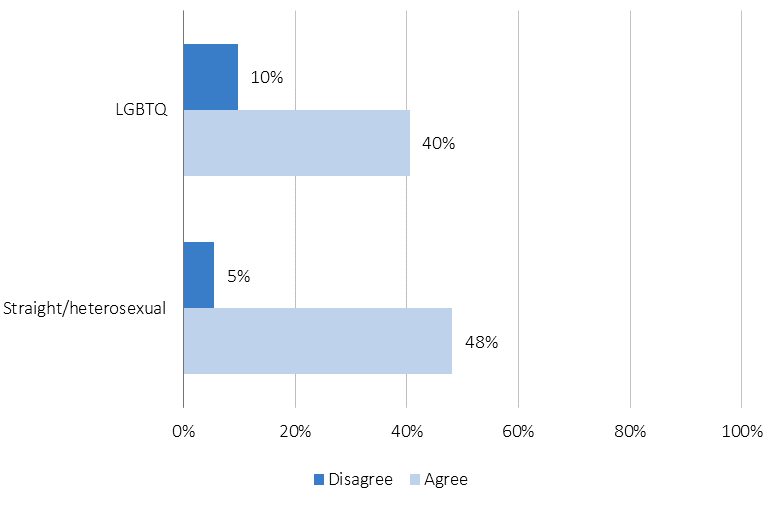
Though there are more significant gaps of inclusion between White and BIPOC respondents, and respondents with and without a disability, there is also a gap of inclusion between straight/heterosexual respondents and LGBTQ respondents. Straight/heterosexual respondents are more likely to feel included (48 percent) compared with LGBTQ respondents (40 percent) (see Figure 45). LGBTQ respondents (10 percent) are twice as likely to disagree that they feel included in the archives profession compared with straight/heterosexual respondents (5 percent).
Figure 45 – Please read the following statements and indicate the extent to which you agree or disagree with each. I feel included in the archives profession. Percentage of respondents that Agree or Disagree with this statement by sexual orientation.
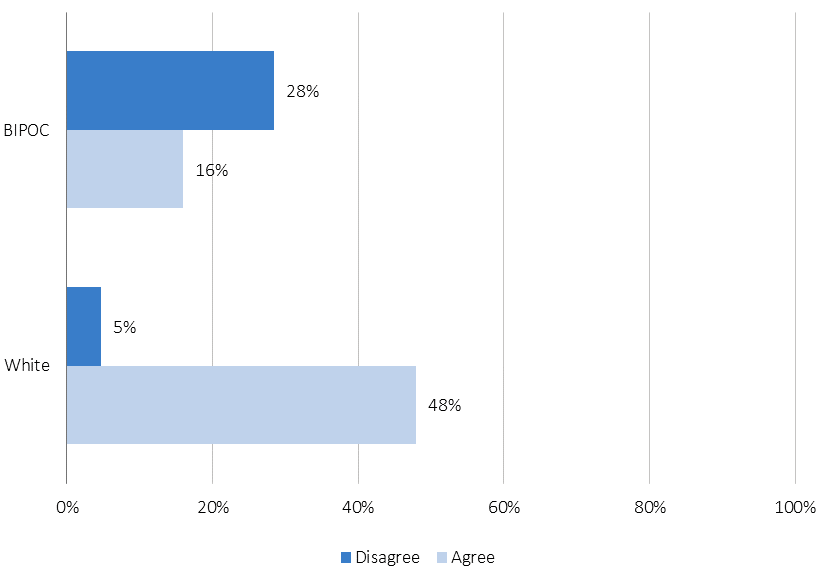
Even more so than inclusion, there is a gap between BIPOC and White respondents in regard to feeling represented by the membership of the archives profession. BIPOC respondents are nearly six times more likely to disagree that they feel represented compared with White respondents (see Figure 46). And while 48 percent of White respondents agree that they are represented by the membership of the archives profession, only 16 percent of BIPOC respondents feel this way. There was not a noticeable difference between men and women, with 41 percent of men and 44 percent of women reporting feeling represented.
Figure 46 – Please read the following statements and indicate the extent to which you agree or disagree with each. I feel represented by the membership of the archives profession. Percentage of respondents that Agree or Disagree with this statement by race/ethnicity.
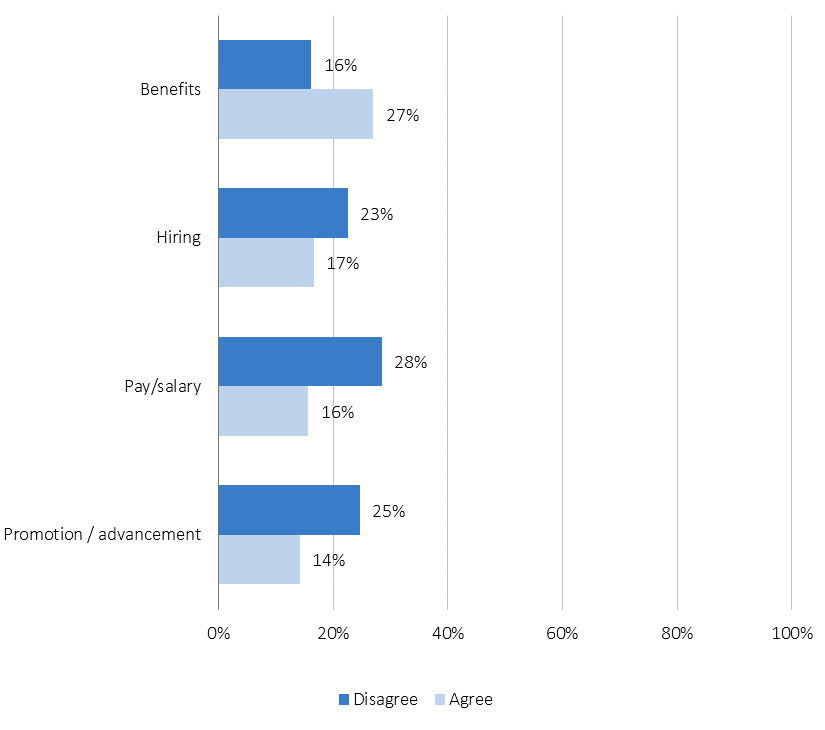
Some respondents have had personal experiences within the archives profession that have led them to doubt that pay/salary decisions are made equitably (see Figure 47). Only 16 percent of respondents agree that decisions related to pay/salary are equitable in the archives profession based on their personal experience, compared with 25 percent who disagree with this statement. Similarly, more respondents disagree than agree that decisions regarding promotion/advancement or hiring are equitable. Conversely, more respondents (27 percent) agree that decisions regarding benefits are equitable compared with those who disagree (16 percent).
Figure 47 – Please read the following statement and indicate the extent to which you agree or disagree. “Based on my personal experience with the archives profession, I believe decisions related to _____________ are equitable—in other words, they result in fair processes and outcomes without disparities between groups.” Percentage of respondents that Agree or Disagree with each statement.
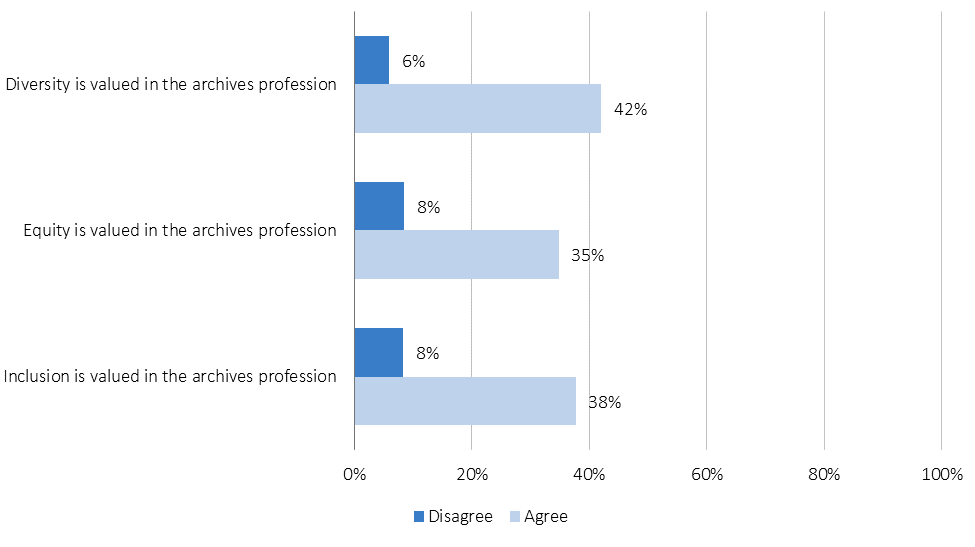
Forty-two percent of respondents agree that diversity is valued in the archives profession compared with just 6 percent of respondents who disagree. Likewise, respondents were more likely to agree that equity (35 percent) and inclusion (38 percent) are valued in the archives profession than not. While the numbers for each item in this figure (see Figure 48) are similar, a small but important difference exists between diversity and equity, with more respondents believing that diversity, defined as the representation of all identities and human differences, is valued more than equity, defined as taking differences into account to ensure fair processes and outcomes without disparities between groups.
Figure 48 – Please read the following statements and tell us the extent to which you agree or disagree with each. Percentage of respondents that Agree or Disagree with each statement.
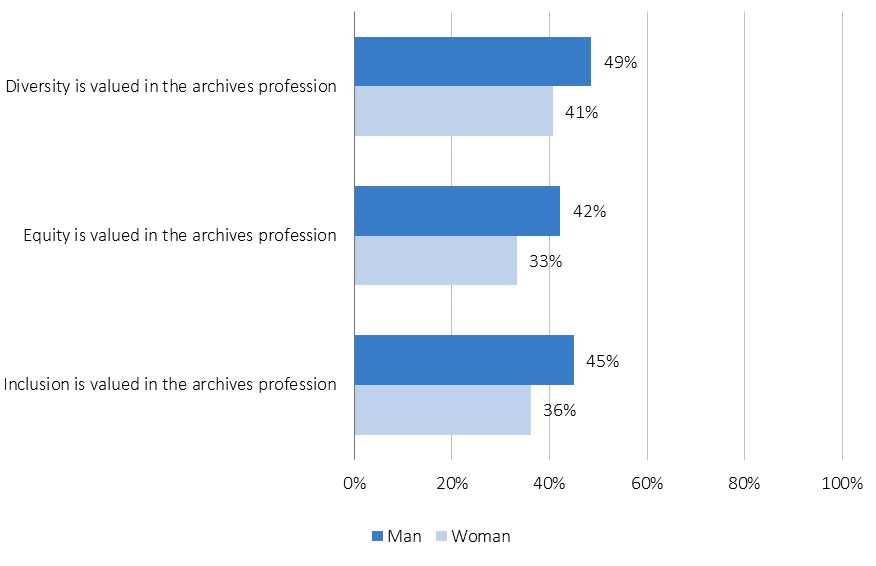
On all three measures, White respondents had higher agreement than BIPOC respondents (6 to 8 percentage point differences) (see Figure 49). Gender saw a slightly larger gap, with men reporting 8 to 9 percent higher levels of agreement than women (see Figure 50).
Figure 49 – Please read the following statements and tell us the extent to which you agree or disagree with each. Percentage of respondents that Agree or Disagree with each statement by race/ethnicity.
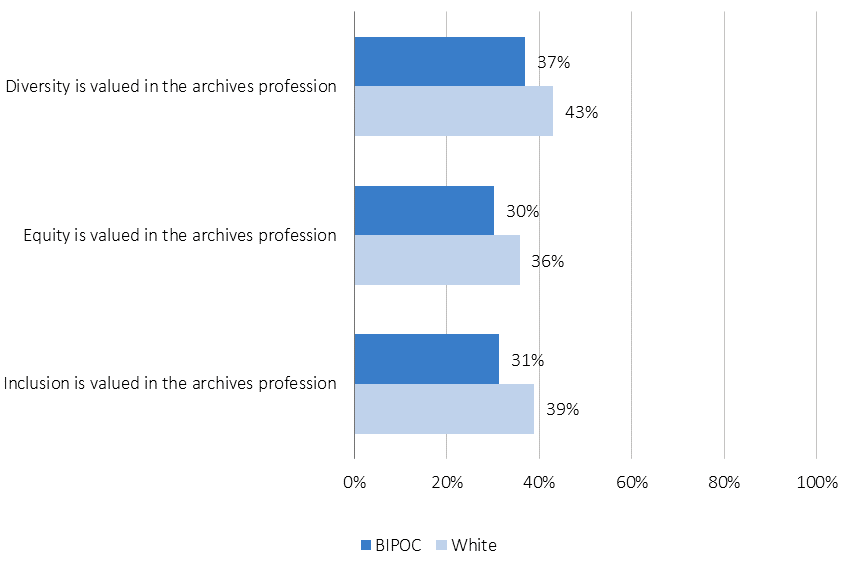
Figure 50 – Please read the following statements and tell us the extent to which you agree or disagree with each. Percentage of respondents that Agree or Disagree with each statement by gender.
Community Archives
Just one percent of survey respondents work in a community archive. A community archive is defined as a documentation of a group of people that share common interests, and social, cultural, and historical heritage, usually created by members of the group being documented and maintained outside of traditional archives. One in five (20 percent) archivists agree that the archives profession is inclusive of community archives compared with 9 percent of respondents who disagree that this is the case.
Respondents are relatively split on whether the challenges and opportunities in community archives are similar to the challenges and opportunities in traditional archives. Fifteen percent of respondents agree that they are similar while 18 percent disagree. In write-in responses, respondents who agree that challenges and opportunities are similar between community and traditional archives point out that most archives face issues regarding funding, staffing, accessibility, sustainability, preservation, and community buy-in regardless of being a community or traditional archives.
Conversely, respondents who disagree point out that while on the surface challenges are similar, the scale and impact of those challenges are vastly different. For example, a lack of funding and staffing does not typically prevent traditional archives from operating, while it may cause community archives to close. These respondents also note that community archives have greater proportions of their archives run by impermanent staff such as volunteers or grant-funded roles, and many have different institutional structures than traditional archives. Some respondents also note perceived advantages of community archives, such as more significant dialogue with the community they serve and sometimes operating as more effective advocates for diverse voices.
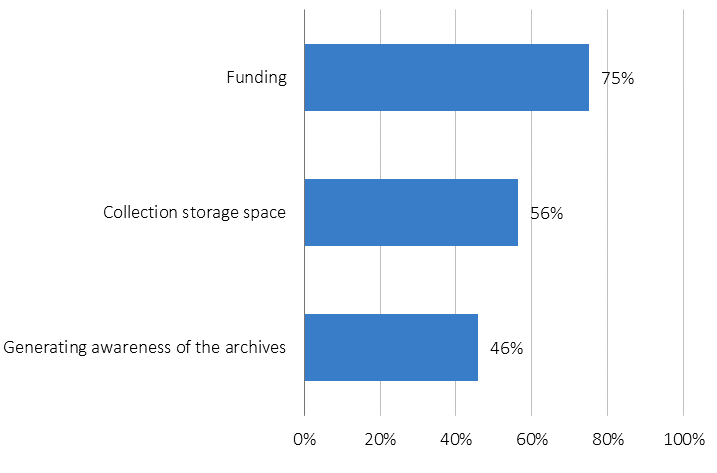
The top three most significant challenges facing community archives right now are funding (75 percent), collection storage space (56 percent), and generating awareness of the archives (46 percent) (see Figure 51).
Figure 51 – You indicated that you work at a community archive. What are the most significant challenges facing your archives? Please select up to three. Percentage of respondents that selected each item; top three choices.
Attrition
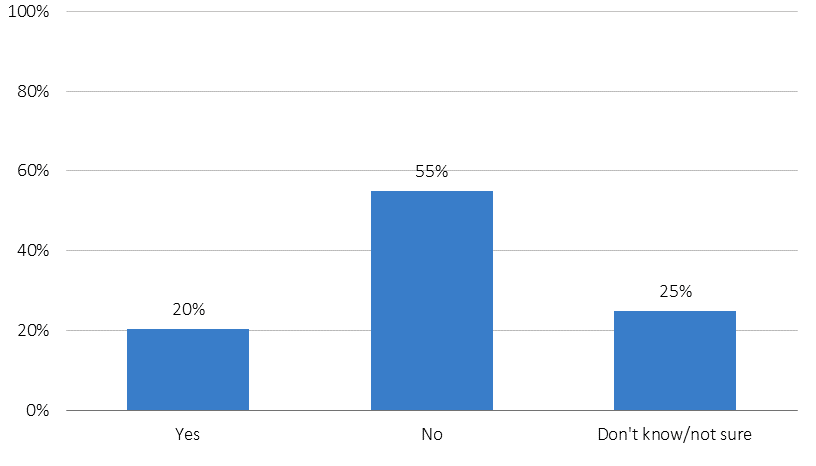
One in five respondents are considering leaving the archives profession within the next five years and an additional one in four are not sure if they will leave or stay, leaving just 55 percent of respondents who are confident they will stay in the archives profession in the next five years (see Figure 52). It is important to contextualize these findings. The All Archivists Survey was fielded in late fall 2021, arguably at the height of the Great Resignation or the Great Reshuffle, which saw staff departing employers at a rapid rate. Further, without being able to directly compare these numbers with other professions, it is difficult to say whether the archives profession is facing higher or lower rates of potential attrition.
Figure 52 – Are you considering leaving the archives profession within the next 5 years? Percentage of respondents that selected each answer choice.
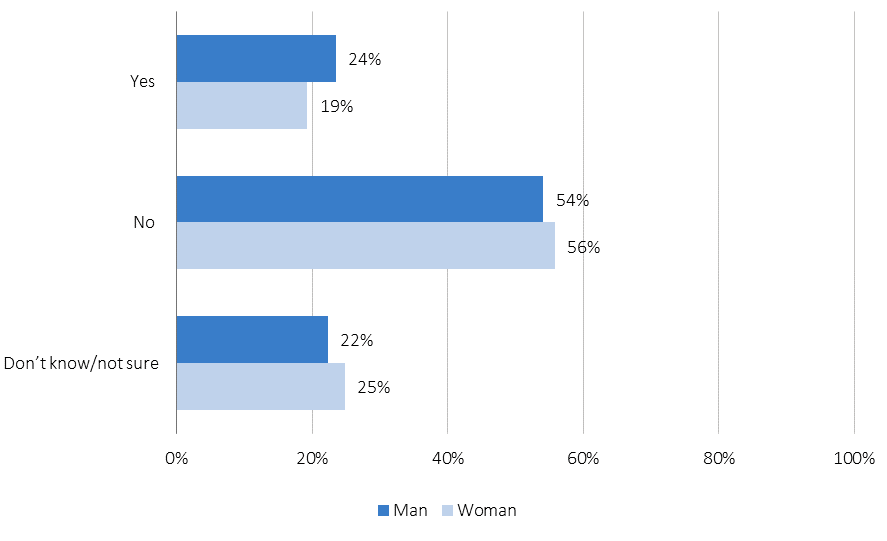
White and BIPOC respondents are just as likely to plan on staying (56 percent and 55 percent respectively) as well as to consider leaving (20 percent and 18 percent respectively). And while there are no major differences by gender in regard to respondents who plan to stay in the archives field, more men (24 percent) are planning to leave compared with women (19 percent) (see Figure 53). This difference is partially explained by retirement. Of respondents who are considering leaving the profession in the next five years, 57 percent of men said they are retiring, compared with only 39 percent of women.
Figure 53 – Are you considering leaving the archives profession within the next 5 years? Percentage of respondents that selected each answer choice by gender.
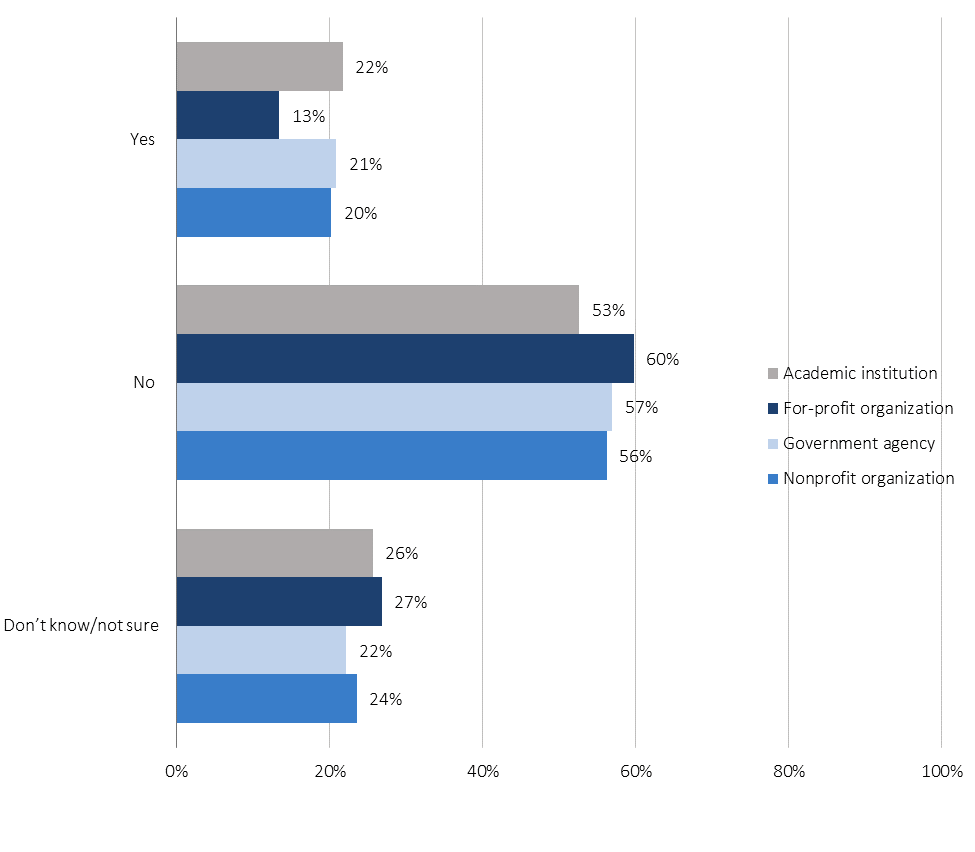
Respondents’ interest in leaving or staying in the archives profession was generally similar across sectors with two notable exceptions. Individuals employed by for-profit organizations (13 percent) are less likely to consider leaving the profession in the next five years compared with most other sectors (see Figure 54). And fewer respondents working at academic institutions (53 percent) plan to stay in the archives profession for five years compared with respondents in the for-profit sector (60 percent), which has the greatest proportion of employees planning to stay in the archives profession.
Figure 54 – Are you considering leaving the archives profession within the next five years? Percentage of respondents that selected each answer choice by sector.
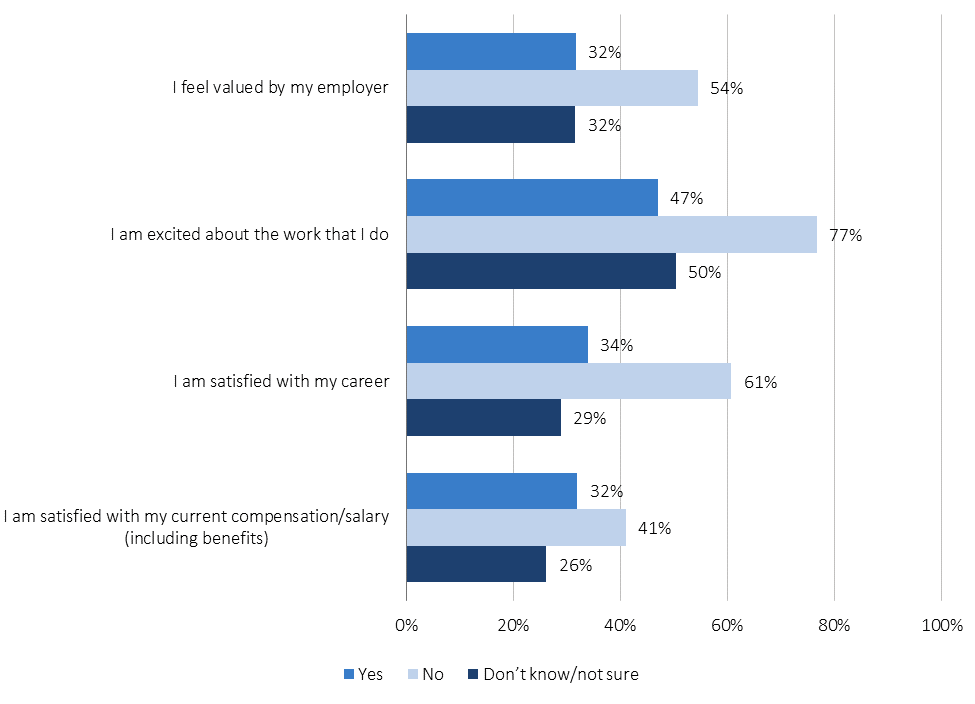
The most important correlation between those who plan to stay in the archives profession for the next five years and those who are considering leaving is whether they are excited about the work they are doing. While 77 percent of respondents planning to stay in the archives profession agree that they are excited about the work they do, only 47 percent of respondents considering leaving are excited about their work (see Figure 55). Intuitively, more people planning to stay (61 percent) are satisfied with their career than those planning to leave (34 percent). Similarly, 54 percent of respondents planning to stay feel valued by their employer compared with only 32 percent of respondents who are considering leaving. Employers that make employees feel valued and provide employees with meaningful work that keeps them engaged will experience less attrition and greater retention than employers that do not successfully do these things.
Figure 55 – To what extent do you agree or disagree with the following statements? Percentage of respondents who Agree with each statement, by whether they are considering leaving the archives profession within the next five years. “Yes” indicates they are planning to leave the profession and “No” indicates they are not planning to leave the profession.
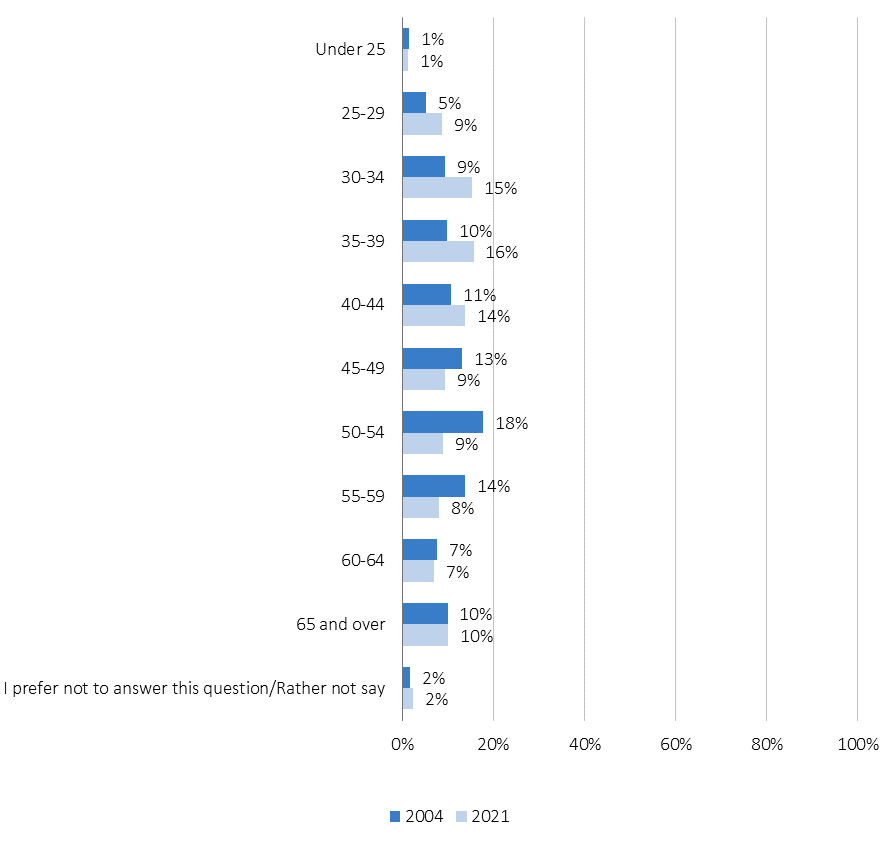
Regardless of whether the archives profession is facing attrition at greater or lower rates compared with other professions, understanding why respondents are considering leaving the archives field is crucial to improving retention. Of individuals who plan to leave the archives field in the next five years, the number one reason is retirement (see Figure 56). This encourages a close look at the age distribution within the archives profession to see if the profession is disproportionately older. However, the archives field has an overall younger population today compared with the original A*CENSUS in 2004 (see Figure 57). Particularly in the 30-34 and 35-39 age brackets, there is a 6 percentage point increase each in the 2021 census compared with 2004. And fewer archivists are in the 50-54 and 55-59 age brackets today compared with 2004. Though the archives profession is younger today than in 2004 overall, the proportion of respondents closest to retirement—those 60 and over (17 percent)—is the same as it was in 2004.
While retirement is the number one reason people may leave the archives profession in the next five years, burnout (35 percent), limited compensation/salary (35 percent), and lack of opportunity for career advancement (33 percent) are also top reasons for considering leaving. The responses do differ based on the demographics of the respondents. While the number one reason men are considering leaving the archives profession is retirement (57 percent), the number one reason women are considering leaving the archives field is burnout (39 percent), which edges out retirement by just 0.5 percentage points. Similarly, while the top reason White respondents plan to leave is retirement (44 percent), the top reason BIPOC respondents give for leaving is limited compensation/salary or better compensation elsewhere (43 percent).
Figure 56 – What are the top reasons you are considering leaving the archives field? Please select all that apply.
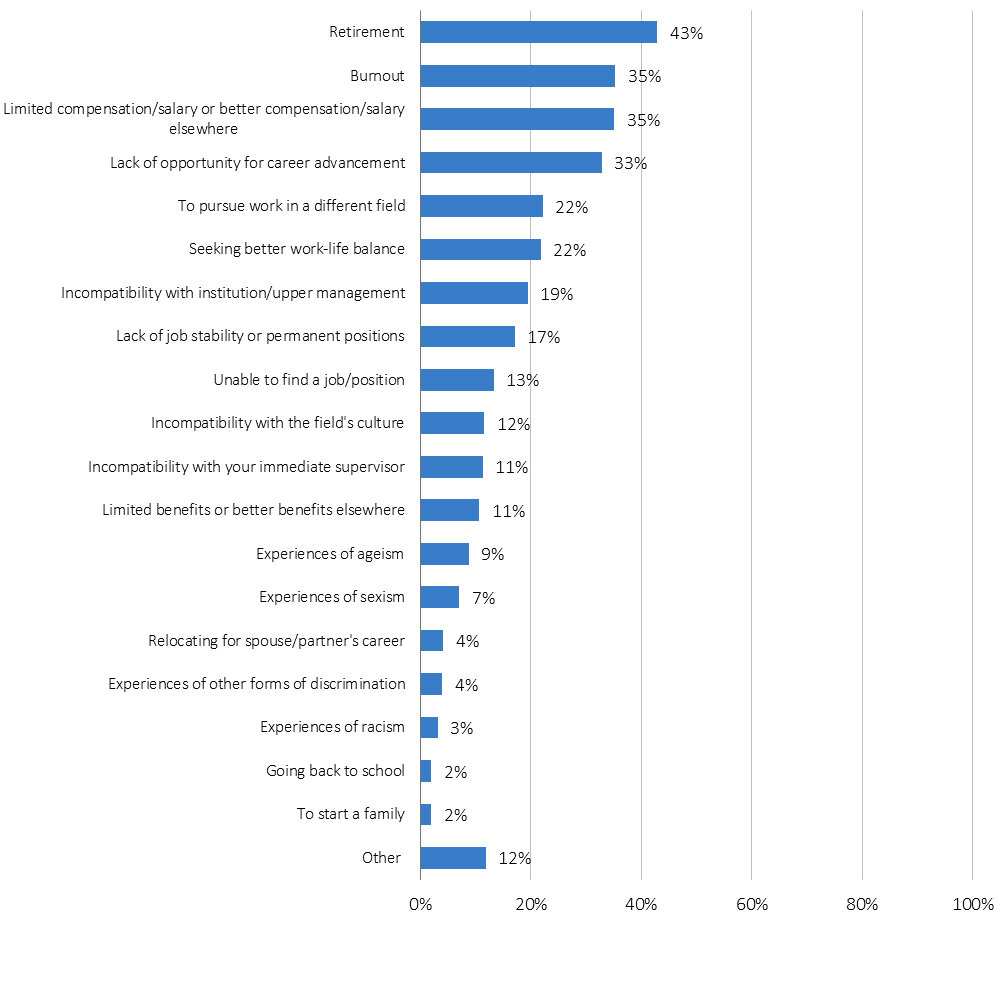
Figure 57 – What is your age? Percentage of respondents that selected each item in 2021 and 2004.
Demographic Changes Over Time
Gender
The archives profession is largely women dominated: 71 percent of respondents are women compared to 23 percent who are men (see Figure 58). This represents an 11 percentage point decrease in the proportion of men in the field and a 6 percentage point increase in the proportion of women in archives since the 2004 A*CENSUS (see Figure 59). The A*CENSUS II introduced non-binary (3 percent) and another option not listed here (0.4 percent) as additional gender answer choices.
Figure 58 – Please indicate your gender(s). Select all that apply.
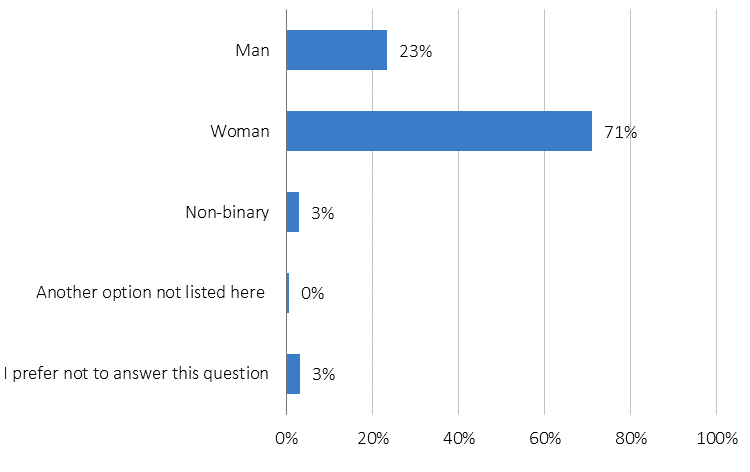
Figure 59 – Please indicate your gender(s). Select all that apply. Percentage of respondents that selected each item in 2021 and 2004.
| Gender(s) | A*CENSUS II 2021 | Gender(s) | A*CENSUS 2004 | Sex | US 2020 Census |
| Man | 23.3% | Male | 34.0% | Male | 49.2% |
| Woman | 71.1% | Female | 64.6% | Female | 50.8% |
| Non-binary | 2.9% | – | – | – | – |
| Another option not listed here | 0.4% | – | – | – | – |
| I prefer not to answer this question | 3.0% | Rather not say, no answer | 1.4% | – | – |
| n | 5,635 | n | 5,134 | n | ~331 million |
| US 2020 Census numbers are taken from this webpage: https://www.census.gov/quickfacts/fact/table/US/POP010220#POP010220. | |||||
There are three times (3.07 ratio) more women than men in the archival profession overall, however, this ratio shifts when we look at respondents’ current position (see Figure 60). Women are slightly overrepresented in individual contributor roles (3.36 ratio) and slightly underrepresented in senior administrator or executive roles (2.44 ratio). The ratio of women to men in manager or supervisor roles, however, is approximately on par with the ratio of all respondents.
Figure 60 – Please select which of the following best describes your current position. Frequency of respondents that selected each item by gender.
| Number of respondents who selected man or woman | Men | Women | Ratio of women to men | |
| All Respondents | 4,812 | 1,182 | 3,630 | 3.07 |
| Individual contributor | 2,740 | 629 | 2,111 | 3.36 |
| Manager or supervisor | 1,256 | 316 | 940 | 2.97 |
| Senior administrator or executive | 816 | 237 | 579 | 2.44 |
Race/ethnicity
The vast majority of the archives profession is White (84 percent) (see Figure 61). Sixteen percent of the profession are BIPOC. While 16 percent is small, it is double the proportion of BIPOC respondents in the 2004 A*CENSUS (8 percent). Asian or Asian American respondents increased from 1 percent in 2004 to 3.6 percent in 2021, representing the largest percent change over time (259 percent increase) (see Figure 62). Hispanic, Latino, Latina, or Latinx individuals increased from 2.1 percent in 2004 to 5.2 percent in 2021, representing the second largest percent change over time (149 percent increase). White respondents saw the largest decrease of any race/ethnicity category since 2004, however, this was relatively small (4 percent decrease). A*CENSUS II introduced Middle Eastern or Northern African (0.7 percent) as an additional race/ethnicity answer choice.
By comparing the race/ethnicity survey results to the US 2020 CENSUS we can estimate which groups are over and underrepresented within the archives profession. While 71 percent of the US is White, 84.4 percent of the All Archivists Survey respondents are White. All BIPOC categories are underrepresented. Individuals who are Hispanic, Latino, Latina, or Latinx are the most underrepresented, with just 5.2 percent of respondents selecting this category compared with the national proportion of 18.7 percent. Respondents who are Black or African American are the second most underrepresented group, with only 4.5 percent of archivists selecting this category even though 14.2 percent of the US population is Black or African American.
Figure 61 – Please indicate your race-ethnicity(ies). Select all that apply.
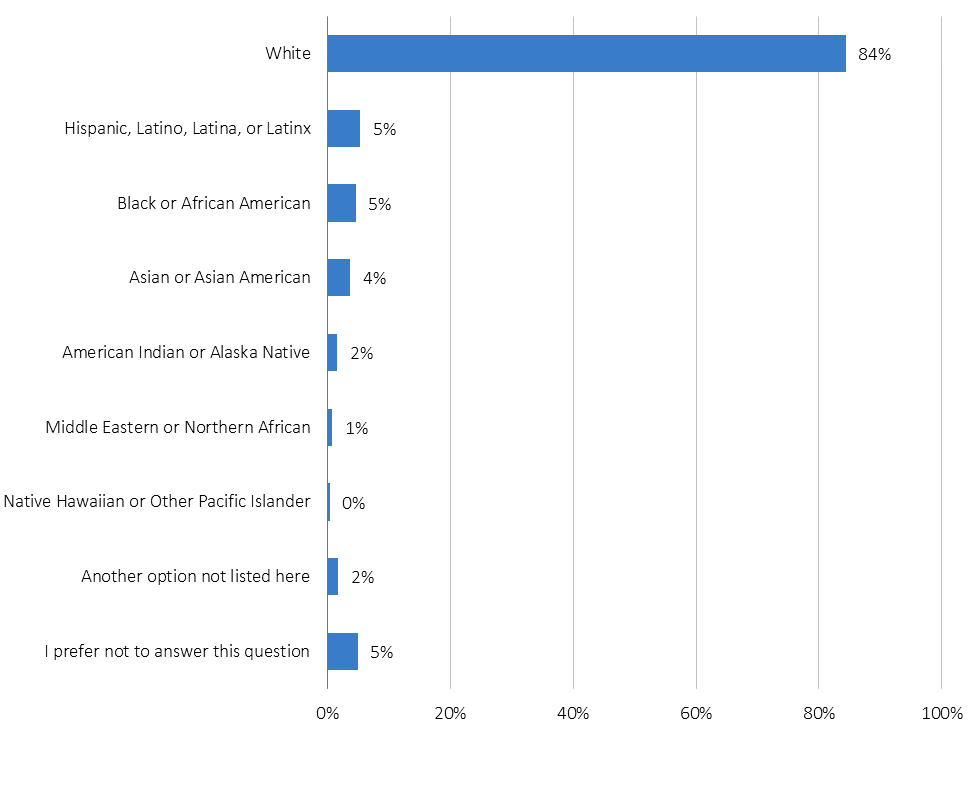
Figure 62 – Please indicate your race-ethnicity(ies). Select all that apply. Percentage of respondents that selected each item in 2021 and 2004.
*NOTE: The 2021 A*CENSUS II survey had one option that included both American Indian or Alaska Native whereas the 2004 A*CENSUS had two options, one for Native American and one for Alaska Native.
| Race-ethnicity(ies) | A*CENSUS II 2021 | Race-ethnicity(ies) | A*CENSUS 2004 | Race by Ethnicity & Hispanic Origin | US 2020 Census |
| American Indian or Alaska Native* | 1.50% | Alaska Native | 0.10% | American Indian and Alaska Native | 2.90% |
| (See above) | (See above) | Native American | 1.90% | (See above) | (See above) |
| Asian or Asian American | 3.60% | Asian | 1.00% | Asian | 7.20% |
| Black or African American | 4.50% | African American | 2.80% | Black or African American | 14.20% |
| Hispanic, Latino, Latina, or Latinx | 5.20% | Latino/Hispanic | 2.10% | Hispanic or Latino | 18.70% |
| Middle Eastern or Northern African | 0.70% | – | – | – | – |
| Native Hawaiian or Other Pacific Islander | 0.30% | Pacific Islander | 0.40% | Native Hawaiian and Other Pacific Islander | 0.50% |
| White | 84.40% | White/Caucasian | 87.70% | White | 71% |
| Another option not listed here | 1.70% | Other | 2.90% | Some Other Race | 15.10% |
| I prefer not to answer this question | 4.90% | Rather not say | 5.00% | – | – |
| n | 5,630 | n | 5,133 | n | ~331 million |
There are nearly six times (5.63) more White individuals than BIPOC individuals in the archives profession. However, this ratio changes when we look at employment level (see Figure 63). BIPOC respondents are overrepresented at the individual contributor level (5.06) and underrepresented at the manager or supervisor level (6.8). BIPOC respondents are more underrepresented at the manager or supervisor level than at the senior administrator or executive level; however, they are slightly underrepresented at the senior administrator or executive level (6.3) as well.
Figure 63 – Please select which of the following best describes your current position. Frequency of respondents that selected each item by race/ethnicity.
| Number of respondents who selected White or a BIPOC race/ethnicity category | BIPOC | White | Ratio of White to BIPOC | |
| All Respondents | 4,802 | 724 | 4,078 | 5.63 |
| Individual contributor | 2,759 | 455 | 2,304 | 5.06 |
| Manager or supervisor | 1,240 | 159 | 1,081 | 6.80 |
| Senior administrator or executive | 803 | 110 | 693 | 6.30 |
Sexual orientation
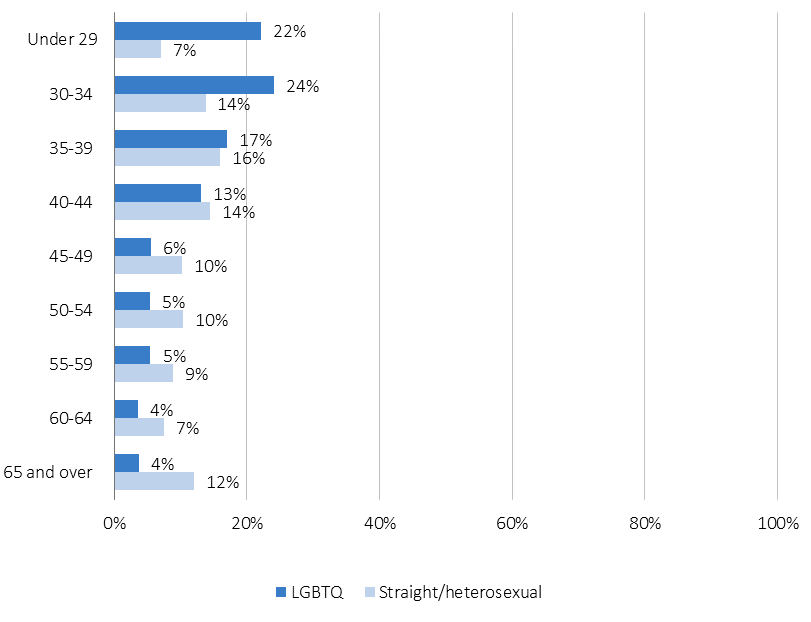
About two-thirds of respondents (69 percent) are straight/heterosexual and one in ten (22 percent) are bisexual/pansexual (see Figure 64). Six percent of respondents are gay/lesbian and 3 percent are asexual. This is a new demographic question in A*CENSUS II, and therefore there is no prior data to compare from the 2004 A*CENSUS. There are nearly four times as many straight/heterosexual respondents as LGBTQ respondents (3.89) (see Figure 65). LGBTQ respondents are overrepresented at the individual contributor level (3.23) and underrepresented at the manager or supervisor level (5.1) and the senior administrator or executive level (5.36). This large ratio difference at management and senior management levels is partially explained because LGBTQ respondents are younger than straight/heterosexual respondents on average. Sixty-three percent of LGBTQ respondents are 39 years old or younger compared with 37 percent of straight/heterosexual respondents in the same age bracket (see Figure 66).
Figure 64 – Please indicate your sexual orientation(s). Select all that apply.
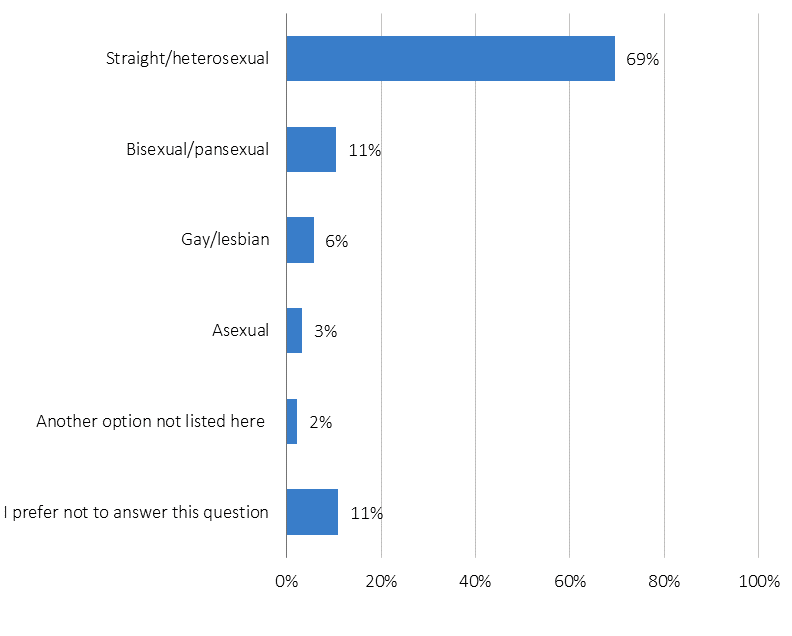
Figure 65 – Please select which of the following best describes your current position. Frequency of respondents that selected each item by sexual orientation.
| Number of respondents who selected straight/ heterosexual or an LGBTQ category | LGBTQ | Straight/ heterosexual | Ratio of straight/ heterosexual to LGBTQ respondents | |
| All Respondents | 4,434 | 907 | 3,527 | 3.89 |
| Individual contributor | 2,549 | 603 | 1,946 | 3.23 |
| Manager or supervisor | 1,134 | 186 | 948 | 5.10 |
| Senior administrator or executive | 751 | 118 | 633 | 5.36 |
Figure 66 – What is your age? Percentage of respondents that selected each item by sexual orientation.
Conclusion
The A*CENSUS II All Archivists Survey provides a snapshot of the archives profession at the end of 2021. Seventeen years after the first A*CENSUS was administered, the All Archivists Survey collected much-needed data in a vastly different world. Respondents were nearing the end of the second year of the COVID-19 pandemic, in the dip between the Delta summer surge and at the very beginning of Omicron’s winter wave. The workplace had shifted substantially from 2004 with strides in technology, a rise in remote work accelerated by the pandemic, and a job market filled with open positions. The period from October to December 2021 was arguably the peak period of employment transitions in the United States, which saw employees leaving old positions and seeking new opportunities at rapid rates.
During this period of protracted adjustment and transition, 5,699 individuals took the time to complete the All Archivists Survey and provide insights into their experiences in the archives profession. They answered 90 questions on their employment, education, professional development needs, salary, student loan debt, and perspectives on key issues in the field, most notably diversity, equity, inclusion, and accessibility. This 90 question census of thousands of people produced a wealth of data and information. Due to the size and scope of the survey, the analysis included in this report necessarily focuses on aggregate findings with select stratifications. It is our hope that the archives profession will continue to dig into the data and unearth further findings. The dataset will be deposited with the SAA Dataverse and made publicly available.
The potential for further analysis is vast. Here are some possible research questions that warrant further investigation:
- How does the profile of near-retired and retired archivists compare to students or early-career career archivists?
- Do years of experience in the archives profession correlate to salary or position level?
- What are the professional development needs of respondents by position level or sector?
- How does average student loan debt upon graduation compare with the salaries of early-career professionals? Who is most likely to take out a student loan to complete a degree?
- How do the experiences of respondents differ by demographics such as sexual orientation, age, or disability?
- How does the profile of respondents who have household income in addition to their salary (e.g. spouse/partner income, financial support/gifts from family, etc.) differ from respondents without additional household income?
- What are the salaries and benefits of union versus non-union respondents?
- To what extent do benefits differ by institutional type? Or by position level?
- What are the differences in experiences for archivists based on geography?
These are just a few of the possible areas for further analysis. And even more crucial than the analysis itself is how the archives profession will translate these findings into evidence-based actions that benefit the field. The All Archivists Survey and this accompanying report provide a starting point from which the archives profession will determine the best path forward through iterative change. The archivists and memory workers who participated in this survey provided data that help us understand not only how far the archives profession has come, but where it wants and needs to go in the coming years.
Appendix: Aggregate Charts and Tables
The A*CENSUS II All Archivists Survey contains 90 survey questions. The aggregate findings of each survey question are included in a graph and table below, with the exception of open-ended questions, which have been removed to preserve anonymity. As you explore the graphs and tables below, please keep in mind that these are the aggregate findings, and thus large majorities within the archives profession may obscure the trends and patterns of respondents who make up a smaller proportion of the archives profession. Importantly, the majority of All Archivists Survey respondents are White (84 percent), employed full-time (81 percent), women (71 percent), and straight/heterosexual (69 percent). Further stratification analysis may be needed to provide a more nuanced understanding of the results below.
Figure 67 – Please indicate if you are currently doing any of the following in regard to archival and/or memory work. Please select all that apply. (Q1) Percentage of respondents that selected each response option.
| Answer | Frequency | Percentage |
| Working as an archivist or memory worker | 3,761 | 66.0% |
| Managing a unit or department that employs archivists or memory workers | 1,001 | 17.6% |
| Working in another profession or occupation, but with archives-related responsibilities | 703 | 12.3% |
| Working as a technical or support staff member with archives-related responsibilities | 529 | 9.3% |
| Seeking employment as an archivist or memory worker | 426 | 7.5% |
| Volunteering as an archivist or memory worker | 284 | 5.0% |
| Studying to be an archivist | 226 | 4.0% |
| Retired from an archives-related position or career | 221 | 3.9% |
| Administering a program serving archival interests but not working directly with archival records (e.g., granting agency, education provider, professional association) | 161 | 2.8% |
| Teaching in a graduate archival education program | 127 | 2.2% |
| Other (please specify): | 249 | 4.4% |
Figure 68 – Please indicate the state or territory in which you work. If you are not currently employed, indicate where you reside. (Q2)
| Answer | Frequency | Percentage |
| California | 595 | 10.44% |
| New York | 533 | 9.35% |
| Massachusetts | 342 | 6.00% |
| Texas | 306 | 5.37% |
| District of Columbia | 252 | 4.42% |
| Maryland | 252 | 4.42% |
| Illinois | 246 | 4.32% |
| Pennsylvania | 225 | 3.95% |
| Missouri | 224 | 3.93% |
| Ohio | 182 | 3.19% |
| Michigan | 172 | 3.02% |
| Virginia | 166 | 2.91% |
| Georgia | 159 | 2.79% |
| Washington | 136 | 2.39% |
| North Carolina | 133 | 2.33% |
| Florida | 114 | 2.00% |
| Minnesota | 112 | 1.97% |
| Colorado | 108 | 1.90% |
| Connecticut | 97 | 1.70% |
| Indiana | 87 | 1.53% |
| Wisconsin | 84 | 1.47% |
| New Jersey | 82 | 1.44% |
| Oregon | 80 | 1.40% |
| Kentucky | 78 | 1.37% |
| Utah | 74 | 1.30% |
| Arizona | 67 | 1.18% |
| Louisiana | 62 | 1.09% |
| Tennessee | 62 | 1.09% |
| South Carolina | 61 | 1.07% |
| Kansas | 51 | 0.89% |
| New Mexico | 47 | 0.82% |
| Iowa | 46 | 0.81% |
| Alabama | 44 | 0.77% |
| Arkansas | 36 | 0.63% |
| Oklahoma | 36 | 0.63% |
| Maine | 32 | 0.56% |
| Other | 316 | 5.55% |
Figure 69 – Which of the following describes your current employment status? Please select all that apply. (Q3)
| Answer | Frequency | Percentage |
| Employed, full time | 80.86% | 4601 |
| Employed, part time | 8.93% | 508 |
| Retired from an archives-related position or career | 3.85% | 219 |
| Volunteer | 3.51% | 200 |
| Student | 3.51% | 200 |
| Self-employed | 2.62% | 149 |
| Unemployed, seeking full-time work | 1.83% | 104 |
| Unemployed, seeking part-time work | 0.95% | 54 |
| Retired from a non-archives related position or career | 0.72% | 41 |
| Intern, paid | 0.70% | 40 |
| Intern, unpaid | 0.37% | 21 |
| Other (please specify): | 2.11% | 120 |
| I prefer not to answer this question | 0.12% | 7 |
Figure 70 – At what age did you retire? If you do not want to answer this question, you may leave the box blank. (Q4)
| Min Answer | Max Answer | Median Answer | Count |
| 37 | 79 | 65 | 206 |
Figure 71 – Which of the following best describes your student status? (Q5)
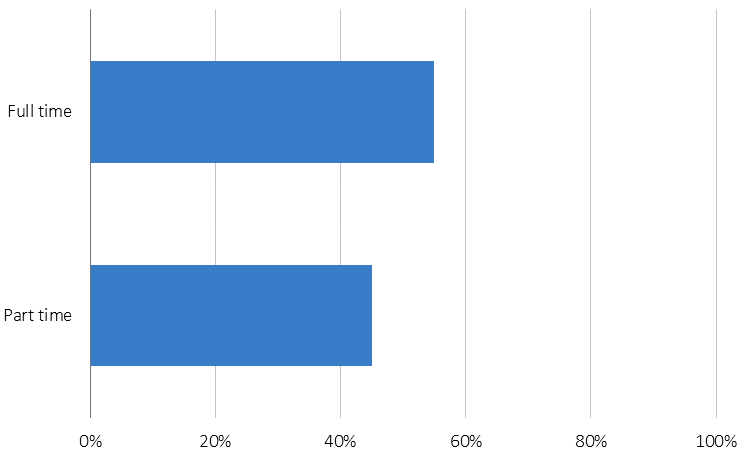
| Answer | Frequency | Percentage |
| Full time | 110 | 55.00% |
| Part time | 90 | 45.00% |
Figure 72 – You indicated that you are employed part-time. How many part-time positions do you currently hold? (Q6)
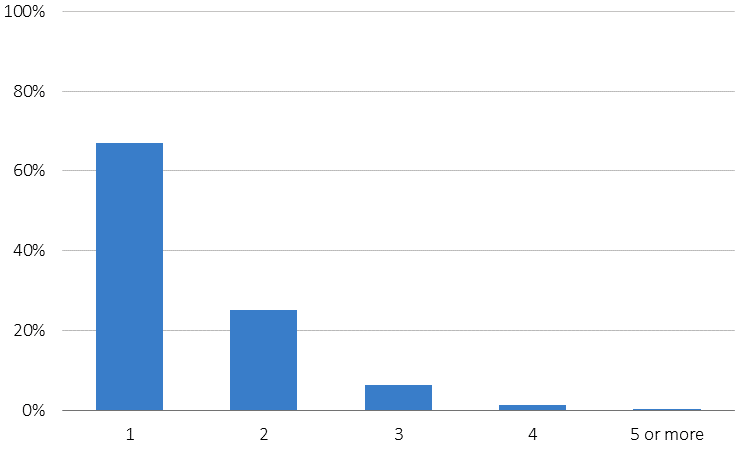
| Answer | Frequency | Percentage |
| 1 | 340 | 66.93% |
| 2 | 127 | 25.00% |
| 3 | 32 | 6.30% |
| 4 | 7 | 1.38% |
| 5 or more | 2 | 0.39% |
Figure 73 – You indicated that you are employed part-time. Are you currently seeking full-time work? (Q7)

| Answer | Frequency | Percentage |
| Yes | 174 | 34.80% |
| No | 270 | 54.00% |
| Don’t know/not sure | 56 | 11.20% |
Figure 74 – Which of the following best describes your current job type? (Q8)
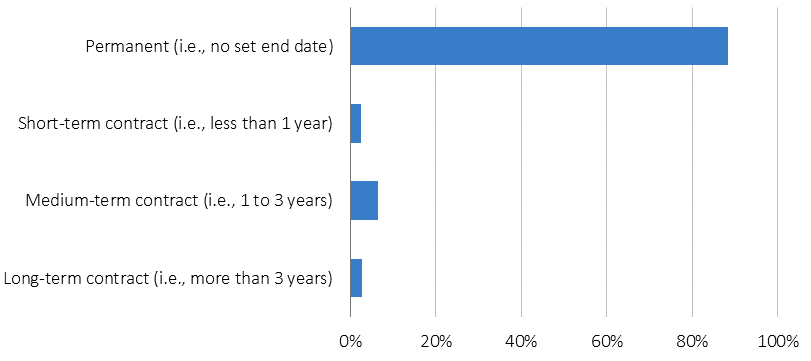
| Answer | Frequency | Percentage |
| Permanent (i.e., no set end date) | 4670 | 88.51% |
| Short-term contract (i.e., less than 1 year) | 132 | 2.50% |
| Medium-term contract (i.e., 1 to 3 years) | 335 | 6.35% |
| Long-term contract (i.e., more than 3 years) | 139 | 2.63% |
Figure 75 – Which of the following best describes your pay type? (Q9)
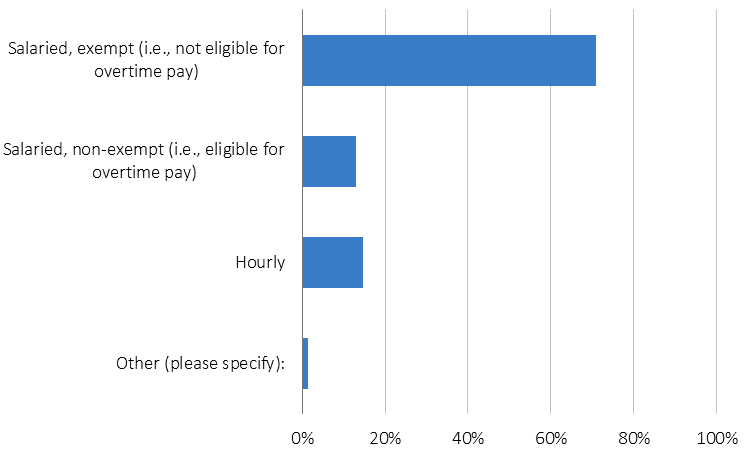
| Answer | Frequency | Percentage |
| Salaried, exempt (i.e., not eligible for overtime pay) | 3311 | 70.93% |
| Salaried, non-exempt (i.e., eligible for overtime pay) | 604 | 12.94% |
| Hourly | 689 | 14.76% |
| Other (please specify): | 64 | 1.37% |
Figure 76 – You indicated that you are currently in a full-time permanent position. In addition to, or prior to your current position, have you been in any of the following position types in an archives-related position since January 1, 2017? Please select all that apply. (Q10)
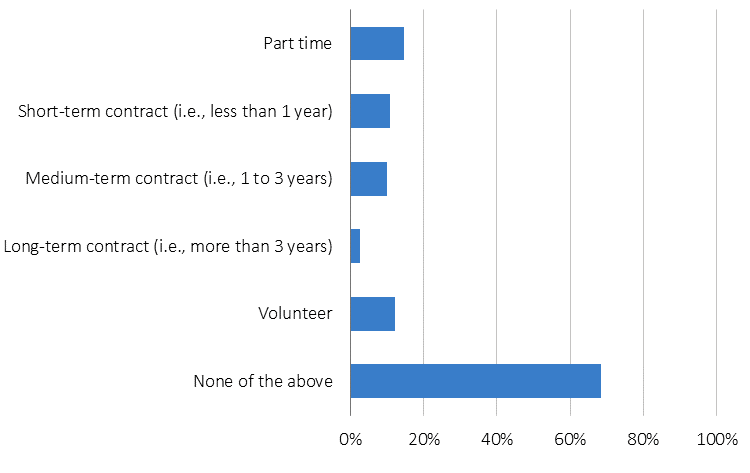
| Answer | Frequency | Percentage |
| Part time | 586 | 14.62% |
| Short-term contract (i.e., less than 1 year) | 428 | 10.68% |
| Medium-term contract (i.e., 1 to 3 years) | 395 | 9.86% |
| Long-term contract (i.e., more than 3 years) | 100 | 2.50% |
| Volunteer | 486 | 12.13% |
| None of the above | 2,744 | 68.46% |
Figure 77 – You indicated that, prior to your current position, you were employed in the following position type(s). At any point during or after your work in that role, have you had a full-time permanent position with the same employer? (Q11)
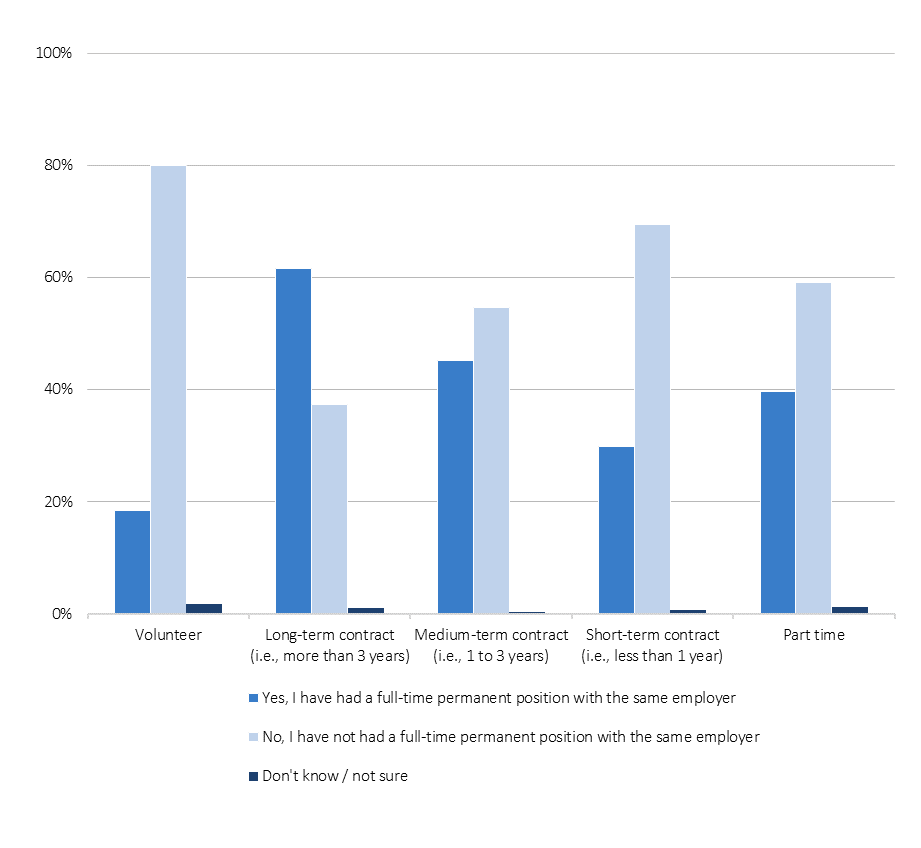
| Answer | Yes, I have had a full-time permanent position with the same employer – Frequency | Yes, I have had a full-time permanent position with the same employer – Percentage | No, I have not had a full-time permanent position with the same employer – Frequency | No, I have not had a full-time permanent position with the same employer – Percentage | Don’t know / not sure – Frequency | Don’t know / not sure – Percentage |
| Part time | 229 | 39.69% | 341 | 59.10% | 7 | 1.21% |
| Short-term contract (i.e., less than 1 year) | 126 | 29.86% | 293 | 69.43% | 3 | 0.71% |
| Medium-term contract (i.e., 1 to 3 years) | 177 | 45.15% | 214 | 54.59% | 1 | 0.26% |
| Long-term contract (i.e., more than 3 years) | 61 | 61.62% | 37 | 37.37% | 1 | 1.01% |
| Volunteer | 88 | 18.41% | 382 | 79.92% | 8 | 1.67% |
Figure 78 – When you were hired by your current employer, did you relocate to accept the offer? (Q12)
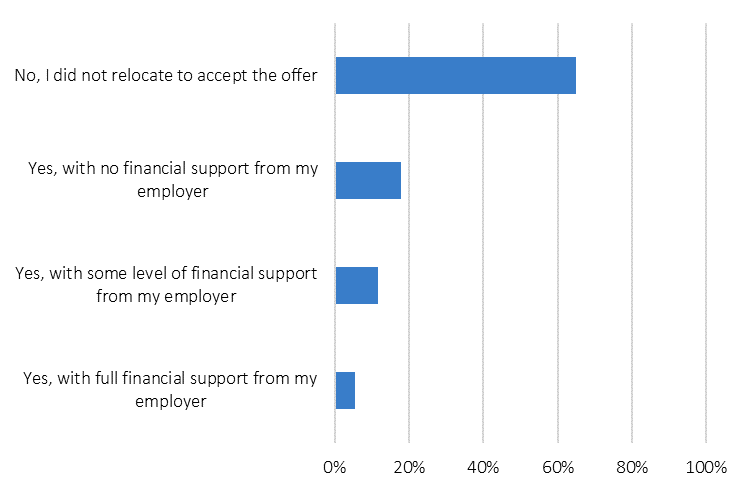
| Answer | Frequency | Percentage |
| Yes, with full financial support from my employer | 287 | 5.44% |
| Yes, with some level of financial support from my employer | 619 | 11.73% |
| Yes, with no financial support from my employer | 941 | 17.83% |
| No, I did not relocate to accept the offer | 3431 | 65.01% |
Figure 79 – Are you a member of a union? (Q13)
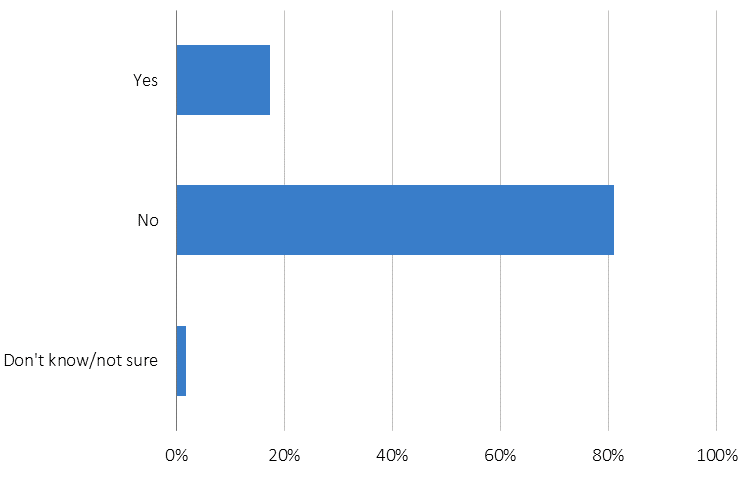
| Answer | Frequency | Percentage |
| Yes | 927 | 17.33% |
| No | 4328 | 80.93% |
| Don’t know/not sure | 93 | 1.74% |
Figure 80 – Are you interested in becoming a member of a union? (Q14)
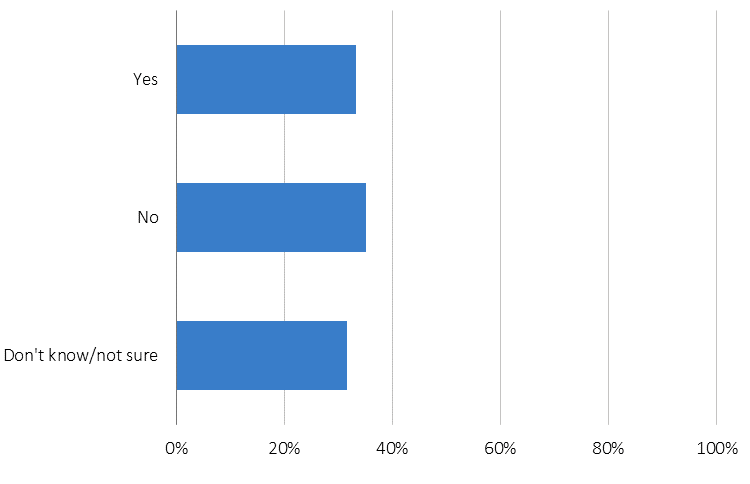
| Answer | Frequency | Percentage |
| Yes | 1463 | 33.22% |
| No | 1546 | 35.10% |
| Don’t know/not sure | 1395 | 31.68% |
Figure 81 – On average, how many total hours per week do you work? If you do not want to answer this question, you may leave the box blank. (Q15)
| Min Answer | Max Answer | Median Answer | Count |
| 4 | 90 | 40 | 4,973 |
Figure 82 – Which of the following best describes your current employer? (Q16)
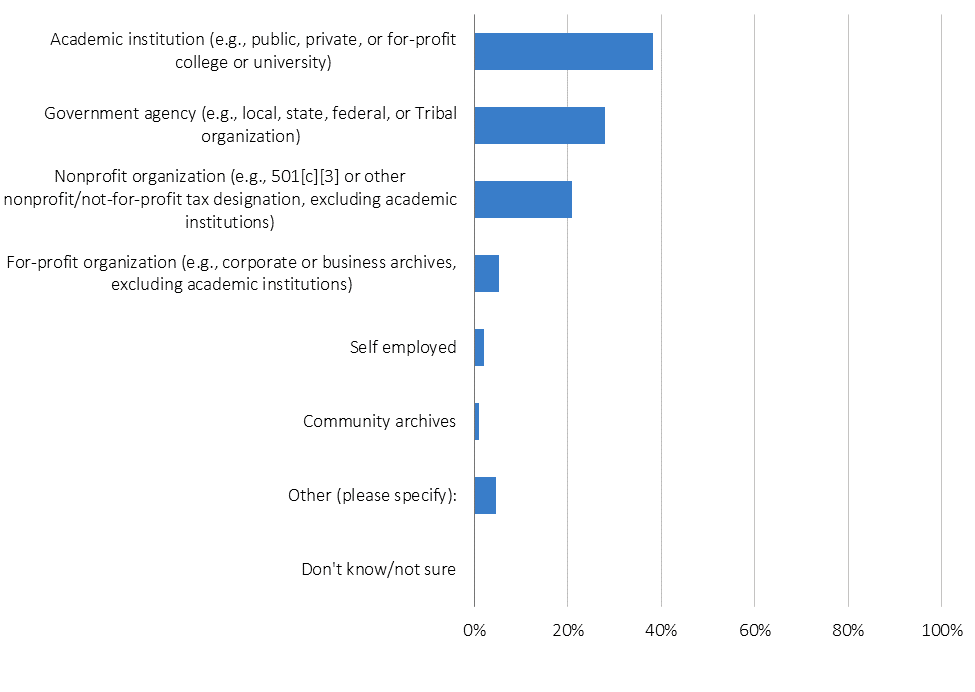
| Answer | Frequency | Percentage |
| Academic institution (e.g., public, private, or for-profit college or university) | 2,046 | 38.19% |
| Government agency (e.g., local, state, federal, or Tribal organization) | 1,498 | 27.96% |
| Nonprofit organization (e.g., 501[c][3] or other nonprofit/not-for-profit tax designation, excluding academic institutions) | 1,121 | 20.93% |
| For-profit organization (e.g., corporate or business archives, excluding academic institutions) | 286 | 5.34% |
| Community archives | 51 | 0.95% |
| Self employed | 106 | 1.98% |
| Other (please specify): | 245 | 4.57% |
| Don’t know/not sure | 4 | 0.07% |
Figure 83 – Which of the following best describes the academic institution that is your current employer? (Q17)
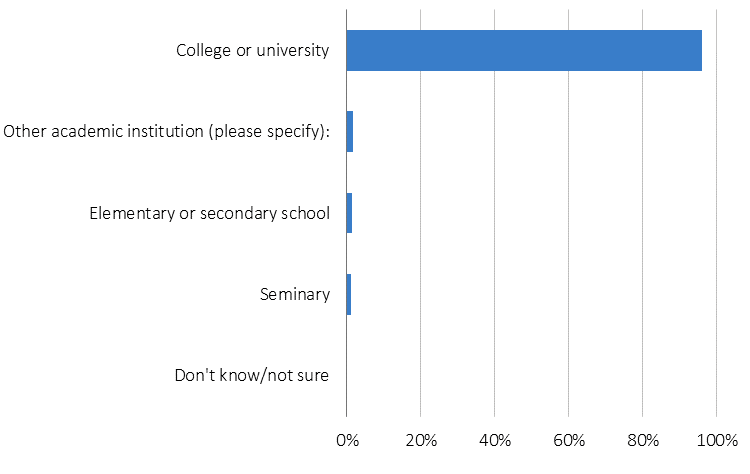
| Answer | Frequency | Percentage |
| College or university | 1967 | 96.14% |
| Other academic institution (please specify): | 32 | 1.56% |
| Elementary or secondary school | 26 | 1.27% |
| Seminary | 21 | 1.03% |
| Don’t know/not sure | 0 | 0.00% |
Figure 84 – Is your current employer a Tribal college or university? (Q18)
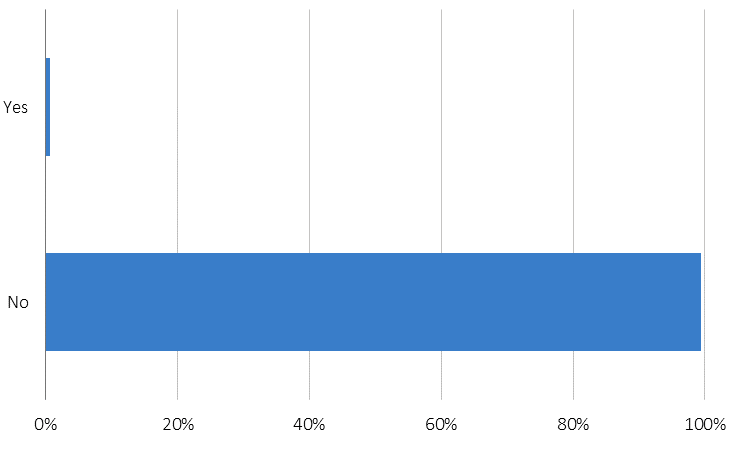
| Answer | Frequency | Percentage |
| Yes | 11 | 0.6% |
| No | 1,953 | 99.44% |
Figure 85 – Is your current employer a historically black college or university (HBCU)? (Q19)
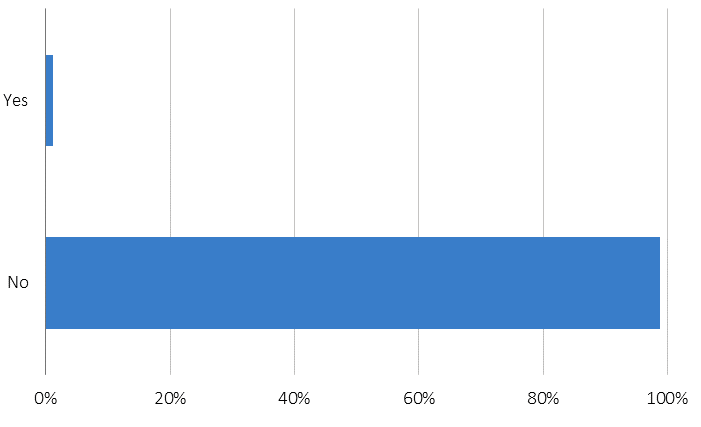
| Answer | Frequency | Percentage |
| Yes | 24 | 1.2% |
| No | 1,939 | 98.78% |
Figure 86 – Which of the following best describes the college or university that is your current employer? (Q20)
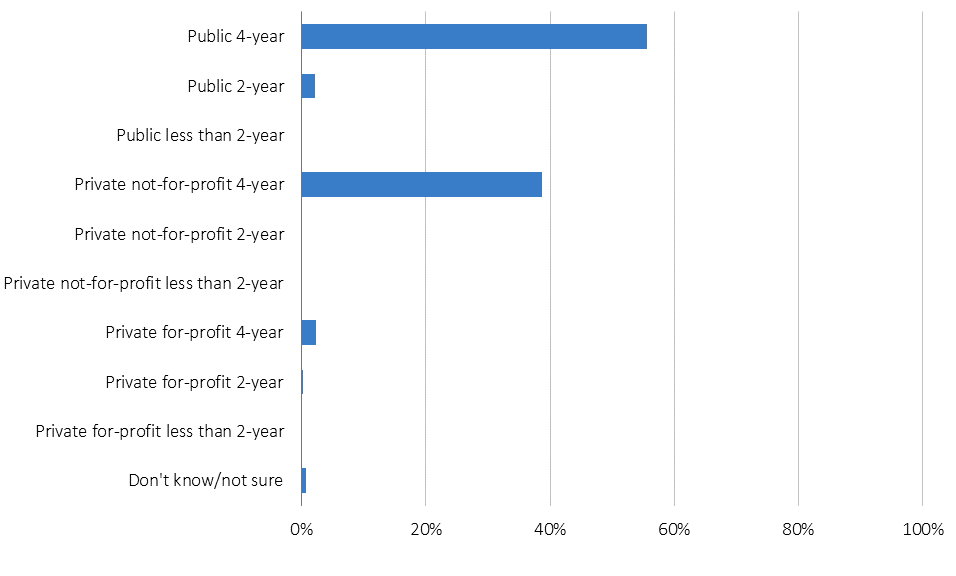
| Answer | Frequency | Percentage |
| Public 4-year | 1095 | 55.67% |
| Public 2-year | 42 | 2.14% |
| Public less than 2-year | 0 | 0.00% |
| Private not-for-profit 4-year | 762 | 38.74% |
| Private not-for-profit 2-year | 3 | 0.15% |
| Private not-for-profit less than 2-year | 0 | 0.00% |
| Private for-profit 4-year | 46 | 2.34% |
| Private for-profit 2-year | 4 | 0.20% |
| Private for-profit less than 2-year | 1 | 0.05% |
| Don’t know/not sure | 14 | 0.71% |
Figure 87 – Which of the following best describes the functional unit within the academic institution that is your current employer? (Q21)
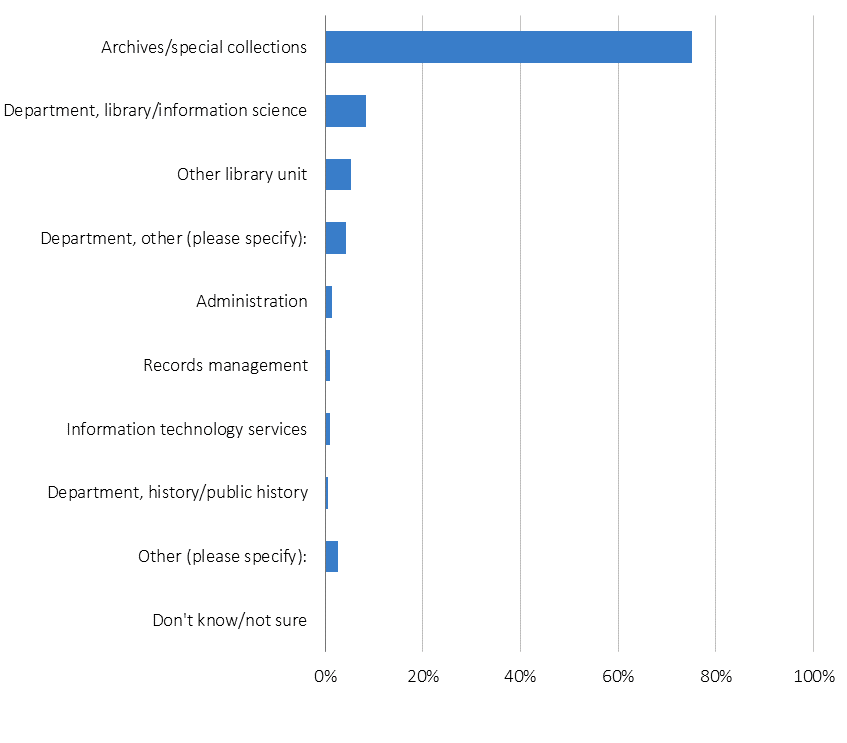
| Answer | Frequency | Percentage |
| Archives/special collections | 1,537 | 75.20% |
| Department, library/information science | 173 | 8.46% |
| Other library unit | 107 | 5.23% |
| Department, other (please specify): | 86 | 4.21% |
| Administration | 30 | 1.47% |
| Records management | 21 | 1.03% |
| Information technology services | 19 | 0.93% |
| Department, history/public history | 11 | 0.54% |
| Other (please specify): | 54 | 2.64% |
| Don’t know/not sure | 6 | 0.29% |
Figure 88 – Which of the following best describes the level of the government agency that is your current employer? (Q22)
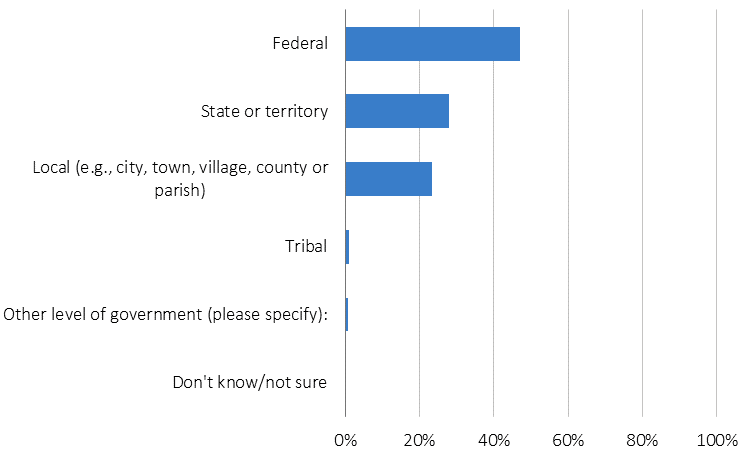
| Answer | Frequency | Percentage |
| Federal | 705 | 47.06% |
| State or territory | 417 | 27.84% |
| Local (e.g., city, town, village, county, or parish) | 350 | 23.36% |
| Tribal | 14 | 0.93% |
| Other level of government (please specify): | 11 | 0.73% |
| Don’t know/not sure | 1 | 0.07% |
Figure 89 – Which of the following best describes the type of government agency that is your current employer? Please select all that apply. (Q23)
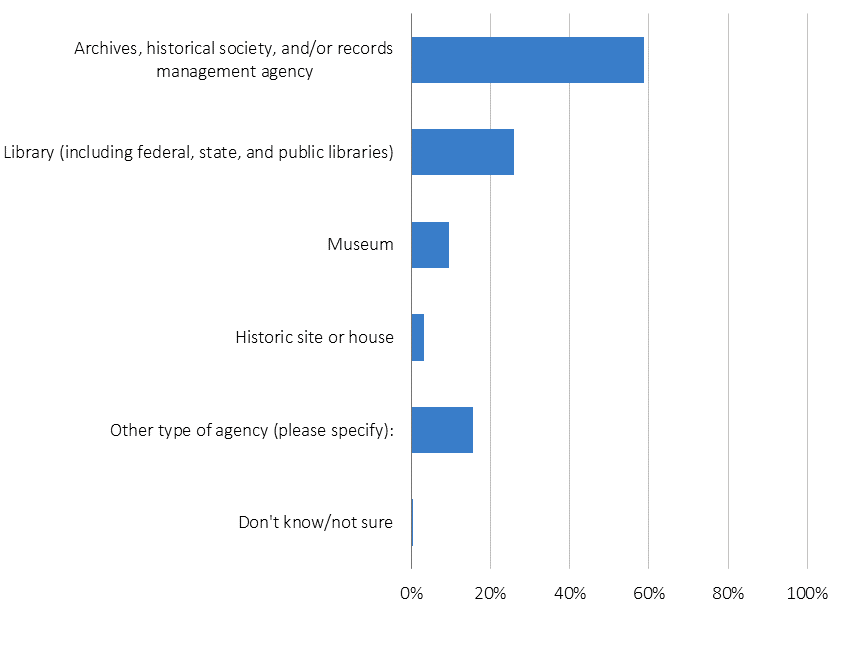
| Answer | Frequency | Percentage |
| Archives, historical society, and/or records management agency | 871 | 58.73% |
| Library (including federal, state, and public libraries) | 386 | 26.03% |
| Museum | 142 | 9.58% |
| Historic site or house | 46 | 3.10% |
| Other type of agency (please specify): | 230 | 15.51% |
| Don’t know/not sure | 7 | 0.47% |
Figure 90 – Which of the following best describes the nonprofit organization that is your current employer? Please select all that apply. (Q24)
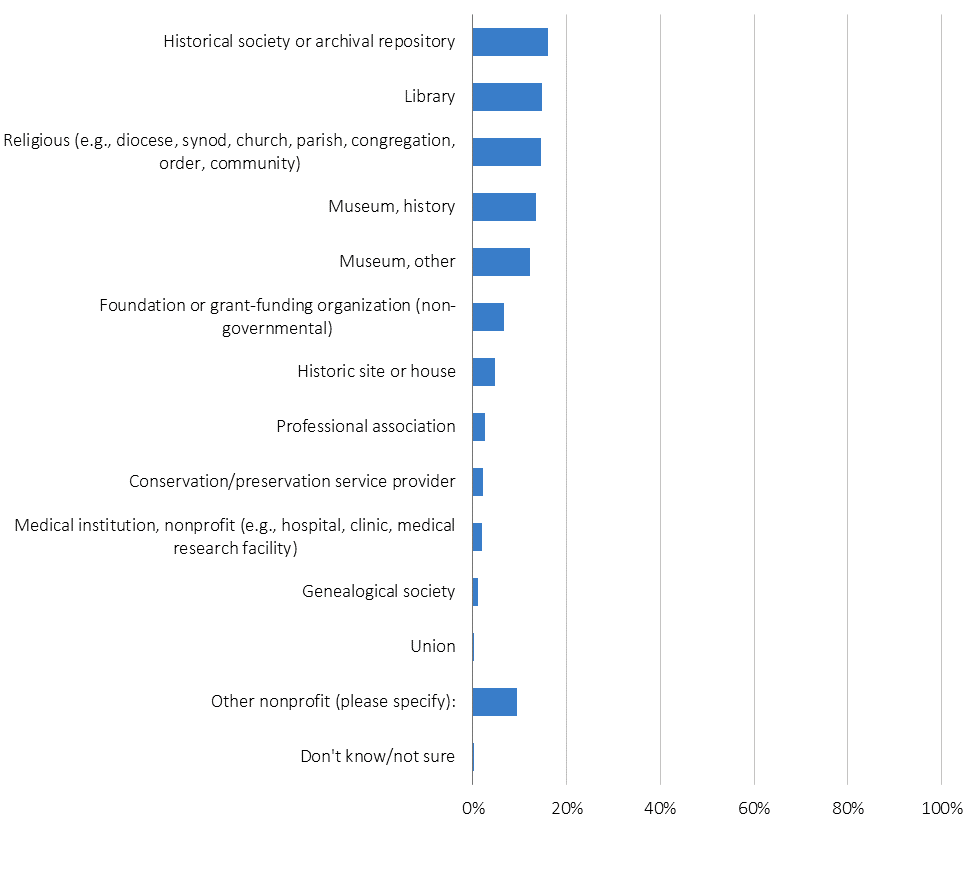
| Answer | Frequency | Percentage |
| Historical society or archival repository | 247 | 16.08% |
| Library | 228 | 14.84% |
| Religious (e.g., diocese, synod, church, parish, congregation, order, community) | 224 | 14.58% |
| Museum, history | 208 | 13.54% |
| Museum, other | 187 | 12.17% |
| Foundation or grant-funding organization (non-governmental) | 101 | 6.58% |
| Historic site or house | 73 | 4.75% |
| Professional association | 38 | 2.47% |
| Conservation/preservation service provider | 32 | 2.08% |
| Medical institution, nonprofit (e.g., hospital, clinic, medical research facility) | 31 | 2.02% |
| Genealogical society | 17 | 1.11% |
| Union | 3 | 0.20% |
| Other nonprofit (please specify): | 143 | 9.31% |
| Don’t know/not sure | 4 | 0.26% |
Figure 91 – Which of the following best describes the for-profit organization that is your current employer? (Q25)
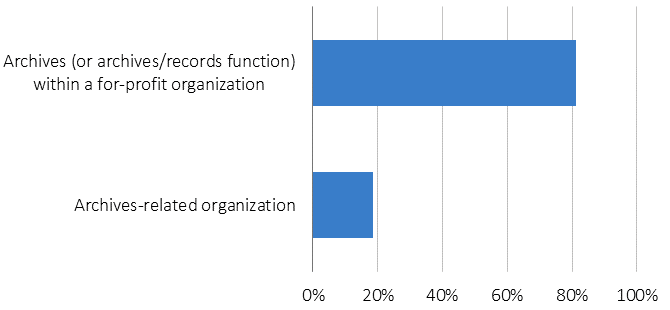
| Answer | Frequency | Percentage |
| Archives (or archives/records function) within a for-profit organization | 222 | 81.32% |
| Archives-related organization | 51 | 18.68% |
Figure 92 – Which of the following best describes the for-profit organization that is your current employer? Of respondents who answered “Archives-related organization” to Q25. (Q25a)
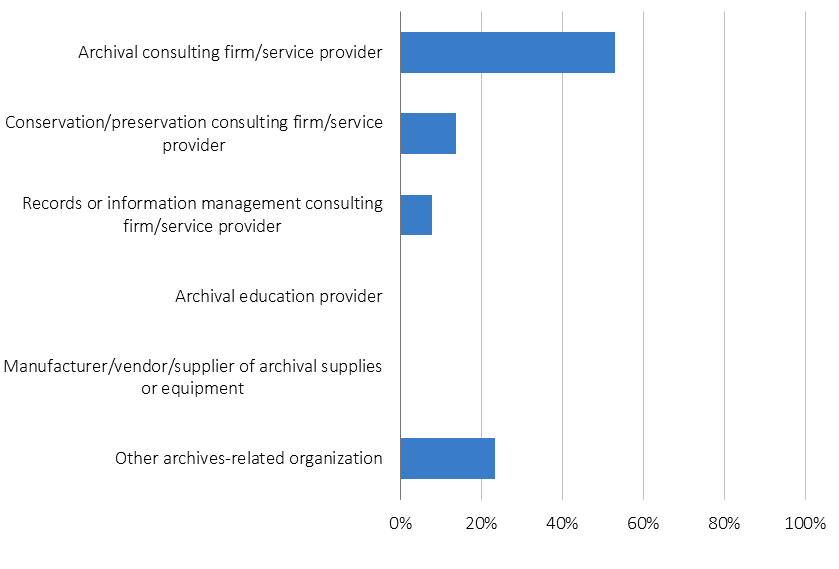
| Answer | Frequency | Percentage |
| Archival consulting firm/service provider | 27 | 52.94% |
| Conservation/preservation consulting firm/service provider | 7 | 13.73% |
| Records or information management consulting firm/service provider | 4 | 7.84% |
| Archival education provider | 0 | 0.00% |
| Manufacturer/vendor/supplier of archival supplies or equipment | 0 | 0.00% |
| Other archives-related organization | 12 | 23.53% |
Figure 93 – Which of the following best describes the for-profit organization that is your current employer? Of respondents who answered “Archives (or archives/records function) within a for-profit organization” to Q25. (Q25b)
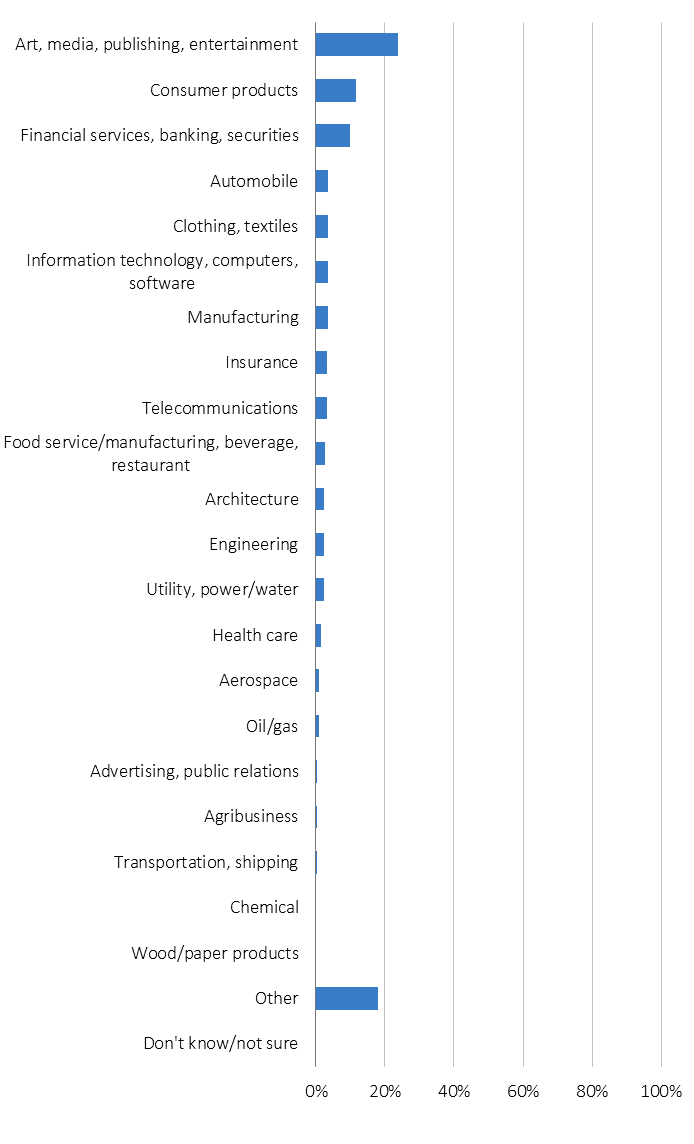
| Answer | Frequency | Percentage |
| Art, media, publishing, entertainment | 53 | 24% |
| Consumer products | 26 | 12% |
| Financial services, banking, securities | 22 | 10% |
| Automobile | 8 | 4% |
| Clothing, textiles | 8 | 4% |
| Information technology, computers, software | 8 | 4% |
| Manufacturing | 8 | 4% |
| Insurance | 7 | 3% |
| Telecommunications | 7 | 3% |
| Food service/manufacturing, beverage, restaurant | 6 | 3% |
| Architecture | 5 | 2% |
| Engineering | 5 | 2% |
| Utility, power/water | 5 | 2% |
| Health care | 3 | 1% |
| Aerospace | 2 | 1% |
| Oil/gas | 2 | 1% |
| Advertising, public relations | 1 | 0% |
| Agribusiness | 1 | 0% |
| Transportation, shipping | 1 | 0% |
| Chemical | 0 | 0% |
| Wood/paper products | 0 | 0% |
| Other | 40 | 18% |
| Don’t know/not sure | 0 | 0% |
Figure 94 – Which of the following best describes the focus of your self-employed work? (Q26)
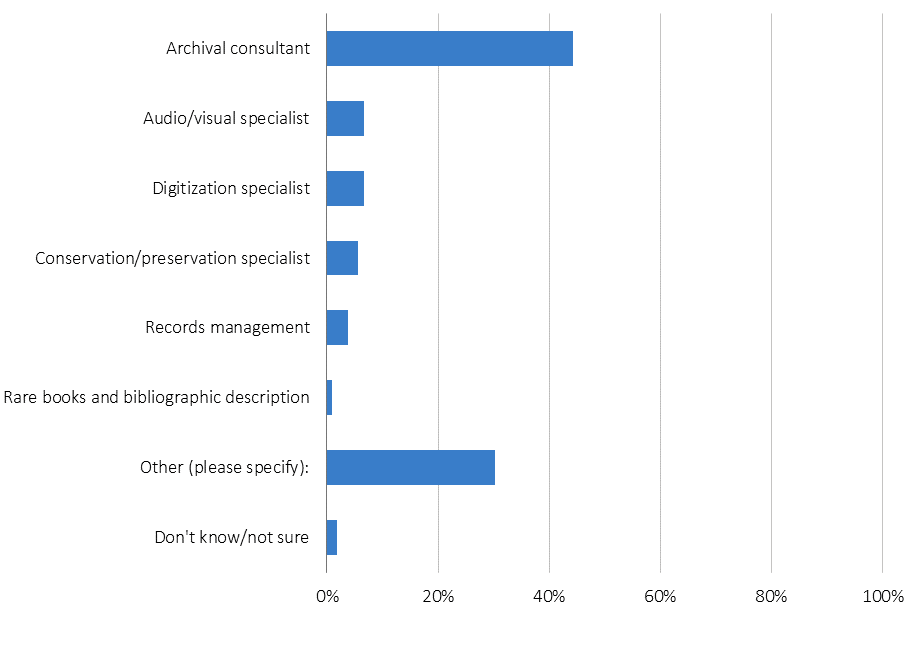
| Answer | Frequency | Percentage |
| Archival consultant | 47 | 44.34% |
| Audio/visual specialist | 7 | 6.60% |
| Digitization specialist | 7 | 6.60% |
| Conservation/preservation specialist | 6 | 5.66% |
| Records management | 4 | 3.77% |
| Rare books and bibliographic description | 1 | 0.94% |
| Other (please specify): | 32 | 30.19% |
| Don’t know/not sure | 2 | 1.89% |
Figure 95 – Which of the following best describes the locale in which your current employer is located? (Q27)
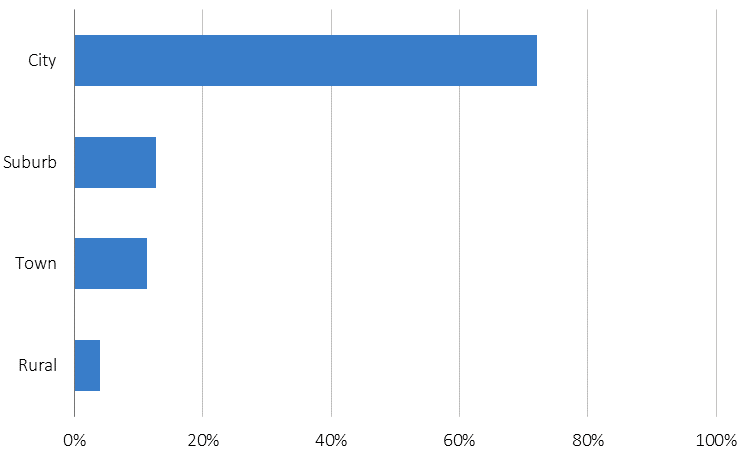
| Answer | Frequency | Percentage |
| City | 3,863 | 72.03% |
| Suburb | 678 | 12.64% |
| Town | 609 | 11.36% |
| Rural | 213 | 3.97% |
Figure 96 – How many years have you been with your current employer? If you are self-employed, enter the number of years you have been self-employed. If you do not want to answer this question, you may leave the box blank. (Q28)
| Min Answer | Max Answer | Median Answer | Count |
| 0 | 60 | 6 | 5,178 |
Figure 97 – Identify the functions you have spent the most time on during your primary employment within the last 12 months. Please select up to five items. (Q29)
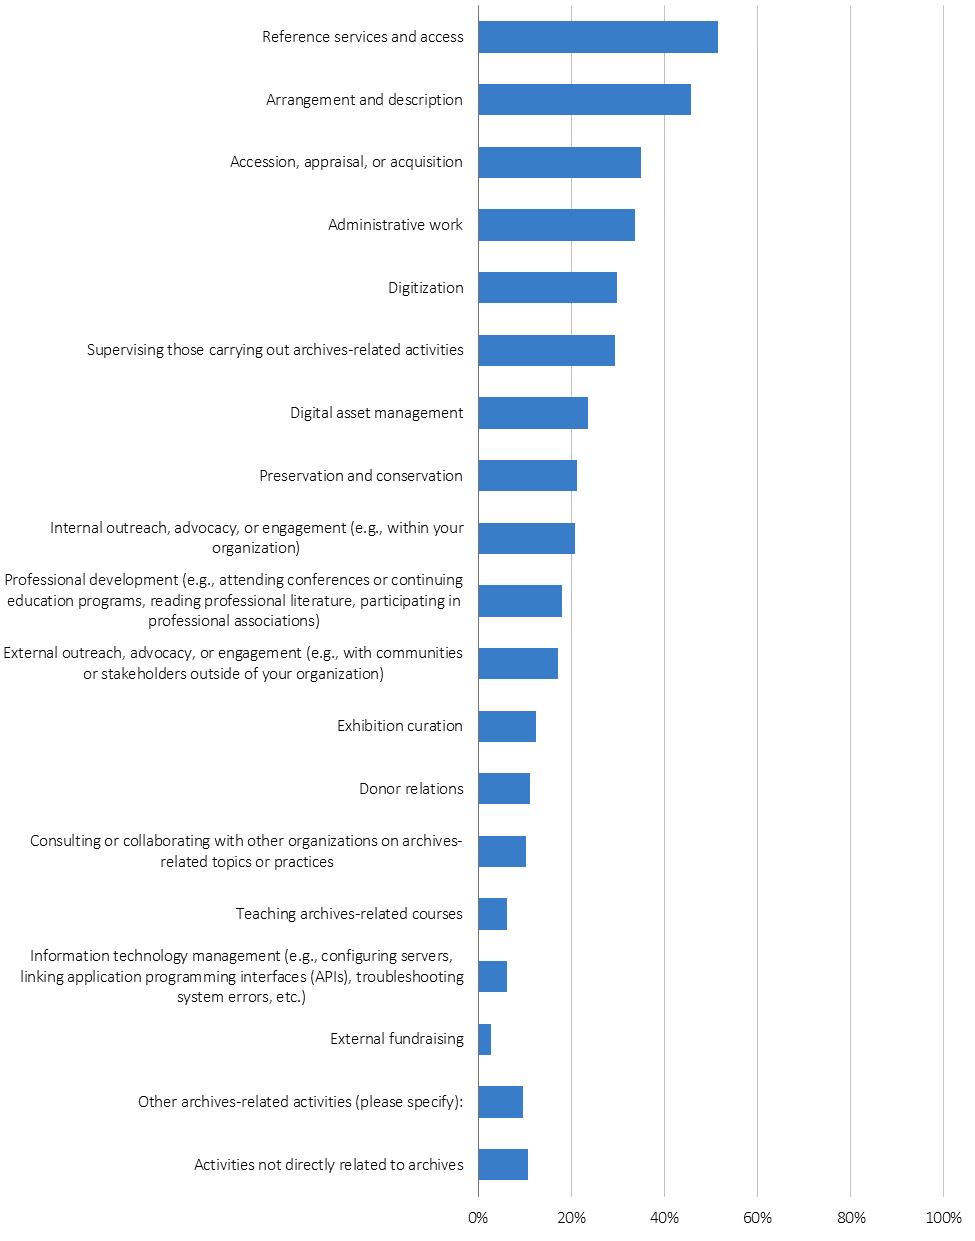
| Answer | Frequency | Percentage |
| Reference services and access | 2,762 | 51.55% |
| Arrangement and description | 2,449 | 45.71% |
| Accession, appraisal, or acquisition | 1,867 | 34.85% |
| Administrative work | 1,805 | 33.69% |
| Digitization | 1,598 | 29.82% |
| Supervising those carrying out archives-related activities | 1,577 | 29.43% |
| Digital asset management | 1,262 | 23.55% |
| Preservation and conservation | 1,136 | 21.20% |
| Internal outreach, advocacy, or engagement (e.g., within your organization) | 1,106 | 20.64% |
| Professional development (e.g., attending conferences or continuing education programs, reading professional literature, participating in professional associations) | 960 | 17.92% |
| External outreach, advocacy, or engagement (e.g., with communities or stakeholders outside of your organization) | 916 | 17.10% |
| Exhibition curation | 658 | 12.28% |
| Donor relations | 589 | 10.99% |
| Consulting or collaborating with other organizations on archives-related topics or practices | 547 | 10.21% |
| Teaching archives-related courses | 332 | 6.20% |
| Information technology management (e.g., configuring servers, linking application programming interfaces (APIs), troubleshooting system errors, etc.) | 330 | 6.16% |
| External fundraising | 139 | 2.59% |
| Other archives-related activities (please specify): | 518 | 9.67% |
| Activities not directly related to archives | 570 | 10.64% |
Figure 98 – Which of the following kinds of records do you work with? Please select all that apply and indicate if the records you work with are physical or digital. If you do not work with a particular kind of record, select N/A. (Q30)
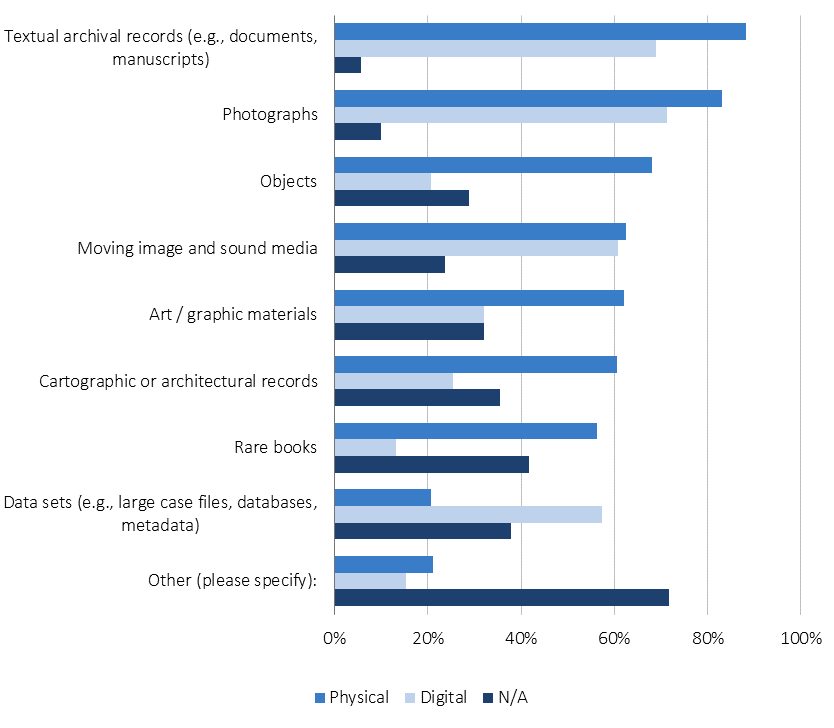
| Answer | Physical – Frequency | Physical – Percentage | Digital – Frequency | Digital – Percentage | N/A – Frequency | N/A – Percentage |
| Textual archival records (e.g., documents, manuscripts) | 4552 | 88.29% | 3553 | 68.91% | 292 | 5.66% |
| Photographs | 4184 | 82.98% | 3590 | 71.20% | 496 | 9.84% |
| Objects | 3094 | 68.07% | 935 | 20.57% | 1310 | 28.82% |
| Moving image and sound media | 2919 | 62.53% | 2839 | 60.82% | 1104 | 23.65% |
| Art / graphic materials | 2776 | 62.12% | 1429 | 31.98% | 1432 | 32.04% |
| Cartographic or architectural records | 2664 | 60.49% | 1120 | 25.43% | 1559 | 35.40% |
| Rare books | 2452 | 56.19% | 576 | 13.20% | 1822 | 41.75% |
| Data sets (e.g., large case files, databases, metadata) | 888 | 20.58% | 2473 | 57.31% | 1634 | 37.87% |
| Other (please specify): | 175 | 21.06% | 127 | 15.28% | 596 | 71.72% |
Figure 99 – Please select which of the following best describes your current position. (Q31)
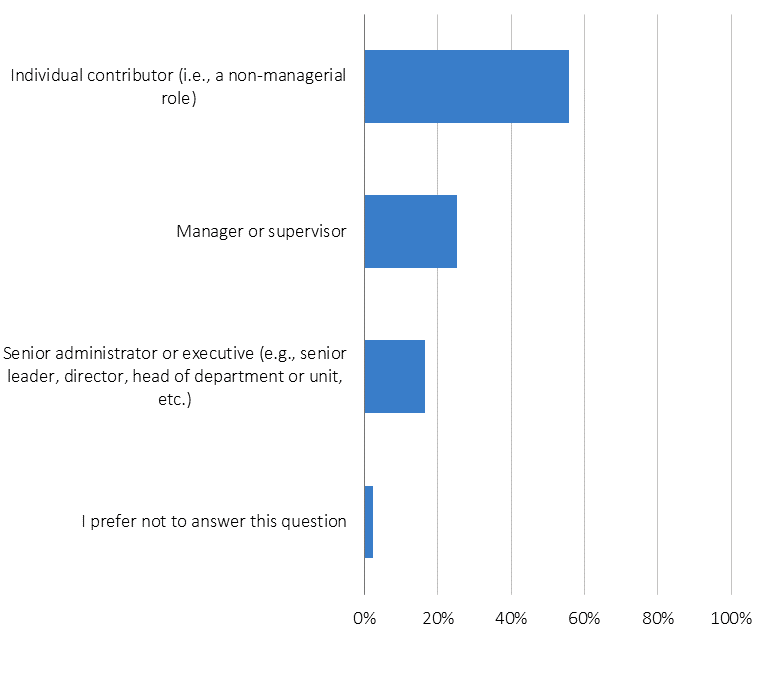
| Answer | Frequency | Percentage |
| Individual contributor (i.e., a non-managerial role) | 2,933 | 55.74% |
| Manager or supervisor | 1,329 | 25.26% |
| Senior administrator or executive (e.g., senior leader, director, head of department or unit, etc.) | 869 | 16.51% |
| I prefer not to answer this question | 131 | 2.49% |
Figure 100 – You indicated that you are an individual contributor (i.e., a non-managerial role). Please select the level of your position. (Q32)
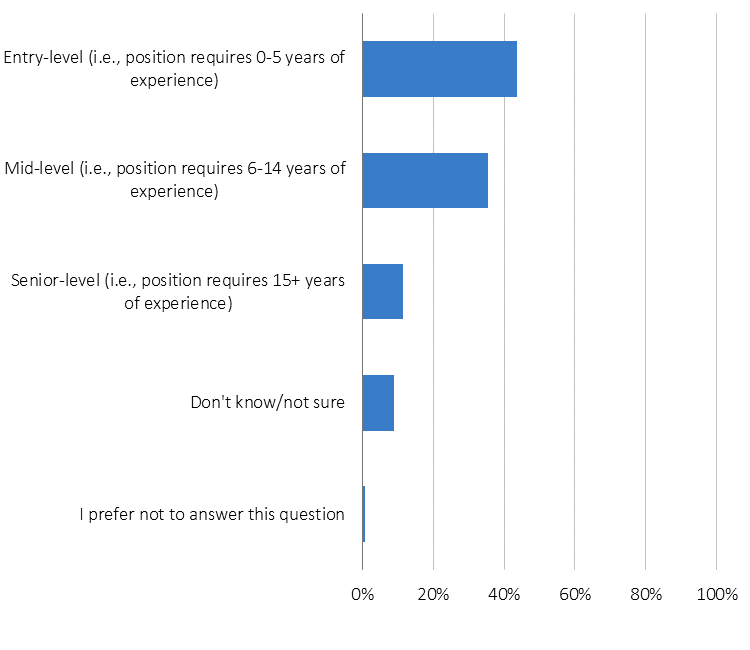
| Answer | Frequency | Percentage |
| Entry-level (i.e., position requires 0-5 years of experience) | 1275 | 43.55% |
| Mid-level (i.e., position requires 6-14 years of experience) | 1041 | 35.55% |
| Senior-level (i.e., position requires 15+ years of experience) | 333 | 11.37% |
| Don’t know/not sure | 257 | 8.78% |
| I prefer not to answer this question | 22 | 0.75% |
Figure 101 – Please indicate your primary position below. (Q33)
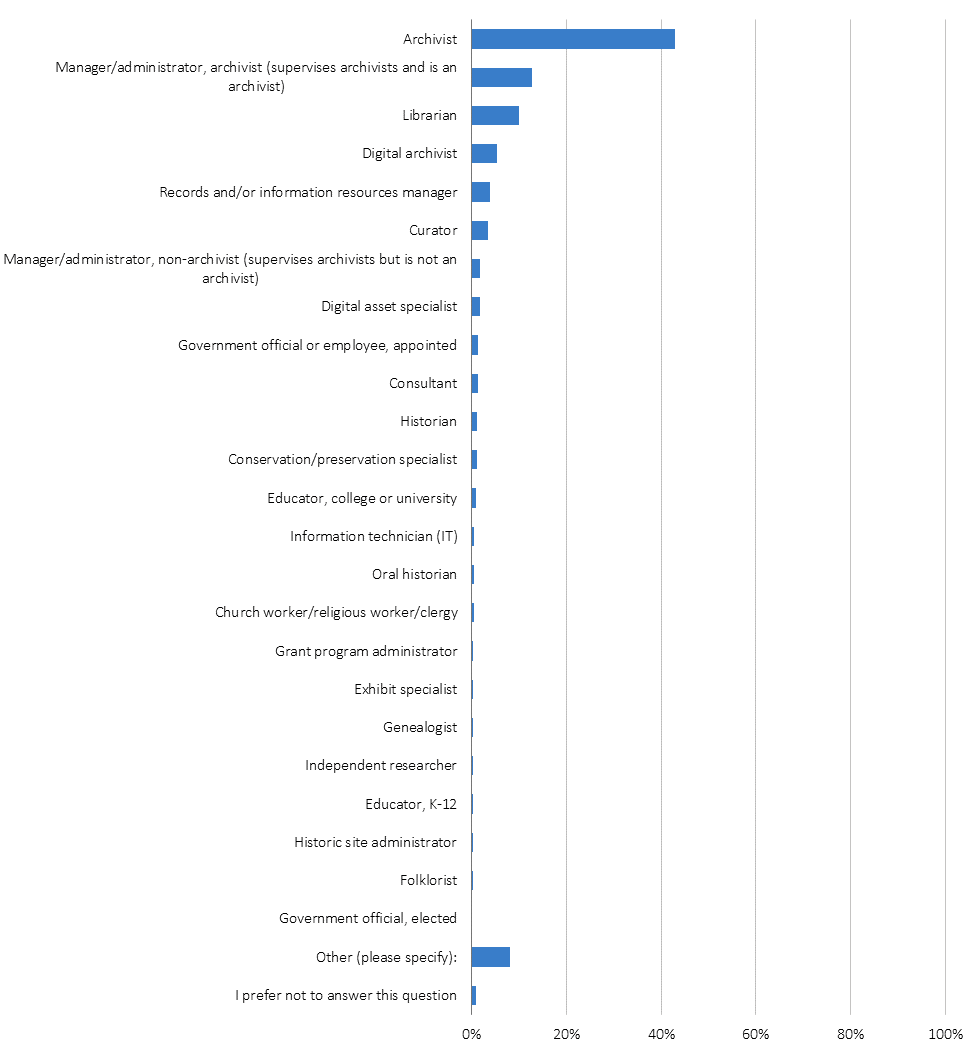
| Answer | Frequency | Percentage |
| Archivist | 2,300 | 42.89% |
| Manager/administrator, archivist (supervises archivists and is an archivist) | 688 | 12.83% |
| Librarian | 535 | 9.98% |
| Digital archivist | 289 | 5.39% |
| Records and/or information resources manager | 208 | 3.88% |
| Curator | 185 | 3.45% |
| Manager/administrator, non-archivist (supervises archivists but is not an archivist) | 95 | 1.77% |
| Digital asset specialist | 92 | 1.72% |
| Government official or employee, appointed | 76 | 1.42% |
| Consultant | 68 | 1.27% |
| Historian | 65 | 1.21% |
| Conservation/preservation specialist | 64 | 1.19% |
| Educator, college, or university | 54 | 1.01% |
| Information technician (IT) | 29 | 0.54% |
| Oral historian | 24 | 0.45% |
| Church worker/religious worker/clergy | 22 | 0.41% |
| Grant program administrator | 18 | 0.34% |
| Exhibit specialist | 15 | 0.28% |
| Genealogist | 15 | 0.28% |
| Independent researcher | 14 | 0.26% |
| Educator, K-12 | 12 | 0.22% |
| Historic site administrator | 12 | 0.22% |
| Folklorist | 1 | 0.02% |
| Government official, elected | 0 | 0.00% |
| Other (please specify): | 435 | 8.11% |
| I prefer not to answer this question | 46 | 0.86% |
Figure 102 – Please read the following statement and indicate the extent to which you agree or disagree. “The work that I do in my role matches my job description.” (Q34)
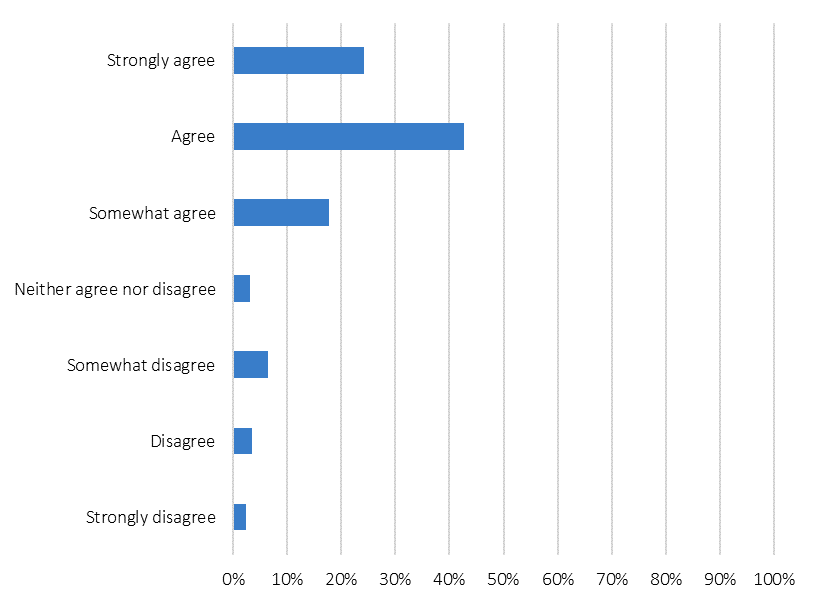
| Answer | Frequency | Percentage |
| Strongly agree | 1,260 | 24.18% |
| Agree | 2,227 | 42.74% |
| Somewhat agree | 923 | 17.72% |
| Neither agree nor disagree | 164 | 3.15% |
| Somewhat disagree | 333 | 6.39% |
| Disagree | 182 | 3.49% |
| Strongly disagree | 121 | 2.32% |
Figure 103 – Please indicate your expected total gross annual salary/income in 2021 for your full-time position. (Q35)

| Answer | Frequency | Percentage |
| Less than $30,000 | 95 | 2.07% |
| $30,000-$39,999 | 362 | 7.87% |
| $40,000-$49,999 | 636 | 13.83% |
| $50,000-$59,999 | 830 | 18.05% |
| $60,000-$69,999 | 754 | 16.40% |
| $70,000-$79,999 | 578 | 12.57% |
| $80,000-$89,999 | 371 | 8.07% |
| $90,000-$99,999 | 281 | 6.11% |
| $100,000-$109,999 | 229 | 4.98% |
| $110,000-$119,999 | 94 | 2.04% |
| $120,000-$129,999 | 85 | 1.85% |
| $130,000-$139,999 | 49 | 1.07% |
| $140,000-$149,999 | 30 | 0.65% |
| $150,000 or more | 81 | 1.76% |
| I prefer not to answer this question | 123 | 2.68% |
Figure 104 – Please indicate your expected total gross annual salary/income in 2021 from your self-employment. (Q36)
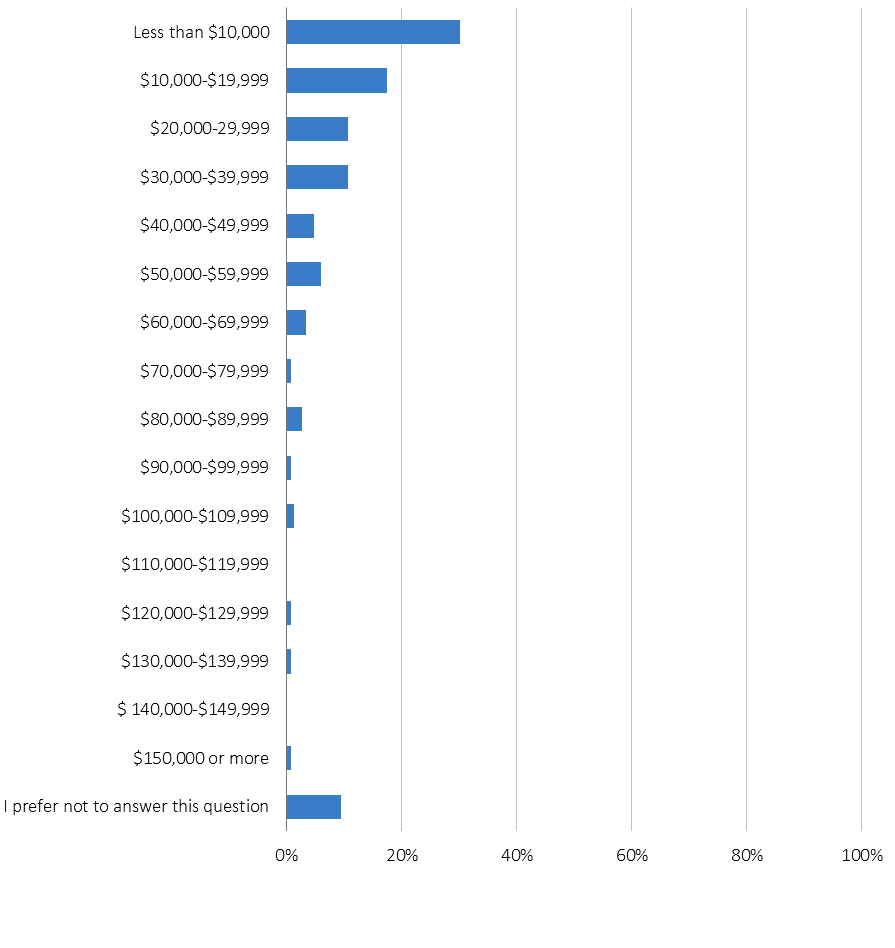
| Answer | Frequency | Percentage |
| Less than $10,000 | 45 | 30.20% |
| $10,000-$19,999 | 26 | 17.45% |
| $20,000-$29,999 | 16 | 10.74% |
| $30,000-$39,999 | 16 | 10.74% |
| $40,000-$49,999 | 7 | 4.70% |
| $50,000-$59,999 | 9 | 6.04% |
| $60,000-$69,999 | 5 | 3.36% |
| $70,000-$79,999 | 1 | 0.67% |
| $80,000-$89,999 | 4 | 2.68% |
| $90,000-$99,999 | 1 | 0.67% |
| $100,000-$109,999 | 2 | 1.34% |
| $110,000-$119,999 | 0 | 0.00% |
| $120,000-$129,999 | 1 | 0.67% |
| $130,000-$139,999 | 1 | 0.67% |
| $140,000-$149,999 | 0 | 0.00% |
| $150,000 or more | 1 | 0.67% |
| I prefer not to answer this question | 14 | 9.40% |
Figure 105 – In addition to your gross annual salary/income in 2021 from your full-time position, do any of the following contribute to your household’s financial picture? Please select all that apply. (Q37)
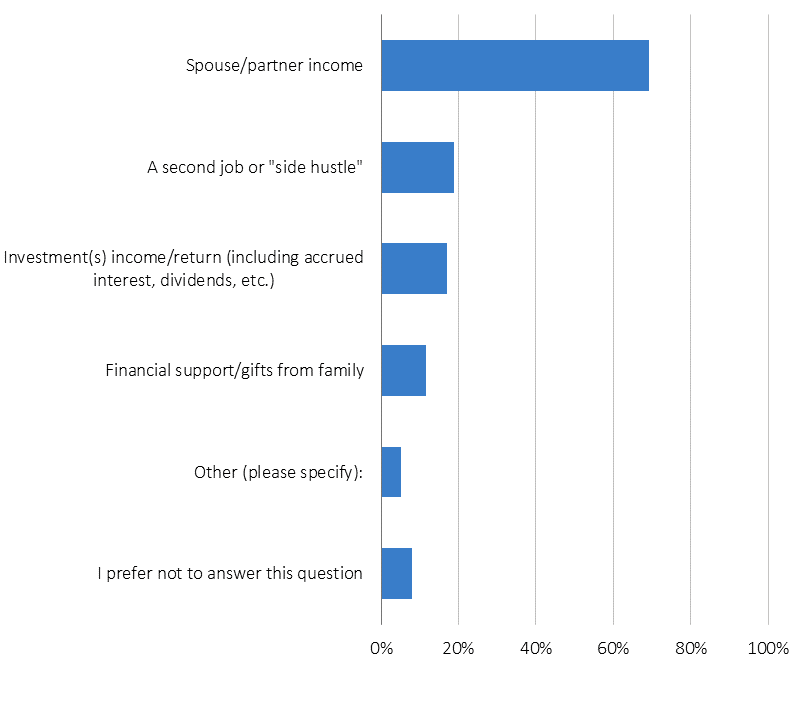
| Answer | Frequency | Percentage |
| Spouse/partner income | 2,461 | 69.28% |
| A second job or “side hustle” | 670 | 18.86% |
| Investment(s) income/return (including accrued interest, dividends, etc.) | 601 | 16.92% |
| Financial support/gifts from family | 415 | 11.68% |
| Other (please specify): | 182 | 5.12% |
| I prefer not to answer this question | 288 | 8.11% |
Figure 106 – Please indicate your expected total gross employment-related wages for 2021 for your part-time position(s). (Q38)
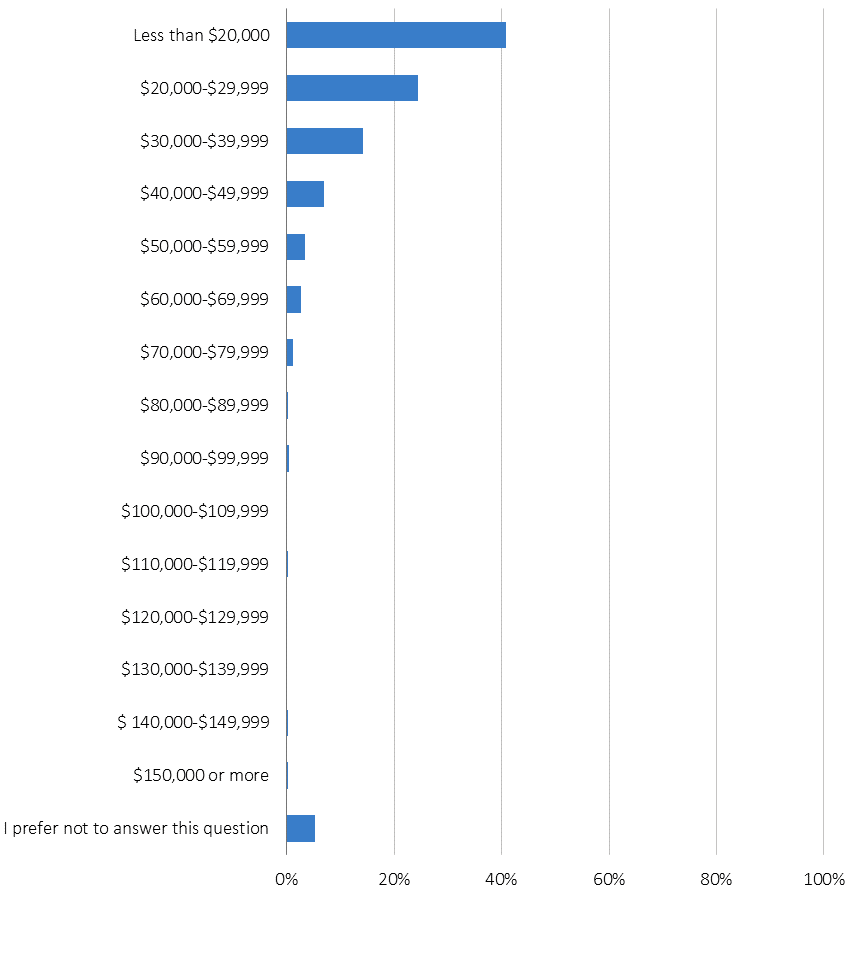
| Answer | Frequency | Percentage |
| Less than $20,000 | 205 | 40.84% |
| $20,000-$29,999 | 123 | 24.50% |
| $30,000-$39,999 | 71 | 14.14% |
| $40,000-$49,999 | 35 | 6.97% |
| $50,000-$59,999 | 17 | 3.39% |
| $60,000-$69,999 | 13 | 2.59% |
| $70,000-$79,999 | 6 | 1.20% |
| $80,000-$89,999 | 1 | 0.20% |
| $90,000-$99,999 | 2 | 0.40% |
| $100,000-$109,999 | 0 | 0.00% |
| $110,000-$119,999 | 1 | 0.20% |
| $120,000-$129,999 | 0 | 0.00% |
| $130,000-$139,999 | 0 | 0.00% |
| $140,000-$149,999 | 1 | 0.20% |
| $150,000 or more | 1 | 0.20% |
| I prefer not to answer this question | 26 | 5.18% |
Figure 107 – What benefits does your employer offer? Please select all that apply. If you are employed by multiple organizations, please select the benefit(s) that are offered by your primary employer. (Q39)
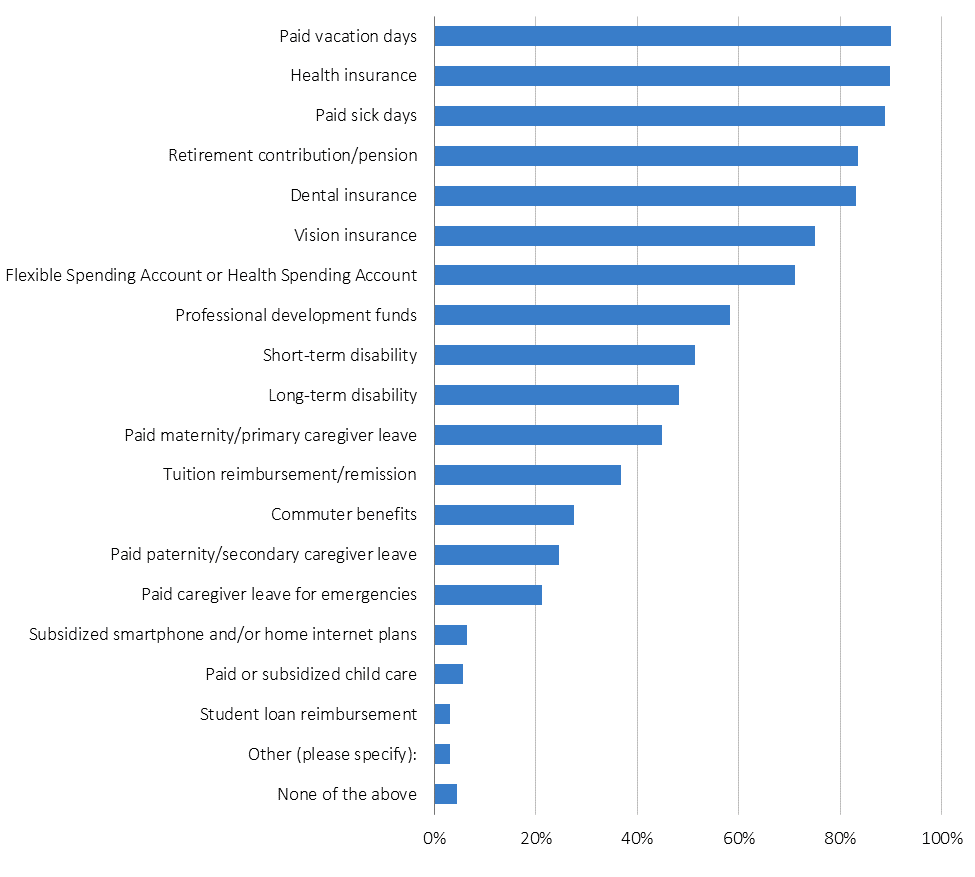
| Answer | Frequency | Percentage |
| Paid vacation days | 4,545 | 89.98% |
| Health insurance | 4,538 | 89.84% |
| Paid sick days | 4,486 | 88.81% |
| Retirement contribution/pension | 4,214 | 83.43% |
| Dental insurance | 4,202 | 83.19% |
| Vision insurance | 3,791 | 75.05% |
| Flexible Spending Account or Health Spending Account | 3,595 | 71.17% |
| Professional development funds | 2,942 | 58.25% |
| Short-term disability | 2,597 | 51.42% |
| Long-term disability | 2,440 | 48.31% |
| Paid maternity/primary caregiver leave | 2,271 | 44.96% |
| Tuition reimbursement/remission | 1,858 | 36.78% |
| Commuter benefits | 1,389 | 27.50% |
| Paid paternity/secondary caregiver leave | 1,240 | 24.55% |
| Paid caregiver leave for emergencies | 1,072 | 21.22% |
| Subsidized smartphone and/or home internet plans | 320 | 6.34% |
| Paid or subsidized childcare | 289 | 5.72% |
| Student loan reimbursement | 153 | 3.03% |
| Other (please specify): | 156 | 3.09% |
| None of the above | 227 | 4.49% |
Figure 108 – Please indicate ALL of the degrees you hold. Please select all that apply. (Q40)
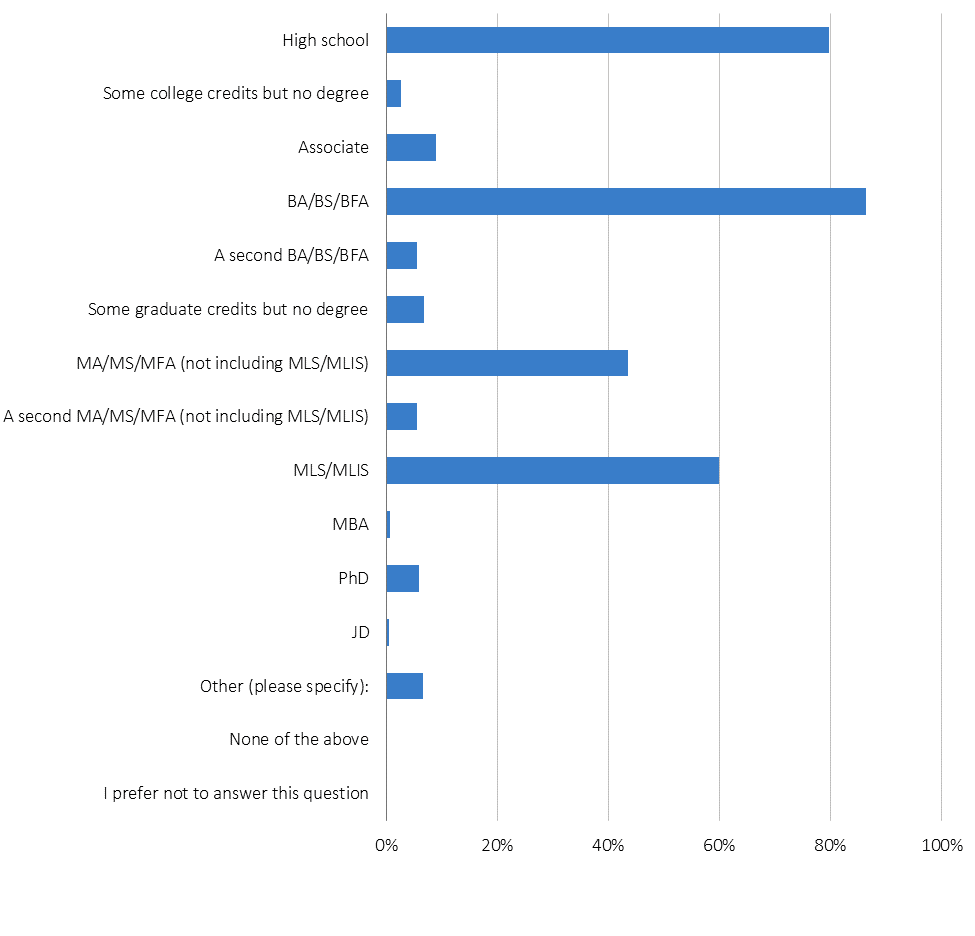
| Answer | Frequency | Percentage |
| High school | 4,539 | 79.69% |
| Some college credits but no degree | 152 | 2.67% |
| Associate | 509 | 8.94% |
| BA/BS/BFA | 4,920 | 86.38% |
| A second BA/BS/BFA | 317 | 5.57% |
| Some graduate credits but no degree | 386 | 6.78% |
| MA/MS/MFA (not including MLS/MLIS) | 2,481 | 43.56% |
| A second MA/MS/MFA (not including MLS/MLIS) | 314 | 5.51% |
| MLS/MLIS | 3,417 | 59.99% |
| MBA | 41 | 0.72% |
| PhD | 340 | 5.97% |
| JD | 33 | 0.58% |
| Other (please specify): | 374 | 6.57% |
| None of the above | 3 | 0.05% |
| I prefer not to answer this question | 8 | 0.14% |
Figure 109 – Please indicate in what year you were awarded the following degrees. (Q41)
| Answer | Minimum | Maximum | Median | Count |
| High school | 1945 | 2020 | 1993 | 4,417 |
| Associate | 1957 | 2021 | 2003 | 473 |
| BA/BS/BFA | 1949 | 2022 | 2004 | 4,801 |
| A second BA/BS/BFA | 1962 | 2021 | 2006 | 305 |
| MA/MS/MFA (not including MLS/MLIS) | 1955 | 2023 | 2006 | 2,432 |
| A second MA/MS/MFA (not including MLS/MLIS) | 1970 | 2023 | 2008 | 313 |
| MLS/MLIS | 1963 | 2024 | 2011 | 3,351 |
| MBA | 1976 | 2021 | 2002 | 41 |
| PhD | 1958 | 2026 | 2006 | 329 |
| JD | 1976 | 2016 | 1994 | 32 |
| Other (please specify) | 1965 | 2025 | 2012 | 261 |
Figure 110 – Please indicate your major/concentration for each degree listed below. Associate. (Q42a)
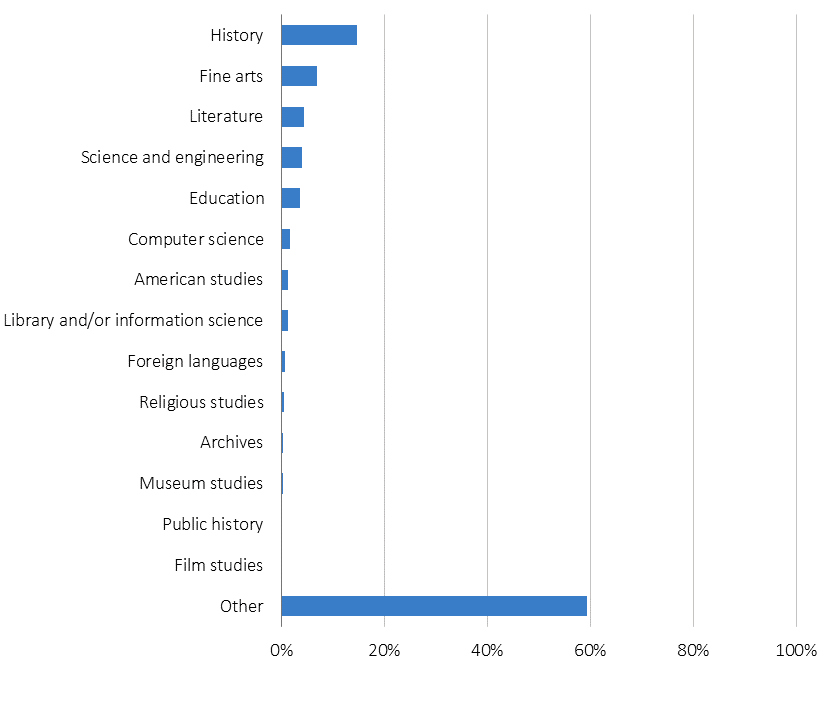
| Answer | Frequency | Percentage |
| History | 73 | 14.75% |
| Fine arts | 34 | 6.87% |
| Literature | 22 | 4.44% |
| Science and engineering | 20 | 4.04% |
| Education | 18 | 3.64% |
| Computer science | 8 | 1.62% |
| American studies | 7 | 1.41% |
| Library and/or information science | 7 | 1.41% |
| Foreign languages | 4 | 0.81% |
| Religious studies | 3 | 0.61% |
| Archives | 2 | 0.40% |
| Museum studies | 2 | 0.40% |
| Public history | 1 | 0.20% |
| Film studies | 0 | 0.00% |
| Other | 294 | 59.39% |
Figure 111 – Please indicate your major/concentration for each degree listed below. BA/BS/BFA. (Q42b)
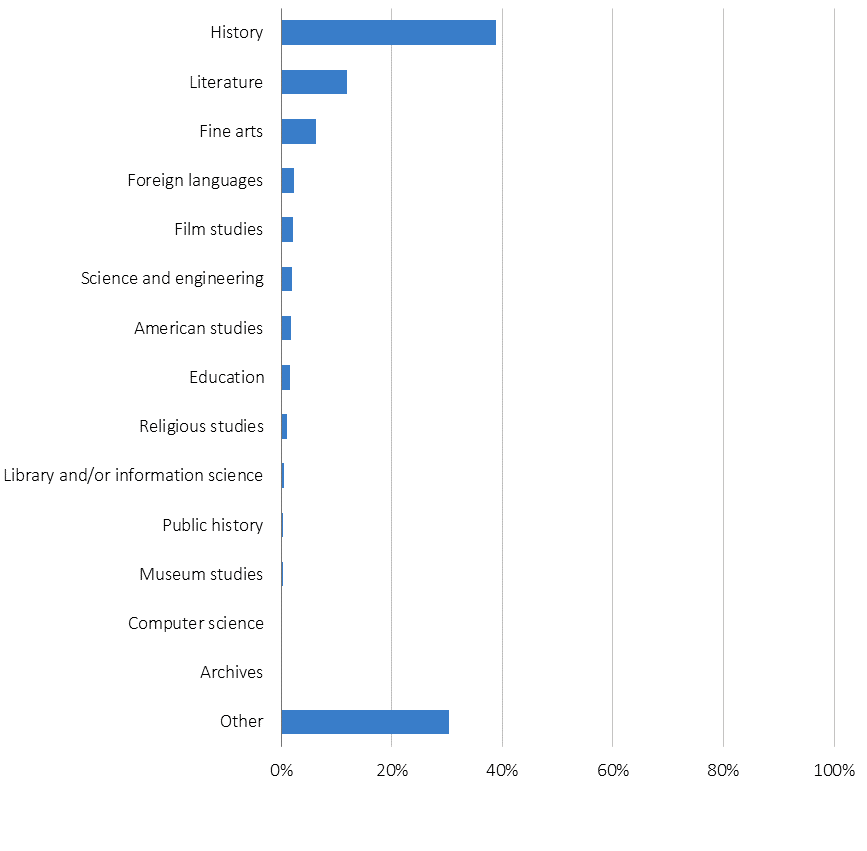
| Answer | Frequency | Percentage |
| History | 1,902 | 38.88% |
| Literature | 584 | 11.94% |
| Fine arts | 311 | 6.36% |
| Foreign languages | 112 | 2.29% |
| Film studies | 103 | 2.11% |
| Science and engineering | 97 | 1.98% |
| American studies | 87 | 1.78% |
| Education | 77 | 1.57% |
| Religious studies | 55 | 1.12% |
| Library and/or information science | 24 | 0.49% |
| Public history | 20 | 0.41% |
| Museum studies | 19 | 0.39% |
| Computer science | 11 | 0.22% |
| Archives | 2 | 0.04% |
| Other | 1,488 | 30.42% |
Figure 112- Please indicate your major/concentration for each degree listed below. A second BA/BS/BFA. (Q42c)
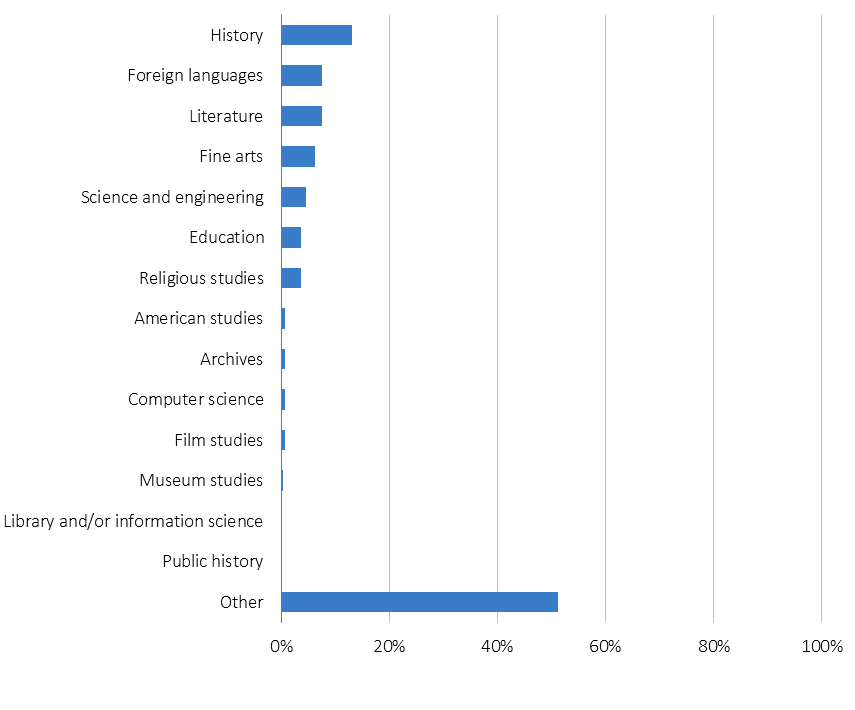
| Answer | Frequency | Percentage |
| History | 40 | 13.03% |
| Foreign languages | 23 | 7.49% |
| Literature | 23 | 7.49% |
| Fine arts | 19 | 6.19% |
| Science and engineering | 14 | 4.56% |
| Education | 11 | 3.58% |
| Religious studies | 11 | 3.58% |
| American studies | 2 | 0.65% |
| Archives | 2 | 0.65% |
| Computer science | 2 | 0.65% |
| Film studies | 2 | 0.65% |
| Museum studies | 1 | 0.33% |
| Library and/or information science | 0 | 0.00% |
| Public history | 0 | 0.00% |
| Other | 157 | 51.14% |
Figure 113 – Please indicate your major/concentration for each degree listed below. MA/MS/MFA (not including MLS/MLIS). (Q42d)
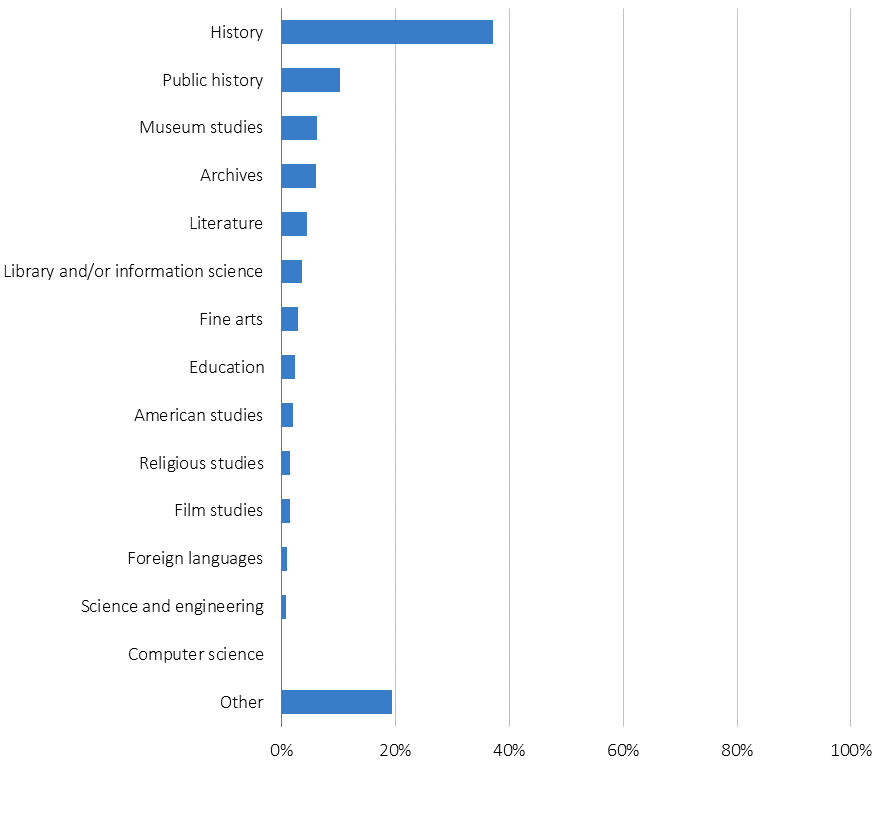
| Answer | Frequency | Percentage |
| History | 912 | 37.19% |
| Public history | 252 | 10.28% |
| Museum studies | 153 | 6.24% |
| Archives | 148 | 6.04% |
| Literature | 112 | 4.57% |
| Library and/or information science | 88 | 3.59% |
| Fine arts | 73 | 2.98% |
| Education | 61 | 2.49% |
| American studies | 50 | 2.04% |
| Religious studies | 38 | 1.55% |
| Film studies | 37 | 1.51% |
| Foreign languages | 24 | 0.98% |
| Science and engineering | 21 | 0.86% |
| Computer science | 5 | 0.20% |
| Other | 478 | 19.49% |
Figure 114 – Please indicate your major/concentration for each degree listed below. A second MA/MS/MFA (not including MLS/MLIS). (Q42e)
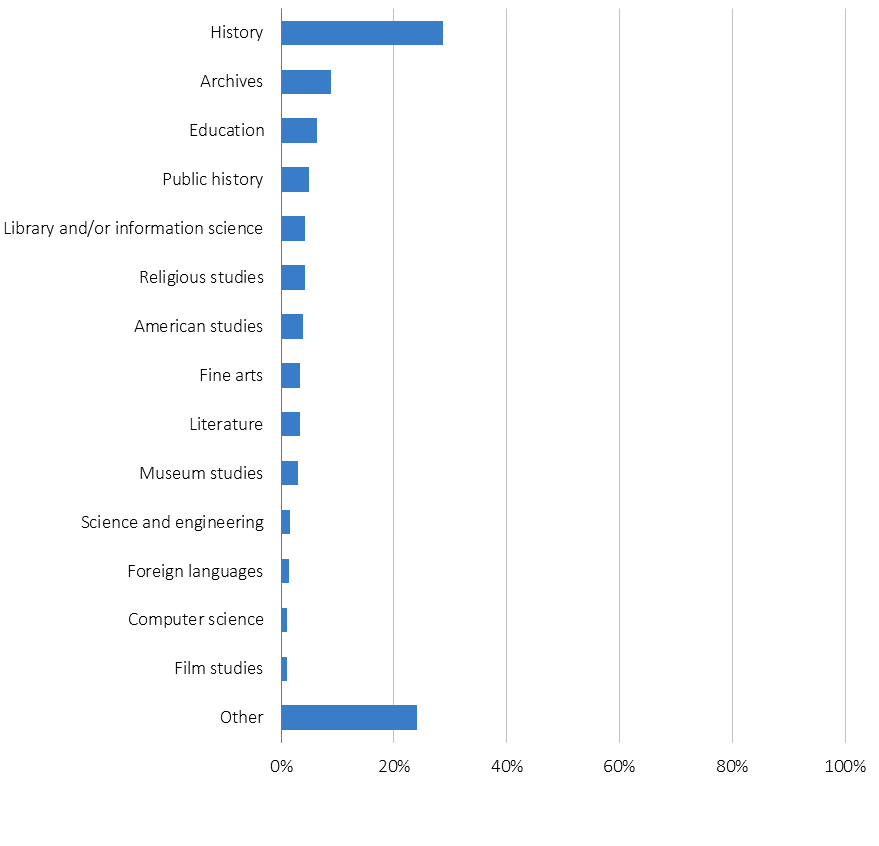
| Answer | Frequency | Percentage |
| History | 87 | 28.71% |
| Archives | 27 | 8.91% |
| Education | 19 | 6.27% |
| Public history | 15 | 4.95% |
| Library and/or information science | 13 | 4.29% |
| Religious studies | 13 | 4.29% |
| American studies | 12 | 3.96% |
| Fine arts | 10 | 3.30% |
| Literature | 10 | 3.30% |
| Museum studies | 9 | 2.97% |
| Science and engineering | 5 | 1.65% |
| Foreign languages | 4 | 1.32% |
| Computer science | 3 | 0.99% |
| Film studies | 3 | 0.99% |
| Other | 73 | 24.09% |
Figure 115 – Please indicate your major/concentration for each degree listed below. MLS/MLIS. (Q42f)
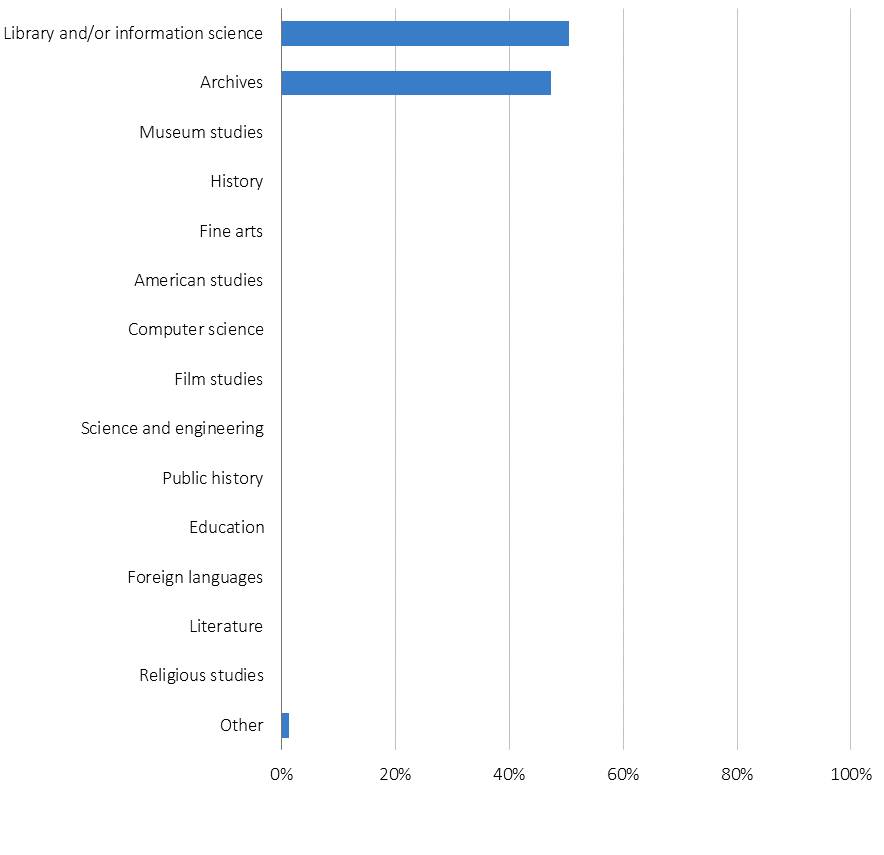
| Answer | Frequency | Percentage |
| Library and/or information science | 1,699 | 50.43% |
| Archives | 1,597 | 47.40% |
| Museum studies | 7 | 0.21% |
| History | 5 | 0.15% |
| Fine arts | 3 | 0.09% |
| American studies | 2 | 0.06% |
| Computer science | 2 | 0.06% |
| Film studies | 2 | 0.06% |
| Science and engineering | 2 | 0.06% |
| Public history | 1 | 0.03% |
| Education | 0 | 0.00% |
| Foreign languages | 0 | 0.00% |
| Literature | 0 | 0.00% |
| Religious studies | 0 | 0.00% |
| Other | 49 | 1.45% |
Figure 116 – Please indicate your major/concentration for each degree listed below. PhD. (Q42g)
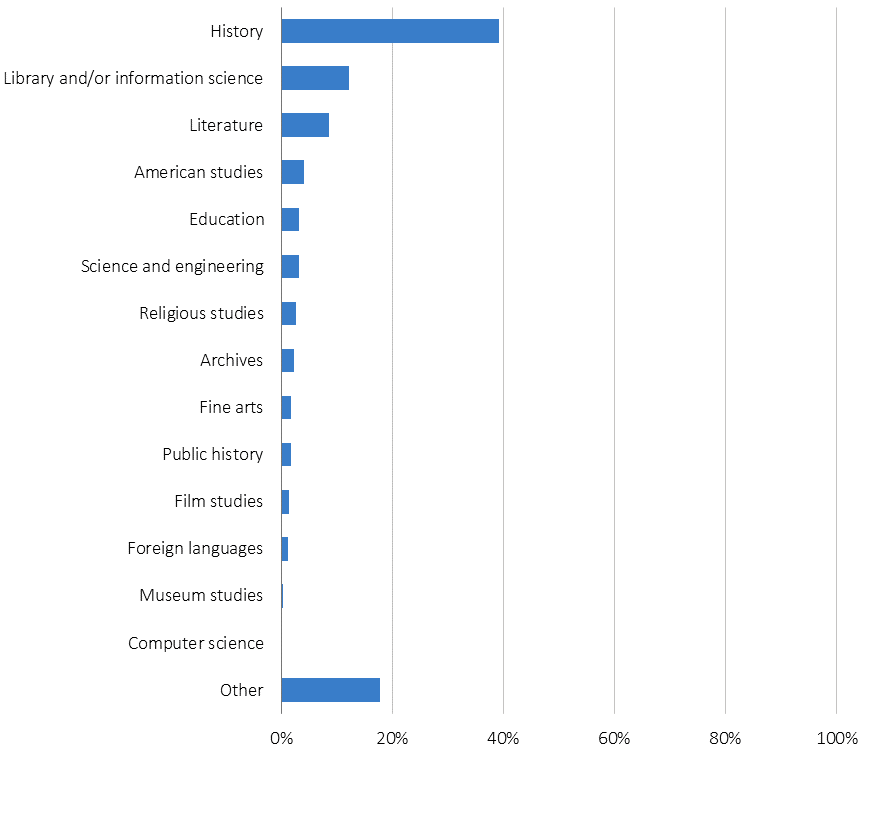
| Answer | Frequency | Percentage |
| History | 132 | 39.17% |
| Library and/or information science | 41 | 12.17% |
| Literature | 29 | 8.61% |
| American studies | 14 | 4.15% |
| Education | 11 | 3.26% |
| Science and engineering | 11 | 3.26% |
| Religious studies | 9 | 2.67% |
| Archives | 8 | 2.37% |
| Fine arts | 6 | 1.78% |
| Public history | 6 | 1.78% |
| Film studies | 5 | 1.48% |
| Foreign languages | 4 | 1.19% |
| Museum studies | 1 | 0.30% |
| Computer science | 0 | 0.00% |
| Other | 60 | 17.80% |
Figure 117 – Please indicate which degree(s) you are currently pursuing. Please select all that apply. (Q43)
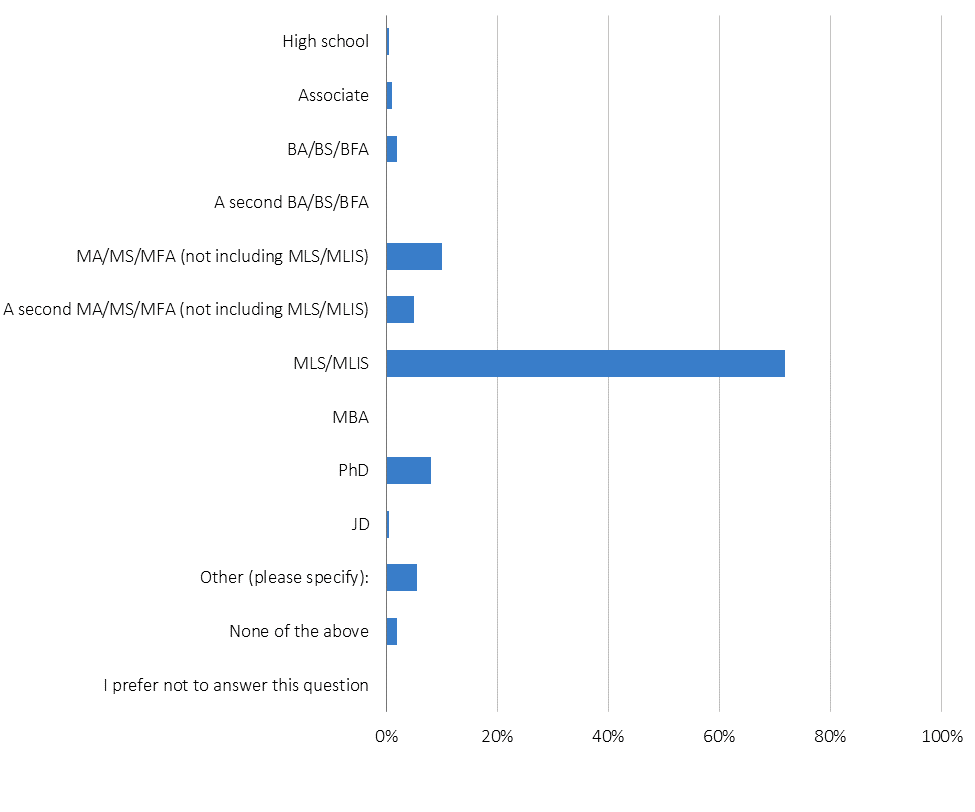
| Answer | Frequency | Percentage |
| High school | 1 | 0.50% |
| Associate | 2 | 1.01% |
| BA/BS/BFA | 4 | 2.01% |
| A second BA/BS/BFA | 0 | 0.00% |
| MA/MS/MFA (not including MLS/MLIS) | 20 | 10.05% |
| A second MA/MS/MFA (not including MLS/MLIS) | 10 | 5.03% |
| MLS/MLIS | 143 | 71.86% |
| MBA | 0 | 0.00% |
| PhD | 16 | 8.04% |
| JD | 1 | 0.50% |
| Other (please specify): | 11 | 5.53% |
| None of the above | 4 | 2.01% |
| I prefer not to answer this question | 0 | 0.00% |
Figure 118 – You indicated that you have the following degree(s) or some credits but no degree. Upon graduation (or leaving the program), how much did you have in student loan debt in your name for each degree(s)? Some college credits but no degree. (Q44a)
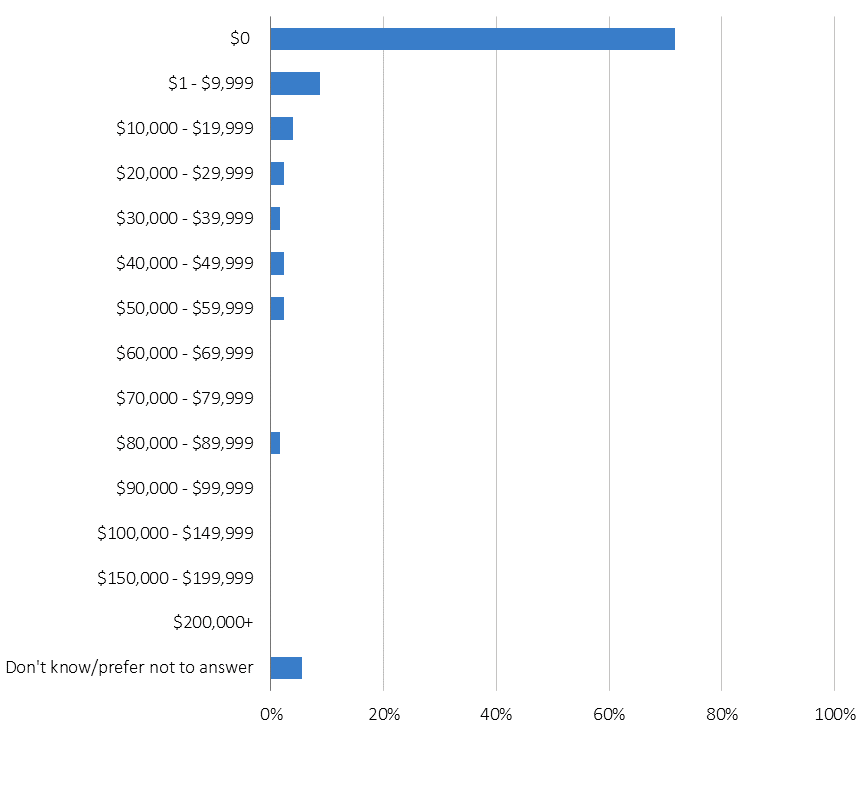
| Answer | Frequency | Percentage |
| $0 | 91 | 71.65% |
| $1 – $9,999 | 11 | 8.66% |
| $10,000 – $19,999 | 5 | 3.94% |
| $20,000 – $29,999 | 3 | 2.36% |
| $30,000 – $39,999 | 2 | 1.57% |
| $40,000 – $49,999 | 3 | 2.36% |
| $50,000 – $59,999 | 3 | 2.36% |
| $60,000 – $69,999 | 0 | 0.00% |
| $70,000 – $79,999 | 0 | 0.00% |
| $80,000 – $89,999 | 2 | 1.57% |
| $90,000 – $99,999 | 0 | 0.00% |
| $100,000 – $149,999 | 0 | 0.00% |
| $150,000 – $199,999 | 0 | 0.00% |
| $200,000+ | 0 | 0.00% |
| Don’t know/prefer not to answer | 7 | 5.51% |
Figure 119 – You indicated that you have the following degree(s) or some credits but no degree. Upon graduation (or leaving the program), how much did you have in student loan debt in your name for each degree(s)? Associate. (Q44b)
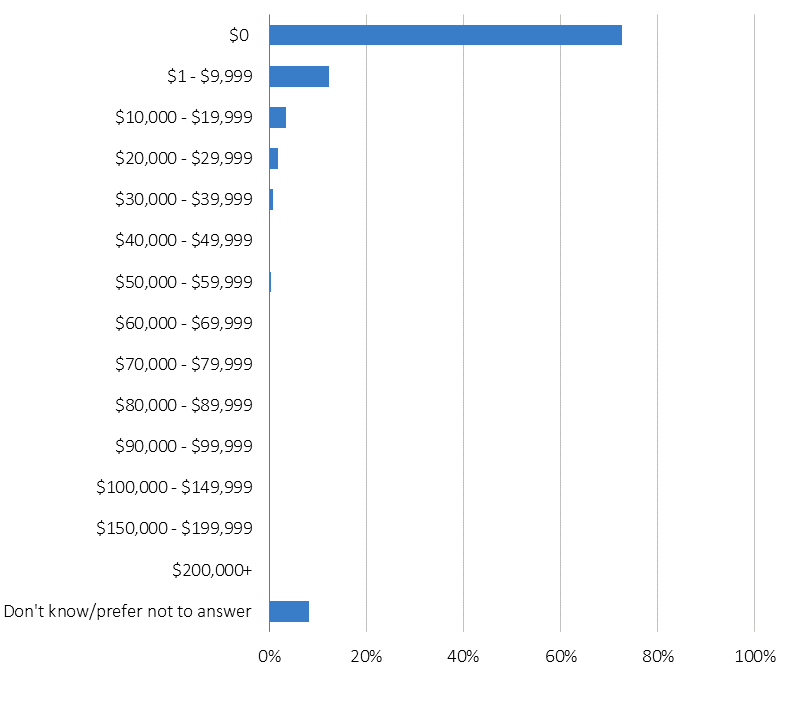
| Answer | Frequency | Percentage |
| $0 | 348 | 72.65% |
| $1 – $9,999 | 59 | 12.32% |
| $10,000 – $19,999 | 16 | 3.34% |
| $20,000 – $29,999 | 9 | 1.88% |
| $30,000 – $39,999 | 4 | 0.84% |
| $40,000 – $49,999 | 0 | 0.00% |
| $50,000 – $59,999 | 2 | 0.42% |
| $60,000 – $69,999 | 1 | 0.21% |
| $70,000 – $79,999 | 0 | 0.00% |
| $80,000 – $89,999 | 1 | 0.21% |
| $90,000 – $99,999 | 0 | 0.00% |
| $100,000 – $149,999 | 0 | 0.00% |
| $150,000 – $199,999 | 0 | 0.00% |
| $200,000+ | 0 | 0.00% |
| Don’t know/prefer not to answer | 39 | 8.14% |
Figure 120 – You indicated that you have the following degree(s) or some credits but no degree. Upon graduation (or leaving the program), how much did you have in student loan debt in your name for each degree(s)? BA/BS/BFA. (Q44c)
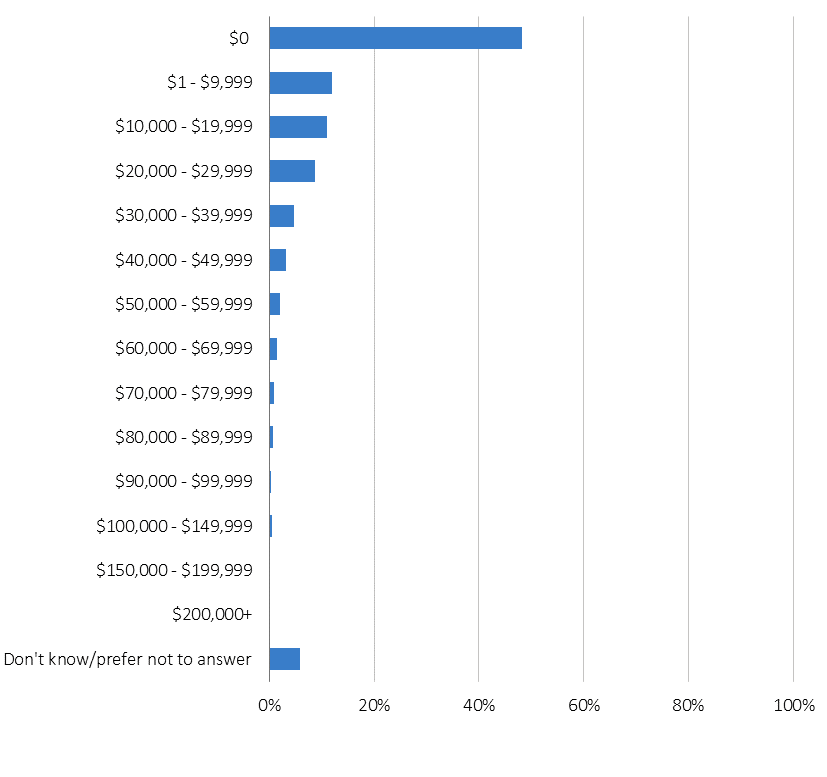
| Answer | Frequency | Percentage |
| $0 | 2290 | 48.30% |
| $1 – $9,999 | 571 | 12.04% |
| $10,000 – $19,999 | 520 | 10.97% |
| $20,000 – $29,999 | 413 | 8.71% |
| $30,000 – $39,999 | 225 | 4.75% |
| $40,000 – $49,999 | 150 | 3.16% |
| $50,000 – $59,999 | 98 | 2.07% |
| $60,000 – $69,999 | 66 | 1.39% |
| $70,000 – $79,999 | 42 | 0.89% |
| $80,000 – $89,999 | 33 | 0.70% |
| $90,000 – $99,999 | 18 | 0.38% |
| $100,000 – $149,999 | 24 | 0.51% |
| $150,000 – $199,999 | 8 | 0.17% |
| $200,000+ | 4 | 0.08% |
| Don’t know/prefer not to answer | 279 | 5.88% |
Figure 121 – You indicated that you have the following degree(s) or some credits but no degree. Upon graduation (or leaving the program), how much did you have in student loan debt in your name for each degree(s)? A second BA/BS/BFA. (Q44d)
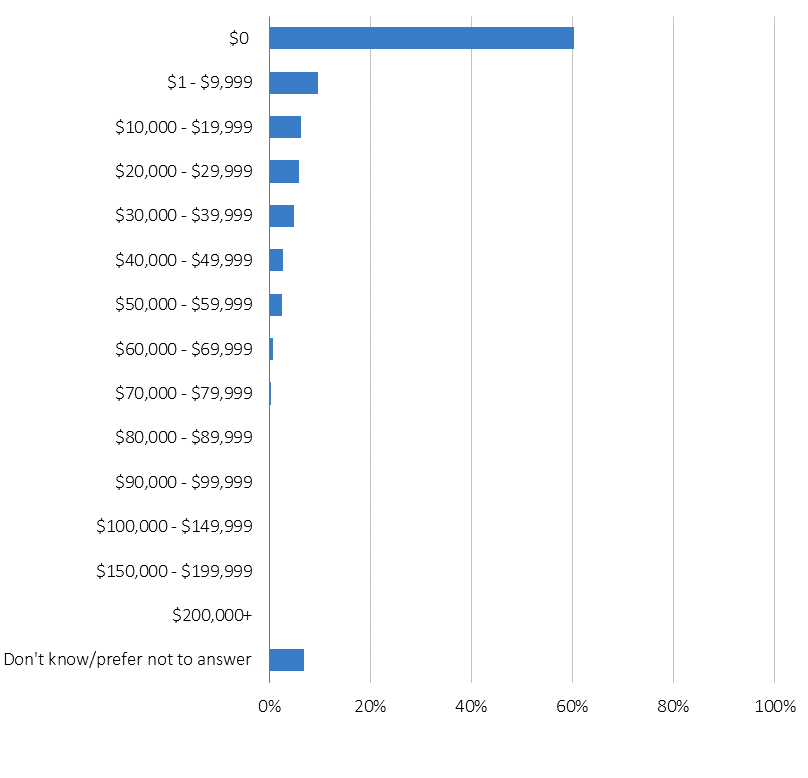
| Answer | Frequency | Percentage |
| $0 | 174 | 60.21% |
| $1 – $9,999 | 28 | 9.69% |
| $10,000 – $19,999 | 18 | 6.23% |
| $20,000 – $29,999 | 17 | 5.88% |
| $30,000 – $39,999 | 14 | 4.84% |
| $40,000 – $49,999 | 8 | 2.77% |
| $50,000 – $59,999 | 7 | 2.42% |
| $60,000 – $69,999 | 2 | 0.69% |
| $70,000 – $79,999 | 1 | 0.35% |
| $80,000 – $89,999 | 0 | 0.00% |
| $90,000 – $99,999 | 0 | 0.00% |
| $100,000 – $149,999 | 0 | 0.00% |
| $150,000 – $199,999 | 0 | 0.00% |
| $200,000+ | 0 | 0.00% |
| Don’t know/prefer not to answer | 20 | 6.92% |
Figure 122 – You indicated that you have the following degree(s) or some credits but no degree. Upon graduation (or leaving the program), how much did you have in student loan debt in your name for each degree(s)? Some graduate credits but no degree. (Q44e)
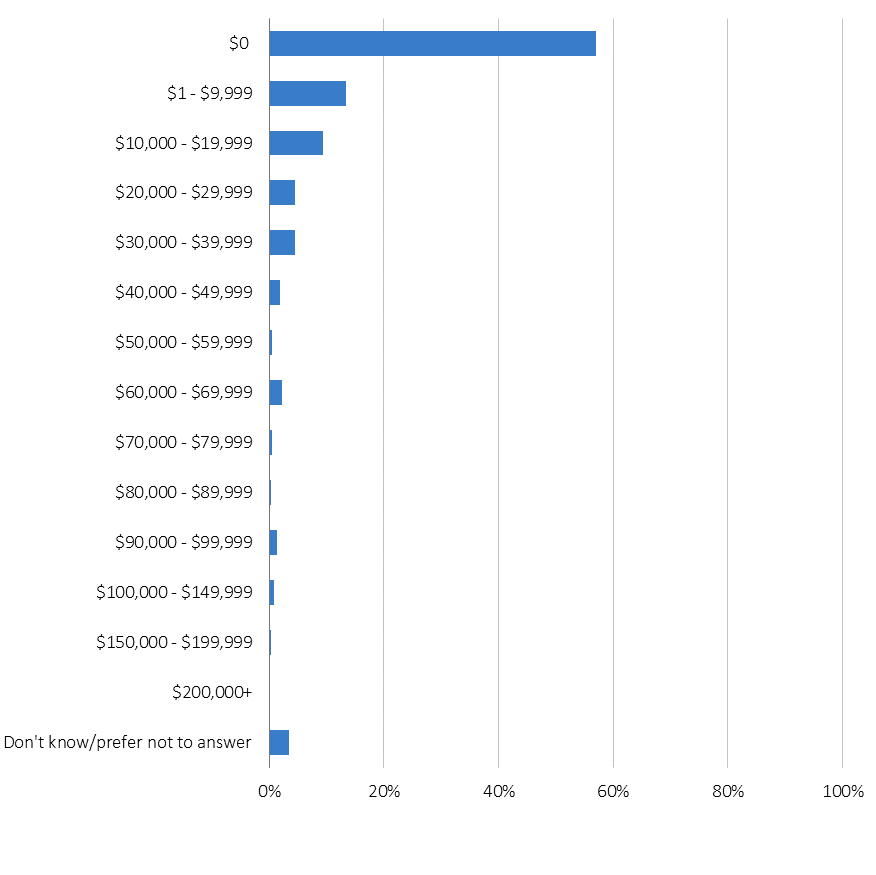
| Answer | Frequency | Percentage |
| $0 | 213 | 56.95% |
| $1 – $9,999 | 50 | 13.37% |
| $10,000 – $19,999 | 35 | 9.36% |
| $20,000 – $29,999 | 17 | 4.55% |
| $30,000 – $39,999 | 17 | 4.55% |
| $40,000 – $49,999 | 7 | 1.87% |
| $50,000 – $59,999 | 2 | 0.53% |
| $60,000 – $69,999 | 8 | 2.14% |
| $70,000 – $79,999 | 2 | 0.53% |
| $80,000 – $89,999 | 1 | 0.27% |
| $90,000 – $99,999 | 5 | 1.34% |
| $100,000 – $149,999 | 3 | 0.80% |
| $150,000 – $199,999 | 1 | 0.27% |
| $200,000+ | 0 | 0.00% |
| Don’t know/prefer not to answer | 13 | 3.48% |
Figure 123 – You indicated that you have the following degree(s) or some credits but no degree. Upon graduation (or leaving the program), how much did you have in student loan debt in your name for each degree(s)? MA/MS/MFA (not including MLS/MLIS). (Q44f)
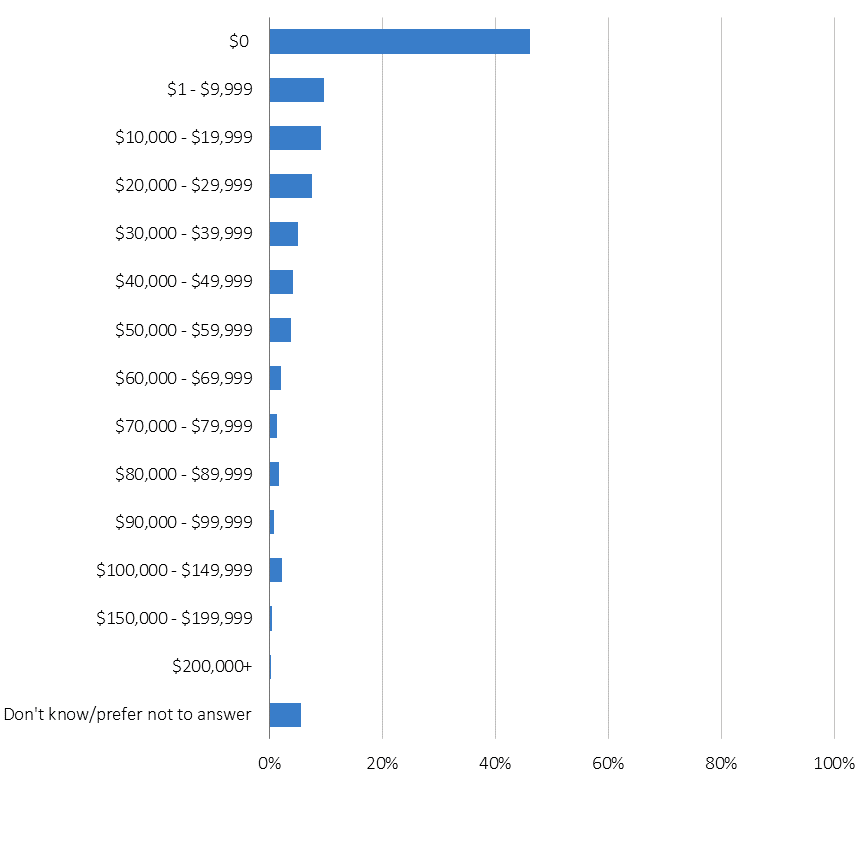
| Answer | Frequency | Percentage |
| $0 | 1092 | 46.10% |
| $1 – $9,999 | 229 | 9.67% |
| $10,000 – $19,999 | 215 | 9.08% |
| $20,000 – $29,999 | 181 | 7.64% |
| $30,000 – $39,999 | 120 | 5.07% |
| $40,000 – $49,999 | 101 | 4.26% |
| $50,000 – $59,999 | 90 | 3.80% |
| $60,000 – $69,999 | 47 | 1.98% |
| $70,000 – $79,999 | 32 | 1.35% |
| $80,000 – $89,999 | 41 | 1.73% |
| $90,000 – $99,999 | 18 | 0.76% |
| $100,000 – $149,999 | 52 | 2.20% |
| $150,000 – $199,999 | 11 | 0.46% |
| $200,000+ | 8 | 0.34% |
| Don’t know/prefer not to answer | 132 | 5.57% |
Figure 124 – You indicated that you have the following degree(s) or some credits but no degree. Upon graduation (or leaving the program), how much did you have in student loan debt in your name for each degree(s)? A second MA/MS/MFA (not including MLS/MLIS). (Q44g)
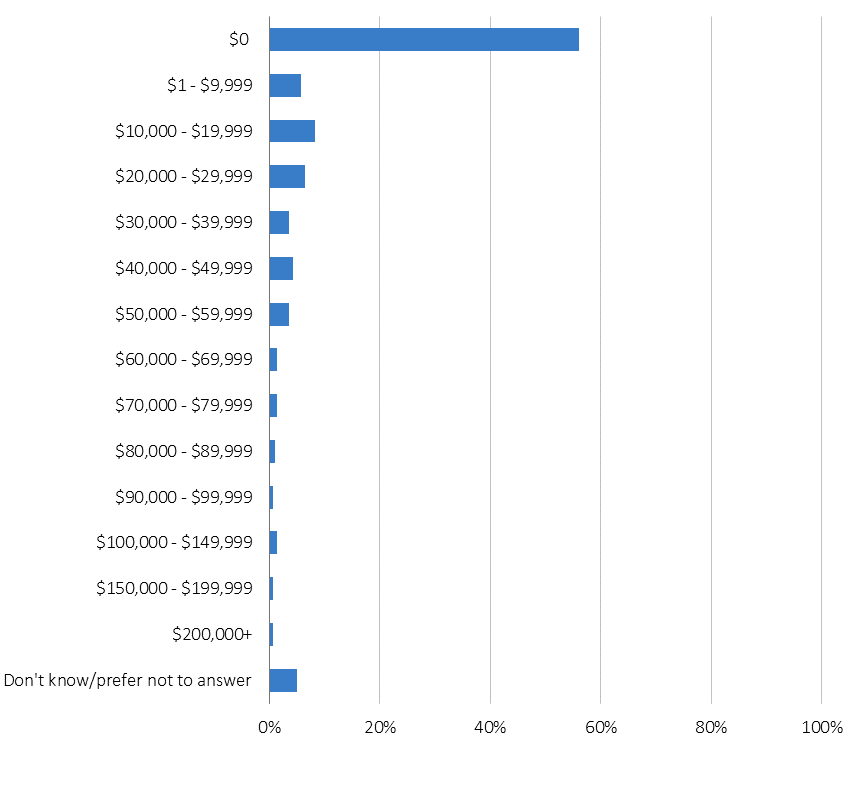
| Answer | Frequency | Percentage |
| $0 | 158 | 56.03% |
| $1 – $9,999 | 16 | 5.67% |
| $10,000 – $19,999 | 23 | 8.16% |
| $20,000 – $29,999 | 18 | 6.38% |
| $30,000 – $39,999 | 10 | 3.55% |
| $40,000 – $49,999 | 12 | 4.26% |
| $50,000 – $59,999 | 10 | 3.55% |
| $60,000 – $69,999 | 4 | 1.42% |
| $70,000 – $79,999 | 4 | 1.42% |
| $80,000 – $89,999 | 3 | 1.06% |
| $90,000 – $99,999 | 2 | 0.71% |
| $100,000 – $149,999 | 4 | 1.42% |
| $150,000 – $199,999 | 2 | 0.71% |
| $200,000+ | 2 | 0.71% |
| Don’t know/prefer not to answer | 14 | 4.96% |
Figure 125 – You indicated that you have the following degree(s) or some credits but no degree. Upon graduation (or leaving the program), how much did you have in student loan debt in your name for each degree(s)? MLS/MLIS. (Q44h)
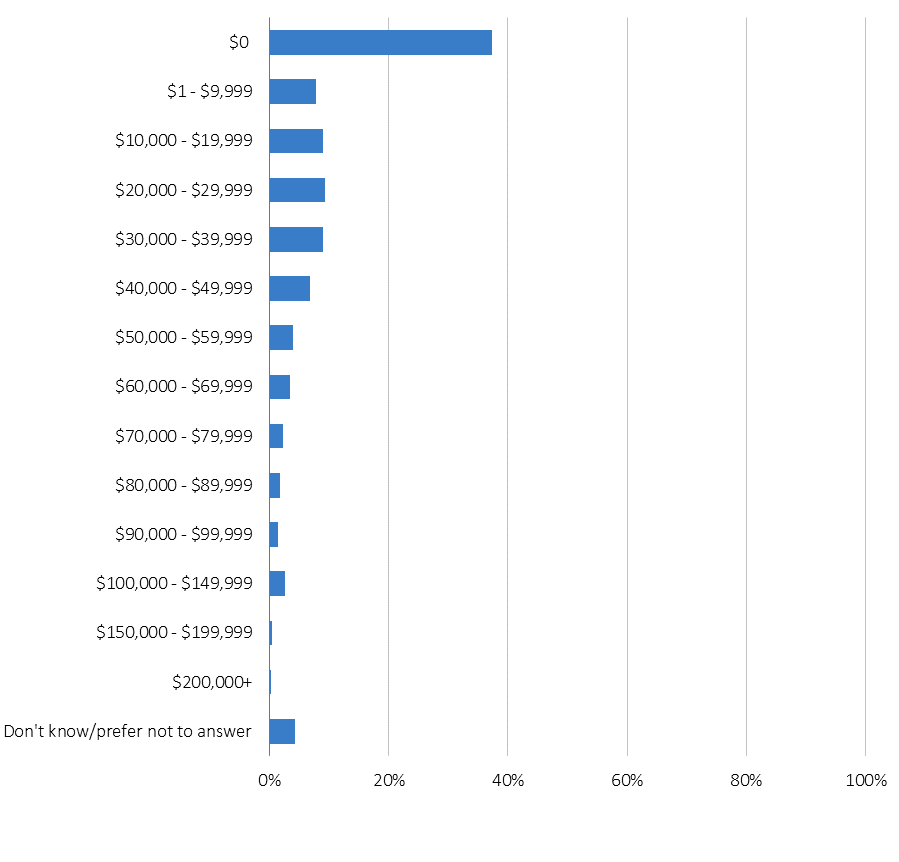
| Answer | Frequency | Percentage |
| $0 | 1234 | 37.36% |
| $1 – $9,999 | 259 | 7.84% |
| $10,000 – $19,999 | 300 | 9.08% |
| $20,000 – $29,999 | 308 | 9.32% |
| $30,000 – $39,999 | 296 | 8.96% |
| $40,000 – $49,999 | 225 | 6.81% |
| $50,000 – $59,999 | 130 | 3.94% |
| $60,000 – $69,999 | 114 | 3.45% |
| $70,000 – $79,999 | 73 | 2.21% |
| $80,000 – $89,999 | 59 | 1.79% |
| $90,000 – $99,999 | 47 | 1.42% |
| $100,000 – $149,999 | 87 | 2.63% |
| $150,000 – $199,999 | 17 | 0.51% |
| $200,000+ | 12 | 0.36% |
| Don’t know/prefer not to answer | 142 | 4.30% |
Figure 126 – You indicated that you have the following degree(s) or some credits but no degree. Upon graduation (or leaving the program), how much did you have in student loan debt in your name for each degree(s)? MBA. (Q44i)
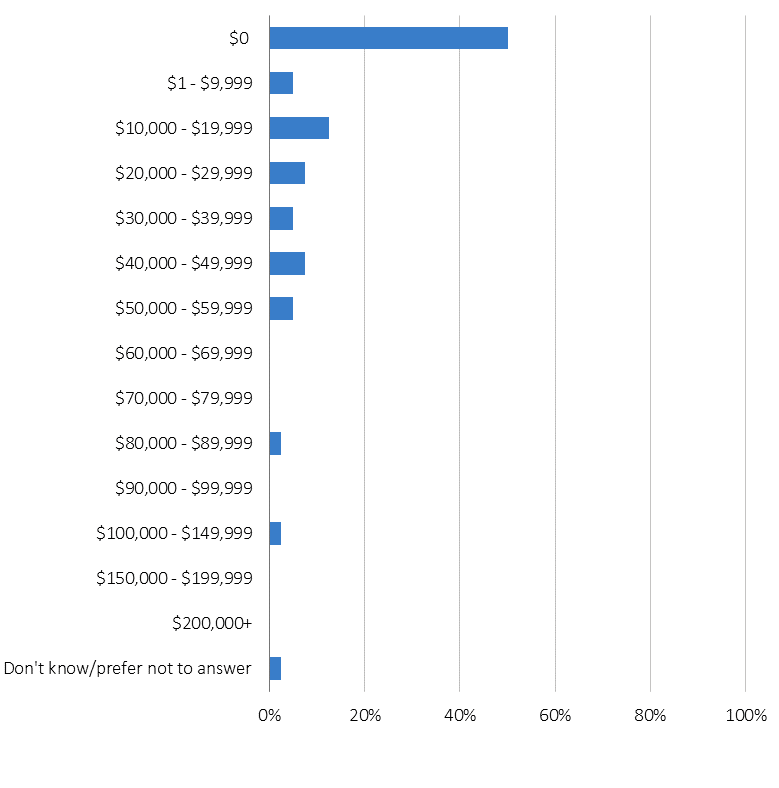
| Answer | Frequency | Percentage |
| $0 | 20 | 50.00% |
| $1 – $9,999 | 2 | 5.00% |
| $10,000 – $19,999 | 5 | 12.50% |
| $20,000 – $29,999 | 3 | 7.50% |
| $30,000 – $39,999 | 2 | 5.00% |
| $40,000 – $49,999 | 3 | 7.50% |
| $50,000 – $59,999 | 2 | 5.00% |
| $60,000 – $69,999 | 0 | 0.00% |
| $70,000 – $79,999 | 0 | 0.00% |
| $80,000 – $89,999 | 1 | 2.50% |
| $90,000 – $99,999 | 0 | 0.00% |
| $100,000 – $149,999 | 1 | 2.50% |
| $150,000 – $199,999 | 0 | 0.00% |
| $200,000+ | 0 | 0.00% |
| Don’t know/prefer not to answer | 1 | 2.50% |
Figure 127 – You indicated that you have the following degree(s) or some credits but no degree. Upon graduation (or leaving the program), how much did you have in student loan debt in your name for each degree(s)? PhD. (Q44j)
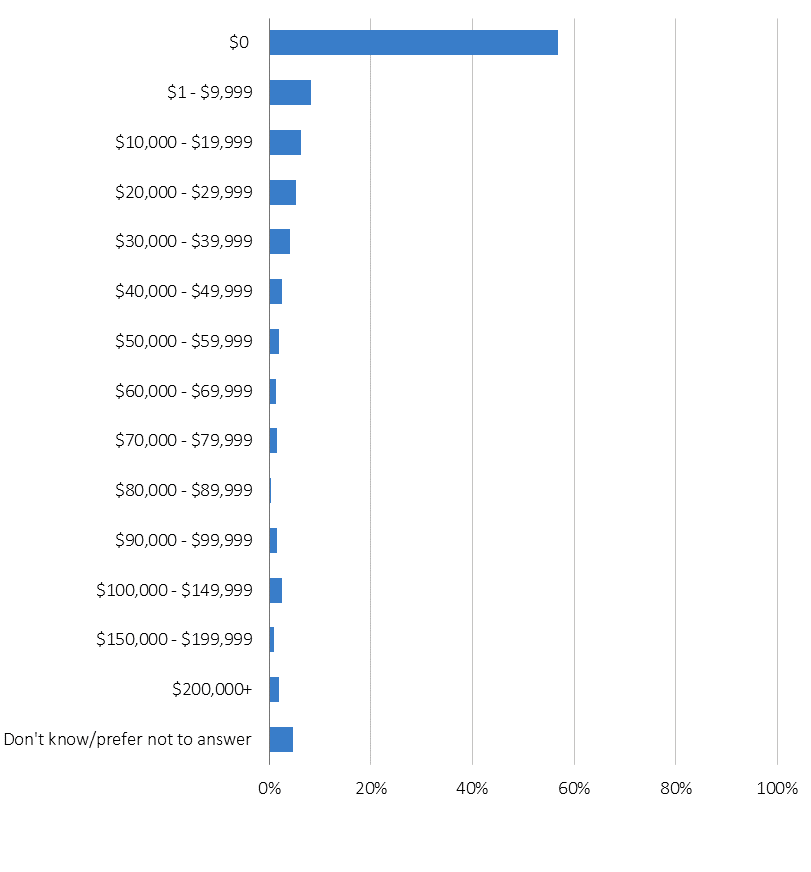
| Answer | Frequency | Percentage |
| $0 | 181 | 56.92% |
| $1 – $9,999 | 26 | 8.18% |
| $10,000 – $19,999 | 20 | 6.29% |
| $20,000 – $29,999 | 17 | 5.35% |
| $30,000 – $39,999 | 13 | 4.09% |
| $40,000 – $49,999 | 8 | 2.52% |
| $50,000 – $59,999 | 6 | 1.89% |
| $60,000 – $69,999 | 4 | 1.26% |
| $70,000 – $79,999 | 5 | 1.57% |
| $80,000 – $89,999 | 1 | 0.31% |
| $90,000 – $99,999 | 5 | 1.57% |
| $100,000 – $149,999 | 8 | 2.52% |
| $150,000 – $199,999 | 3 | 0.94% |
| $200,000+ | 6 | 1.89% |
| Don’t know/prefer not to answer | 15 | 4.72% |
Figure 128 – You indicated that you have the following degree(s) or some credits but no degree. Upon graduation (or leaving the program), how much did you have in student loan debt in your name for each degree(s)? JD. (Q44k)
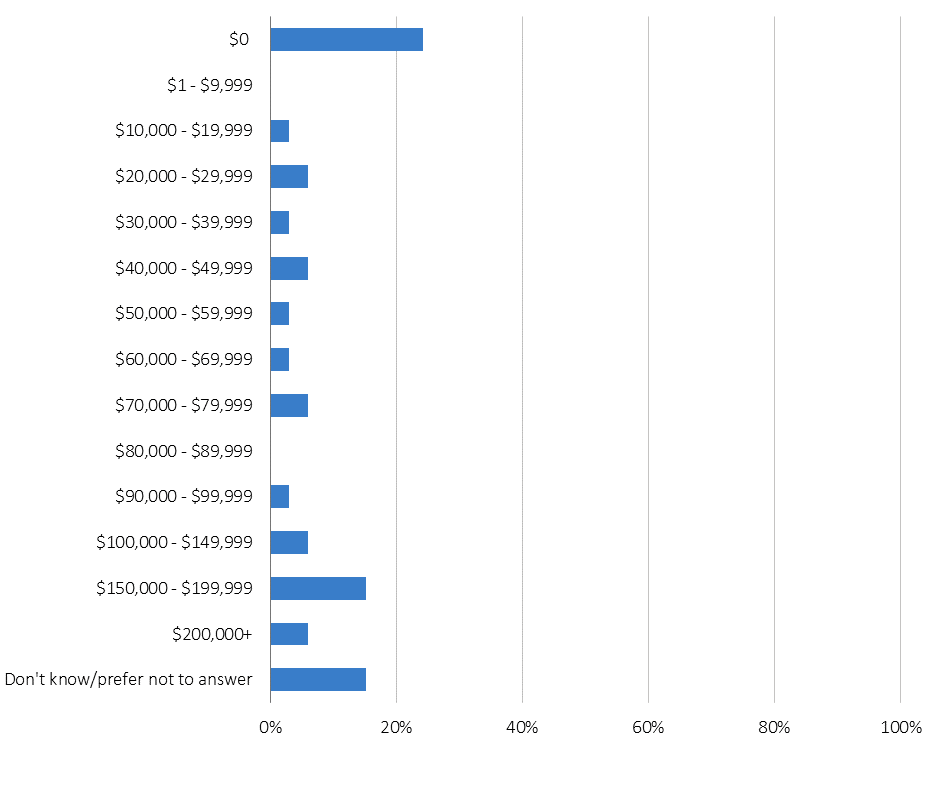
| Answer | Frequency | Percentage |
| $0 | 8 | 24.24% |
| $1 – $9,999 | 0 | 0.00% |
| $10,000 – $19,999 | 1 | 3.03% |
| $20,000 – $29,999 | 2 | 6.06% |
| $30,000 – $39,999 | 1 | 3.03% |
| $40,000 – $49,999 | 2 | 6.06% |
| $50,000 – $59,999 | 1 | 3.03% |
| $60,000 – $69,999 | 1 | 3.03% |
| $70,000 – $79,999 | 2 | 6.06% |
| $80,000 – $89,999 | 0 | 0.00% |
| $90,000 – $99,999 | 1 | 3.03% |
| $100,000 – $149,999 | 2 | 6.06% |
| $150,000 – $199,999 | 5 | 15.15% |
| $200,000+ | 2 | 6.06% |
| Don’t know/prefer not to answer | 5 | 15.15% |
Figure 129 – You indicated that you have the following degree(s) or some credits but no degree. Upon graduation (or leaving the program), how much did you have in student loan debt in your name for each degree(s)? Other degrees. (Q44l)
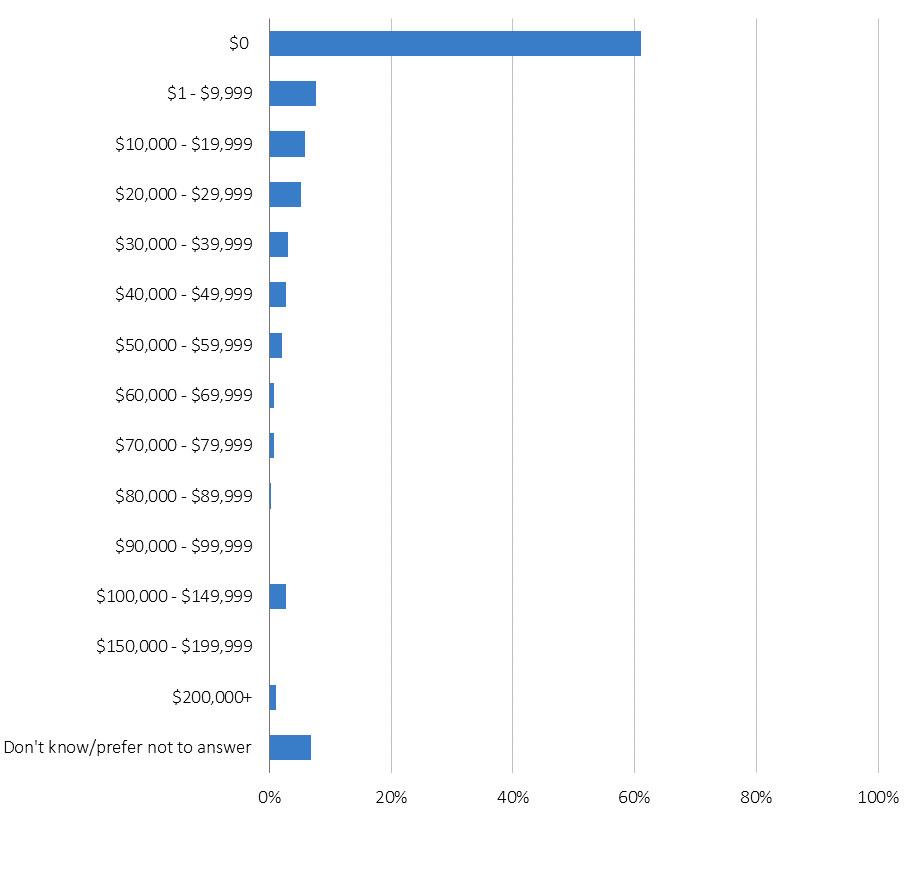
| Answer | Frequency | Percentage |
| $0 | 177 | 61.03% |
| $1 – $9,999 | 22 | 7.59% |
| $10,000 – $19,999 | 17 | 5.86% |
| $20,000 – $29,999 | 15 | 5.17% |
| $30,000 – $39,999 | 9 | 3.10% |
| $40,000 – $49,999 | 8 | 2.76% |
| $50,000 – $59,999 | 6 | 2.07% |
| $60,000 – $69,999 | 2 | 0.69% |
| $70,000 – $79,999 | 2 | 0.69% |
| $80,000 – $89,999 | 1 | 0.34% |
| $90,000 – $99,999 | 0 | 0.00% |
| $100,000 – $149,999 | 8 | 2.76% |
| $150,000 – $199,999 | 0 | 0.00% |
| $200,000+ | 3 | 1.03% |
| Don’t know/prefer not to answer | 20 | 6.90% |
Figure 130 – Do you hold either of the following certifications? Please select all that apply. (Q45)
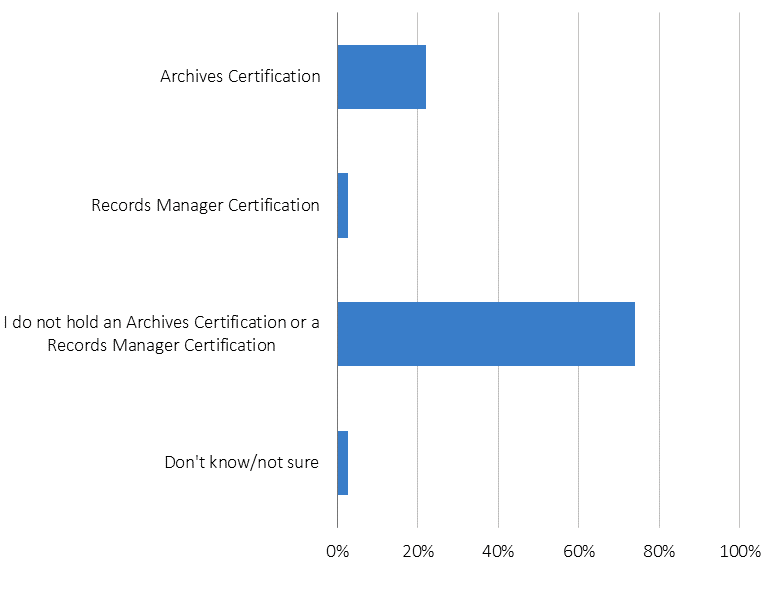
| Answer | Frequency | Percentage |
| Archives Certification | 1227 | 22.05% |
| Records Manager Certification | 152 | 2.73% |
| I do not hold an Archives Certification or a Records Manager Certification | 4113 | 73.92% |
| Don’t know/not sure | 153 | 2.75% |
Figure 131 – What source(s) of training or education has been most useful to your current position? Select up to two options. (Q46)
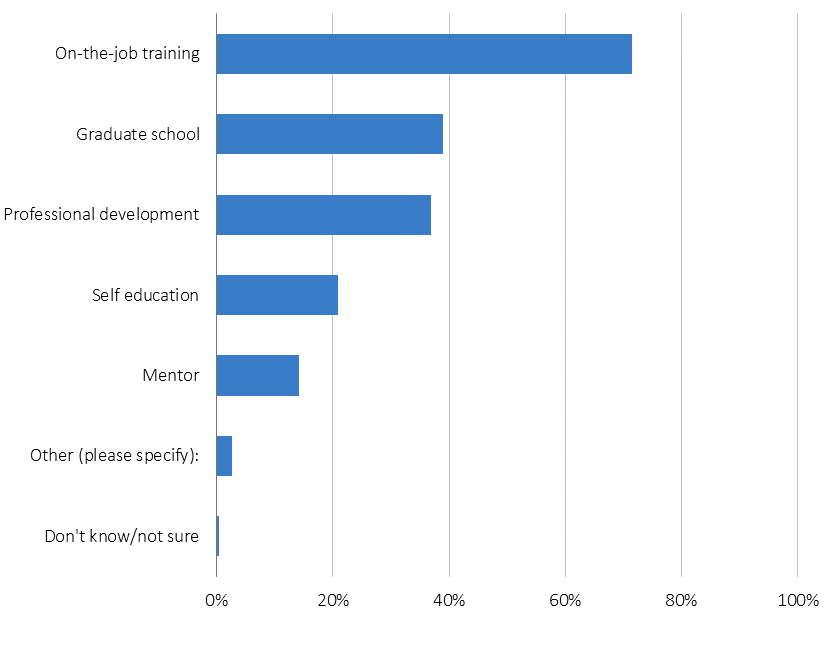
| Answer | Frequency | Percentage |
| On-the-job training | 3895 | 71.44% |
| Graduate school | 2124 | 38.96% |
| Professional development | 2011 | 36.89% |
| Self-education | 1137 | 20.85% |
| Mentor | 768 | 14.09% |
| Other (please specify): | 148 | 2.71% |
| Don’t know/not sure | 18 | 0.33% |
Figure 132 – What is your preferred format for professional development/training? (Q47)
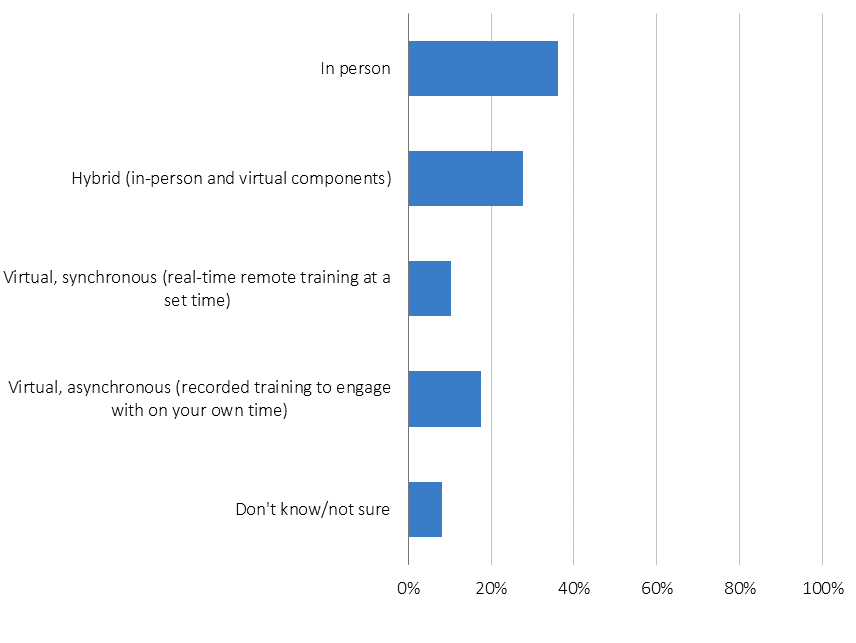
| Answer | Frequency | Percentage |
| In person | 1,991 | 36.18% |
| Hybrid (in-person and virtual components) | 1,529 | 27.78% |
| Virtual, synchronous (real-time remote training at a set time) | 572 | 10.39% |
| Virtual, asynchronous (recorded training to engage with on your own time) | 963 | 17.50% |
| Don’t know/not sure | 448 | 8.14% |
Figure 133 – Generally speaking, how much total financial support (including registration fees and travel/lodging) do you receive from your employer in a typical year for professional development and training outside of your organization (e.g., workshops, seminars, conferences, association meetings)? (Q49)
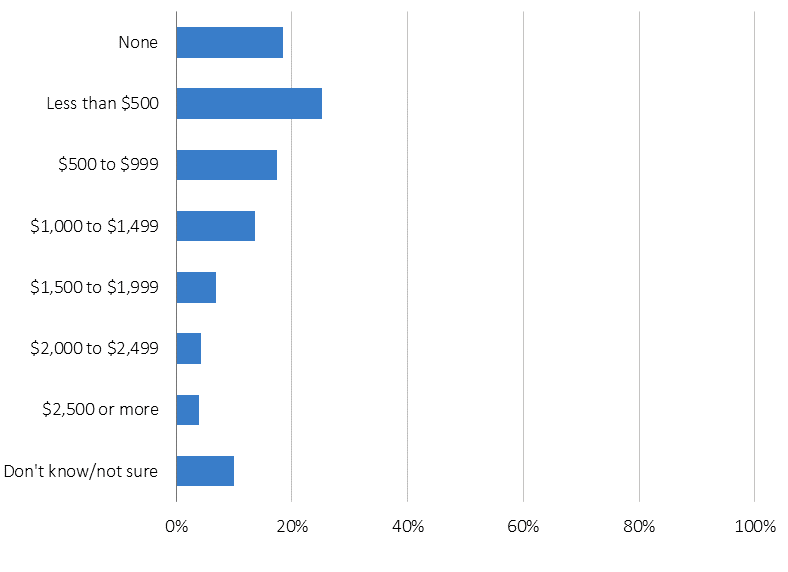
| Answer | Frequency | Percentage |
| None | 930 | 18.38% |
| Less than $500 | 1,278 | 25.26% |
| $500 to $999 | 886 | 17.51% |
| $1,000 to $1,499 | 691 | 13.66% |
| $1,500 to $1,999 | 349 | 6.90% |
| $2,000 to $2,499 | 221 | 4.37% |
| $2,500 or more | 200 | 3.95% |
| Don’t know/not sure | 504 | 9.96% |
Figure 134 – How much in total (including registration fees and travel/lodging) are you willing to invest of your personal financial resources, per year, in your professional development and training (e.g., workshops, seminars, conferences, association meetings)? (Q50)
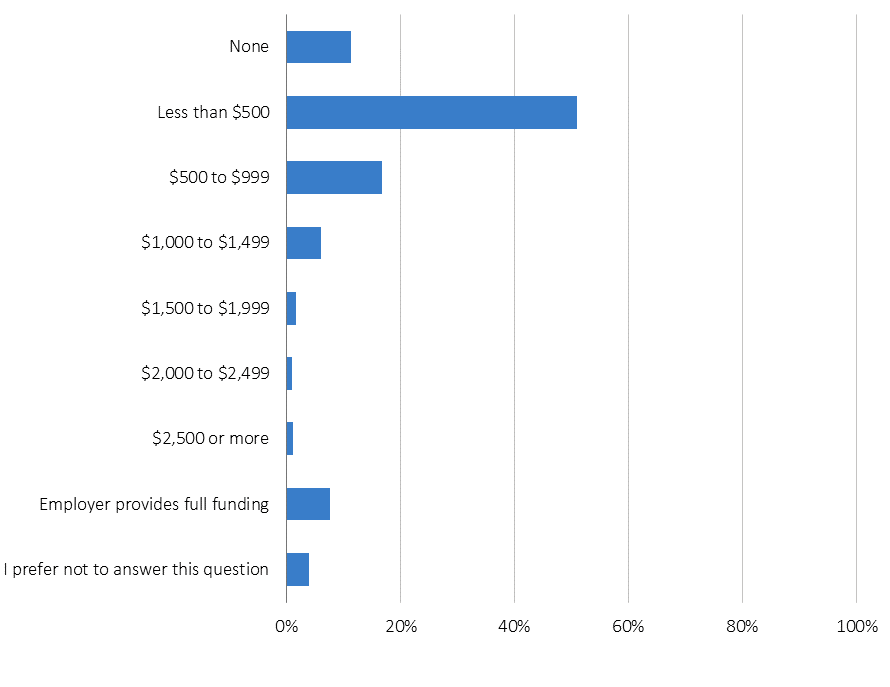
| Answer | Frequency | Percentage |
| None | 613 | 11.22% |
| Less than $500 | 2,780 | 50.87% |
| $500 to $999 | 918 | 16.80% |
| $1,000 to $1,499 | 327 | 5.98% |
| $1,500 to $1,999 | 86 | 1.57% |
| $2,000 to $2,499 | 54 | 0.99% |
| $2,500 or more | 59 | 1.08% |
| Employer provides full funding | 413 | 7.56% |
| I prefer not to answer this question | 215 | 3.93% |
Figure 135 – When seeking professional development, how much of a barrier is each of the following? (Q51)
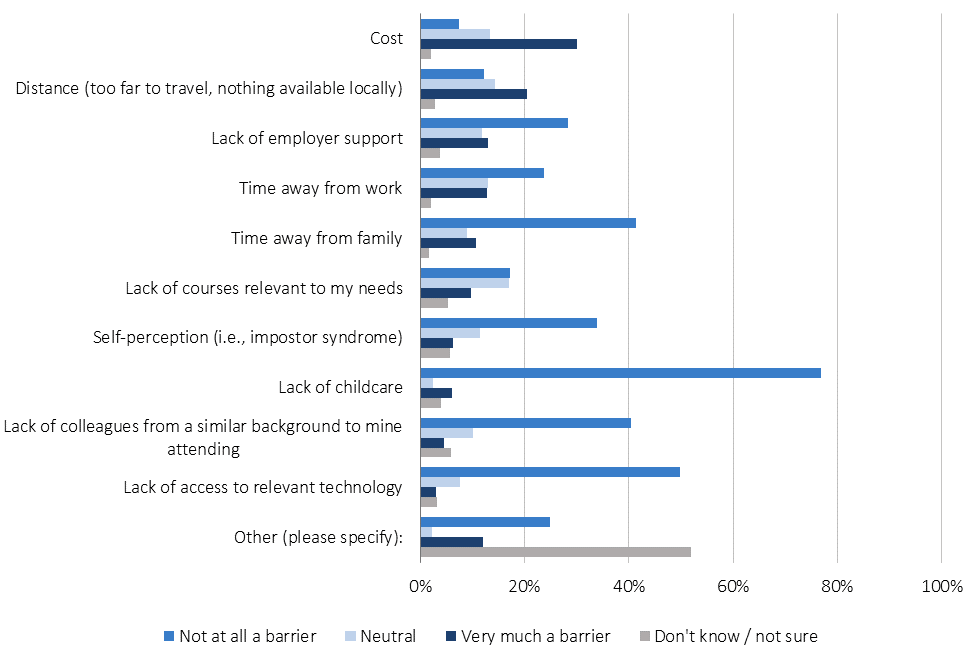
| Answer | Not at all a barrier
Frequency |
Not at all a barrier
Percentage |
Neutral
Frequency |
Neutral
Percentage |
Very much a barrier
Frequency |
Very much a barrier
Percentage |
| Cost | 401 | 7.38% | 723 | 13.31% | 1,635 | 30.11% |
| Distance (too far to travel, nothing available locally) | 665 | 12.22% | 786 | 14.44% | 1,119 | 20.56% |
| Lack of employer support | 1,539 | 28.29% | 645 | 11.85% | 711 | 13.07% |
| Time away from work | 1,288 | 23.69% | 703 | 12.93% | 701 | 12.90% |
| Time away from family | 2,257 | 41.48% | 488 | 8.97% | 580 | 10.66% |
| Lack of courses relevant to my needs | 937 | 17.25% | 930 | 17.12% | 528 | 9.72% |
| Self-perception (i.e., impostor syndrome) | 1,835 | 33.84% | 623 | 11.49% | 346 | 6.38% |
| Lack of childcare | 4,166 | 76.85% | 135 | 2.49% | 328 | 6.05% |
| Lack of colleagues from a similar background to mine attending | 2,195 | 40.42% | 550 | 10.13% | 253 | 4.66% |
| Lack of access to relevant technology | 2,711 | 49.91% | 418 | 7.70% | 164 | 3.02% |
| Other (please specify): | 180 | 24.83% | 17 | 2.34% | 87 | 12.00% |
Figure 136 – If there were no barriers to obtaining professional development, which of the following would you most like to learn more about in the next 5 years? Please select all that apply. (Q52)
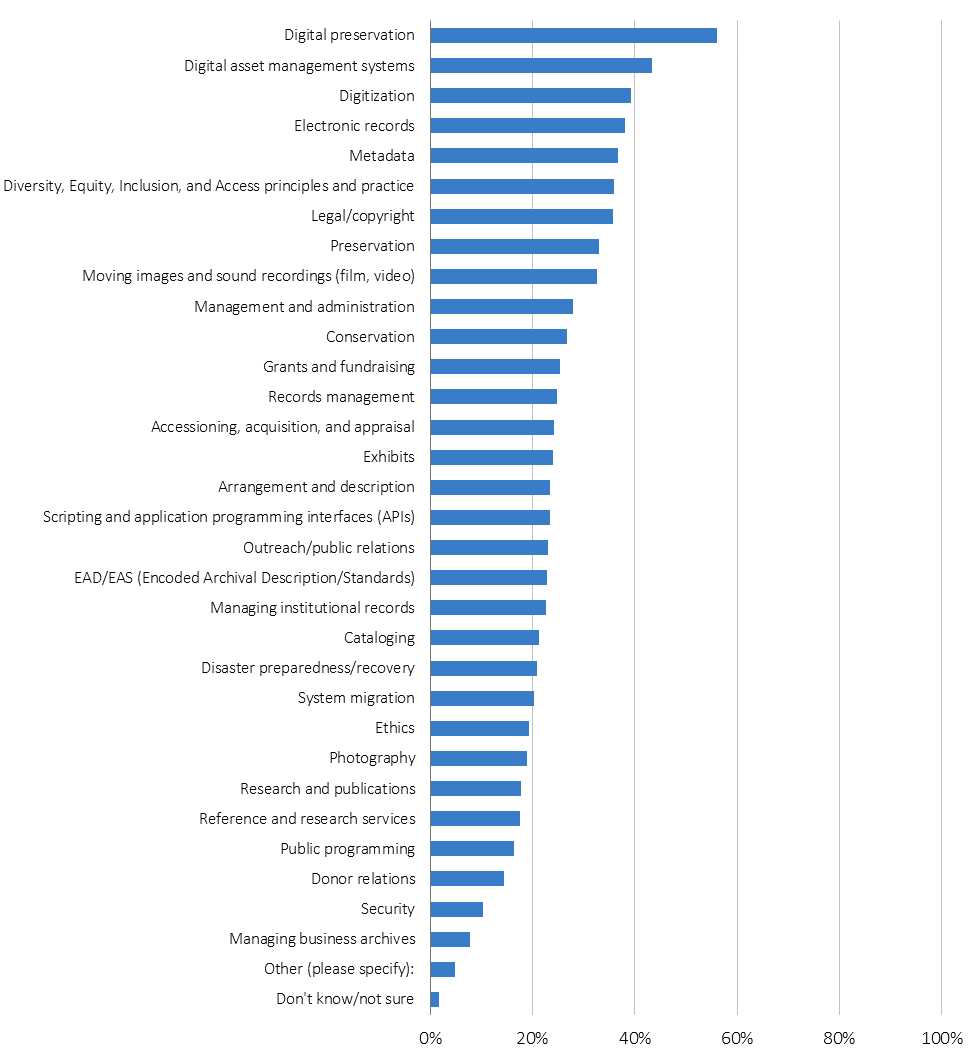
| Answer | Frequency | Percentage |
| Digital preservation | 3,077 | 56.16% |
| Digital asset management systems | 2,376 | 43.37% |
| Digitization | 2,154 | 39.31% |
| Electronic records | 2,091 | 38.16% |
| Metadata | 2,013 | 36.74% |
| Diversity, Equity, Inclusion, and Access principles and practice | 1,967 | 35.90% |
| Legal/copyright | 1,953 | 35.65% |
| Preservation | 1,809 | 33.02% |
| Moving images and sound recordings (film, video) | 1,782 | 32.52% |
| Management and administration | 1,531 | 27.94% |
| Conservation | 1,468 | 26.79% |
| Grants and fundraising | 1,387 | 25.31% |
| Records management | 1,359 | 24.80% |
| Accessioning, acquisition, and appraisal | 1,324 | 24.16% |
| Exhibits | 1,319 | 24.07% |
| Arrangement and description | 1,286 | 23.47% |
| Scripting and application programming interfaces (APIs) | 1,284 | 23.43% |
| Outreach/public relations | 1,260 | 23.00% |
| EAD/EAS (Encoded Archival Description/Standards) | 1,254 | 22.89% |
| Managing institutional records | 1,240 | 22.63% |
| Cataloging | 1,164 | 21.24% |
| Disaster preparedness/recovery | 1,144 | 20.88% |
| System migration | 1,117 | 20.39% |
| Ethics | 1,058 | 19.31% |
| Photography | 1,035 | 18.89% |
| Research and publications | 972 | 17.74% |
| Reference and research services | 967 | 17.65% |
| Public programming | 900 | 16.43% |
| Donor relations | 795 | 14.51% |
| Security | 562 | 10.26% |
| Managing business archives | 431 | 7.87% |
| Other (please specify): | 268 | 4.89% |
| Don’t know/not sure | 93 | 1.70% |
Figure 137 – You expressed interest in the following professional development topic(s). Please rate your current level of knowledge, skills, and abilities for each item. (Q53)
| Answer | Very under-developed
Frequency |
Very under-developed
Percentage |
Neither developed nor under-developed
Frequency |
Neither developed nor under-developed
Percentage |
Very developed
Frequency |
Very developed
Percentage |
| Accessioning, acquisition, and appraisal | 70 | 5.32% | 117 | 8.88% | 68 | 5.16% |
| Arrangement and description | 34 | 2.66% | 82 | 6.42% | 140 | 10.96% |
| Cataloging | 81 | 6.99% | 96 | 8.29% | 67 | 5.79% |
| Conservation | 141 | 9.70% | 197 | 13.56% | 22 | 1.51% |
| Digital asset management systems | 199 | 8.42% | 282 | 11.93% | 45 | 1.90% |
| Digital preservation | 194 | 6.35% | 330 | 10.81% | 63 | 2.06% |
| Digitization | 104 | 4.86% | 209 | 9.77% | 101 | 4.72% |
| Disaster preparedness / recovery | 74 | 6.51% | 150 | 13.19% | 26 | 2.29% |
| Donor relations | 67 | 8.50% | 88 | 11.17% | 27 | 3.43% |
| EAD/EAS (Encoded Archival Description / Standards) | 204 | 16.41% | 148 | 11.91% | 20 | 1.61% |
| Electronic records | 157 | 7.57% | 266 | 12.82% | 38 | 1.83% |
| Ethics | 8 | 0.77% | 173 | 16.59% | 47 | 4.51% |
| Diversity, Equity, Inclusion, and Access principles and practice | 23 | 1.17% | 276 | 14.10% | 61 | 3.12% |
| Exhibits | 72 | 5.48% | 183 | 13.94% | 42 | 3.20% |
| Grants and fundraising | 190 | 13.84% | 165 | 12.02% | 16 | 1.17% |
| Legal / copyright | 107 | 5.51% | 251 | 12.92% | 21 | 1.08% |
| Management and administration | 62 | 4.08% | 202 | 13.31% | 54 | 3.56% |
| Managing business archives | 50 | 11.63% | 52 | 12.09% | 17 | 3.95% |
| Managing institutional records | 74 | 6.00% | 186 | 15.09% | 27 | 2.19% |
| Metadata | 83 | 4.16% | 230 | 11.52% | 88 | 4.41% |
| Moving images and sound recordings (film, video) | 176 | 9.94% | 228 | 12.87% | 66 | 3.73% |
| Outreach / public relations | 36 | 2.89% | 168 | 13.47% | 54 | 4.33% |
| Photography | 43 | 4.17% | 151 | 14.65% | 37 | 3.59% |
| Public programming | 56 | 6.25% | 126 | 14.06% | 35 | 3.91% |
| Preservation | 76 | 4.22% | 224 | 12.45% | 64 | 3.56% |
| Records management | 58 | 4.29% | 181 | 13.40% | 73 | 5.40% |
| Reference and research services | 19 | 1.98% | 78 | 8.11% | 155 | 16.11% |
| Research and publications | 34 | 3.52% | 159 | 16.48% | 43 | 4.46% |
| Security | 23 | 4.11% | 113 | 20.21% | 12 | 2.15% |
| Scripting and application programming interfaces (APIs) | 491 | 38.45% | 77 | 6.03% | 7 | 0.55% |
| System migration | 234 | 21.10% | 138 | 12.44% | 6 | 0.54% |
| Other (please specify): | 16 | 10.06% | 17 | 10.69% | 10 | 6.29% |
Figure 138 – What led you to begin working in your first archives-related job? Please select all that apply. (Q54)
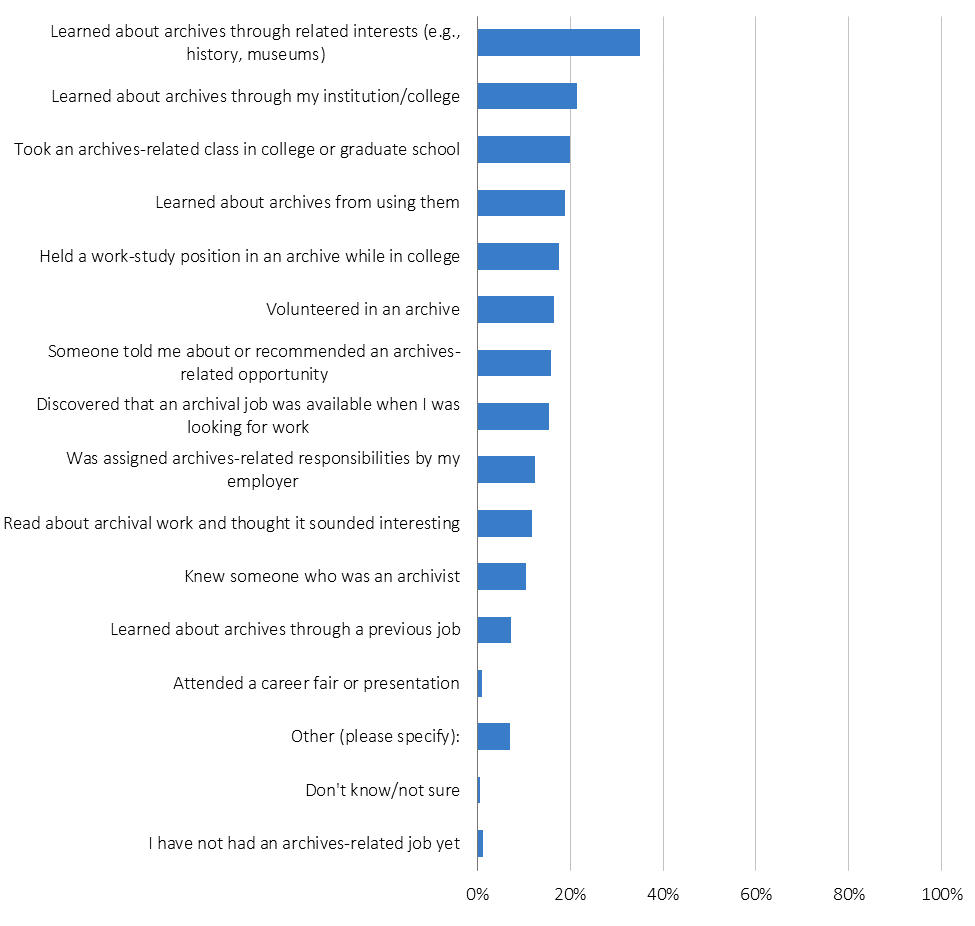
| Answer | Frequency | Percentage |
| Learned about archives through related interests (e.g., history, museums) | 1,989 | 34.99% |
| Learned about archives through my institution/college | 1,221 | 21.48% |
| Took an archives-related class in college or graduate school | 1,130 | 19.88% |
| Learned about archives from using them | 1,072 | 18.86% |
| Held a work-study position in an archive while in college | 999 | 17.57% |
| Volunteered in an archive | 940 | 16.53% |
| Someone told me about or recommended an archives-related opportunity | 895 | 15.74% |
| Discovered that an archival job was available when I was looking for work | 877 | 15.43% |
| Was assigned archives-related responsibilities by my employer | 709 | 12.47% |
| Read about archival work and thought it sounded interesting | 667 | 11.73% |
| Knew someone who was an archivist | 587 | 10.33% |
| Learned about archives through a previous job | 408 | 7.18% |
| Attended a career fair or presentation | 55 | 0.97% |
| Other (please specify): | 399 | 7.02% |
| Don’t know/not sure | 34 | 0.60% |
| I have not had an archives-related job yet | 71 | 1.25% |
Figure 139 – Is archives your first career? (NOTE: “Career” is defined as a job or profession that someone performs for a long time and/or makes up a large proportion of their overall time in the workforce, with opportunities for progression or advancement.) (Q55)
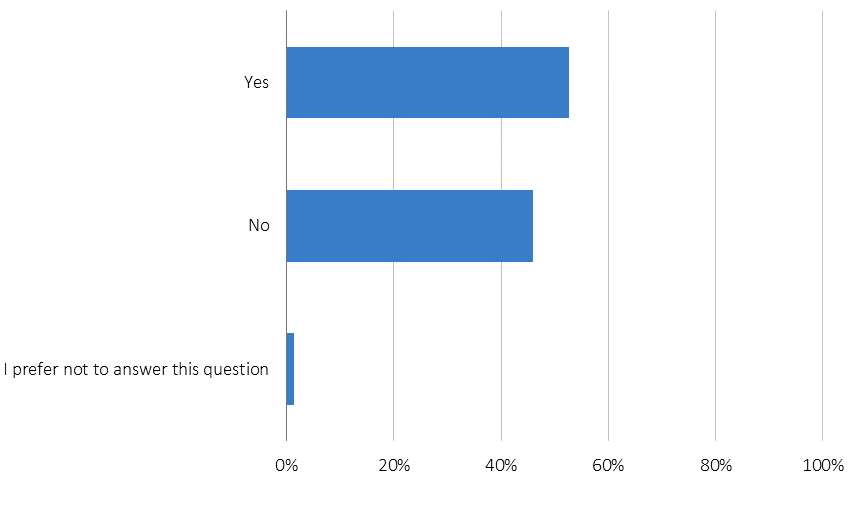
| Answer | Frequency | Percentage |
| Yes | 2,960 | 52.65% |
| No | 2,582 | 45.93% |
| I prefer not to answer this question | 80 | 1.42% |
Figure 140 – Are you considering leaving the archives profession within the next 5 years? (Q58)
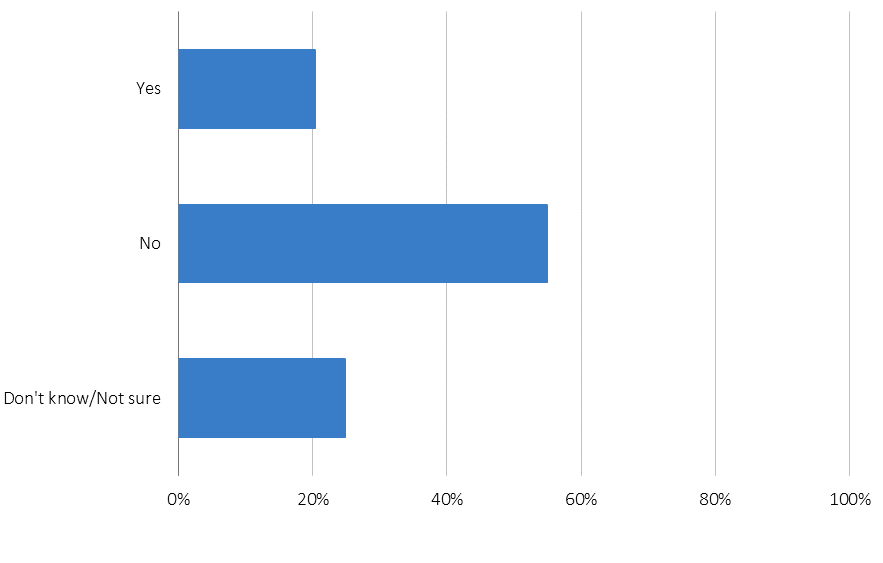
| Answer | Frequency | Percentage |
| Yes | 1,118 | 20.33% |
| No | 3,017 | 54.87% |
| Don’t know/Not sure | 1,363 | 24.79% |
Figure 141 – What are the top reasons you are considering leaving the archives field? Please select all that apply. (Q59)
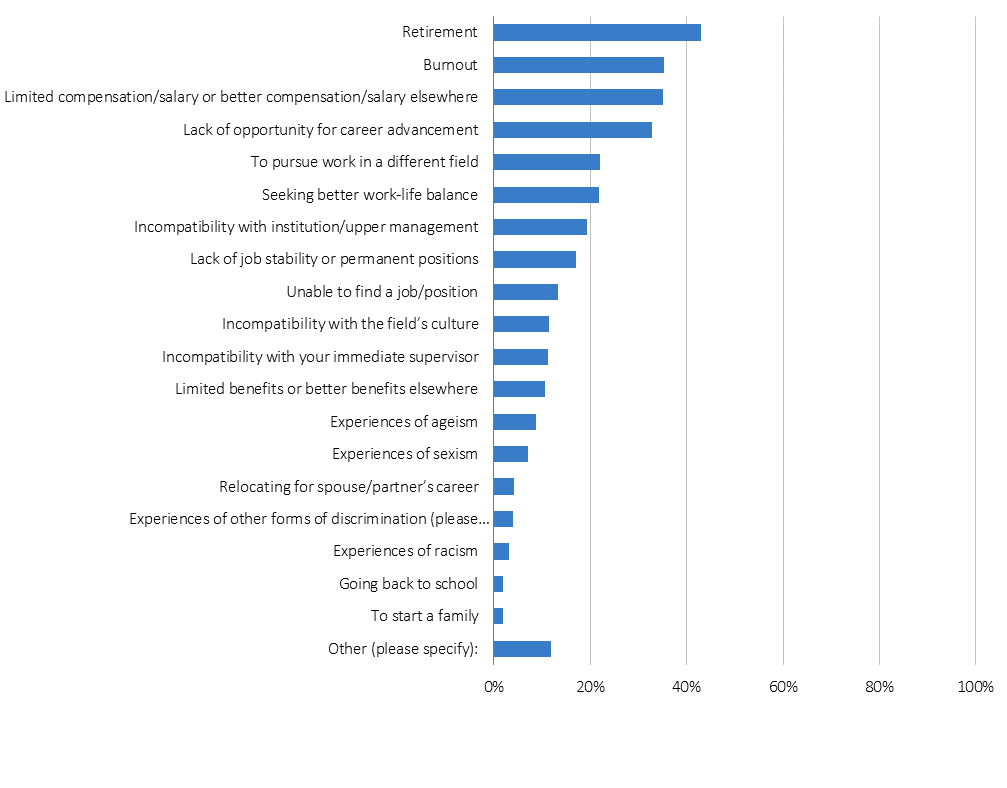
| Answer | Frequency | Percentage |
| Retirement | 479 | 42.92% |
| Burnout | 394 | 35.30% |
| Limited compensation/salary or better
compensation/salary elsewhere |
392 | 35.13% |
| Lack of opportunity for career advancement | 366 | 32.80% |
| To pursue work in a different field | 247 | 22.13% |
| Seeking better work-life balance | 243 | 21.77% |
| Incompatibility with institution/upper
management |
217 | 19.44% |
| Lack of job stability or permanent positions | 191 | 17.11% |
| Unable to find a job/position | 148 | 13.26% |
| Incompatibility with the field’s culture | 129 | 11.56% |
| Incompatibility with your immediate
supervisor |
126 | 11.29% |
| Limited benefits or better benefits elsewhere | 119 | 10.66% |
| Experiences of ageism | 98 | 8.78% |
| Experiences of sexism | 79 | 7.08% |
| Relocating for spouse/partner’s career | 46 | 4.12% |
| Experiences of other forms of
discrimination (please specify)_____________ |
44 | 3.94% |
| Experiences of racism | 35 | 3.14% |
| Going back to school | 22 | 1.97% |
| To start a family | 22 | 1.97% |
| Other (please specify): | 132 | 11.83% |
Figure 142 – When do you plan to retire? (Q60)
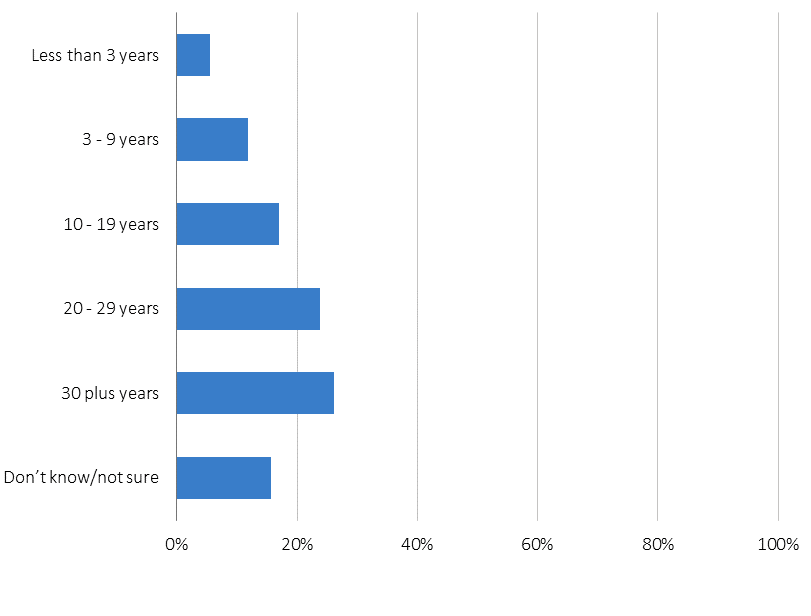
| Answer | Frequency | Percentage |
| Less than 3 years | 296 | 5.45% |
| 3 – 9 years | 645 | 11.88% |
| 10 – 19 years | 926 | 17.05% |
| 20 – 29 years | 1291 | 23.78% |
| 30 plus years | 1420 | 26.15% |
| Don’t know/not sure | 852 | 15.69% |
Figure 143 – Are you currently planning to retire past the age of 67? (Q61)
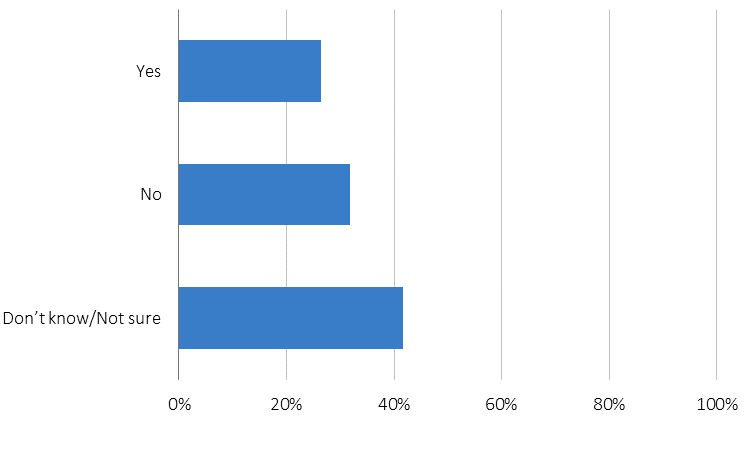
| Answer | Frequency | Percentage |
| Yes | 1150 | 26.47% |
| No | 1385 | 31.88% |
| Don’t Know/Not Sure | 1810 | 41.66% |
Figure 144 – Please indicate if you are a member of any of the following. Select all that apply. (Q62)
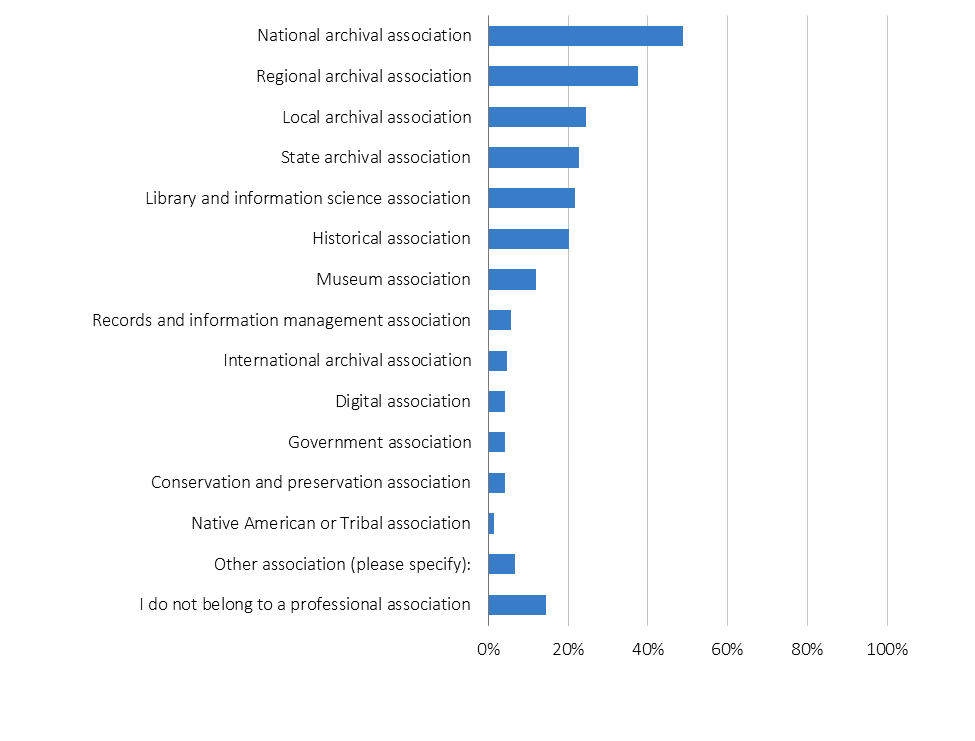
| Answer | Frequency | Percentage |
| National archival association | 2,684 | 48.71% |
| Regional archival association | 2,067 | 37.51% |
| Local archival association | 1,350 | 24.50% |
| State archival association | 1,259 | 22.85% |
| Library and information science association | 1,197 | 21.72% |
| Historical association | 1,115 | 20.24% |
| Museum association | 656 | 11.91% |
| Records and information management association | 309 | 5.61% |
| International archival association | 257 | 4.66% |
| Digital association | 237 | 4.30% |
| Government association | 234 | 4.25% |
| Conservation and preservation association | 231 | 4.19% |
| Native American or Tribal association | 80 | 1.45% |
| Other association (please specify): | 375 | 6.81% |
| I do not belong to a professional association | 796 | 14.45% |
Figure 145 – Please indicate if you are a member of any of the following professional associations. Select all that apply. (Q63)
| Answer | Frequency | Percentage |
| Academy of Certified Archivists (ACA) | 844 | 18.78% |
| AIIM, International | 40 | 0.89% |
| American Association for State and Local History (AASLH) | 412 | 9.17% |
| American Association of Collegiate Registrars and Admissions Officers (AACRO) | 0 | 0.00% |
| American Association of Law Libraries (AALL) | 16 | 0.36% |
| American Association of Museums (AAM) | 316 | 7.03% |
| American Historical Association (AHA) | 138 | 3.07% |
| American Indian Library Association (AILA) | 10 | 0.22% |
| American Institute for the Conservation of Historic and Artistic Works (AIC) | 56 | 1.25% |
| American Library Association (ALA) | 772 | 17.18% |
| American Society for Information Science and Technology (ASIST) | 32 | 0.71% |
| Appalachian Studies Association | 14 | 0.31% |
| Archivists for Congregations of Women Religious (ACWR) | 86 | 1.91% |
| Archivists of Religious Institutions (NY area) | 10 | 0.22% |
| Archivists Roundtable of Metropolitan New York (NY-ART) | 199 | 4.43% |
| Arizona Archives Alliance (AZAA) | 27 | 0.60% |
| ARMA International | 166 | 3.69% |
| Art Libraries Society of North America (ARLIS/NA) | 132 | 2.94% |
| Association for Documentary Editing (ADE) | 13 | 0.29% |
| Association for Library and Information Science Educators (ALISE) | 14 | 0.31% |
| Association for the Study of African American Life and History (ASALH) | 37 | 0.82% |
| Association of Catholic Diocesan Archivists (ACDA) | 90 | 2.00% |
| Association of College and Research Libraries (ACRL) | 269 | 5.99% |
| Association of Hawai’i Archivists | 26 | 0.58% |
| Association of Moving Image Archivists (AMIA) | 201 | 4.47% |
| Association of Recorded Sound Collections (ARSC) | 63 | 1.40% |
| Association of St. Louis Area Archivists (ASLAA) | 46 | 1.02% |
| Association of Tribal Archives, Libraries, & Museums (ATALM) | 32 | 0.71% |
| Bay Area Archivists | 28 | 0.62% |
| Chicago Area Archivists (CAA) | 138 | 3.07% |
| Cleveland Archival Roundtable | 28 | 0.62% |
| Coalition of Archivists and Records Professionals in Western Pennsylvania (CARPWA) | 1 | 0.02% |
| Conference of Inter-Mountain Archivists (CIMA) | 78 | 1.74% |
| Council of State Archivists (COSA) | 95 | 2.11% |
| Delaware Valley Archivists Group (DVAG) | 76 | 1.69% |
| Digital Asset Management (DAM) Association | 8 | 0.18% |
| First Archivists Circle | 2 | 0.04% |
| Greater New Orleans Archivists (GNOA) | 16 | 0.36% |
| International Association for Social Science Information Services and Technology (I-ASSIST) | 8 | 0.18% |
| International Association of Clerks, Recorders, Election Officials, and Treasurers (IACREOT) | 0 | 0.00% |
| International Council on Archives (ICA) | 75 | 1.67% |
| International Institute of Municipal Clerks (IIMC) | 2 | 0.04% |
| Kansas City Area Archivists (KCAA) | 40 | 0.89% |
| Kentucky Council on Archives (KCA) | 47 | 1.05% |
| Los Angeles Archivists Collective (LAAC) | 96 | 2.14% |
| Louisiana Archives and Manuscripts Association (LAMA) | 41 | 0.91% |
| Lutheran Historical Conference | 4 | 0.09% |
| Manuscript Society | 11 | 0.24% |
| Miami Valley Archives Roundtable (MVAR) | 11 | 0.24% |
| Michigan Archival Association (MAA) | 73 | 1.62% |
| Mid-Atlantic Regional Archives Conference (MARAC) | 592 | 13.17% |
| Midwest Archives Conference (MAC) | 518 | 11.53% |
| Museum Computer Network (MCN) | 14 | 0.31% |
| Music Library Association (MLA) | 31 | 0.69% |
| National Association of Counties (NaCO) | 0 | 0.00% |
| National Association of Government Archives and Records Administrators (NAGARA) | 221 | 4.92% |
| National Conference of State Historic Preservation Officers (NCSHPO) | 0 | 0.00% |
| National Council on Public History (NCPH) | 110 | 2.45% |
| National Genealogical Society (NGS) | 34 | 0.76% |
| Native Libraries Round Table | 0 | 0.00% |
| New England Archivists (NEA) | 337 | 7.50% |
| New England Archivists of Religious Institutions (NEARI) | 3 | 0.07% |
| New Hampshire Archives Group (NHAG) | 11 | 0.24% |
| New York Archives Conference (NYAC) | 94 | 2.09% |
| Northwest Archivists, Inc. (NWA) | 138 | 3.07% |
| Oklahoma Conservation Congress (OCC) | 2 | 0.04% |
| Oral History Association (OHA) | 73 | 1.62% |
| Organization of American Historians (OAH) | 51 | 1.13% |
| Palmetto Archives, Libraries, and Museum Council on Preservation (PALMCOP) | 6 | 0.13% |
| Portland Area Archivists | 15 | 0.33% |
| Public Library Association (PLA) | 20 | 0.45% |
| Rare Books and Manuscripts Section (RBMS) | 259 | 5.76% |
| Regional museum associations | 112 | 2.49% |
| Seattle Area Archivists | 50 | 1.11% |
| Society for History in the Federal Government (SHFG) | 16 | 0.36% |
| Society of Alabama Archivists | 32 | 0.71% |
| Society of American Archivists (SAA) | 2,515 | 55.96% |
| Society of American Archivists Student Chapter | 46 | 1.02% |
| Society of California Archivists (SCA) | 281 | 6.25% |
| Society of Florida Archivists (SFA) | 56 | 1.25% |
| Society of Georgia Archivists (SGA) | 125 | 2.78% |
| Society of Indiana Archivists (SIA) | 49 | 1.09% |
| Society of Mississippi Archivists (SMA) | 17 | 0.38% |
| Society of North Carolina Archivists (SNCA) | 86 | 1.91% |
| Society of Ohio Archivists (SOA) | 101 | 2.25% |
| Society of Rocky Mountain Archivists (SRMA) | 89 | 1.98% |
| Society of Southwest Archivists (SSA) | 283 | 6.30% |
| Society of Tennessee Archivists | 28 | 0.62% |
| South Carolina Archival Association (SCAA) | 30 | 0.67% |
| Special Libraries Association (SLA) | 48 | 1.07% |
| State library associations | 184 | 4.09% |
| State museum associations | 156 | 3.47% |
| Twin Cities Archives Roundtable (TCART) | 72 | 1.60% |
| Visual Resources Association (VRA) | 52 | 1.16% |
| Western Historical Association | 33 | 0.73% |
| Other (please specify): | 652 | 14.51% |
Figure 146 – How important were the following in your decision to join a professional association? (Q64)
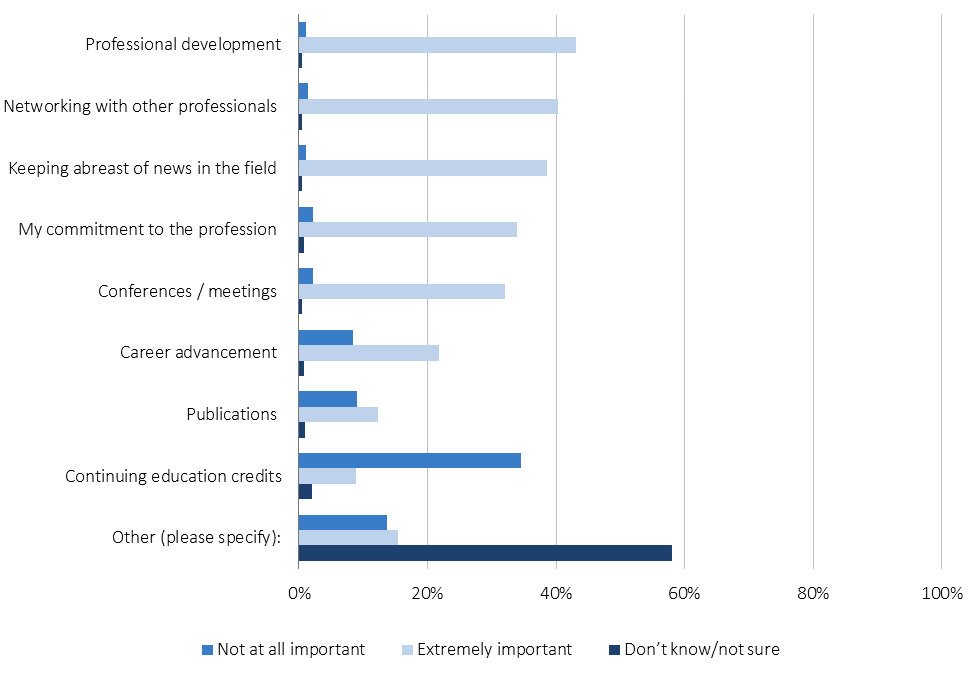
| Answer | Not at all important
Frequency |
Not at all important
Percentage |
Extremely important
Frequency |
Extremely Important
Percentage |
Don’t know/Not Sure
Frequency |
Don’t know/Not Sure
Percentage |
| Networking with other professionals | 64 | 1.44% | 1,790 | 40.25% | 20 | 0.45% |
| Professional development | 46 | 1.03% | 1,922 | 43.18% | 21 | 0.47% |
| Continuing education credits | 1,509 | 34.48% | 391 | 8.94% | 86 | 1.97% |
| Career advancement | 370 | 8.41% | 960 | 21.83% | 34 | 0.77% |
| Conferences / meetings | 100 | 2.25% | 1,427 | 32.11% | 21 | 0.47% |
| Publications | 399 | 9.04% | 540 | 12.23% | 39 | 0.88% |
| Keeping abreast of news in the field | 49 | 1.10% | 1,720 | 38.63% | 21 | 0.47% |
| My commitment to the profession | 98 | 2.21% | 1,501 | 33.88% | 33 | 0.74% |
| Other (please specify): | 53 | 13.66% | 60 | 15.46% | 225 | 57.99% |
Figure 147 – Why do you not belong to a professional association? Please select all that apply. (Q65)
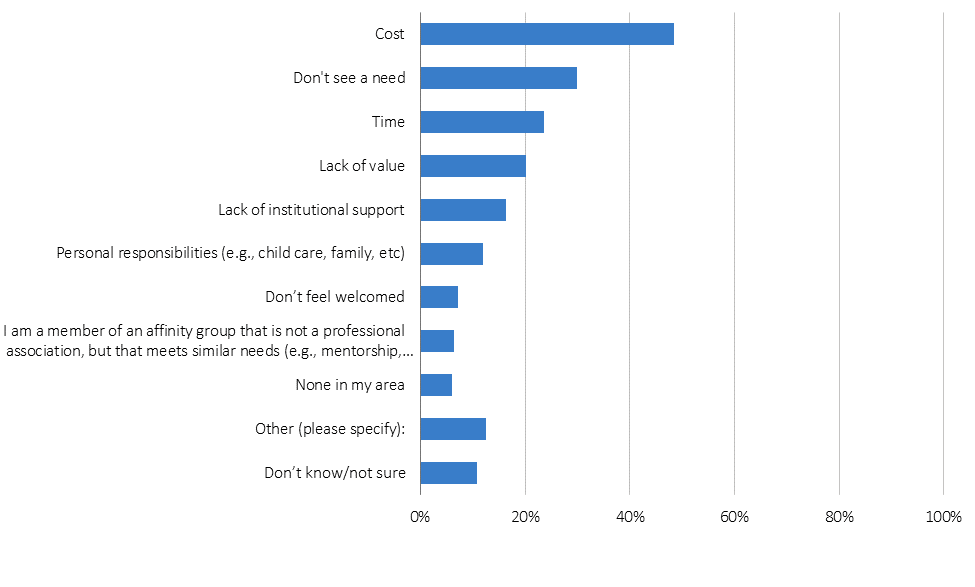
| Answer | Frequency | Percentage |
| Cost | 383 | 48.48% |
| Don’t see a need | 237 | 30.00% |
| Time | 187 | 23.67% |
| Lack of value | 160 | 20.25% |
| Lack of institutional support | 129 | 16.33% |
| Personal responsibilities (e.g., childcare, family, etc.) | 95 | 12.03% |
| Don’t feel welcomed | 57 | 7.22% |
| I am a member of an affinity group that is not a professional association, but that meets similar needs (e.g., mentorship, networking, etc.) | 51 | 6.46% |
| None in my area | 48 | 6.08% |
| Other (please specify): | 99 | 12.53% |
| Don’t know/not sure | 86 | 10.89% |
Figure 148 – Have you done any of the following in the past 3 years? (Q66)
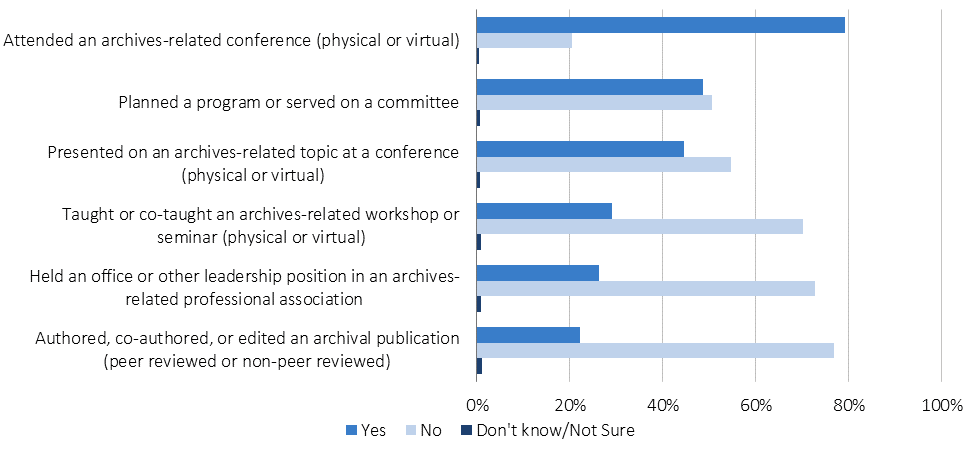
| Answer | Yes
Frequency |
Yes
Percentage |
No Frequency |
No
Percentage |
Don’t know/Not Sure
Frequency |
Don’t know/Not Sure
Percentage |
| Attended an archives-related conference (physical or virtual) | 4,326 | 79.19% | 1,113 | 20.37% | 24 | 0.44% |
| Planned a program or served on a committee | 2,647 | 48.65% | 2,753 | 50.60% | 41 | 0.75% |
| Presented on an archives-related topic at a conference (physical or virtual) | 2,435 | 44.65% | 2,985 | 54.73% | 34 | 0.62% |
| Taught or co-taught an archives-related workshop or seminar (physical or virtual) | 1,572 | 28.97% | 3,806 | 70.14% | 48 | 0.88% |
| Held an office or other leadership position in an archives-related professional association | 1,427 | 26.34% | 3,945 | 72.83% | 45 | 0.83% |
| Authored, co-authored, or edited an archival publication (peer reviewed or non-peer reviewed) | 1,196 | 22.11% | 4,160 | 76.89% | 54 | 1.00% |
Figure 149 – Generally speaking, how do you prefer to attend conferences? (Q67)
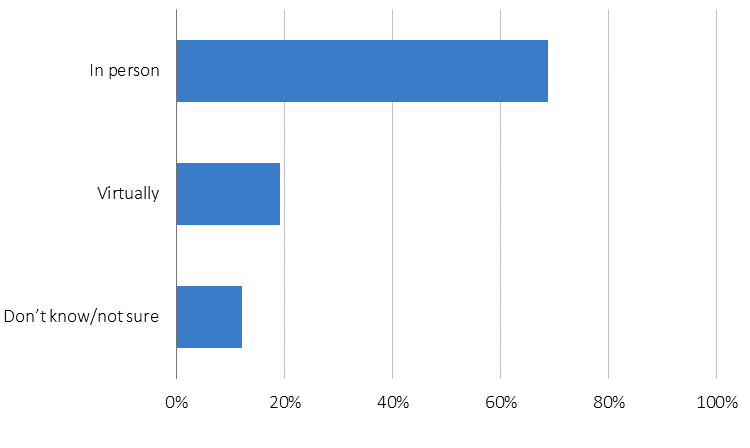
| Answer | Frequency | Percentage |
| In person | 2964 | 68.80% |
| Virtually | 825 | 19.15% |
| Don’t know/not sure | 519 | 12.05% |
Figure 150 – Diversity—defined as the representation of all identities and human differences (e.g., race, ethnicity, gender, sexual orientation, disability)—is valued in the archives profession. (Q69)
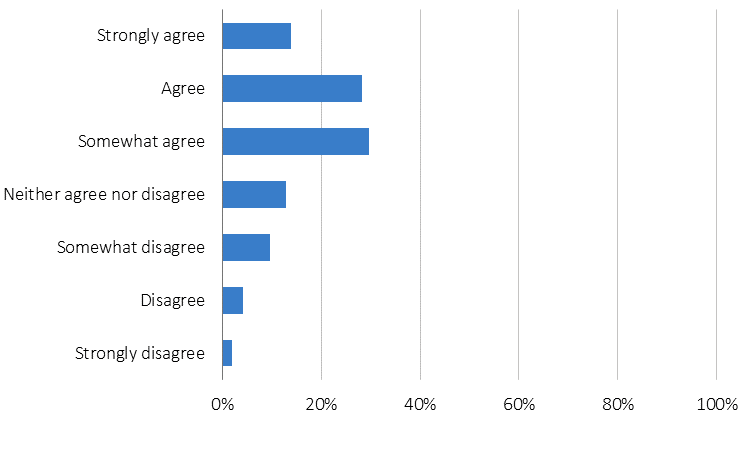
| Answer | Frequency | Percentage |
| Strongly agree | 780 | 13.82% |
| Agree | 1,593 | 28.23% |
| Somewhat agree | 1,673 | 29.65% |
| Neither agree nor disagree | 719 | 12.74% |
| Somewhat disagree | 540 | 9.57% |
| Disagree | 234 | 4.15% |
| Strongly disagree | 103 | 1.83% |
Figure 151 – Equity—defined as taking differences into account to ensure fair processes and outcomes without disparities between groups—is valued in the archives profession. (Q70)
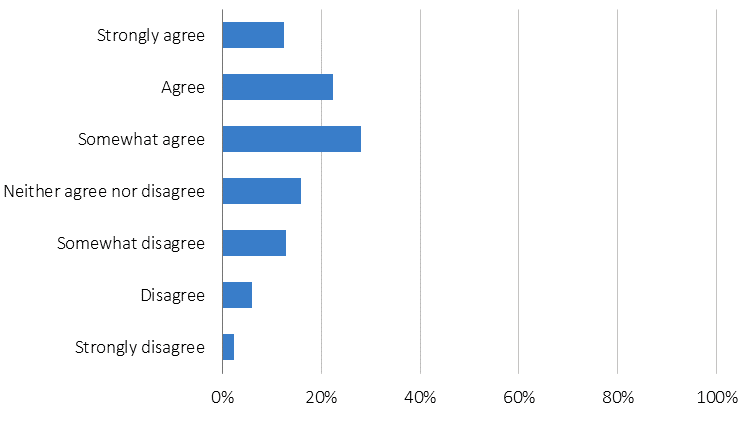
| Answer | Frequency | Percentage |
| Strongly agree | 703 | 12.46% |
| Agree | 1262 | 22.37% |
| Somewhat agree | 1578 | 27.97% |
| Neither agree nor disagree | 901 | 15.97% |
| Somewhat disagree | 722 | 12.80% |
| Disagree | 340 | 6.03% |
| Strongly disagree | 136 | 2.41% |
Figure 152 – Inclusion—defined as a culture that invites and appreciates the contribution and participation of all people—is valued in the archives profession. (Q71)

| Answer | Frequency | Percentage |
| Strongly agree | 776 | 13.62% |
| Agree | 1,352 | 23.72% |
| Somewhat agree | 1,599 | 28.06% |
| Neither agree nor disagree | 730 | 12.81% |
| Somewhat disagree | 721 | 12.65% |
| Disagree | 325 | 5.70% |
| Strongly disagree | 141 | 2.47% |
Figure 153 – Please read the following statements and indicate the extent to which you agree or disagree with each. (Q72)
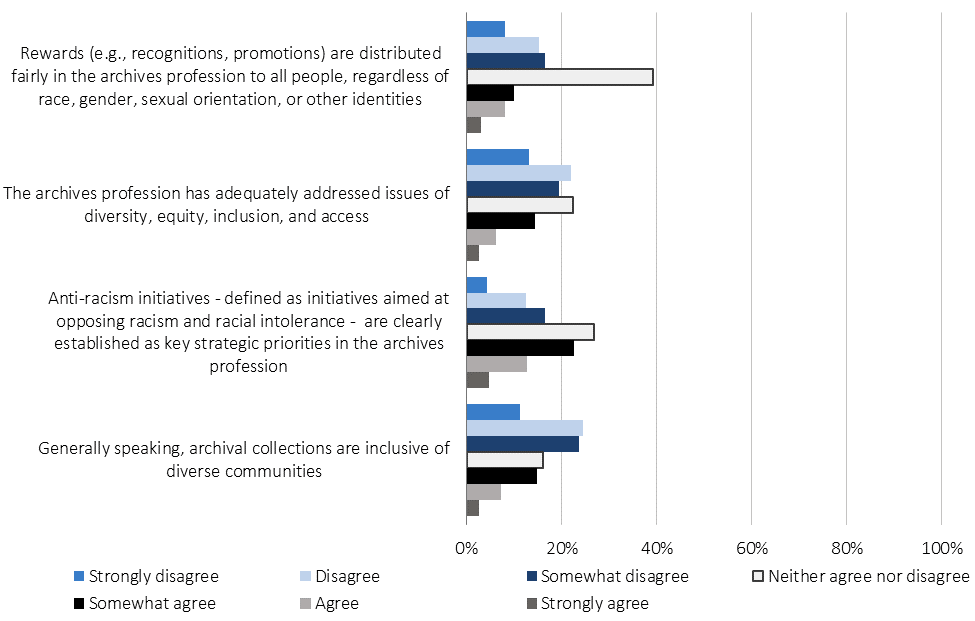
| Answer | Strongly Disagree
Frequency |
Strongly Disagree Percentage | Neither Agree nor Disagree
Frequency |
Neither Agree nor Disagree
Percentage |
Strongly Agree
Frequency |
Strongly Agree Percentage |
| Rewards (e.g., recognitions, promotions) are distributed fairly in the archives profession to all people, regardless of race, gender, sexual orientation, or other identities | 455 | 8.15% | 2,185 | 39.15% | 168 | 3.01% |
| The archives profession has adequately addressed issues of diversity, equity, inclusion, and access | 733 | 13.10% | 1,251 | 22.36% | 141 | 2.52% |
| Anti-racism initiatives—defined as initiatives aimed at opposing racism and racial intolerance—are clearly established as key strategic priorities in the archives profession | 241 | 4.31% | 1,500 | 26.80% | 260 | 4.65% |
| Generally speaking, archival collections are inclusive of diverse communities | 631 | 11.25% | 902 | 16.09% | 142 | 2.53% |
Figure 154 – Please read the following statements and indicate the extent to which you agree or disagree with each. (Q73)
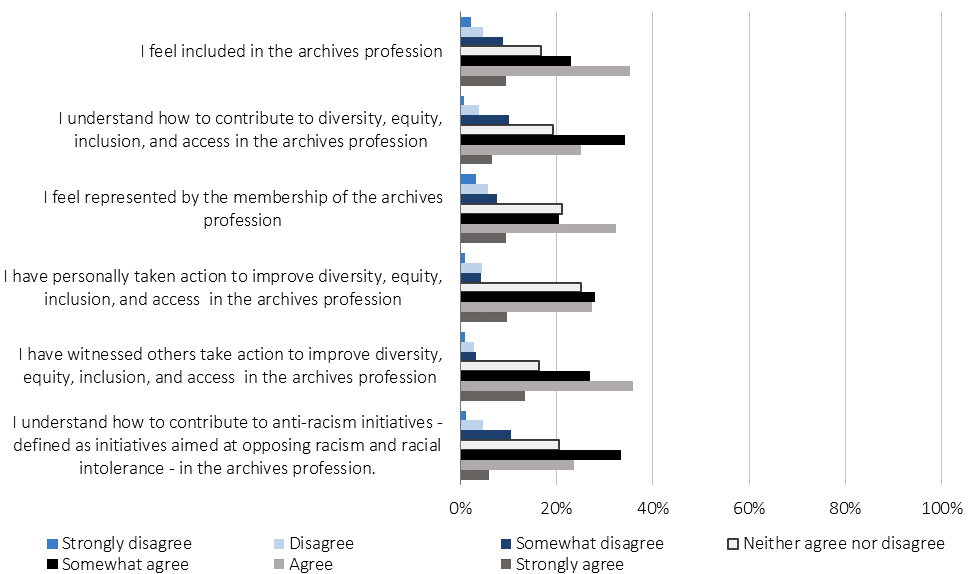
| Answer | Strongly Disagree
Frequency |
Strongly Disagree Percentage | Neither Agree nor Disagree
Frequency |
Neither Agree nor Disagree
Percentage |
Strongly Agree
Frequency |
Strongly Agree Percentage |
| I feel included in the archives profession | 125 | 2.24% | 932 | 16.70% | 526 | 9.42% |
| I understand how to contribute to diversity, equity, inclusion, and access in the archives profession | 48 | 0.86% | 1074 | 19.27% | 366 | 6.57% |
| I feel represented by the membership of the archives profession | 181 | 3.24% | 1177 | 21.08% | 532 | 9.53% |
| I have personally taken action to improve diversity, equity, inclusion, and access in the archives profession | 59 | 1.06% | 1399 | 25.11% | 539 | 9.67% |
| I have witnessed others take action to improve diversity, equity, inclusion, and access in the archives profession | 54 | 0.97% | 918 | 16.46% | 756 | 13.56% |
| I understand how to contribute to anti-racism initiatives—defined as initiatives aimed at opposing racism and racial intolerance—in the archives profession. | 72
|
1.29% | 1141 | 20.48% | 339 | 6.09%
|
Figure 155 – Please read the following statement and indicate the extent to which you agree or disagree. Archivists are viewed as professionals within my organization. (Q74)
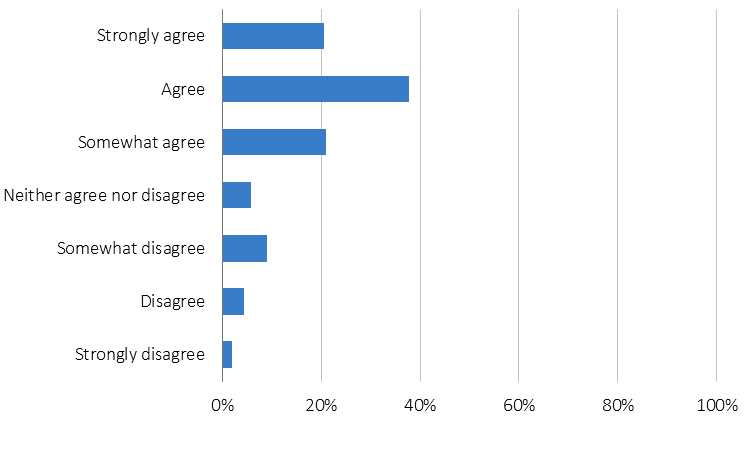
| Answer | Frequency | Percentage |
| Strongly agree | 1,022 | 20.51% |
| Agree | 1,880 | 37.73% |
| Somewhat agree | 1,039 | 20.85% |
| Neither agree nor disagree | 285 | 5.72% |
| Somewhat disagree | 444 | 8.91% |
| Disagree | 216 | 4.33% |
| Strongly disagree | 97 | 1.95% |
Figure 156 – To what extent do you agree or disagree with the following statements: (Q75)
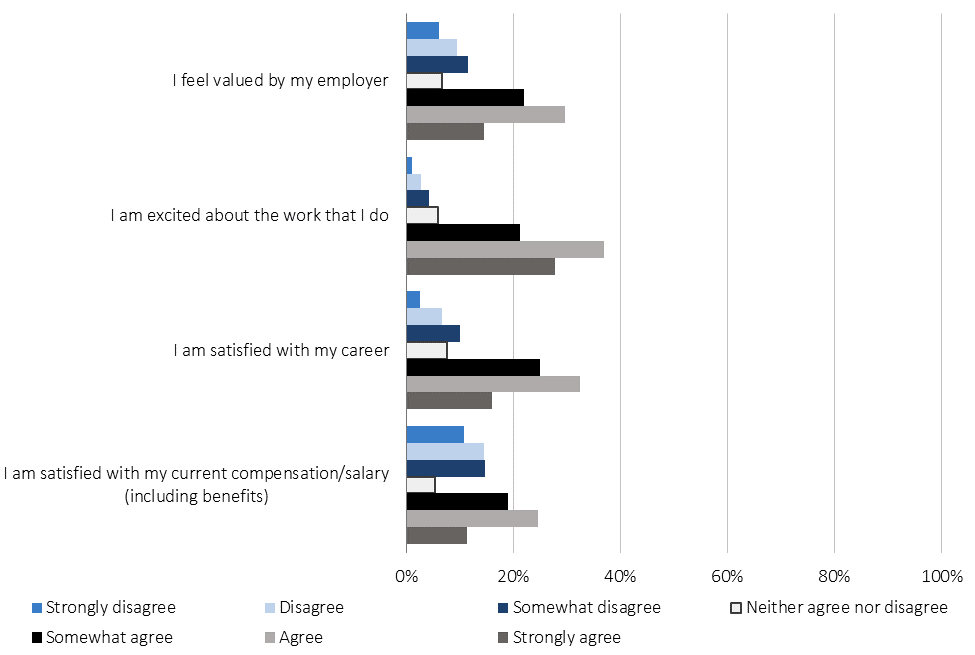
| Answer | Strongly Disagree
Frequency |
Strongly Disagree Percentage | Neither Agree nor Disagree
Frequency |
Neither Agree nor Disagree
Percentage |
Strongly Agree
Frequency |
Strongly Agree Percentage |
| I feel valued by my employer | 21 | 6.14% | 350 | 6.7% | 762 | 14.58% |
| I am excited about the work that I do | 56 | 1.07% | 306 | 5.85% | 1455 | 27.83% |
| I am satisfied with my career | 136 | 2.6% | 394 | 7.53% | 837 | 16.00% |
| I am satisfied with my current compensation/salary (including benefits) | 562 | 10.75% | 275 | 5.26% | 587 | 11.23%
|
Figure 157 – To what extent are you satisfied or dissatisfied with the following in the archives profession? Please use the scroll bar at the bottom of this question to see all available answer options. (Q76)
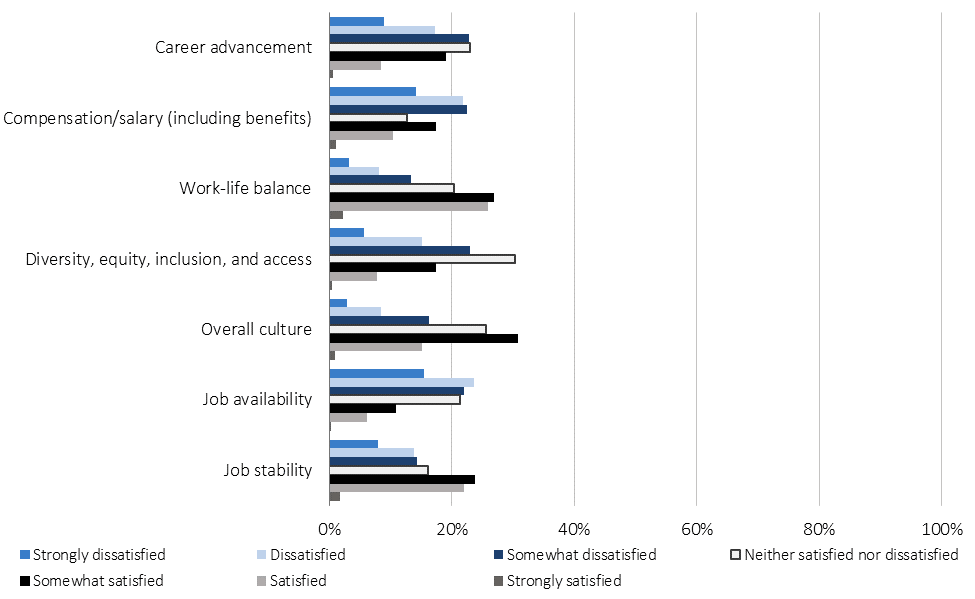
| Answer | Strongly Dissatisfied
Frequency |
Strongly Dissatisfied Percentage | Neither satisfied nor dissatisfied
Frequency |
Neither satisfied nor dissatisfied
Percentage |
Strongly Satisfied
Frequency |
Strongly Satisfied Percentage |
| Career advancement | 494 | 8.89% | 1276 | 22.96% | 36 | 0.65% |
| Compensation/salary (including benefits) | 788 | 14.15% | 704 | 12.64% | 57 | 1.02% |
| Work-life balance | 178 | 3.20% | 1132 | 20.33% | 127 | 2.28% |
| Diversity, equity, inclusion, and access | 317 | 5.71% | 1687 | 30.39% | 23 | 0.41% |
| Overall culture | 158 | 2.84% | 1422 | 25.59% | 53 | 0.95% |
| Job availability | 864 | 15.53% | 1190 | 21.39% | 19 | 0.34% |
| Job stability | 444 | 7.98% | 900 | 16.18% | 98 | 1.76%
|
Figure 158 – Please read the following statement and indicate the extent to which you agree or disagree. “Based on my personal experience with the archives profession, I believe decisions related to _____________ are equitable—in other words, they result in fair processes and outcomes without disparities between groups.” (Q77)
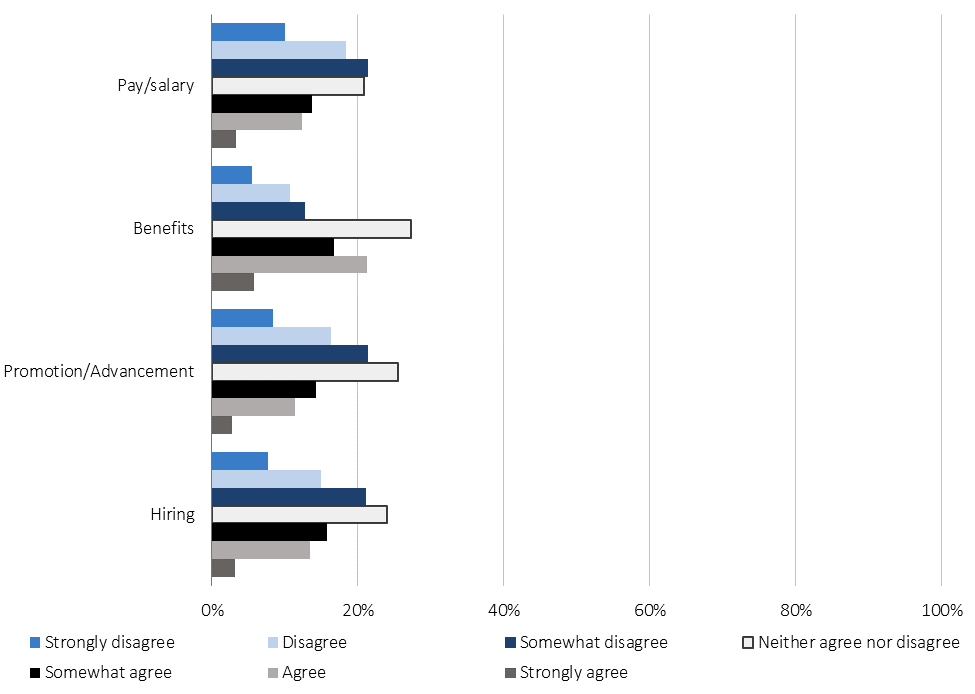
| Answer | Strongly Disagree
Frequency |
Strongly Disagree Percentage | Neither Agree nor Disagree
Frequency |
Neither Agree nor Disagree
Percentage |
Strongly Agree
Frequency |
Strongly Agree Percentage |
| Pay/Salary | 559 | 10.07% | 1155 | 20.81% | 186 | 3.35% |
| Benefits | 306 | 5.51% | 1517 | 27.32% | 317 | 5.71% |
| Promotion/Advancement | 463 | 8.35% | 1417 | 25.54% | 154 | 2.78% |
| Hiring | 426 | 7.68% | 1327 | 23.93% | 178 | 3.21%
|
Figure 159 – “The archives profession is inclusive of community archives.” (NOTE: “Community archives” is defined as documentation of a group of people that share common interests, and social, cultural, and historical heritage, usually created by members of the group being documented and maintained outside of traditional archives.) (Q78)
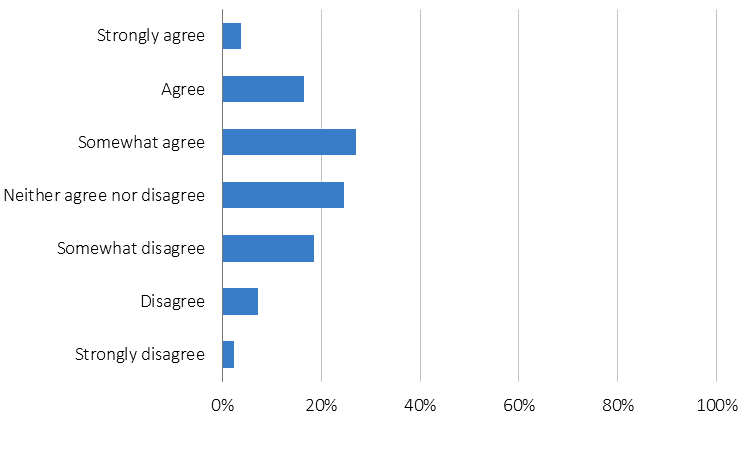
| Answer | Frequency | Percentage |
| Strongly agree | 212 | 3.80% |
| Agree | 922 | 16.53% |
| Somewhat agree | 1,512 | 27.10% |
| Neither agree nor disagree | 1,371 | 24.57% |
| Somewhat disagree | 1,033 | 18.52% |
| Disagree | 404 | 7.24% |
| Strongly disagree | 125 | 2.24% |
Figure 160 – Challenges and opportunities in community archives are similar to challenges and opportunities in traditional archives. (Q79)
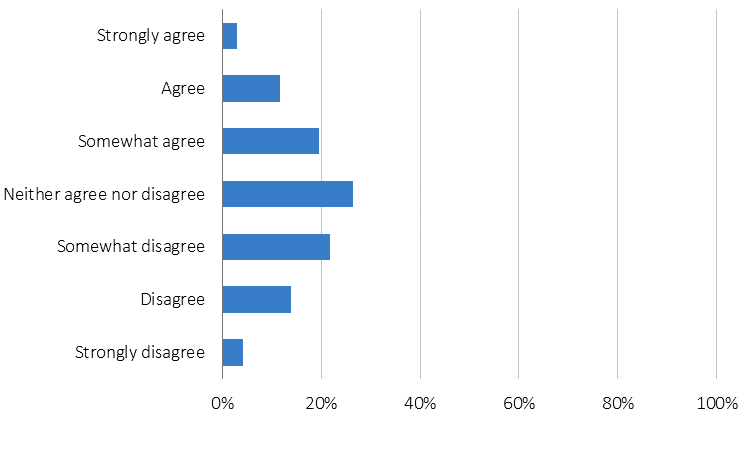
| Answer | Frequency | Percentage |
| Strongly agree | 160 | 2.86% |
| Agree | 654 | 11.71% |
| Somewhat agree | 1,086 | 19.44% |
| Neither agree nor disagree | 1,474 | 26.39% |
| Somewhat disagree | 1,209 | 21.65% |
| Disagree | 772 | 13.82% |
| Strongly disagree | 230 | 4.12% |
Figure 161 – You indicated that you work at a community archives. What are the most significant challenges facing your archives? Please select up to three. (Q81)
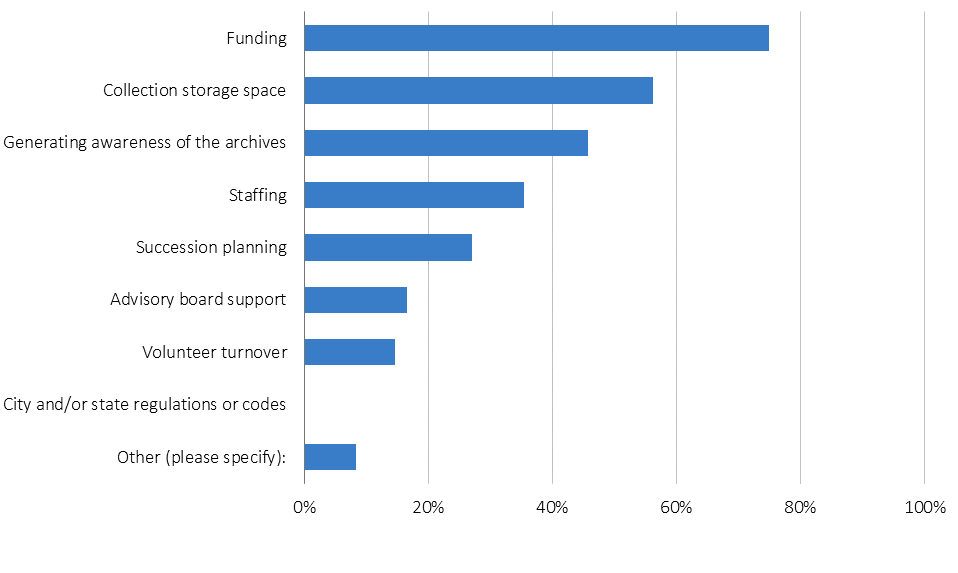
| Answer | Frequency | Percentage |
| Funding | 36 | 75.00% |
| Collection storage space | 27 | 56.25% |
| Generating awareness of the archives | 22 | 45.83% |
| Staffing | 17 | 35.42% |
| Succession planning | 13 | 27.08% |
| Advisory board support | 8 | 16.67% |
| Volunteer turnover | 7 | 14.58% |
| City and/or state regulations or codes | 0 | 0.00% |
| Other (please specify): | 4 | 8.33% |
Figure 162 – How many total years of experience do you have working in the archives field or working with archival material? (Q82)
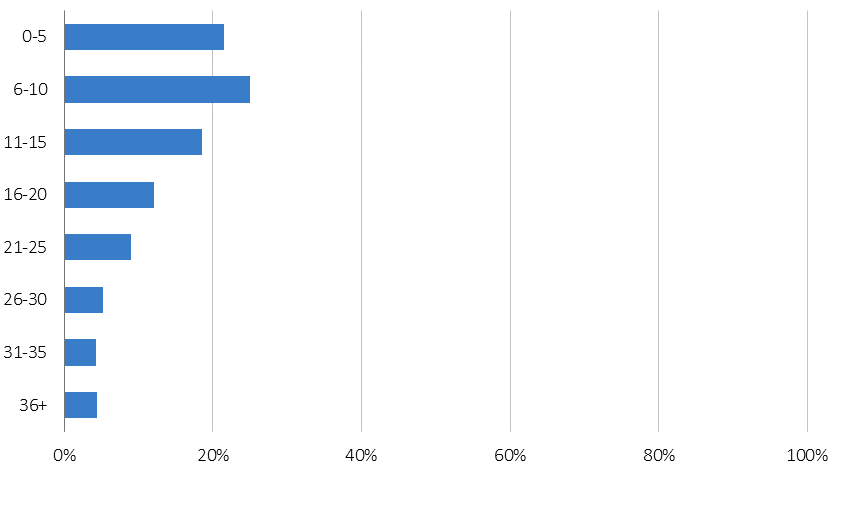
| Answer | Frequency | Percentage |
| 0-5 | 1,213 | 21.53% |
| 6-10 | 1,407 | 24.97% |
| 11-15 | 1,048 | 18.60% |
| 16-20 | 677 | 12.02% |
| 21-25 | 503 | 8.93% |
| 26-30 | 295 | 5.24% |
| 31-35 | 244 | 4.33% |
| 36+ | 247 | 4.38% |
Figure 163 – What is your age? (Q83)
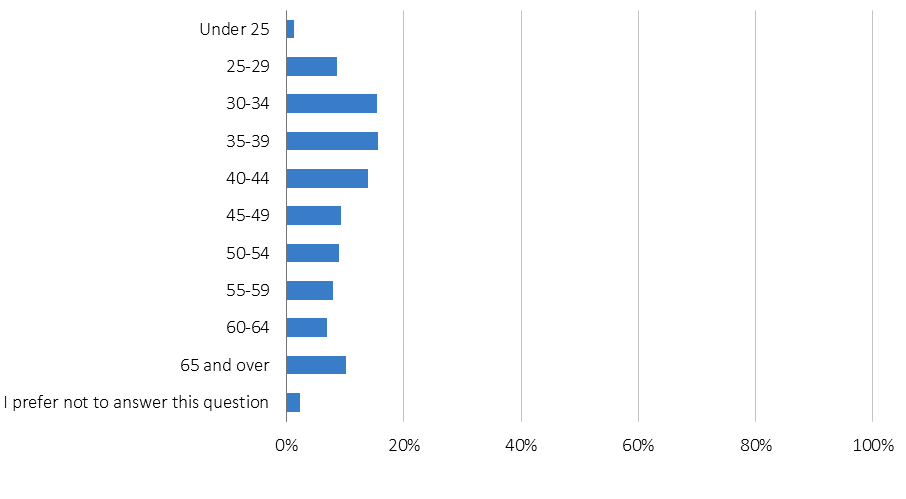
| Answer | Frequency | Percentage |
| Under 25 | 69 | 1.23% |
| 25-29 | 484 | 8.63% |
| 30-34 | 860 | 15.33% |
| 35-39 | 876 | 15.61% |
| 40-44 | 774 | 13.80% |
| 45-49 | 523 | 9.32% |
| 50-54 | 502 | 8.95% |
| 55-59 | 446 | 7.95% |
| 60-64 | 385 | 6.86% |
| 65 and over | 566 | 10.09% |
| I prefer not to answer this question | 125 | 2.23% |
Figure 164 – Please indicate your race-ethnicity(ies). Select all that apply. (Q84)
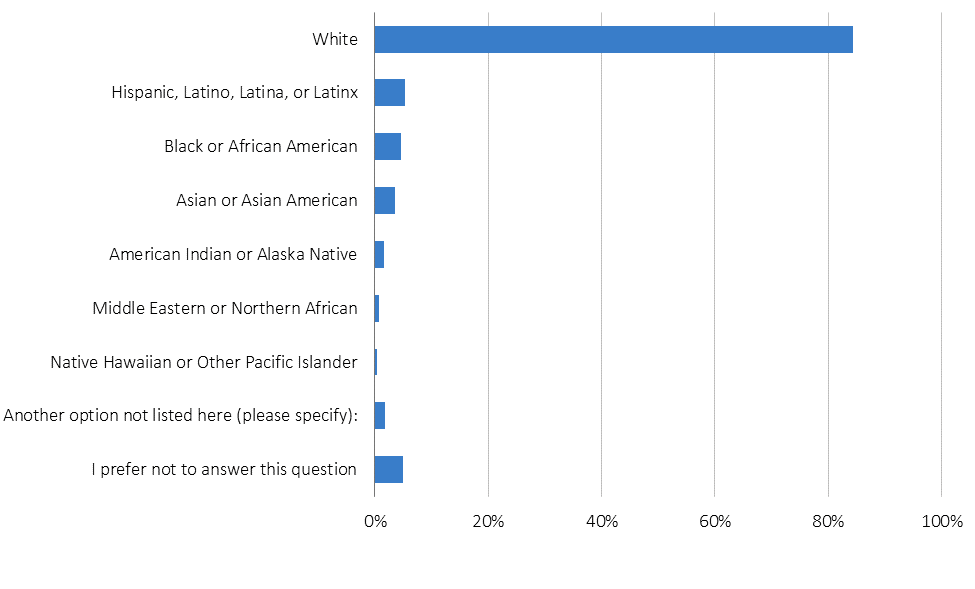
| Answer | Frequency | Percentage |
| White | 4,753 | 84.42% |
| Hispanic, Latino, Latina, or Latinx | 294 | 5.22% |
| Black or African American | 254 | 4.51% |
| Asian or Asian American | 202 | 3.59% |
| American Indian or Alaska Native | 86 | 1.53% |
| Middle Eastern or Northern African | 37 | 0.66% |
| Native Hawaiian or Other Pacific Islander | 17 | 0.30% |
| Another option not listed here (please specify): | 96 | 1.71% |
| I prefer not to answer this question | 275 | 4.88% |
Figure 165 – Please indicate your gender(s). Select all that apply. (Q85)
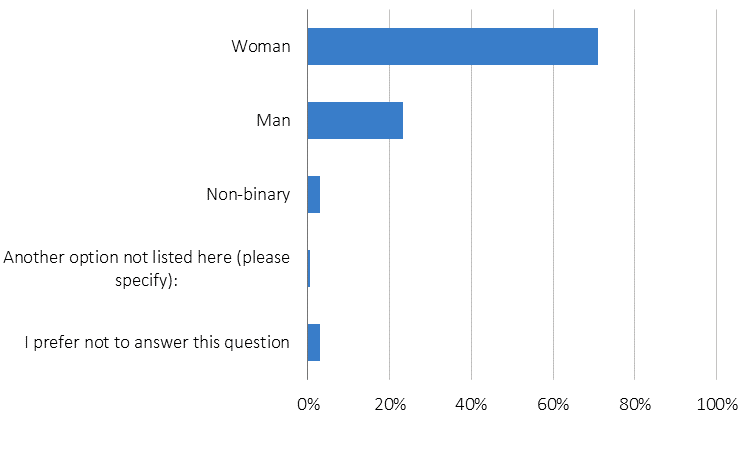
| Answer | Frequency | Percentage |
| Woman | 4,005 | 71.07% |
| Man | 1,315 | 23.34% |
| Non-binary | 164 | 2.91% |
| Another option not listed here (please specify): | 25 | 0.44% |
| I prefer not to answer this question | 169 | 3.00% |
Figure 166 – Are you transgender? (Q86)
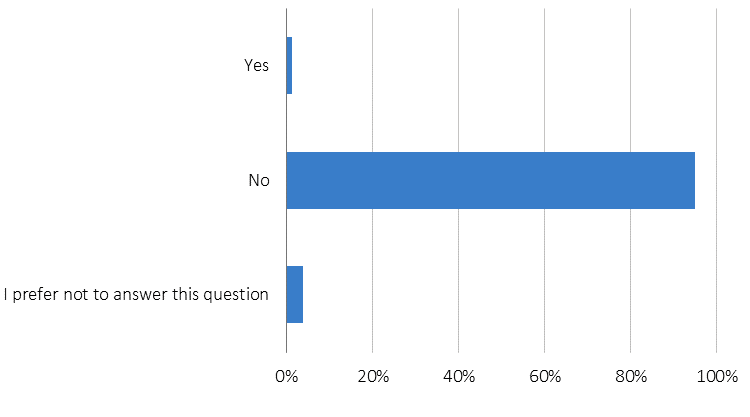
| Answer | Frequency | Percentage |
| Yes | 65 | 1.16% |
| No | 5,332 | 95.08% |
| I prefer not to answer this question | 211 | 3.76% |
Figure 167 – Please indicate your sexual orientation(s). Select all that apply. (Q87)
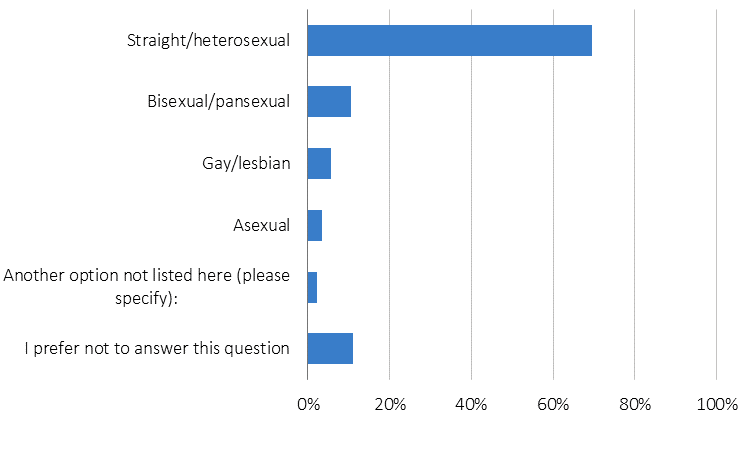
| Answer | Frequency | Percentage |
| Straight/heterosexual | 3,887 | 69.47% |
| Bisexual/pansexual | 589 | 10.53% |
| Gay/lesbian | 318 | 5.68% |
| Asexual | 186 | 3.32% |
| Another option not listed here (please specify): | 123 | 2.20% |
| I prefer not to answer this question | 612 | 10.94% |
Figure 168 – Do you have a disability, including but not limited to physical, psychological, developmental, and sensory disabilities? (Q88)
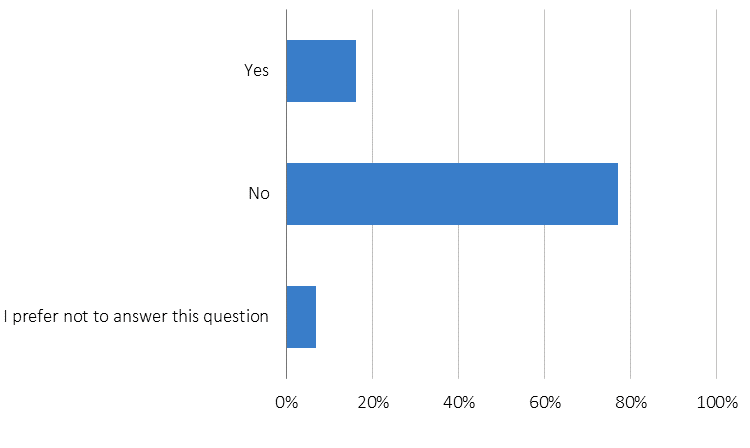
| Answer | Frequency | Percentage |
| Yes | 907 | 16.15% |
| No | 4,326 | 77.04% |
| I prefer not to answer this question | 382 | 6.8% |
Figure 169 – Do you have substantial care-giving responsibilities for any of the following? Please select all that apply. (Q89)
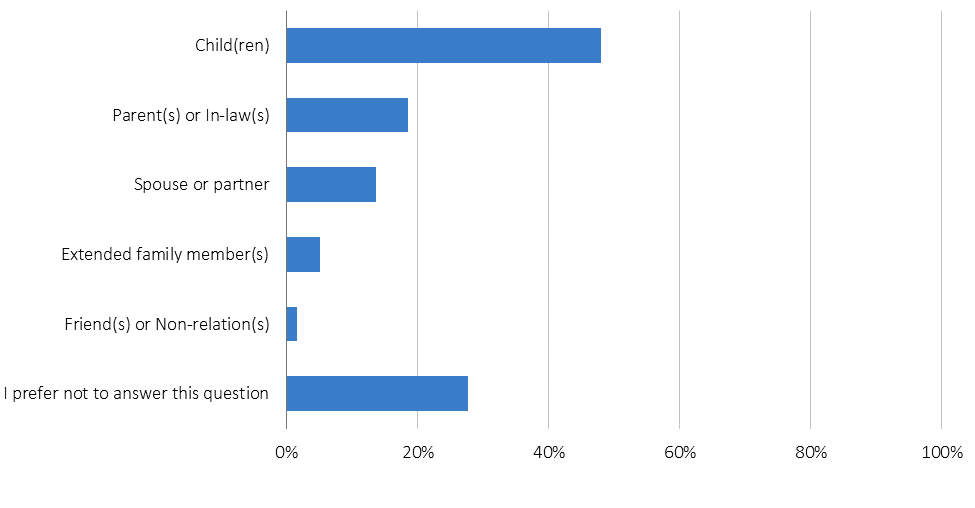
| Answer | Frequency | Percentage |
| Child(ren) | 1,200 | 48.06% |
| Parent(s) or In-law(s) | 463 | 18.54% |
| Spouse or partner | 342 | 13.70% |
| Extended family member(s) | 126 | 5.05% |
| Friend(s) or Non-relation(s) | 38 | 1.52% |
| I prefer not to answer this question | 692 | 27.71% |
Endnote
- Eric Kelderman, “How Would Student-Loan Forgiveness Really Work?” The Chronicle of Higher Education, 8 June 2022, https://www.chronicle.com/article/how-would-student-loan-forgiveness-really-work. ↑