Addressing College Affordability through Emergency Aid
A Study of the Petrie Foundation’s Student Emergency Grant Fund at CUNY
-
Table of Contents
- Executive summary
- Introduction
- Emergency aid programs
- Petrie Student Emergency Grant Fund
- Data collection and sample construction
- Outcome measures
- OLS regression analysis and results
- Results
- Challenges and limitations
- Discussion
- Appendix A. Data collection and sample construction details
- Appendix B. Regression tables
- Endnotes
Executive summary
The Carroll and Milton Petrie Foundation’s (Petrie Foundation) Student Emergency Grant Fund provides participating New York City colleges and universities with money to disburse grants to students experiencing financial hardship to help cover non-tuition expenses. Among the participating institutions are 20 City University of New York (CUNY) campuses, each of which operates and administers the program locally. Students submit an application describing their financial emergency, which is reviewed by campus staff before an application is either approved or rejected. Although participating campuses can award individual grants of up to $3,000, most cap awards at $1,500. Since 2017, the Petrie Foundation has allocated over $13 million to CUNY campuses to distribute emergency grants to students. Ithaka S+R partnered with the Petrie Foundation and CUNY to assess the impact of the Petrie Foundation’s Student Emergency Grant Fund on student academic outcomes.
This report presents findings from analyses of three de-identified student-level datasets provided by the Petrie Foundation and CUNY. After data cleaning, merging, and de-duplicating records, we constructed a final analytic sample consisting of 27,969 student-term observations, which included 9,747 unique students, 6,550 grants, and 12 terms of enrollment from fall 2021 to summer 2025. We employed multivariate linear regression models to estimate the treatment-on-the-treated (TOT) effect of grant receipt on students’ persistence and graduation at multiple time points. We estimated these effects for associate and bachelor’s degree-seeking students separately as well as for a range of subgroups: students who identified as Black or African American, Hispanic or Latino, male, or female, students aged 25 or older, and by students’ class standing. We also conducted exploratory analyses to examine whether award amounts and unmet request amounts were associated with student outcomes and to check the robustness of the results.
Key findings include the following:
- Among both associate and bachelor’s degree-seeking students, Student Emergency Grant Fund awards were effective at increasing short-term persistence, with the largest effects among first-year students. This pattern suggests that emergency aid may be particularly effective when students are just beginning their college careers. However, first-year students made up a disproportionately small share of grant applicants, especially in bachelor’s degree programs, suggesting that these students may be less likely than other students to face financial difficulties or may be less aware of emergency grant aid.
- In addition to first-year students, Hispanic or Latino and female associate degree-seeking students experienced increases in short-term persistence. Among bachelor’s degree-seeking students, persistence effects were more broadly distributed across additional groups of students.
- We found no effects on graduation among either associate or bachelor’s degree-seeking students. Along with no effects on longer-term persistence, these findings suggest that the benefits of emergency aid may diminish over time. Another explanation for the null graduation effects is that the largest persistence effects were experienced by students early in their academic careers and the follow-up period was shorter than the time needed to complete their degrees.
- While our findings suggest that emergency aid is an important tool that can help students overcome an immediate financial crisis, it may be more effective when paired with additional supports that address other challenges accompanying financial hardship. This may be most relevant for adult learners, who made up nearly half of grant recipients and are more likely to balance employment, caregiving, and other family and financial responsibilities.
Despite limitations and challenges related to the completeness of the available data, the size of the resulting dataset, and the inability to account for all differences between grant recipients and non-recipients, our evaluation is a first look into the effectiveness of the Student Emergency Grant Fund. It also contributes to the body of literature on emergency aid programs, which continues to grow amid rising concerns about college affordability and unexpected financial hardship. Our findings indicate that emergency grants can serve an important role in helping students persist in college during times of unexpected financial stress that may otherwise jeopardize their enrollment. Future research should explore which complementary supports sustain these benefits and ultimately translate to increases in graduation rates.
Introduction
There are growing concerns about the affordability of earning a college degree. In a 2026 survey of members of the State Higher Education Executive Officers Association (SHEEO), respondents identified college affordability as the second most pressing state policy issue in higher education, up four spots from the previous year.[1] These concerns are reflected in public perceptions of higher education as well. In another 2026 survey, conducted by Gallup and Lumina Foundation, only 12 percent of respondents said that four-year colleges and universities were doing a good or excellent job providing an affordable education, while 63 percent said they were doing a poor job.[2] These findings are reinforced by a recent report from the Strada Education Foundation that found through focus groups that cost and affordability were the two most important considerations when deciding where to pursue a college education, ranking higher than program quality and job opportunities.[3]
Discussions about college affordability typically center on tuition and fees. While sticker prices, or published tuition and fees, have increased significantly over the past two decades, the amount students actually pay, known as net price, is lower today than it was 20 years ago.[4] But for many students, especially adult learners and those from low- and moderate-income backgrounds, college affordability is about more than just tuition and fees. Students must balance educational expenses with meeting the costs of basic needs, including housing, food, transportation, utilities, and childcare. Even if financial aid lowers the cost of college, low- and moderate-income students have limited financial resources to promptly and effectively respond to unexpected expenses.
Unexpected expenses, such as those stemming from housing instability, transportation issues, or medical costs, can force students to choose between basic needs and remaining enrolled.
As such, financial emergencies can represent a significant barrier to postsecondary persistence and degree completion. Unexpected expenses, such as those stemming from housing instability, transportation issues, or medical costs, can force students to choose between basic needs and remaining enrolled. These financial emergencies can be relatively small, often under $1,000.[5] When such financial shocks occur, students may turn to high-interest credit options, withdraw from courses, or leave college altogether before earning a degree.[6] The downstream consequences can be significant. Failing to complete a postsecondary credential is associated with poorer long-term financial outcomes, including higher student loan default rates and diminished earnings.[7]
In response, colleges, states, and philanthropic organizations have implemented a range of emergency aid programs aimed at protecting and supporting students during times of financial instability, with mixed results that vary by design and implementation. This includes a prior Ithaka S+R study on the effectiveness of Georgia State University’s Panther Retention Grant program, in which we found that receiving a grant reduced students’ time to degree and their cumulative debt.[8]
Ithaka S+R is building on this and other research by working with The Carroll and Milton Petrie Foundation (Petrie Foundation) and City University of New York (CUNY) to assess the impact of the Petrie Foundation’s Student Emergency Grant Fund on student academic outcomes. The fund awards grants to institutions across New York City, including 20 CUNY colleges, with each campus independently administering its own program and distributing modest grants to eligible students to cover non-tuition expenses, such as utility bills. Since the program’s inception, CUNY institutions have awarded more than 10,000 grants. Most awards are capped at $3,000, though many are more modest.
This reports presents the findings from our study and is organized into six sections: 1) a review of the literature on student emergency aid programs; 2) background information on the Petrie Foundation Student Emergency Grant Fund; 3) an overview of our data collection process and methodological approach; 4) the results of our descriptive and inferential analyses; 5) the study’s challenges and limitations; and 6) a discussion of the findings and recommendations for future research.
Emergency aid programs
Emergency grant aid programs are a means of addressing students’ acute financial needs. Early efforts were most often developed and administered by individual institutions.[9] Amarillo College’s No Excuses Poverty initiative, for example, takes a holistic approach to supporting students by providing emergency financial aid alongside clothing, food pantries, childcare, utility bill support, and other wraparound services.[10] Georgia State University’s Panther Retention Grant automatically awards grants of up to $2,500 to students in good academic standing who have exhausted all other sources of aid but face unpaid tuition balances that would prevent them from remaining enrolled in the given term.[11] Since it began in 2011, the program’s eligibility criteria have changed, with an increasing number and share of awards now given to seniors close to graduation. An important feature of the program is that Georgia State regularly reviews data on unpaid balances and academic standing to identify eligible students and then awards grants automatically without an application.
States have also implemented emergency aid programs on a much larger scale than these types of institution-based programs. Statewide programs are typically financed by appropriations. Their eligibility criteria and award processes are dictated by statute and are standardized across participating institutions.[12] Many of these programs target specific student populations. For example, in 2019 the Washington State legislature approved a pilot of the Student Emergency Assistance Grant (SEAG) program for community and technical college students.[13] As of the 2025-26 academic year, the program serves students at 30 community and technical colleges, and participation continues to expand. Designed to minimize barriers to access, the program does not require students to complete the Free Application for Federal Student Aid (FAFSA).
In 2022, North Carolina launched a similar program, Finish Line Grants, which provides up to $1,000 per semester to community college students facing unanticipated financial hardship.[14] Minnesota pursued an even more targeted approach beginning in 2017 through the Emergency Assistance for Postsecondary Students (EAPS) Grant, which awards funds to low-income students who attend colleges and universities that enroll large numbers of homeless students.[15] EAPS funds may be used to address students’ immediate needs (e.g., housing, food, and transportation) and can be distributed directly to students, paid to third parties on students’ behalf, or provided in the form of gift cards. In Virginia, five community colleges have piloted the College Attainment for Parent Students (CAPS) program, which provides up to $4,800 per semester to Pell-eligible single parents for childcare and unanticipated expenses.[16]
During the COVID-19 pandemic, emergency aid programs reached more than 4,900 institutions across all US states and the District of Columbia.[17] Through the Coronavirus Aid, Relief, and Economic Security Act (CARES Act), Congress allocated approximately $76 billion to the Higher Education Emergency Relief Fund (HEERF) over three years. Over the three-year period, HEERF funding enabled thousands of institutions to provide emergency financial assistance to more than 18 million students facing pandemic-related financial hardship.[18]
Results and efficacy
A growing body of causal evidence on institution-based programs has returned mixed findings. In 2022, Ithaka S+R, using ordinary least squares (OLS) and difference-in-differences (DiD) regression analyses, found that Georgia State’s Panther Retention Grant program reduced students’ time to degree across the full sample and student subgroups, including for Pell recipients and students from underrepresented racial and ethnic minority groups.[19] We also found that the program reduced cumulative debt for most student groups, likely because students, on average, graduated sooner and paid for fewer subsequent terms. However, the grant did not appear to increase graduation rates, nor did it improve next-term retention among students below senior standing.
In a randomized controlled trial (RCT) of more than 14,000 students at 11 broad-access public universities in ten states, researchers studied the impact of proactive completion grants that averaged around $1,200 and were awarded to students close to graduation based on unmet financial need.[20] Grant recipients experienced a one percent increase in one-year persistence rates but the effect dissipated in later years. Additionally, the grants did not reduce time to degree or increase graduation rates.
An RCT at one of five campuses within Tarrant County College, a community college in Fort Worth, Texas, found that students who received emergency financial assistance combined with comprehensive case management were enrolled two and six semesters after receipt at significantly higher rates than students in the control group, who received no intervention.[21] However, there were no effects on degree completion among the full analytic sample. Students in a second treatment condition, who received emergency financial assistance but no case management, fared no better on persistence and completion outcomes than students in the control group. The positive effects on persistence and degree completion were driven by women who received emergency financial and case management. They were significantly more likely than women in the control group to persist two and six semesters after receipt and to earn an associate degree within six semesters. There were no comparable effects for men, whose persistence and completion rates did not differ from those of men in the control group. The findings suggest that emergency aid programs may be most effective when paired with comprehensive support, at least for some student subgroups.[22]
The findings suggest that emergency aid programs may be most effective when paired with comprehensive support, at least for some student subgroups.
To our knowledge, unlike institutional programs, there are no causal studies to date on statewide emergency aid programs; instead, legislative reports on these programs provide descriptive analyses of the characteristics and outcomes of participating students. For example, in a 2020 report on the EAPS Grant Program by the Minnesota Office of Higher Education, the fall-to-spring retention rate of grant recipients was higher than the rate of all students at ten of the 11 participating institutions. Additionally, among grant recipients who responded to a follow-up survey, 84 percent said their emergency was completely resolved by the grant.[23] As another example, in its report to the legislature on the SEAG program, the Washington State Board of Community and Technical Colleges (SBCTC) reported that the one-year persistence rate of grant recipients was 66 percent, compared to 60 percent for all first-time students.[24] Results from these reports are encouraging but do not represent causal estimates.
Petrie Student Emergency Grant Fund
Through its Student Emergency Grant Fund, the Petrie Foundation provides participating New York City colleges and universities with money to disburse grants to students experiencing financial hardship to help cover non-tuition expenses. Among the participating institutions are 20 CUNY campuses, each of which operates and administers the program locally. Campuses establish their own eligibility criteria, the maximum number of awards students can receive, and maximum award amounts.
Despite this flexibility and these differences, there are two program features that are consistent across all participating CUNY campuses. First, grant funds cannot be used to pay tuition. Second, students must submit an application describing their financial emergency, which is reviewed by campus staff before an application is either approved or rejected. Although participating campuses can award individual grants of up to $3,000, most cap awards at $1,500. In rare cases, campuses may seek approval from the Petrie Foundation for awards exceeding $3,000.
After a student applies, a designated review committee, typically comprising student affairs and finance office personnel, determines whether to approve or reject the application. Applications can be rejected for a variety of reasons, including a student’s failure to maintain course registration, insufficient documentation or follow-up communication, or a determination that the expense does not qualify as an emergency. Approximately one-third of participating institutions also require students to complete a pre-screening process before submitting an application. This process varies by campus, but often includes a preliminary screening form, a phone call or email with an office administrator, or a brief written statement describing the financial emergency.
For approved applications, institutions aim to disburse funds within two weeks, and, as a result, the vast majority of awards are issued in the same term in which the application is submitted. Most campuses permit students to apply for and receive multiple awards during their enrollment, although some limit awards to one per academic year. A few campuses restrict students to one award over the course of their college career.
The application process has changed over time. Initially, each institution maintained its own application portal and procedures for review. In 2021, the Petrie Foundation introduced a centralized application that standardizes data collection while continuing to give institutions authority to make their own award decisions. Applicants across all participating institutions are generally required to provide some form of student identification and documentation showing the balance associated with the emergency. These changes were implemented to simplify the application process for students and reduce the administrative burden for reviewers.
The Petrie Foundation’s program records indicate that, since 2017, they have allocated over $13 million to participating CUNY campuses to distribute emergency grants to students. Based on raw data collected through the centralized application portal, between the fall 2021 and fall 2025 terms, CUNY campuses awarded 9,580 grants totaling more than $5.6 million.[25] In each of the 2022-23, 2023-24, and 2024-25 academic years, campuses approved about 2,300 grants worth over $1.2 million annually. Table 1 below summarizes the number of grants awarded by academic year across all participating CUNY institutions.
Table 1. Number of Student Emergency Grants by Academic Year
| Academic Year[26] | Awards | Total Distributed Funds |
| 2021-22 | 1,324 | $909,000 |
| 2022-23 | 2,226 | $1,268,000 |
| 2023-24 | 2,329 | $1,423,000 |
| 2024-25 | 2,293 | $1,416,000 |
| 2025-26[27] | 951 | $391,000 |
| Missing | 457 | $229,000 |
| Total | 9,580 | $5,636,000 |
Again based on raw data collected from the Petrie Foundation that covers the fall 2021 to fall 2025 terms, Table 2 shows that there are substantial differences across participating CUNY institutions in the number of applications, applications approved, applications rejected, and applications for which institutions did not report an approval or rejection status. The raw data in Table 2 are prior to the cleaning steps used to construct the analytic sample and are provided to present the scale and scope of institution- and system-level participation in the Student Emergency Grant Fund program.
Table 2. Number of Applications, Applications Approved, Applications Rejected, and Applications Missing Approval Status by Institution[28]
| Institution | Applications | Applications Approved (Approval Rate) | Applications Rejected (Rejection Rate) | Applications Missing Approval Status (Missing Rate) |
| Community College A | 2,731 | 1,890 (69%) | 533 (20%) | 308 (11%) |
| Community College B | 1,099 | 517 (47%) | 141 (13%) | 441 (40%) |
| Community College C | 618 | 246 (40%) | 339 (55%) | 33 (5%) |
| Community College D | 507 | 164 (32%) | 288 (57%) | 55 (11%) |
| Community College E | 424 | 221 (52%) | 144 (34%) | 59 (14%) |
| Community College F | 306 | 0 (0%) | 1 (0%) | 305 (100%) |
| Community College G | 271 | 115 (42%) | 109 (40%) | 47 (17%) |
| Baccalaureate College A | 3,113 | 585 (19%) | 1,528 (49%) | 1,000 (32%) |
| Baccalaureate College B | 2,221 | 213 (10%) | 1,594 (72%) | 414 (19%) |
| Baccalaureate College C | 2,036 | 607 (30%) | 1,307 (64%) | 122 (6%) |
| Baccalaureate College D | 1,763 | 443 (25%) | 1,305 (74%) | 15 (1%) |
| Baccalaureate College E | 1,731 | 849 (49%) | 861 (50%) | 21 (1%) |
| Baccalaureate College F | 1,441 | 630 (44%) | 226 (16%) | 585 (41%) |
| Baccalaureate College G | 1,165 | 834 (72%) | 166 (14%) | 165 (14%) |
| Baccalaureate College H | 1,134 | 475 (42%) | 576 (51%) | 83 (7%) |
| Baccalaureate College I | 956 | 456 (48%) | 304 (32%) | 196 (21%) |
| Baccalaureate College J | 865 | 221 (26%) | 562 (65%) | 82 (9%) |
| Baccalaureate College K | 760 | 450 (59%) | 280 (37%) | 30 (4%) |
| Baccalaureate College L | 773 | 218 (28%) | 529 (68%) | 26 (3%) |
| Baccalaureate College M | 644 | 302 (47%) | 268 (42%) | 74 (11%) |
| Baccalaureate College N | 94 | 45 (48%) | 46 (49%) | 3 (3%) |
| Baccalaureate College O | 38 | 5 (13%) | 0 (0%) | 33 (87%) |
| Baccalaureate College P | 4 | 0 (0%) | 0 (0%) | 4 (100%) |
| Missing Institution | 211 | 94 (45%) | 42 (20%) | 75 (36%) |
| Total | 24,905 | 9,580 (38%) | 11,149 (45%) | 4,176 (17%) |
Data collection and sample construction
To study the impact of these emergency grants on student outcomes, we collected three de-identified student-level datasets from the Petrie Foundation, with support from CUNY: an applications file, a funds distributed file, and a longitudinal student outcomes file. The applications file contains records for individual student applications submitted through the application portal. Specifically, the dataset includes the application submission date, the institution the application was submitted to, the amount requested, the reason for the request, the application decision (i.e., either approved or rejected), and the decision date, along with demographic and academic characteristics of the applicant. The funds distributed file contains additional information for awarded grants, including the award amount, the awarding institution, and the date the award was submitted to the institution’s finance office for disbursement. Institutions do not consistently report this information for grants, so some are missing from this file. The longitudinal student outcomes file contains student-term records from CUNYfirst (CUNY’s student information system) for grant applicants, beginning in fall 2021 and covering all terms for which CUNY has enrollment data. These records include information on students’ enrollment status, cumulative credits, cumulative GPA, degree level, and graduation status.
Because all three datasets include students who applied for a grant only, our analyses, described in detail below, are limited to grant applicants and do not include CUNY students who never applied for a grant. As a result, all comparisons are restricted to applicants rather than the broader CUNY student population.
Analytic sample
The applications data file we collected from the Petrie Foundation included 25,208 applications; of these, 23 were missing a student ID and 280 had been explicitly marked as duplicates or test entries by CUNY or Petrie Foundation personnel. Out of the remaining 24,905 applications, there were 16,190 unique students and 9,580 grants awarded to 7,409 unique recipients. The funds distributed data file included 9,573 observations, which provide additional information on approved applications in the applications file, though some grants were missing from the funds distributed file while others were included in the funds distributed file but not in the applications file. The longitudinal outcomes file included enrollment data for 13,893 unique students, meaning that nearly 2,300 students included in the applications data file lacked longitudinal data. It is not clear the reason for these missing records.
To construct our analytic sample, we merged the three data files. We restricted the sample to undergraduate students seeking either their first associate or bachelor’s degree. We excluded observations missing student ID, the date of the application submission or decision, or the application decision. We also removed records that CUNY administrators identified as duplicate applications.
Because longitudinal data are necessary to examine the relationship between grant receipt and academic outcomes, we excluded the subset of observations that lacked longitudinal data from the analytic sample. We also found that student enrollment rates in the final two terms of the data—fall 2025 and spring 2026—were substantially lower than in earlier terms. These substantively large drops suggest that the decline was due to incomplete enrollment records rather than changes in student persistence rates. Due to concerns about missing data, we removed fall 2025 and spring 2026 terms from the dataset. Because these drops were limited to the most recent academic terms, which likely had not yet been updated with the most recent enrollment records, we have no reason to think that earlier terms were also affected. For more information on our data cleaning process and dropped observations, see Appendix A.
We constructed the analytic sample in long format, with each observation representing a unique student-term combination. As a result, students enrolled across multiple terms appear in multiple observations in the dataset. This approach differs from a student-level analysis, in which each student has one observation. The primary reason for using student-term rather than student as the unit of analysis is the way the intervention is offered. Unlike participation in a program, where a student is considered treated for the duration of their participation, receipt of the intervention in this study can vary by term. For example, a student may apply for a grant in an earlier term, not receive one, and enter the analytic sample in the control group. The same student may apply later in their college career and receive a grant, at which point they would be in the treatment group. Using the student-term as the unit of analysis accounts for the time-varying nature of inclusion in the treatment group. It is unclear how such a student would be defined if the analyses were conducted at the student level.
After data cleaning, merging, and de-duplicating records, the final analytic sample consisted of 27,969 student-term observations and 12 terms of enrollment from fall 2021 to summer 2025. The sample includes 9,747 unique students, of whom 5,414 received at least one grant during the study period. Because some students could receive multiple grants, there were a total of 6,550 grants awarded across all recipients.
Outcome measures
Our outcomes of interest are aligned with the primary goals of emergency aid: helping students stay enrolled and progress toward degree completion. Accordingly, we constructed outcome measures related to persistence and graduation. We measured these outcomes at multiple points through two years after grant receipt, the longest follow-up period supported by the data, with each academic year including three terms: fall, spring, and summer. Below, we define each outcome measure.
Outcome measures: Persistence
Next-term persistence: Whether the student earned their first associate or bachelor’s degree at a CUNY institution during the term (i.e., t), or was enrolled at a CUNY institution in the next term (i.e., t+1). Binary variable.[29]
One-year persistence: Whether the student earned their first associate or bachelor’s degree at a CUNY institution within two terms (i.e., t+2), or was enrolled at a CUNY institution three terms later (i.e., t+3). Binary variable.[30]
Two-year persistence: Whether the student earned their first associate or bachelor’s degree at a CUNY institution within five terms (i.e., t+5), or was enrolled at a CUNY institution six terms later (i.e., t+6). Binary variable.[31]
Outcome measures: Graduation
One-year graduation: Whether the student earned their first associate or bachelor’s degree at a CUNY institution within two terms (i.e., t+2). Binary variable.[32]
Two-year graduation: Whether the student earned their first associate or bachelor’s degree at a CUNY institution within five terms (i.e., t+5). Binary variable.[33]
OLS regression analysis and results
This section describes our analytic approach and presents the results from both primary analyses of the full analytic samples and subgroups of interest as well as results from exploratory analyses.
Analytic approach
We employed multivariate linear regression models to estimate the treatment-on-the-treated (TOT) effect of grant receipt on each outcome of interest. The treatment group consisted of students who received a grant in term t and the control group consisted of students who did not receive a grant in term t, irrespective of whether they applied for one in that term. The primary model included covariates to control for observed differences in students’ demographic and academic characteristics, as well as institution fixed effects to account for differences across institutions that do not change over time, such as differences in application and award processes and baseline outcomes. We also included term fixed effects to account for differences that change over time, like economic conditions.
The selection of covariates was informed by descriptive analyses and pairwise correlations with both grant receipt and the outcomes of interest. The model included indicators for whether a student identified as Black or African American, Hispanic or Latino, or male, was aged 25 or older in the given term (i.e., was an adult learner), and had ever participated in CUNY ASAP, a comprehensive student support program created by CUNY that has produced large positive effects on graduation rates.[34] It also controlled for students’ cumulative GPA and cumulative credits earned as of the beginning of the given term as well as the requested grant amount.[35]
The primary model for the full analytic sample is estimated as follows:
Yit = δ+ β*TREATMENTit + αXit + γs + λt + εit
where Y is an outcome for individual i in term t, including next-term, one-year, and two-year persistence and one-year and two-year graduation; TREATMENT indicates whether student i received a grant in term t; X is a vector of student control variables; γ represents institution fixed effects, λ represents time fixed effects; and ε represents the error term. Standard errors are clustered at the student level to account for repeated observations within the same student.
We also examined outcomes for specific subgroups: students who identified as Black or African American, Hispanic or Latino, male, or female, students aged 25 or older, and by students’ class standing, as determined by the number of cumulative credits earned prior to the given term, which is a more accurate measure of students’ progress to degree than the number of years they have been enrolled. To do this, we employed the same regression model described above using only observations from the subgroup of interest and omitting the corresponding control variable.
The selection of these subgroups was informed by both the existing literature and the characteristics of the study sample. We analyzed Black or African American and Hispanic or Latino students separately because national data consistently show lower rates of degree completion among these groups.[36] Additionally, each group represents more than one-third of the sample. Male students were examined because they were underrepresented among applicants relative to the population of CUNY students and because a prior evaluation of an emergency aid program at Tarrant County College found no effects on persistence or completion for male students. Students aged 25 or older were included because they represented nearly half of students in the dataset despite representing under a quarter of the CUNY student population overall.[37] Subgroup analyses by class standing were conducted to assess whether the association between grant receipt and persistence varied based on students’ progress toward a degree.
We also conducted exploratory analyses to examine whether award amounts and unmet request amounts were associated with student outcomes. In other words, we investigated whether recipients who received larger grants experienced better outcomes and whether recipients with larger unmet request amounts experienced worse outcomes.
To assess the robustness of our results for the full analytic sample, we conducted two additional analyses. First, we ran the regression model with an alternative treatment definition. Under this definition, a student’s treatment indicator was coded as one in the term in which they received a grant as well as in all subsequent terms. This alternative specification reflects the hypothesis that by addressing immediate financial need, grant receipt may strengthen students’ sense of institutional support and increase their confidence that assistance may be available should they experience additional hardship. In contrast, students whose applications are rejected may perceive less support or be less confident that support will be available in the future. Second, we ran the regression model with the original treatment definition but added student fixed effects. These fixed effects account for differences across students that do not change over time by comparing students to themselves.
Student characteristics
We first conducted descriptive analyses to better understand the characteristics of the analytic sample. We examined associate degree-seeking and bachelor’s degree-seeking students separately because these populations differ substantially in their demographic characteristics, educational experiences, and outcomes, including graduation rates, age, rates of low-income status, and rates of employment while enrolled.[38] As discussed above, the number of observations represents student-term combinations, which explains why the number of observations is larger than the number of students who applied for grants in Tables 1 and 2.
Below, we present descriptive statistics for the full sample alongside statistics for the CUNY student body using data from the 2025-26 academic year, where available. Table 3 presents these statistics for associate degree-seeking students. Male students are underrepresented and Black or African American students are overrepresented in our sample relative to the population of CUNY students. Students aged 25 or older are substantially overrepresented in our sample, and students in our sample are far less likely than the general CUNY population to be enrolled full time. Additionally, the proportion of students in our sample who participated in CUNY ASAP was comparable to that of the overall student body of associate degree-seeking students. More than two-thirds (68 percent) of associate degree-seeking students in the sample are sophomores while less than one-third are first-year students.[39]
Table 3. Descriptive Statistics of Student Characteristics: Associate Degree-Seeking Students
| Student Characteristic | Mean (SD) | n | CUNY Mean[40] |
| Male | 0.26 (0.44) | 7,580 | 0.41 |
| Hispanic or Latino | 0.34 (0.48) | 7,580 | 0.33 |
| Black or African American | 0.42 (0.49) | 7,580 | 0.37 |
| Asian, Native Hawaiian, or other Pacific Islander[41] | 0.11 (0.31) | 7,580 | 0.20 |
| White | 0.07 (0.26) | 7,580 | 0.10 |
| American Indian or Alaska Native | 0.00 (0.07) | 7,580 | 0.00 |
| Two or more races | 0.02 (0.16) | 7,580 | – |
| Race/ethnicity unknown | 0.03 (0.17) | 7,580 | – |
| Age | 29.9 (9.1) | 7,557 | – |
| Age 25 or over | 0.58 (0.49) | 7,557 | 0.28 |
| Parent | 0.31 (0.46) | 5,153 | – |
| Active military or veteran | 0.01 (0.09) | 5,162 | – |
| Enrolled in CUNY ASAP | 0.28 (0.45) | 7,580 | 0.28 |
| Enrolled full time | 0.38 (0.49) | 7,580 | 0.62 |
| Cumulative GPA, t-1 | 2.92 (0.88) | 6,775 | – |
| Cumulative credits, t-1 | 44.8 (31.0) | 6,775 | – |
| First-year student | 0.32 (0.47) | 6,775 | – |
| Sophomore | 0.68 (0.47) | 6,775 | – |
Table 4 presents these statistics for bachelor’s degree-seeking students. Like associate degree-seeking students, male students pursuing a bachelor’s degree are underrepresented and Hispanic or Latino and Black or African American students are overrepresented in our sample relative to the population of CUNY students. Students aged 25 or older are substantially overrepresented in our sample, and students in our sample are less likely than the general CUNY population to be enrolled full time. Nearly half (48 percent) of bachelor’s degree-seeking students in our sample are seniors, nearly a third (32 percent) are juniors, and only six percent are first-year students.[42]
Table 4. Descriptive Statistics of Student Characteristics: Bachelor’s Degree-Seeking Students
| Student Characteristic | Mean (SD) | n | CUNY Mean[43] |
| Male | 0.29 (0.45) | 20,389 | 0.42 |
| Hispanic or Latino | 0.33 (0.47) | 20,389 | 0.28 |
| Black or African American | 0.34 (0.47) | 20,389 | 0.25 |
| Asian, Native Hawaiian, or other Pacific Islander[44] | 0.18 (0.38) | 20,389 | 0.26 |
| White | 0.08 (0.28) | 20,389 | 0.22 |
| American Indian or Alaska Native | 0.00 (0.06) | 20,389 | 0.00 |
| Two or more races | 0.03 (0.18) | 20,389 | – |
| Race/ethnicity unknown | 0.03 (0.03) | 20,389 | – |
| Age | 26.4 (7.9) | 20,335 | – |
| Age 25 or over | 0.43 (0.49) | 20,335 | 0.20 |
| Parent | 0.19 (0.39) | 13,310 | – |
| Active military or veteran | 0.01 (0.12) | 13,316 | – |
| Enrolled in CUNY ASAP | 0.05 (0.21) | 20,389 | – |
| Enrolled full time | 0.58 (0.49) | 20,389 | 0.78 |
| Cumulative GPA, t-1 | 2.99 (0.78) | 19,164 | – |
| Cumulative credits, t-1 | 85.8 (34.3) | 19,164 | – |
| First-year student | 0.06 (0.24) | 19,164 | – |
| Sophomore | 0.13 (0.34) | 19,164 | – |
| Junior | 0.32 (0.47) | 19,164 | – |
| Senior | 0.48 (0.50) | 19,164 | – |
In Tables 5 and 6, we present the same set of descriptive statistics with a focus on how the characteristics of the treatment group (i.e., students who received a grant in the given term) compared to the control group (i.e., students who did not receive a grant in the given term). There are several key differences between the two groups. As shown in Table 5, among associate degree-seeking students, grant recipients were, on average, about half a year older and more likely to be aged 25 or older and identify as Hispanic or Latino or Black or African American than non-recipients. They were also more likely to be first-year students, while non-recipients were more likely to be sophomores. Despite being more likely to be enrolled full time than non-recipients, recipients earned, on average, about three fewer credits entering the given term. It is also worth noting that, while there are no substantive differences between the two groups in the share of recipients who are male, only about one-quarter of applicants are male.
Despite being more likely to be enrolled full time than non-recipients, recipients earned, on average, about three fewer credits entering the given term.
Table 5. Descriptive Statistics of Student Characteristics by Grant Receipt: Associate Degree-Seeking Students
| Student Characteristic | Treatment (Grant Recipient in Term t) | Control (Non-Recipient in Term t) | ||
| Mean (SD) | n | Mean (SD) | n | |
| Male | 0.25 (0.43) | 2,842 | 0.26 (0.44) | 4,738 |
| Hispanic or Latino | 0.36 (0.48) | 2,842 | 0.33 (0.47) | 4,738 |
| Black or African American | 0.43 (0.50) | 2,842 | 0.41 (0.49) | 4,738 |
| Age | 29.3 (9.2) | 2,831 | 28.7 (9.0) | 4,726 |
| Age 25 or over | 0.61 (0.49) | 2,831 | 0.57 (0.50) | 4,726 |
| Parent | 0.32 (0.47) | 2,135 | 0.30 (0.46) | 3,018 |
| Active military or veteran | 0.01 (0.10) | 2,138 | 0.01 (0.08) | 3,024 |
| Enrolled in CUNY ASAP | 0.27 (0.44) | 2,842 | 0.29 (0.46) | 4,738 |
| Enrolled full time | 0.42 (0.49) | 2,842 | 0.36 (0.48) | 4,738 |
| Cumulative GPA, t-1 | 2.92 (0.95) | 2,439 | 2.93 (0.83) | 4,336 |
| Cumulative credits, t-1 | 42.6 (31.2) | 2,439 | 46.0 (30.8) | 4,336 |
| First-year student | 0.37 (0.48) | 2,439 | 0.30 (0.44) | 4,336 |
| Sophomore | 0.63 (0.48) | 2,439 | 0.70 (0.48) | 4,336 |
Among bachelor’s degree-seeking students, grant recipients were nearly one year older and more likely to be aged 25 or older and identify as Hispanic or Latino or Black or African American than non-recipients. The distribution of class standing between recipients and non-recipients was similar, although recipients were less likely to be seniors. Again, recipients were more likely to be enrolled full time but had earned, on average, four fewer credits than non-recipients. Across both groups, female students were substantially more likely than male students to apply for financial assistance. Table 6 presents these results.
Table 6. Descriptive Statistics of Student Characteristics by Grant Receipt: Bachelor’s Degree-Seeking Students
| Student Characteristic | Treatment (Grant Recipient in Term t) | Control (Non-Recipient in Term t) | ||
| Mean (SD) | n | Mean (SD) | n | |
| Male | 0.26 (0.44) | 3,708 | 0.29 (0.46) | 16,681 |
| Hispanic or Latino | 0.34 (0.47) | 3,708 | 0.33 (0.47) | 16,681 |
| Black or African American | 0.37 (0.48) | 3,708 | 0.33 (0.47) | 16,681 |
| Age | 27.1 (8.6) | 3,688 | 26.2 (7.8) | 16,647 |
| Age 25 or over | 0.47 (0.50) | 3,688 | 0.42 (0.49) | 16,647 |
| Parent | 0.23 (0.42) | 2,666 | 0.18 (0.38) | 10,644 |
| Active military or veteran | 0.02 (0.13) | 2,668 | 0.01 (0.12) | 10,648 |
| Enrolled in CUNY ASAP | 0.03 (0.16) | 3,708 | 0.05 (0.22) | 16,681 |
| Enrolled full time | 0.61 (0.49) | 3,708 | 0.57 (0.49) | 16,681 |
| Cumulative GPA, t-1 | 2.97 (0.85) | 3,317 | 3.00 (0.76) | 15,847 |
| Cumulative credits, t-1 | 82.6 (35.3) | 3,317 | 86.5 (34.0) | 15,847 |
| First-year student | 0.08 (0.28) | 3,317 | 0.06 (0.24) | 15,847 |
| Sophomore | 0.14 (0.35) | 3,317 | 0.13 (0.34) | 15,847 |
| Junior | 0.32 (0.47) | 3,317 | 0.32 (0.47) | 15,847 |
| Senior | 0.45 (0.50) | 3,317 | 0.49 (0.50) | 15,847 |
Award characteristics
We also analyzed the financial assistance that students requested, the award amount, and the difference between those two amounts, which we refer to as the unmet request amount. It is worth noting that this is different from unmet need, a common metric in higher education research that captures the gap between a student’s cost of attendance and the sum of all financial aid that does not need to be repaid (i.e., grants and scholarships) and a student’s expected family contribution. Because students may request amounts that exceed the costs associated with their financial emergency, the unmet request may overstate the actual amount of financial assistance not met.
With those caveats in mind, we report the mean request amounts for all applicants and then separately for associate and bachelor’s degree-seeking students. We also report the mean award amounts and unmet request amounts for grant recipients only, since these data are only available for students who received grants. We report these measures for all grant recipients and then separately for associate and bachelor’s degree-seeking students.
As shown in Table 7, across all students and institutions, the average request amount among all applicants was $2,312, while the average request amount among recipients only was $2,273. The average award amount was $1,003, meaning the average unmet amount was $1,270 for grant recipients. The average award among associate degree-seeking students ($975) was slightly less than the average award among bachelor’s degree-seeking students ($1,024), despite the fact that associate degree-seeking students requested higher amounts on average ($2,421 compared to $2,160).
Table 7. Average Request Amount, Award Amount, Unmet Request Amount
| Mean Request Amount (All Applicants) | Mean Request Amount (Recipients Only) | Mean Award Amount (Recipients Only) | Mean Unmet Request Amount (Recipients Only)[45] | |
| All Students | $2,312
(n = 12,289) |
$2,273
(n = 5,301) |
$1,003
(n = 5,301) |
$1,270
(n = 5,301) |
| Associate Degree-Seeking Students | $2,436
(n = 3,960) |
$2,421
(n = 2,289) |
$975
(n = 2,289) |
$1,446
(n = 2,289) |
| Bachelor’s Degree-Seeking Students | $2,253
(n = 8,329) |
$2,160
(n = 3,012) |
$1,024
(n = 3,012) |
$1,136
(n = 3,012) |
Results
For both the full sample and subgroups of interest, we present the estimated effects of grant receipt on student outcomes, separately for associate and bachelor’s degree-seeking students. Among grant recipients, we also examine whether the award amount and the unmet request amount are associated with outcomes. Finally, for the full analytic sample, we present results from a regression model with an alternative treatment definition in which students are considered treated in the term they receive an award and in all subsequent terms. We also present results from a regression model with the original treatment definition and student fixed effects.
Associate degree-seeking students
Full analytic sample
Among associate degree-seeking students in the full analytic sample, after controlling for observable differences between students who received a grant and those who did not in the given term, there were significant impacts on persistence, but no observed impacts on graduation. Associate degree-seeking students who received a grant persisted at higher rates than non-recipients, although the effect diminished over time. Compared to non-recipients, grant recipients were three percentage points more likely to persist to the next term and five percentage points more likely to persist one year later, which from our sample translates into 79 and 96 additional students persisting to the next term and one year later, respectively.[46] By the two-year follow-up point, however, the difference in persistence between the two groups was no longer statistically significant. Because persistence is defined as enrollment at or graduation from a CUNY institution, the measure does not capture students who transferred to an institution outside CUNY before earning a degree.
Regression results in Table 8 present the relationship between grant receipt and persistence outcomes for associate degree-seeking students. As shown in Table 8 and all subsequent regression tables, it is worth pointing out that the number of observations decreases as the follow-up period increases because fewer student-term observations have sufficient follow-up data to observe the outcome.
Table 8. Treatment-on-the-Treated Effects of Grant Receipt on Persistence Outcomes: Associate Degree-Seeking Students
| Next-Term Persistence | One-Year Persistence | Two-Year Persistence | |
| Grant receipt | 0.03* (0.01) | 0.05** (0.02) | 0.01 (0.02) |
| Control group mean | 0.76 | 0.67 | 0.62 |
| Student-term observations | 5,573 | 4,448 | 2,327 |
| R-squared | 0.06 | 0.08 | 0.09 |
Standard errors adjusted for clusters at the student level are in parentheses. *p<0.05, **p<0.01, ***p<0.001
There were no statistically significant differences in graduation rates for associate degree-seeking students within one or two years between students who received a grant and those who did not in the given term. Regression results in Table 9 present the relationship between grant receipt and graduation outcomes for associate degree-seeking students.
Table 9. Treatment-on-the-Treated Effects of Grant Receipt on Graduation Outcomes: Associate Degree-Seeking Students
| One-Year Graduation | Two-Year Graduation | |
| Grant receipt | 0.02 (0.01) | 0.01 (0.02) |
| Control group mean | 0.23 | 0.34 |
| Student-term observations | 4,607 | 2,528 |
| R-squared | 0.18 | 0.22 |
Standard errors adjusted for clusters at the student level are in parentheses. *p<0.05, **p<0.01, ***p<0.001
Subgroups of interest
Although applicants in the full analytic sample who received a grant were significantly more likely than those who did not to persist to the next term and one year later, these effects were driven by several subgroups. Specifically, Hispanic or Latino students who received a grant were six percentage points more likely to persist to the next term and five percentage points more likely to persist one year later, although that latter result was not statistically significant. These percentage point differences translate into an additional 49 and 36 Hispanic or Latino students persisting to the next term and one year later, respectively. Female grant recipients had a five percentage point higher next-term persistence rate and a six percentage point higher one-year persistence rate, compared to their non-recipient peers. These percentage point differences translate into an additional 87 and 93 female students persisting to the next term and one year later, respectively.
Similarly, first-year students who received a grant had a five percentage point higher next-term persistence rate and a nine percentage point higher one-year persistence rate. These percentage point differences translate into an additional 41 and 58 first-year students who persisted to the next term and one year later, respectively. For the remaining subgroups (i.e., Black or African American students, male students, adult learners, and sophomores), grant receipt was not correlated with persistence effects at any time horizon.
Although grant recipients in the full analytic sample were no more likely than non-recipients to graduate within one year, sophomore grant recipients were four percentage points more likely to graduate within one year than their non-recipient peers. This percentage point difference translates into an additional 49 sophomore students who graduated within one year. Among student subgroups, the two-year graduation rates between grant recipients and non-recipients only differed for Black or African American grant recipients, who were six percentage points less likely to graduate, which translates into 37 fewer Black or African American students graduating within two years after grant receipt.
Award amount and unmet request amount effects
To better understand whether treatment dosage or intensity (i.e., award amount) was associated with student outcomes, we conducted additional regression analyses for each outcome that had statistically significant differences between students who received a grant and those who did not in the full analytic sample. To do this, we replaced the binary treatment indicator with the award amount and restricted the analysis to grant recipients only. As a reminder, award amounts for associate degree-seeking students averaged $975.
For each outcome examined, the coefficients on grant amount were close to zero and not statistically significant. These findings suggest that, among grant recipients, outcomes did not differ according to the magnitude of the grant received. Figure 1 below presents the relationship between award amount and next-term persistence rates. The relationship is fairly flat across the range of award amounts, which means that grant recipients had similar persistence and graduation rates regardless of the amount of money they received. Because the data points at higher dollar amounts include fewer observations, the outlier near $3,000 includes only a few observations, which represent less than one percent of all observations.
Figure 1. Relationship Between Award Amount and Next-Term Persistence Rates: Associate Degree-Seeking Students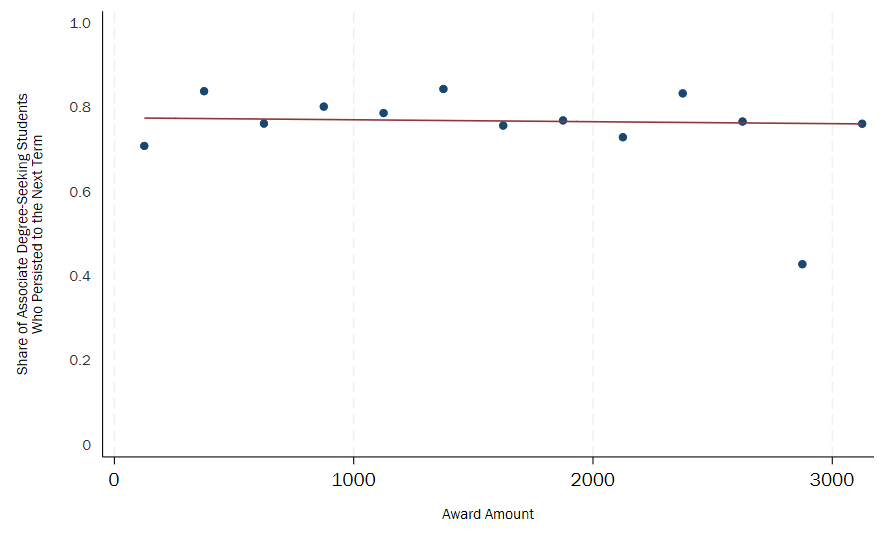
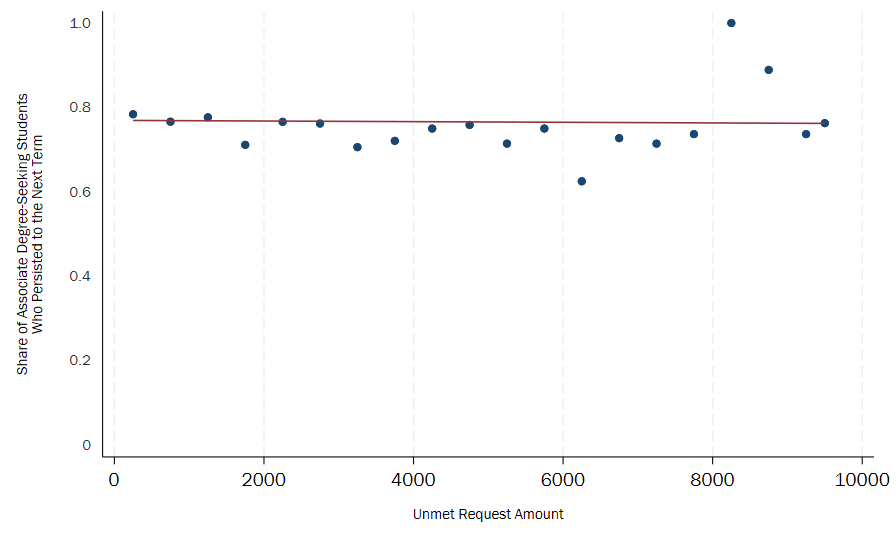
We also examined the relationship between the unmet request amount, representing the difference between how much grant recipients requested and how much they received, and outcomes. As a reminder, unmet request amounts for associate degree-seeking students averaged $1,446. To perform this analysis, we replaced the binary treatment indicator with the unmet request amount and restricted the analysis to grant recipients only. Again, the coefficients were close to zero and not statistically significant, suggesting that outcomes did not differ according to the size of the unmet request amount. The outliers at the upper end of the distribution represent just under one percent of the data. Figure 2 below presents the relationship between unmet request amount and next-term persistence rates.
Figure 2. Relationship Between Unmet Request Amount and Next-Term Persistence Rates: Associate Degree-Seeking Students
Alternative treatment definition
When we ran the model using the alternative treatment definition in which students are considered treated in the term they receive an award and in all subsequent terms, the results were similar to those of the primary regression model. Among associate degree-seeking students, grant recipients had a five percentage point higher next-term persistence rate and one-year persistence rate than non-recipients. However, there were no differences between recipients and non-recipients in one- or two-year graduation rates, which was consistent with the primary model results.
Student fixed effects
When we ran the model using the original treatment definition and student fixed effects, the results were directionally similar to those of the primary regression model. Among associate degree-seeking students, grant recipients had a two percentage point higher next-term persistence rate, though it was no longer statistically significant, and a four percentage point higher one-year persistence rate, which continued to be statistically significant. The inclusion of student fixed effects decreased the sample, resulting in higher standard errors that contributed to the higher p-value for the next-term estimate. At the same time, the coefficient estimate decreased slightly, which suggests that the next-term estimate may partially reflect differences between the treatment and control groups that do not change over time.
Bachelor’s degree-seeking students
Full analytic sample
Among bachelor’s degree-seeking students in the full analytic sample, after controlling for observable differences between students who received a grant in the given term and those who did not, there were significant impacts on persistence, but no observed impacts on graduation, similar to findings for associate degree-seeking students. Grant recipients were three percentage points more likely to persist to the next term and one year later, but no more likely than non-recipients to persist two years later. Those percentage point differences translate into 97 and 71 additional students persisting to the next term and one year later, respectively. Again, because persistence is defined as earning a degree or still being enrolled at a CUNY institution, this measure does not capture students who transferred to an institution outside CUNY before graduating. Regression results in Table 10 present the relationship between grant receipt and persistence outcomes for bachelor’s degree-seeking students.
Table 10. Treatment-on-the-Treated Effects of Grant Receipt on Persistence Outcomes: Bachelor’s Degree-Seeking Students
| Next-Term Persistence | One-Year Persistence | Two-Year Persistence | |
| Grant receipt | 0.03** (0.01) | 0.03* (0.01) | 0.02 (0.01) |
| Control group mean | 0.80 | 0.70 | 0.56 |
| Student-term observations | 15,375 | 12,101 | 5,547 |
| R-squared | 0.08 | 0.12 | 0.22 |
Standard errors adjusted for clusters at the student level are in parentheses. *p<0.05, **p<0.01, ***p<0.001
There were no statistically significant differences in one- or two-year graduation rates between grant recipients and non-recipients among bachelor’s degree-seeking students. Regression results in Table 11 present the relationship between grant receipt and graduation outcomes for bachelor’s degree-seeking students.
Table 11. Treatment-on-the-Treated Effects of Grant Receipt on Graduation Outcomes: Bachelor’s Degree-Seeking Students
| One-Year Graduation | Two-Year Graduation | |
| Grant receipt | -0.01 (0.01) | 0.01 (0.01) |
| Control group mean | 0.21 | 0.32 |
| Student-term observations | 12,492 | 6,235 |
| R-squared | 0.24 | 0.25 |
Standard errors adjusted for clusters at the student level are in parentheses. *p<0.05, **p<0.01, ***p<0.001
Subgroups of interest
Overall, grant recipients persisted to the next term and one year later at a three percentage point higher rate than non-recipients, although there were no differences in persistence rates two years later. Similar results were observed among Hispanic or Latino students, male students, juniors, and seniors.
Hispanic or Latino grant recipients were four percentage points more likely to persist to the next term and one year later, which translates into 46 and 35 additional Hispanic or Latino students persisting to each respective time horizon. Male grant recipients were five percentage points more likely to persist to the next term and four percentage points more likely to persist one year later, which translates into 39 and 32 additional male students persisting to each respective time horizon. Female grant recipients were three percentage points more likely to persist to the next term, which translates into 58 additional female students persisting to the next term, although female grant recipients were no more likely to persist one year later than non-recipients. Meanwhile, Black or African American students and adult learners exhibited the opposite pattern, in which their persistence rate to the subsequent term did not differ from that of non-recipients, but both groups of grant recipients persisted one year later at a four percentage point higher rate than their control group peers, although it is not clear what might explain this pattern of improved persistence one year later but not to the next term. These percentage point differences translate into an additional 43 Black or African American students and 52 adult learners persisting one year later.
The largest effect was for first-year students, who persisted to the next term at a rate that was nine percentage points higher than first-year students who did not receive a grant. First-year students represented only six percent of bachelor’s degree-seeking students who applied for a grant, so their higher persistence rate translates to only 22 additional freshman recipients persisting to the next term. Furthermore, the initially strong persistence effect among first-year students diminished, and at one year there was no difference in persistence rates between first-year students who received a grant and those who did not. Juniors who received a grant were three percentage points more likely to persist to the next term and four percentage points more likely to persist one year later, which respectively translates into 26 and 28 additional juniors persisting to the next term and one year later. Seniors who received a grant were four percentage points more likely to persist to the next term and one year later, which respectively translates into 50 and 38 additional seniors persisting to the next term and one year later. Sophomores were the only group of students for whom there were no differences in persistence between grant recipients and non-recipients at any time horizon.
One-year graduation rates did not differ significantly between grant recipients and non-recipients for any subgroup we examined, consistent with the findings from the full sample. Two-year graduation rates were four percentage points higher among Black or African American grant recipients, which would translate into an additional 26 Black or African American students graduating, but that difference was not statistically significant.
While it is surprising that the four percentage point higher one-year persistence rate did not translate into higher graduation rates for seniors, one explanation is that cumulative credits is an imperfect proxy for progress to degree completion. Although students with 90 or more credits appear close to the 120 credits typically required to earn a bachelor’s degree, some portion of those credits may not apply toward their degree requirements. If this is the case, some students may be further from graduation than their credit accumulation suggests.
Award amount and unmet request amount effects
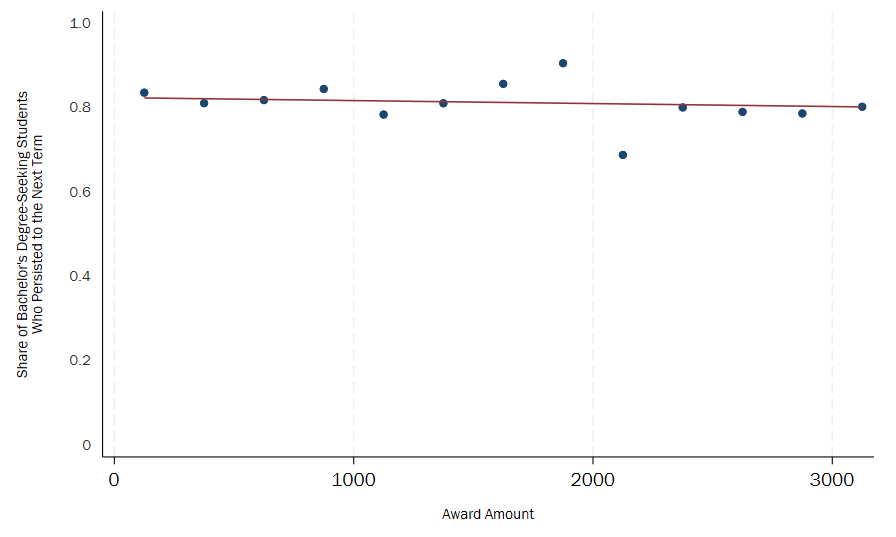
Next-term and one-year persistence were the only outcomes in which we found a statistically significant difference between grant recipients and non-recipients. Therefore, persistence was the only outcome we examined for potential dosage effects. As a reminder, award amounts for bachelor’s degree-seeking students averaged $1,024. Among grant recipients, when we replaced the treatment indicator with award amount, we found no statistically significant relationship between award amount and next-term or one-year persistence. This suggests that students persisted at similar rates regardless of the size of the award received, as was the case for associate degree-seeking students. Figure 3 presents next-term persistence rates by award amount. The rates are fairly consistent across amounts, reflecting the absence of a relationship between the two.
Figure 3. Relationship Between Award Amount and Next-Term Persistence Rates: Bachelor’s Degree-Seeking Students
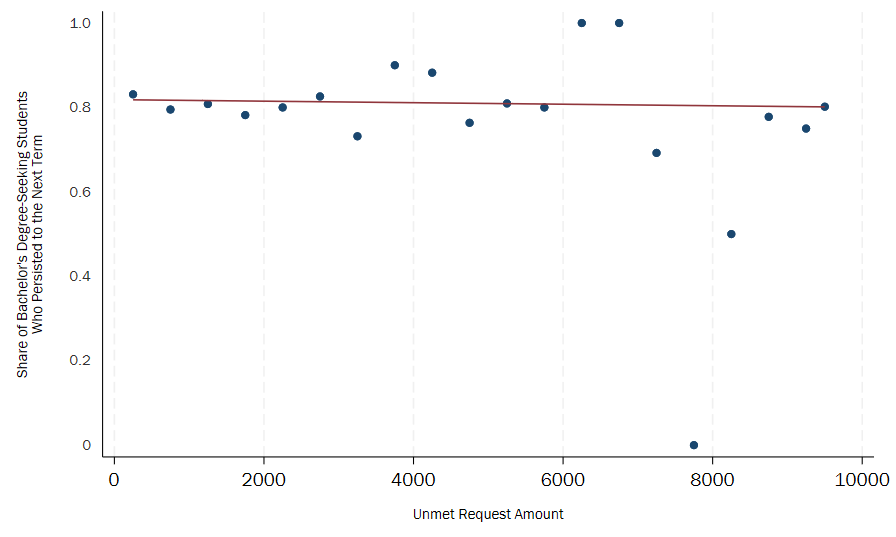
We also examined the relationship between unmet request amount and next-term and one-year persistence among bachelor’s degree-seeking recipients. As a reminder, unmet request amounts for bachelor’s degree-seeking students averaged $1,136. After replacing the treatment indicator with the unmet request amount, the coefficient was close to zero and not statistically significant for either outcome, indicating that grant recipients persisted at similar rates regardless of the unmet request amount. Figure 4 presents next-term persistence rates by different unmet request amounts among bachelor’s degree-seeking grant recipients. This distribution shows more variability, especially for amounts over $6,000. However, only four percent of bachelor’s degree-seeking grant recipients had unmet request amounts exceeding $6,000, indicating that these outliers are based on relatively few observations and therefore have a limited influence on the overall relationship.
Figure 4. Relationship Between Unmet Request Amount and Next-Term Persistence Rates: Bachelor’s Degree-Seeking Students
Alternative treatment definition
When we ran the model using the alternative treatment definition in which students are considered treated in the term they receive an award and in all subsequent terms, the results were similar to those of the primary regression model. In this model specification, next-term persistence was the only outcome that differed significantly between grant recipients and non-recipients, with grant recipients two percentage points more likely to persist to the following term. Grant recipients were also two percentage points more likely to persist one year later; however, the result was not statistically significant.
Student fixed effects
When we ran the model using the original treatment definition and student fixed effects, the results were similar to those of the primary regression model for next-term persistence but not one-year persistence. Among bachelor’s degree-seeking students, grant recipients had a two percentage point higher next-term persistence rate, whereas there was no difference in one-year persistence between grant recipients and non-recipients. The drop in the one-year coefficient suggests that the estimate in the primary model may partly reflect differences between the treatment and control groups that do not change over time.
Challenges and limitations
While we found statistically significant positive associations between grant receipt and several student outcomes, there are limitations to this study that should be considered when interpreting these findings.
The first significant challenge was the completeness of the available data and the size of the resulting dataset. Although institutions were required to report whether an application was approved and the date of approval, reporting beyond these required elements was optional and therefore inconsistent across institutions. For example, approximately 13 percent of applications included in the applications file, representing about 2,300 students, have no corresponding entries in the longitudinal data. Additionally, approximately 24 percent of applications marked as approved in the applications file, representing about 1,100 students, have no corresponding entries in the funds distributed file. Even required data elements were sometimes missing from student records (see, for example, missing approval dates and academic terms in Table 1 and missing institution identifier and application approval status in Table 2). Observations missing key information were excluded from the analyses. If this missingness was systematic rather than random, then the resulting estimates could be biased. Even if the missingness was not systematic, the removal of incomplete records reduced the size of the analytic sample and statistical power through higher standard errors, making it more difficult to detect meaningful differences between the treatment and control groups.
Sample sizes were further reduced for longer-term outcomes because fewer observations had sufficient follow-up time for those outcomes to be observed. For example, persistence to the next term can be measured for students in the fall 2024 term because spring 2025 term data are in the dataset. However, one- and two-year outcomes cannot be observed for these student observations because the dataset does not extend far enough to capture them (into the fall 2025 and fall 2026 terms). This limitation is especially important given that the association between grant receipt and persistence was largest among first-year students. The follow-up period was not sufficient to determine whether improved short-term persistence translated to longer-term graduation outcomes for first-year students.
There are questions about our ability to isolate the effect of grant receipt from other differences between the treatment and control groups. Because this study examines the effects of grants on applicants’ outcomes in an observational setting, treatment was not randomly assigned. Although the Petrie Foundation has standardized many aspects of the application process and established general eligibility criteria, institutions have discretion in determining which students actually receive grants. This flexibility may result in systematic differences in the composition of grant recipients and non-grant recipients that are not fully captured by our models, introducing the potential for bias.
For example, approximately one-third of institutions use a pre-screening process that varies by school before students submit a formal application. It is possible that these pre-screening decisions may incorporate assessments to determine which students are more likely to benefit from financial assistance. If this is the case, the observed differences in outcomes could reflect these baseline differences rather than grant receipt. Because we did not have information on the students screened out before submitting an application or all the factors institutions considered when making decisions on who receives an award, we could not assess the extent of this issue or adequately control for it in our analyses.
As a result, students who received emergency grants may differ systematically from those who did not receive them. Although our regression models control for an important subset of observed differences between the two groups, they do not account for unobserved differences. Changes in the magnitude and statistical significance of some estimates after including student fixed effects underscores this issue because they suggest that the estimated effects in the primary model may reflect differences in student characteristics that do not change over time. As such, the results should be interpreted as associations between grant receipt and outcomes, not as causal estimates.
Discussion
Key takeaways
Among associate degree-seeking students, grant receipt was associated with improved short-term persistence, with the largest effects among first-year students, based on cumulative credits, not number of years enrolled. We found no effects on graduation, likely because the students who experienced the largest persistence effects were early in their academic careers and the follow-up period was shorter than the time needed to complete their degrees.
The findings for bachelor’s degree-seeking students were very similar. Grant recipients experienced short-term persistence improvements but no improvements in graduation rates. Like associate degree-seeking students, the largest persistence gains were among first-year students, who were unlikely to have graduated within the study period, which would support null effects on graduation. Taken together with the findings on associate degree-seeking students, these patterns suggest that emergency aid may be particularly effective at improving short-term persistence when students are just beginning their college careers. Prior research conducted by Ithaka S+R on the barriers to persistence has found that students who progress further in their college career are increasingly more likely to persist, with the lowest rates of retention between the first and second years of college.[47] In other words, emergency financial assistance may be most consequential when the risk of attrition is the highest.
Emergency financial assistance may be most consequential when the risk of attrition is the highest.
More broadly, the small analytic sample and shorter observation window reduced statistical power and limited our ability to detect longer-term effects, particularly on graduation. With a larger sample and longer follow-up period, graduation effects may have become detectable, especially for students who received grants early in their academic careers and experienced a persistence boost.
One potential explanation for why persistence gains were largest among first-year students is that these students may be encountering their first significant financial hardship while still carrying relatively little debt. As students progress through college, borrowing and financial pressures often compound, likely reducing the effectiveness of a one-time grant. This might also explain why first-year students were the least likely to apply, making up less than one-third of associate degree-seeking applicants and six percent of bachelor’s degree-seeking applicants. If financial strain increases as students remain enrolled, upper-level students would be more likely to seek assistance. An alternative explanation for why first-year students were underrepresented in our analytic sample is the result of limited awareness of financial aid, including these grants, raising the question of whether institutions should do more to promote this program. Unfortunately, the dataset did not include measures of cumulative debt and we did not collect qualitative insights from students on the pressures they faced, so we could not test these hypotheses.
Subgroup analyses revealed additional important insights. Among associate degree-seeking students, male grant recipients did not experience persistence gains that were either statistically significant or close to statistical significance at any time horizon, relative to their non-recipient peers. This finding is consistent with prior causal research at Tarrant County College, where male recipients of emergency aid, including those who also received comprehensive case management, were no more likely than the control group to enroll in subsequent semesters. Additionally, male students are much less likely to apply for a grant than female students. These findings raise important questions about whether male students require different forms of financial and non-financial support to improve their persistence and degree completion rates. One possible explanation is that men may believe that they have a wider array of career options that do not require a college degree, reducing the appeal of remaining enrolled while foregoing employment and potentially accumulating more debt.[48]
Exploratory analyses examining the relationship between award amounts and student outcomes, as well as the relationship between unmet request amounts and student outcomes among grant recipients found no associations. One plausible, but speculative, interpretation of this finding is that institutions are generally good at matching grant amounts to the magnitude of students’ financial emergencies, with larger awards not producing better outcomes and larger unmet request amounts not producing worse outcomes. However, this interpretation should be viewed with caution. Students could request amounts that exceed the actual costs of their financial emergency, making unmet request amounts an imperfect measure. Additionally, there was relatively little variation in award amounts, which may limit the ability to detect a relationship between award amount and student outcomes.
While emergency aid is an important tool that can help students overcome an immediate financial crisis, it may not be sufficient on its own to protect them from future financial hardship and improve long-term outcomes.
Finally, in the absence of evidence of effects on longer-term outcomes, our findings suggest that the benefits of emergency aid may diminish over time. In other words, while emergency aid is an important tool that can help students overcome an immediate financial crisis, it may not be sufficient on its own to protect them from future financial hardship and improve long-term outcomes, especially for students who are not close to graduation. This is not a criticism of emergency aid; instead, it highlights that emergency aid is intended to address students’ immediate financial need. Therefore, emergency aid may be more effective when paired with additional supports that address other challenges accompanying financial hardship. This explanation may be most relevant for adult learners, who make up nearly half of grant recipients are more likely to balance employment, caregiving, and other family and financial responsibilities. The findings from the RCT at Tarrant County College are particularly instructive in this regard, demonstrating that students experienced the greatest benefits when emergency aid was paired with individualized case management.
Avenues for future research
Our evaluation is a first look into the effectiveness of the Student Emergency Grant Fund and contributes to the body of literature on emergency aid programs, which continues to grow amid rising concerns about college affordability and unexpected financial hardship. We have identified several areas for future research that will support policymakers and practitioners in understanding the effects of this and similar programs nationwide.
Examine the relationship between grant receipt and financial indicators. This study could not examine several key dimensions of financial hardship, including student debt and unpaid institutional balances, which might also influence persistence and degree completion. As hypothesized earlier, emergency grants may be less effective as students progress through their college career because borrowing, debt, and financial pressures accumulate, reducing the impact of a one-time grant and students’ willingness to borrow more unless they are close to graduation. Incorporating measures like student debt and institutional balances would provide a more comprehensive understanding of the degree to which financial well-being influences student outcomes.
Employ qualitative methods to understand how students are addressing continued financial hardship and their impacts on psychological well-being. Although emergency grants appear to help many students deal with immediate financial emergencies, questions remain about the financial challenges that persist, even for students who apply and receive assistance. For example, do applicants negotiate payment plans with creditors, work additional hours, rely on financial support from others, or accumulate other forms of debt to pay for college? How do these financial challenges affect their psychological well-being, sense of belonging, and perceptions of their institutions? How do these experiences and perceptions differ between grant recipients and non-recipients? Student interviews, focus groups, and surveys could help answer these questions and explain why some students persist while others continue to struggle despite receiving emergency assistance.
Explore differences in outcomes by student subgroups. We found that positive results were driven by different groups of students and that effects differed between associate and bachelor’s degree-seeking students. For example, female and Hispanic or Latino associate degree-seeking students experienced positive short-term persistence effects, whereas other groups in our analyses did not. Meanwhile, persistence effects for bachelor’s degree-seeking students were more evenly distributed among different student groups. For example, Black or African American students and adult learners did not experience an increase in their next-term persistence rate after grant receipt, but they did experience an increase in one-year persistence rates. A qualitative investigation could help us better understand these persistence dynamics and provide more substantive suggestions for how to best support different student populations.
Study the combination of emergency grant funding with other support services. As discussed earlier, emergency aid may be most effective when paired with other supports that address broader challenges to financial hardship. This then raises an important question: What types of supports are most effective when paired with emergency grants? The answer may vary depending on the type of students receiving aid and the institutional and system context. At Tarrant County College in Fort Worth, the combination of emergency aid and case management proved effective. But that may not produce the same results at CUNY campuses in New York City. Future research should aim to study and identify which combinations of supports are most effective for various student subgroups across different settings.
Appendix A. Data collection and sample construction details
To construct our analytic sample, we combined data across three de-identified student-level data files that we collected from the Petrie Foundation: an applications file, a funds distributed file, and a longitudinal student outcomes file. The applications file contains records for individual student applications submitted through the application portal. Specifically, the dataset includes the application submission date, the institution the application was submitted to, the amount requested, the reason for the request, the application decision (i.e., either approved or rejected), and the decision date, along with demographic and academic characteristics of the applicant. The funds distributed file contains additional information for grants, including the award amount, the awarding institution, and the date the award was submitted to the institution’s finance office for disbursement. Institutions do not consistently report this information for grants, so some are missing from this file. The longitudinal student outcomes file contains student-term records from CUNYfirst (CUNY’s student information system) for all grant applicants, beginning in fall 2021 and covering all terms for which CUNY has enrollment data. These records include information on students’ enrollment status, cumulative credits, cumulative GPA, degree level, and graduation status.
The initial applications file consisted of 25,208 observations, of which 23 were missing a student ID and 280 were marked by CUNY staff as duplicate or test applications by Petrie Foundation personnel. Of the remaining 24,905 observations, we removed 5,623 that did not include the term in which the application was approved or rejected, as these records could not be matched to longitudinal outcomes for analyses, leaving 19,282 observations. The file contained two variables indicating application review status, with some disagreement between them. We treated the first variable, which classified applications as either approved or rejected, as the primary variable. We used the second variable, which classified applications as approved, rejected, or still under review, when the primary variable was missing.[49] Among the remaining 19,282 observations, the primary variable identified 8,085 approved applications and 7,839 rejected applications. Supplementing these data with the secondary indicator increased approved applications to 9,121 and rejected applications to 9,984. We excluded the 177 observations for which we could not determine approval status using either indicator, leaving an analytic sample of 19,105 observations.
Because the dataset included multiple applications for some student-term combinations, we aggregated application records to the student-term level, creating one observation for each student-term combination. To do this, we calculated the average amount requested by summing the requested amounts and dividing by the number of applications. We also recorded the number of approved applications. This aggregation resulted in 17,243 student-term observations, with 8,660 approved applications and 8,583 rejected applications.
The second file, the funds distributed file, included the amount each student received for a grant, which typically differed from the amount requested. It also included notes describing the purpose of each grant and the date on which the approved amount was submitted to the Finance Department for processing. Awards were frequently split into multiple records to specify the amount allocated to each purpose, such as housing assistance, MetroCards, or food assistance. Although the file initially included 9,573 observations, these records correspond to fewer applications. To produce a dataset aligned with the applications file, we aggregated the records to the student-term level by summing the amounts awarded to each student in each term. This resulted in 7,613 unique student-term observations. We then merged the aggregated applications and funds distributed files.
Of the 8,660 student-term observations associated with grants in the applications file, 7,167 (83 percent) matched a corresponding observation in the funds distributed file. An additional 523 observations in the funds distributed file could not be linked back to the applications file. The most common reasons were because approval status or approval dates were missing from one of the files or the applications file did not include student ID. We excluded these 523 unmatched observations.
The longitudinal student outcomes file contained 113,800 student-term observations covering all terms for which CUNY had enrollment records for each student, including enrollment data for terms preceding a student’s first grant application. The file also included duplicate student-term observations. We used the following rules to remove these duplicates so that the dataset included only one observation for each student-term combination.
First, we removed 13,526 exact duplicates. Second, when a student had records from multiple institutions but was identified as enrolled in only one of those records, we retained the record from the enrolled institutions, removing 4,039 records associated with institutions where the student was not enrolled. Third, when a student was enrolled at multiple institutions simultaneously, we retained the record from the institution from which they graduated or, if the student had not graduated, the institution at which they had completed the most cumulative credits. This removed 1,180 observations. Fourth, when a student had multiple records reflecting a double major, or an alternate spelling of the same major, at a single institution, we kept one major and removed the other, resulting in the removal of 2,516 observations. Fifth, there were 208 duplicate records in which a student was simultaneously marked as seeking an associate and bachelor’s degree with the same number of cumulative credits. In these cases, we kept the bachelor’s degree records. After all of these steps, the longitudinal student outcomes file contained 92,331 unique student-term observations.
After merging the three datasets, there were 95,289 unique student-term observations. We then removed 12,253 observations that did not match records in the applications file (i.e., terms appearing only in the longitudinal student outcomes file). Because the study focused on undergraduates seeking their first degree, we removed 11,229 observations of graduate students, 1,090 observations of students pursuing a second degree (excluding vertical transfers), and 190 observations for which class standing data were missing. These steps resulted in 70,527 student-term observations.
To construct the final analytic sample, we excluded observations from terms that fell outside the study period. We removed 30,196 observations from terms preceding a student’s first application. Next, we dropped 4,818 observations from the fall 2025 and spring 2026 terms because enrollment records for those terms were incomplete. We also removed 7,408 observations from terms in which students were not enrolled unless their application for a grant was either approved or rejected during that term. Finally, we dropped 134 observations that appeared in the applications file but lacked longitudinal data and 2 additional observations containing implausibly high grant requests of $100,000 or more. The final analytic sample consisted of 27,969 unique student-term observations.
Appendix B. Regression tables
The tables in this appendix present the full results of the regression models and analyses described in the report.
Table 12. Treatment-on-the-Treated Effects of Grant Receipt on Persistence Outcomes: Associate Degree-Seeking Students
| Next-Term Persistence | One-Year Persistence | Two-Year Persistence | |
| Grant receipt | 0.03* (0.01) | 0.05** (0.02) | 0.01 (0.02) |
| Control group mean | 0.76 | 0.67 | 0.62 |
| Student-term observations | 5,573 | 4,448 | 2,327 |
| R-squared | 0.06 | 0.08 | 0.09 |
| Baseline covariates | YES | YES | YES |
| Term fixed effects | YES | YES | YES |
| Institution fixed effects | YES | YES | YES |
Standard errors adjusted for clusters at the student level are in parentheses. *p<0.05, **p<0.01, ***p<0.001
Table 13. Treatment-on-the-Treated Effects of Grant Receipt on Graduation Outcomes: Associate Degree-Seeking Students
| One-Year Graduation | Two-Year Graduation | |
| Grant receipt | 0.02 (0.01) | 0.01 (0.02) |
| Control group mean | 0.23 | 0.34 |
| Student-term observations | 4,607 | 2,528 |
| R-squared | 0.18 | 0.22 |
| Baseline covariates | YES | YES |
| Term fixed effects | YES | YES |
| Institution fixed effects | YES | YES |
Standard errors adjusted for clusters at the student level are in parentheses. *p<0.05, **p<0.01, ***p<0.001
Table 14. Treatment-on-the-Treated Effects of Grant Receipt on Persistence Outcomes: Hispanic or Latino Associate Degree-Seeking Students
| Next-Term Persistence | One-Year Persistence | Two-Year Persistence | |
| Grant receipt | 0.06* (0.02) | 0.05 (0.03) | 0.00 (0.04) |
| Control group mean | 0.73 | 0.63 | 0.58 |
| Student-term observations | 1,869 | 1,470 | 730 |
| R-squared | 0.06 | 0.10 | 0.09 |
| Baseline covariates | YES | YES | YES |
| Term fixed effects | YES | YES | YES |
| Institution fixed effects | YES | YES | YES |
Standard errors adjusted for clusters at the student level are in parentheses. *p<0.05, **p<0.01, ***p<0.001
Table 15. Treatment-on-the-Treated Effects of Grant Receipt on Graduation Outcomes: Hispanic or Latino Associate Degree-Seeking Students
| One-Year Graduation | Two-Year Graduation | |
| Grant receipt | 0.02 (0.02) | 0.03 (0.03) |
| Control group mean | 0.21 | 0.30 |
| Student-term observations | 1,539 | 816 |
| R-squared | 0.18 | 0.22 |
| Baseline covariates | YES | YES |
| Term fixed effects | YES | YES |
| Institution fixed effects | YES | YES |
Standard errors adjusted for clusters at the student level are in parentheses. *p<0.05, **p<0.01, ***p<0.001
Table 16. Treatment-on-the-Treated Effects of Grant Receipt on Persistence Outcomes: Black or African American Associate Degree-Seeking Students
| Next-Term Persistence | One-Year Persistence | Two-Year Persistence | |
| Grant receipt | 0.00 (0.02) | 0.03 (0.02) | -0.02 (0.03) |
| Control group mean | 0.77 | 0.68 | 0.63 |
| Student-term observations | 2,372 | 1,904 | 1,015 |
| R-squared | 0.07 | 0.09 | 0.11 |
| Baseline covariates | YES | YES | YES |
| Term fixed effects | YES | YES | YES |
| Institution fixed effects | YES | YES | YES |
Standard errors adjusted for clusters at the student level are in parentheses. *p<0.05, **p<0.01, ***p<0.001
Table 17. Treatment-on-the-Treated Effects of Grant Receipt on Graduation Outcomes: Black or African American Associate Degree-Seeking Students
| One-Year Graduation | Two-Year Graduation | |
| Grant receipt | -0.01 (0.02) | -0.06* (0.03) |
| Control group mean | 0.23 | 0.34 |
| Student-term observations | 1,968 | 1,092 |
| R-squared | 0.18 | 0.22 |
| Baseline covariates | YES | YES |
| Term fixed effects | YES | YES |
| Institution fixed effects | YES | YES |
Standard errors adjusted for clusters at the student level are in parentheses. *p<0.05, **p<0.01, ***p<0.001
Table 18. Treatment-on-the-Treated Effects of Grant Receipt on Persistence Outcomes: Male Associate Degree-Seeking Students
| Next-Term Persistence | One-Year Persistence | Two-Year Persistence | |
| Grant receipt | -0.00 (0.03) | 0.00 (0.03) | -0.05 (0.04) |
| Control group mean | 0.75 | 0.66 | 0.64 |
| Student-term observations | 1,411 | 1,143 | 609 |
| R-squared | 0.07 | 0.09 | 0.10 |
| Baseline covariates | YES | YES | YES |
| Term fixed effects | YES | YES | YES |
| Institution fixed effects | YES | YES | YES |
Standard errors adjusted for clusters at the student level are in parentheses. *p<0.05, **p<0.01, ***p<0.001
Table 19. Treatment-on-the-Treated Effects of Grant Receipt on Graduation Outcomes: Male Associate Degree-Seeking Students
| One-Year Graduation | Two-Year Graduation | |
| Grant receipt | 0.02 (0.03) | 0.05 (0.04) |
| Control group mean | 0.21 | 0.31 |
| Student-term observations | 1,178 | 664 |
| R-squared | 0.20 | 0.23 |
| Baseline covariates | YES | YES |
| Term fixed effects | YES | YES |
| Institution fixed effects | YES | YES |
Standard errors adjusted for clusters at the student level are in parentheses. *p<0.05, **p<0.01, ***p<0.001
Table 20. Treatment-on-the-Treated Effects of Grant Receipt on Persistence Outcomes: Female Associate Degree-Seeking Students
| Next-Term Persistence | One-Year Persistence | Two-Year Persistence | |
| Grant receipt | 0.05** (0.02) | 0.06** (0.02) | 0.04 (0.03) |
| Control group mean | 0.76 | 0.68 | 0.62 |
| Student-term observations | 4,025 | 3,187 | 1,656 |
| R-squared | 0.06 | 0.09 | 0.09 |
| Baseline covariates | YES | YES | YES |
| Term fixed effects | YES | YES | YES |
| Institution fixed effects | YES | YES | YES |
Standard errors adjusted for clusters at the student level are in parentheses. *p<0.05, **p<0.01, ***p<0.001
Table 21. Treatment-on-the-Treated Effects of Grant Receipt on Graduation Outcomes: Female Associate Degree-Seeking Students
| One-Year Graduation | Two-Year Graduation | |
| Grant receipt | 0.02 (0.02) | -0.01 (0.02) |
| Control group mean | 0.23 | 0.34 |
| Student-term observations | 3,310 | 1,798 |
| R-squared | 0.18 | 0.23 |
| Baseline covariates | YES | YES |
| Term fixed effects | YES | YES |
| Institution fixed effects | YES | YES |
Standard errors adjusted for clusters at the student level are in parentheses. *p<0.05, **p<0.01, ***p<0.001
Table 22. Treatment-on-the-Treated Effects of Grant Receipt on Persistence Outcomes: Adult Associate Degree-Seeking Students
| Next-Term Persistence | One-Year Persistence | Two-Year Persistence | |
| Grant receipt | 0.01 (0.02) | 0.04 (0.02) | -0.00 (0.03) |
| Control group mean | 0.78 | 0.70 | 0.66 |
| Student-term observations | 3,257 | 2,560 | 1,310 |
| R-squared | 0.06 | 0.08 | 0.10 |
| Baseline covariates | YES | YES | YES |
| Term fixed effects | YES | YES | YES |
| Institution fixed effects | YES | YES | YES |
Standard errors adjusted for clusters at the student level are in parentheses. *p<0.05, **p<0.01, ***p<0.001
Table 23. Treatment-on-the-Treated Effects of Grant Receipt on Graduation Outcomes: Adult Associate Degree-Seeking Students
| One-Year Graduation | Two-Year Graduation | |
| Grant receipt | 0.01 (0.02) | -0.01 (0.03) |
| Control group mean | 0.26 | 0.37 |
| Student-term observations | 2,665 | 1,428 |
| R-squared | 0.17 | 0.23 |
| Baseline covariates | YES | YES |
| Term fixed effects | YES | YES |
| Institution fixed effects | YES | YES |
Standard errors adjusted for clusters at the student level are in parentheses. *p<0.05, **p<0.01, ***p<0.001
Table 24. Treatment-on-the-Treated Effects of Grant Receipt on Persistence Outcomes: First-Year Associate Degree-Seeking Students
| Next-Term Persistence | One-Year Persistence | Two-Year Persistence | |
| Grant receipt | 0.05* (0.02) | 0.09** (0.03) | 0.04 (0.04) |
| Control group mean | 0.72 | 0.58 | 0.50 |
| Student-term observations | 1,842 | 1,473 | 761 |
| R-squared | 0.08 | 0.09 | 0.10 |
| Baseline covariates | YES | YES | YES |
| Term fixed effects | YES | YES | YES |
| Institution fixed effects | YES | YES | YES |
Standard errors adjusted for clusters at the student level are in parentheses. *p<0.05, **p<0.01, ***p<0.001
Table 25. Treatment-on-the-Treated Effects of Grant Receipt on Graduation Outcomes: First-Year Associate Degree-Seeking Students
| One-Year Graduation | Two-Year Graduation | |
| Grant receipt | -0.00 (0.01) | -0.02 (0.03) |
| Control group mean | 0.03 | 0.19 |
| Student-term observations | 1,532 | 849 |
| R-squared | 0.05 | 0.14 |
| Baseline covariates | YES | YES |
| Term fixed effects | YES | YES |
| Institution fixed effects | YES | YES |
Standard errors adjusted for clusters at the student level are in parentheses. *p<0.05, **p<0.01, ***p<0.001
Table 26. Treatment-on-the-Treated Effects of Grant Receipt on Persistence Outcomes: Sophomore Associate Degree-Seeking Students
| Next-Term Persistence | One-Year Persistence | Two-Year Persistence | |
| Grant receipt | 0.02 (0.02) | 0.02 (0.02) | -0.01 (0.03) |
| Control group mean | 0.78 | 0.71 | 0.69 |
| Student-term observations | 3,731 | 2,975 | 1,565 |
| R-squared | 0.05 | 0.08 | 0.09 |
| Baseline covariates | YES | YES | YES |
| Term fixed effects | YES | YES | YES |
| Institution fixed effects | YES | YES | YES |
Standard errors adjusted for clusters at the student level are in parentheses. *p<0.05, **p<0.01, ***p<0.001
Table 27. Treatment-on-the-Treated Effects of Grant Receipt on Graduation Outcomes: Sophomore Associate Degree-Seeking Students
| One-Year Graduation | Two-Year Graduation | |
| Grant receipt | 0.04* (0.02) | 0.03 (0.03) |
| Control group mean | 0.33 | 0.41 |
| Student-term observations | 3,075 | 1,678 |
| R-squared | 0.16 | 0.25 |
| Baseline covariates | YES | YES |
| Term fixed effects | YES | YES |
| Institution fixed effects | YES | YES |
Standard errors adjusted for clusters at the student level are in parentheses. *p<0.05, **p<0.01, ***p<0.001
Table 28. Treatment-on-the-Treated Effects of Grant Receipt on Persistence Outcomes: Associate Degree-Seeking Students, Alternative Treatment Definition[50]
| Next-Term Persistence | One-Year Persistence | Two-Year Persistence | |
| Grant receipt | 0.05** (0.01) | 0.05** (0.02) | 0.02 (0.03) |
| Control group mean | 0.71 | 0.62 | 0.58 |
| Student-term observations | 5,573 | 4,448 | 2,327 |
| R-squared | 0.06 | 0.08 | 0.09 |
| Baseline covariates | YES | YES | YES |
| Term fixed effects | YES | YES | YES |
| Institution fixed effects | YES | YES | YES |
Standard errors adjusted for clusters at the student level are in parentheses. *p<0.05, **p<0.01, ***p<0.001
Table 29. Treatment-on-the-Treated Effects of Grant Receipt on Graduation Outcomes: Associate Degree-Seeking Students, Alternative Treatment Definition[51]
| One-Year Graduation | Two-Year Graduation | |
| Grant receipt | 0.01 (0.02) | 0.01 (0.03) |
| Control group mean | 0.18 | 0.29 |
| Student-term observations | 4,607 | 2,528 |
| R-squared | 0.18 | 0.22 |
| Baseline covariates | YES | YES |
| Term fixed effects | YES | YES |
| Institution fixed effects | YES | YES |
Standard errors adjusted for clusters at the student level are in parentheses. *p<0.05, **p<0.01, ***p<0.001
Table 30. Treatment-on-the-Treated Effects of Grant Receipt on Persistence Outcomes: Associate Degree-Seeking Students, Student Fixed Effects
| Next-Term Persistence | One-Year Persistence | Two-Year Persistence | |
| Grant receipt | 0.02 (0.02) | 0.04* (0.02) | 0.00 (0.02) |
| Control group mean | 0.76 | 0.67 | 0.62 |
| Student-term observations | 4,407 | 3,371 | 1,547 |
| R-squared | 0.22 | 0.51 | 0.84 |
| Baseline covariates | YES | YES | YES |
| Term fixed effects | YES | YES | YES |
| Institution fixed effects | YES | YES | YES |
| Student fixed effects | YES | YES | YES |
Standard errors adjusted for clusters at the student level are in parentheses. *p<0.05, **p<0.01, ***p<0.001
Table 31. Treatment-on-the-Treated Effects of Award Amount on Persistence Outcomes: Associate Degree-Seeking Students[52]
| Next-Term Persistence | One-Year Persistence | Two-Year Persistence | |
| Award amount | -0.00 (0.00) | -0.00 (0.00) | 0.00 (0.00) |
| Student-term observations | 1,677 | 1,503 | 924 |
| R-squared | 0.05 | 0.07 | 0.06 |
| Baseline covariates | YES | YES | YES |
| Term fixed effects | YES | YES | YES |
| Institution fixed effects | YES | YES | YES |
Standard errors adjusted for clusters at the student level are in parentheses. *p<0.05, **p<0.01, ***p<0.001
Table 32. Treatment-on-the-Treated Effects of Award Amount on Graduation Outcomes: Associate Degree-Seeking Students[53]
| One-Year Graduation | Two-Year Graduation | |
| Award amount | -0.00 (0.00) | -0.00 (0.00) |
| Student-term observations | 1,526 | 984 |
| R-squared | 0.16 | 0.21 |
| Baseline covariates | YES | YES |
| Term fixed effects | YES | YES |
| Institution fixed effects | YES | YES |
Standard errors adjusted for clusters at the student level are in parentheses. *p<0.05, **p<0.01, ***p<0.001
Table 33. Treatment-on-the-Treated Effects of Unmet Request Amount on Persistence Outcomes: Associate Degree-Seeking Students[54]
| Next-Term Persistence | One-Year Persistence | Two-Year Persistence | |
| Unmet request amount | 0.00 (0.00) | 0.00 (0.00) | -0.00 (0.00) |
| Student-term observations | 1,677 | 1,503 | 924 |
| R-squared | 0.05 | 0.07 | 0.06 |
| Baseline covariates | YES | YES | YES |
| Term fixed effects | YES | YES | YES |
| Institution fixed effects | YES | YES | YES |
Standard errors adjusted for clusters at the student level are in parentheses. *p<0.05, **p<0.01, ***p<0.001
Table 34. Treatment-on-the-Treated Effects of Unmet Request Amount on Graduation Outcomes: Associate Degree-Seeking Students[55]
| One-Year Graduation | Two-Year Graduation | |
| Unmet request amount | 0.00 (0.00) | 0.00 (0.00) |
| Student-term observations | 1,526 | 984 |
| R-squared | 0.16 | 0.21 |
| Baseline covariates | YES | YES |
| Term fixed effects | YES | YES |
| Institution fixed effects | YES | YES |
Standard errors adjusted for clusters at the student level are in parentheses. *p<0.05, **p<0.01, ***p<0.001
Table 35. Treatment-on-the-Treated Effects of Grant Receipt on Persistence Outcomes: Bachelor’s Degree-Seeking Students
| Next-Term Persistence | One-Year Persistence | Two-Year Persistence | |
| Grant receipt | 0.03** (0.01) | 0.03* (0.01) | 0.02 (0.01) |
| Control group mean | 0.80 | 0.70 | 0.56 |
| Student-term observations | 15,375 | 12,101 | 5,547 |
| R-squared | 0.08 | 0.12 | 0.22 |
| Baseline covariates | YES | YES | YES |
| Term fixed effects | YES | YES | YES |
| Institution fixed effects | YES | YES | YES |
Standard errors adjusted for clusters at the student level are in parentheses. *p<0.05, **p<0.01, ***p<0.001
Table 36. Treatment-on-the-Treated Effects of Grant Receipt on Graduation Outcomes: Bachelor’s Degree-Seeking Students
| One-Year Graduation | Two-Year Graduation | |
| Grant receipt | -0.01 (0.01) | 0.01 (0.01) |
| Control group mean | 0.21 | 0.32 |
| Student-term observations | 12,492 | 6,235 |
| R-squared | 0.24 | 0.25 |
| Baseline covariates | YES | YES |
| Term fixed effects | YES | YES |
| Institution fixed effects | YES | YES |
Standard errors adjusted for clusters at the student level are in parentheses. *p<0.05, **p<0.01, ***p<0.001
Table 37. Treatment-on-the-Treated Effects of Grant Receipt on Persistence Outcomes: Hispanic or Latino Bachelor’s Degree-Seeking Students
| Next-Term Persistence | One-Year Persistence | Two-Year Persistence | |
| Grant receipt | 0.04** (0.01) | 0.04* (0.02) | 0.01 (0.03) |
| Control group mean | 0.79 | 0.68 | 0.53 |
| Student-term observations | 5,010 | 3,872 | 1,677 |
| R-squared | 0.07 | 0.10 | 0.18 |
| Baseline covariates | YES | YES | YES |
| Term fixed effects | YES | YES | YES |
| Institution fixed effects | YES | YES | YES |
Standard errors adjusted for clusters at the student level are in parentheses. *p<0.05, **p<0.01, ***p<0.001
Table 38. Treatment-on-the-Treated Effects of Grant Receipt on Graduation Outcomes: Hispanic or Latino Bachelor’s Degree-Seeking Students
| One-Year Graduation | Two-Year Graduation | |
| Grant receipt | -0.02 (0.02) | -0.02 (0.02) |
| Control group mean | 0.21 | 0.32 |
| Student-term observations | 4,010 | 1,907 |
| R-squared | 0.24 | 0.23 |
| Baseline covariates | YES | YES |
| Term fixed effects | YES | YES |
| Institution fixed effects | YES | YES |
Standard errors adjusted for clusters at the student level are in parentheses. *p<0.05, **p<0.01, ***p<0.001
Table 39. Treatment-on-the-Treated Effects of Grant Receipt on Persistence Outcomes: Black or African American Bachelor’s Degree-Seeking Students
| Next-Term Persistence | One-Year Persistence | Two-Year Persistence | |
| Grant receipt | 0.03 (0.02) | 0.04* (0.02) | 0.04 (0.03) |
| Control group mean | 0.79 | 0.68 | 0.53 |
| Student-term observations | 5,240 | 4,152 | 1,910 |
| R-squared | 0.09 | 0.12 | 0.24 |
| Baseline covariates | YES | YES | YES |
| Term fixed effects | YES | YES | YES |
| Institution fixed effects | YES | YES | YES |
Standard errors adjusted for clusters at the student level are in parentheses. *p<0.05, **p<0.01, ***p<0.001
Table 40. Treatment-on-the-Treated Effects of Grant Receipt on Graduation Outcomes: Black or African American Bachelor’s Degree-Seeking Students
| One-Year Graduation | Two-Year Graduation | |
| Grant receipt | -0.00 (0.01) | 0.04 (0.02) |
| Control group mean | 0.20 | 0.29 |
| Student-term observations | 4,287 | 2,162 |
| R-squared | 0.25 | 0.27 |
| Baseline covariates | YES | YES |
| Term fixed effects | YES | YES |
| Institution fixed effects | YES | YES |
Standard errors adjusted for clusters at the student level are in parentheses. *p<0.05, **p<0.01, ***p<0.001
Table 41. Treatment-on-the-Treated Effects of Grant Receipt on Persistence Outcomes: Male Bachelor’s Degree-Seeking Students
| Next-Term Persistence | One-Year Persistence | Two-Year Persistence | |
| Grant receipt | 0.05** (0.02) | 0.04* (0.02) | 0.01 (0.03) |
| Control group mean | 0.80 | 0.70 | 0.56 |
| Student-term observations | 4,450 | 3,523 | 1,609 |
| R-squared | 0.08 | 0.14 | 0.24 |
| Baseline covariates | YES | YES | YES |
| Term fixed effects | YES | YES | YES |
| Institution fixed effects | YES | YES | YES |
Standard errors adjusted for clusters at the student level are in parentheses. *p<0.05, **p<0.01, ***p<0.001
Table 42. Treatment-on-the-Treated Effects of Grant Receipt on Graduation Outcomes: Male Bachelor’s Degree-Seeking Students
| One-Year Graduation | Two-Year Graduation | |
| Grant receipt | -0.01 (0.02) | 0.00 (0.03) |
| Control group mean | 0.18 | 0.29 |
| Student-term observations | 3,634 | 1,763 |
| R-squared | 0.23 | 0.25 |
| Baseline covariates | YES | YES |
| Term fixed effects | YES | YES |
| Institution fixed effects | YES | YES |
Standard errors adjusted for clusters at the student level are in parentheses. *p<0.05, **p<0.01, ***p<0.001
Table 43. Treatment-on-the-Treated Effects of Grant Receipt on Persistence Outcomes: Female Bachelor’s Degree-Seeking Students
| Next-Term Persistence | One-Year Persistence | Two-Year Persistence | |
| Grant receipt | 0.03* (0.01) | 0.02 (0.01) | 0.02 (0.02) |
| Control group mean | 0.80 | 0.70 | 0.56 |
| Student-term observations | 10,482 | 8,235 | 3,771 |
| R-squared | 0.08 | 0.11 | 0.22 |
| Baseline covariates | YES | YES | YES |
| Term fixed effects | YES | YES | YES |
| Institution fixed effects | YES | YES | YES |
Standard errors adjusted for clusters at the student level are in parentheses. *p<0.05, **p<0.01, ***p<0.001
Table 44. Treatment-on-the-Treated Effects of Grant Receipt on Graduation Outcomes: Female Bachelor’s Degree-Seeking Students
| One-Year Graduation | Two-Year Graduation | |
| Grant receipt | -0.00 (0.01) | 0.01 (0.02) |
| Control group mean | 0.22 | 0.33 |
| Student-term observations | 8,504 | 4,278 |
| R-squared | 0.25 | 0.26 |
| Baseline covariates | YES | YES |
| Term fixed effects | YES | YES |
| Institution fixed effects | YES | YES |
Standard errors adjusted for clusters at the student level are in parentheses. *p<0.05, **p<0.01, ***p<0.001
Table 45. Treatment-on-the-Treated Effects of Grant Receipt on Persistence Outcomes: Adult Bachelor’s Degree-Seeking Students
| Next-Term Persistence | One-Year Persistence | Two-Year Persistence | |
| Grant receipt | 0.02 (0.01) | 0.04* (0.02) | 0.01 (0.02) |
| Control group mean | 0.76 | 0.64 | 0.48 |
| Student-term observations | 6,481 | 5,019 | 2,213 |
| R-squared | 0.07 | 0.12 | 0.22 |
| Baseline covariates | YES | YES | YES |
| Term fixed effects | YES | YES | YES |
| Institution fixed effects | YES | YES | YES |
Standard errors adjusted for clusters at the student level are in parentheses. *p<0.05, **p<0.01, ***p<0.001
Table 46. Treatment-on-the-Treated Effects of Grant Receipt on Graduation Outcomes: Adult Bachelor’s Degree-Seeking Students
| One-Year Graduation | Two-Year Graduation | |
| Grant receipt | -0.02 (0.01) | 0.00 (0.02) |
| Control group mean | 0.23 | 0.32 |
| Student-term observations | 5,199 | 2,536 |
| R-squared | 0.21 | 0.25 |
| Baseline covariates | YES | YES |
| Term fixed effects | YES | YES |
| Institution fixed effects | YES | YES |
Standard errors adjusted for clusters at the student level are in parentheses. *p<0.05, **p<0.01, ***p<0.001
Table 47. Treatment-on-the-Treated Effects of Grant Receipt on Persistence Outcomes: First-Year Bachelor’s Degree-Seeking Students
| Next-Term Persistence | One-Year Persistence | Two-Year Persistence | |
| Grant receipt | 0.09** (0.03) | 0.03 (0.04) | 0.00 (0.05) |
| Control group mean | 0.76 | 0.72 | 0.65 |
| Student-term observations | 1,024 | 828 | 397 |
| R-squared | 0.09 | 0.12 | 0.15 |
| Baseline covariates | YES | YES | YES |
| Term fixed effects | YES | YES | YES |
| Institution fixed effects | YES | YES | YES |
Standard errors adjusted for clusters at the student level are in parentheses. *p<0.05, **p<0.01, ***p<0.001
Table 48. Treatment-on-the-Treated Effects of Grant Receipt on Persistence Outcomes: Sophomore Bachelor’s Degree-Seeking Students
| Next-Term Persistence | One-Year Persistence | Two-Year Persistence | |
| Grant receipt | -0.02 (0.02) | 0.01 (0.03) | 0.02 (0.04) |
| Control group mean | 0.86 | 0.79 | 0.70 |
| Student-term observations | 2,091 | 1,657 | 805 |
| R-squared | 0.06 | 0.10 | 0.12 |
| Baseline covariates | YES | YES | YES |
| Term fixed effects | YES | YES | YES |
| Institution fixed effects | YES | YES | YES |
Standard errors adjusted for clusters at the student level are in parentheses. *p<0.05, **p<0.01, ***p<0.001
Table 49. Treatment-on-the-Treated Effects of Grant Receipt on Persistence Outcomes: Junior Bachelor’s Degree-Seeking Students
| Next-Term Persistence | One-Year Persistence | Two-Year Persistence | |
| Grant receipt | 0.03* (0.01) | 0.04* (0.02) | 0.01 (0.03) |
| Control group mean | 0.86 | 0.76 | 0.59 |
| Student-term observations | 5,026 | 3,919 | 1,763 |
| R-squared | 0.07 | 0.07 | 0.15 |
| Baseline covariates | YES | YES | YES |
| Term fixed effects | YES | YES | YES |
| Institution fixed effects | YES | YES | YES |
Standard errors adjusted for clusters at the student level are in parentheses. *p<0.05, **p<0.01, ***p<0.001
Table 50. Treatment-on-the-Treated Effects of Grant Receipt on Graduation Outcomes: Junior Bachelor’s Degree-Seeking Students
| One-Year Graduation | Two-Year Graduation | |
| Grant receipt | -0.01 (0.01) | 0.03 (0.03) |
| Control group mean | 0.07 | 0.33 |
| Student-term observations | 4,055 | 1,982 |
| R-squared | 0.10 | 0.14 |
| Baseline covariates | YES | YES |
| Term fixed effects | YES | YES |
| Institution fixed effects | YES | YES |
Standard errors adjusted for clusters at the student level are in parentheses. *p<0.05, **p<0.01, ***p<0.001
Table 51. Treatment-on-the-Treated Effects of Grant Receipt on Persistence Outcomes: Senior Bachelor’s Degree-Seeking Students
| Next-Term Persistence | One-Year Persistence | Two-Year Persistence | |
| Grant receipt | 0.04** (0.01) | 0.04* (0.02) | 0.03 (0.02) |
| Control group mean | 0.75 | 0.63 | 0.49 |
| Student-term observations | 7,229 | 5,691 | 2,581 |
| R-squared | 0.11 | 0.22 | 0.39 |
| Baseline covariates | YES | YES | YES |
| Term fixed effects | YES | YES | YES |
| Institution fixed effects | YES | YES | YES |
Standard errors adjusted for clusters at the student level are in parentheses. *p<0.05, **p<0.01, ***p<0.001
Table 52. Treatment-on-the-Treated Effects of Grant Receipt on Graduation Outcomes: Senior Bachelor’s Degree-Seeking Students
| One-Year Graduation | Two-Year Graduation | |
| Grant receipt | 0.01 (0.02) | 0.01 (0.02) |
| Control group mean | 0.40 | 0.44 |
| Student-term observations | 5,885 | 2,938 |
| R-squared | 0.20 | 0.38 |
| Baseline covariates | YES | YES |
| Term fixed effects | YES | YES |
| Institution fixed effects | YES | YES |
Standard errors adjusted for clusters at the student level are in parentheses. *p<0.05, **p<0.01, ***p<0.001
Table 53. Treatment-on-the-Treated Effects of Grant Receipt on Persistence Outcomes: Bachelor’s Degree-Seeking Students, Alternative Treatment Definition[56]
| Next-Term Persistence | One-Year Persistence | Two-Year Persistence | |
| Grant receipt | 0.02** (0.01) | 0.02 (0.01) | 0.01 (0.02) |
| Control group mean | 0.78 | 0.67 | 0.51 |
| Student-term observations | 15,375 | 12,101 | 5,547 |
| R-squared | 0.08 | 0.12 | 0.22 |
| Baseline covariates | YES | YES | YES |
| Term fixed effects | YES | YES | YES |
| Institution fixed effects | YES | YES | YES |
Standard errors adjusted for clusters at the student level are in parentheses. *p<0.05, **p<0.01, ***p<0.001
Table 54. Treatment-on-the-Treated Effects of Grant Receipt on Graduation Outcomes: Bachelor’s Degree-Seeking Students, Alternative Treatment Definition[57]
| One-Year Graduation | Two-Year Graduation | |
| Grant receipt | 0.00 (0.01) | 0.01 (0.02) |
| Control group mean | 0.17 | 0.26 |
| Student-term observations | 12,492 | 6,235 |
| R-squared | 0.24 | 0.25 |
| Baseline covariates | YES | YES |
| Term fixed effects | YES | YES |
| Institution fixed effects | YES | YES |
Standard errors adjusted for clusters at the student level are in parentheses. *p<0.05, **p<0.01, ***p<0.001
Table 55. Treatment-on-the-Treated Effects of Grant Receipt on Persistence Outcomes: Bachelor’s Degree-Seeking Students, Student Fixed Effects
| Next-Term Persistence | One-Year Persistence | Two-Year Persistence | |
| Grant receipt | 0.02* (0.01) | -0.01 (0.01) | -0.01 (0.01) |
| Control group mean | 0.80 | 0.70 | 0.56 |
| Student-term observations | 13,235 | 10,009 | 3,845 |
| R-squared | 0.23 | 0.58 | 0.86 |
| Baseline covariates | YES | YES | YES |
| Term fixed effects | YES | YES | YES |
| Institution fixed effects | YES | YES | YES |
| Student fixed effects | YES | YES | YES |
Standard errors adjusted for clusters at the student level are in parentheses. *p<0.05, **p<0.01, ***p<0.001
Table 56. Treatment-on-the-Treated Effects of Award Amount on Persistence Outcomes: Bachelor’s Degree-Seeking Students[58]
| Next-Term Persistence | One-Year Persistence | Two-Year Persistence | |
| Award amount | -0.00 (0.00) | -0.00 (0.00) | -0.00 (0.00) |
| Student-term observations | 2,254 | 1,885 | 1,104 |
| R-squared | 0.06 | 0.11 | 0.21 |
| Baseline covariates | YES | YES | YES |
| Term fixed effects | YES | YES | YES |
| Institution fixed effects | YES | YES | YES |
Standard errors adjusted for clusters at the student level are in parentheses. *p<0.05, **p<0.01, ***p<0.001
Table 57. Treatment-on-the-Treated Effects of Award Amount on Graduation Outcomes: Bachelor’s Degree-Seeking Students[59]
| One-Year Graduation | Two-Year Graduation | |
| Award amount | -0.00 (0.00) | 0.00 (0.00) |
| Student-term observations | 1,916 | 1,153 |
| R-squared | 0.25 | 0.29 |
| Baseline covariates | YES | YES |
| Term fixed effects | YES | YES |
| Institution fixed effects | YES | YES |
Standard errors adjusted for clusters at the student level are in parentheses. *p<0.05, **p<0.01, ***p<0.001
Table 58. Treatment-on-the-Treated Effects of Unmet Request Amount on Persistence Outcomes: Bachelor’s Degree-Seeking Students[60]
| Next-Term Persistence | One-Year Persistence | Two-Year Persistence | |
| Unmet request amount | 0.00 (0.00) | 0.00 (0.00) | 0.00 (0.00) |
| Student-term observations | 2,254 | 1,885 | 1,104 |
| R-squared | 0.06 | 0.11 | 0.21 |
| Baseline covariates | YES | YES | YES |
| Term fixed effects | YES | YES | YES |
| Institution fixed effects | YES | YES | YES |
Standard errors adjusted for clusters at the student level are in parentheses. *p<0.05, **p<0.01, ***p<0.001
Table 59. Treatment-on-the-Treated Effects of Unmet Request Amount on Graduation Outcomes: Bachelor’s Degree-Seeking Students[61]
| One-Year Graduation | Two-Year Graduation | |
| Unmet request amount | 0.00 (0.00) | -0.00 (0.00) |
| Student-term observations | 1,916 | 1,153 |
| R-squared | 0.25 | 0.29 |
| Baseline covariates | YES | YES |
| Term fixed effects | YES | YES |
| Institution fixed effects | YES | YES |
Standard errors adjusted for clusters at the student level are in parentheses. *p<0.05, **p<0.01, ***p<0.001
Endnotes
- “Economic and Workforce Development, College Affordability, Top Policy Priorities for 2026,” State Higher Education Executive Officers Association (SHEEO), January 13, 2026, https://sheeo.org/economic-and-workforce-development-college-affordability-top-policy-priorities-for-2026/. ↑
- Stephanie Marken, “Just 12% of Americans Say Four-Year Colleges Are Affordable,” Gallup, July 21, 2026, https://news.gallup.com/poll/712748/americans-say-four-year-colleges-affordable.aspx. Ratings for two-year colleges were more positive, with only 25 percent saying that they were doing a poor job on providing an affordable education. ↑
- Kathryn J. Blanchard and James Dean Ward, “The Price Transparency Imperative: Rebuilding Confidence in Higher Education,” Strada Education Foundation, 2026, https://cdn.prod.website-files.com/6777c52f82e5471a3732ea25/69f4dd4324725f93711b6f8f_Strada_ThePriceTransparencyImperative_Report_Apr.2026.pdf. ↑
- Jennifer Ma, Matea Pender, and Xiaowen Hu, “Trends in College Pricing and Student Aid 2025,” College Board, November 2025, https://research.collegeboard.org/media/pdf/Trends-in-College-Pricing-and-Student-Aid-2025-final_1.pdf. ↑
- Julie Ajinkya and Brenae Smith, “Emergency Aid, Enduring Impact: Strengthening Families, Communities, and the Economy through Support for Student Parents,” HCM Strategists, June 2025, https://hcmstrategists.com/s/HCM-Executive-Summary_final062025.pdf. ↑
- Muhammad Kara, “The Safety Net Is Gone: More Emergency Aid Programs, but Fewer Students Reached,” The Hope Center for Student Basic Needs, July 16, 2026, https://hope.temple.edu/newsroom/hope-blog/safety-net-gone-more-emergency-aid-programs-fewer-students-reached. ↑
- See, for example, Jacob Lockwood and Douglas Webber, “Non-Completion, Student Debt, and Financial Well-Being: Evidence from the Survey of Household Economics and Decisionmaking,” FEDS Notes, Board of Governors of the Federal Reserve System, August 21, 2023, https://doi.org/10.17016/2380-7172.3371; “Students at Greatest Risk of Loan Default,” The Institute for College Access & Success, April 2018, https://ticas.org/files/pub_files/students_at_the_greatest_risk_of_default.pdf; and Wesley Whistle, “Ripple Effect: The Cost of the College Dropout Rate,” Third Way, January 28, 2019, https://www.thirdway.org/report/ripple-effect-the-cost-of-the-college-dropout-rate. ↑
- Daniel Rossman, Julia Karon, and Rayane Alamuddin, “The Impacts of Emergency Micro-Grants on Student Success: Evaluation Study of Georgia State University’s Panther Retention Grant Program,” Ithaka S+R, March 31, 2022, https://doi.org/10.18665/sr.316611. ↑
- Julia Schmidt and Evan Weissman, “Strengthening Emergency Aid Programs: Lessons from the CARES Act and the Higher Education Emergency Relief Fund,” MDRC, July 2021), https://www.mdrc.org/sites/default/files/CARES_Act_Brief.pdf. ↑
- Julia Schmalz and Katherine Mangan, “A Culture of Caring: Amarillo College’s ‘No Excuses’ Program for Low-Income Students Has Made It a National Model,” The Chronicle of Higher Education, April 3, 2019, https://www.chronicle.com/article/a-culture-of-caring. ↑
- Daniel Rossman, Julia Karon, and Rayane Alamuddin, “The Impacts of Emergency Micro-Grants on Student Success: Evaluation Study of Georgia State University’s Panther Retention Grant Program,” Ithaka S+R, March 31, 2022, https://doi.org/10.18665/sr.316611. ↑
- Will Carroll and Brenae Smith, “State Strategies for Scaling Emergency Aid: Insights from a Florida Landscape Analysis,” HCM Strategists, January 2026, https://static1.squarespace.com/static/62bdd1bbd6b48a2f0f75d310/t/69603073c566980deb26ee38/1767911539417/State+Strategies+for+Scaling+Emergency+Aid_Florida+Final012026_web.pdf. ↑
- “Student Emergency Assistance Grants (SEAG) Program Information for College Staff,” Washington State Board for Community and Technical Colleges, accessed July 8, 2026, https://www.sbctc.edu/colleges-staff/programs-services/student-services/seag/. ↑
- “Finish Line Grants,” North Carolina Community College System, accessed July 8, 2026, https://www.nccommunitycolleges.edu/students/paying-for-college/options-for-paying-for-college/finish-line-grants/. ↑
- “Emergency Assistance for Postsecondary Students (EAPS) Grant,” Minnesota Office of Higher Education, accessed July 8, 2026, https://ohe.mn.gov/competitive-grants/emergency-assistance-postsecondary-students-eaps-grant. ↑
- Robert Anderson, “Emergency Aid at Scale: State Efforts to Support Student Parents,” HCM Strategists, June 2025, https://static1.squarespace.com/static/62bdd1bbd6b48a2f0f75d310/t/684778aa8634062072b43e15/1749514411374/Emergency+Aid+at+Scale+State+Efforts+to+Support+Student+Parents_final062025_web.pdf. ↑
- Sandra Perez, “Tracking the Reach of Emergency Relief Funds During the Pandemic,” EdTrust, April 2025, https://edtrust.org/wp-content/uploads/2025/04/HEERF-Quant-Analysis-V4.pdf. ↑
- Perez, “Tracking the Reach of Emergency Relief Funds.” ↑
- Underrepresented racial and ethnic minority groups were defined using IPEDS reporting categories and included Black or African American, Hispanic, Native Hawaiian or Other Pacific Islander, or American Indian or Alaska Native students. ↑
- Sara Goldrick-Rab et al., “Affording Degree Completion: An Experimental Study of Completion Grants at Accessible Public Universities,” Finance and Economics Discussion Series 2023-047, Board of Governors of the Federal Reserve System, July 2023, https://doi.org/10.17016/FEDS.2023.047. ↑
- William N. Evans et al., “Increasing Community College Completion Rates among Low-Income Students: Evidence from a Randomized Controlled Trial Evaluation of a Case Management Intervention,’ NBER Working Paper No. 24150, National Bureau of Economic Research, December 2017, https://www.nber.org/system/files/working_papers/w24150/w24150.pdf. Students who received comprehensive case management were paired with a trained social worker, called a navigator, who offered coaching, mentoring, and referral services designed to help them overcome common barriers to college completion. ↑
- A replication RCT conducted at two Tarrant County College campuses found no statistically significant differences in enrollment or completion rates between treatment group students offered emergency aid and comprehensive case management and control group students with access to business-as-usual services. However, the researchers noted that these results should not be interpreted as contradicting the initial study because of key differences in sample composition and graduation rates across the two studies. James X. Sullivan and Sarah Kroger, “Stay the Course: Evaluating an Intervention to Promote Community College Persistence and Graduation Rates–Extension Study,” Wilson Sheehan Lab for Economic Opportunities, January 29, 2021, https://osf.io/phz2b/files/2kmjz. ↑
- Alaina DeSalvo, “Emergency Assistance for Postsecondary Students Grant Program Report,” Minnesota Office of Higher Education, April 15, 2020, https://ohe.mn.gov/sites/default/files/pdf/Preliminary_EAPS_2020_Legislative_Report.pdf. ↑
- Washington State Board for Community and Technical Colleges, “Report to the Legislature: 2SHB 1893, Student Emergency Assistance Grant (SEAG),” Washington State Board for Community and Technical Colleges, December 2025, https://app.leg.wa.gov/ReportsToTheLegislature/Home/GetPDF?fileName=2025+Legislative+Report+-+SEAG_55b7525a-801a-45b6-a0d7-5dc412d7d1b8.pdf. ↑
- Some records may not have been included in the data we collected because of inconsistent reporting practices across institutions. As a result, this table may underestimate the number of awards and funds distributed since the 2021-22 academic year. ↑
- In this analysis, we define an academic year as beginning in the fall term and concluding with the summer term. ↑
- Data for the 2025-26 academic year includes the fall 2025 term only. ↑
- The baccalaureate colleges in the table are a mix of senior, comprehensive (award both associate and bachelor’s degrees), and graduate colleges. The counts in this table include student populations that are eventually excluded from our analyses, including graduate students. ↑
- For example, if term t is the fall 2021 term, we categorize students as having persisted if they graduated in the fall 2021 term or enrolled in the spring 2022 term. When term t is a spring term, we categorize students as having persisted if they enrolled in the subsequent fall term since the summer term is optional for most students. We coded the final term of data as missing because the dataset does not extend far enough to observe whether the outcome occurred. ↑
- For example, if term t is the fall 2021 term, we categorize students as having persisted if they graduated by the summer 2022 term or enrolled in the fall 2022 term. When term t is a summer term, we categorize students as having persisted if they enrolled in the second subsequent fall term (t+4) since the summer term is optional for most students. We coded the final three terms of data as missing because the dataset does not extend far enough to observe whether the outcome occurred. ↑
- For example, if term t is the fall 2021 term, we categorize students as having persisted if they graduated by the summer 2023 term or enrolled in the fall 2023 term. When term t is a summer term, we categorize students as having persisted if they enrolled in the third subsequent fall term (t+7) since the summer term is optional for most students. We coded the final six terms of data as missing because the dataset does not extend far enough to observe whether the outcome occurred. ↑
- For example, if term t is the fall 2021 term, we categorize students as having graduated if they did so by the summer 2022 term. We coded the final three terms of data as missing because the dataset does not extend far enough to observe whether the outcome occurred. ↑
- For example, if term t is the fall 2021 term, we categorize students as having graduated if they did so by the summer 2023 term. We coded the final six terms of data as missing because the dataset does not extend far enough to observe whether the outcome occurred. ↑
- “Evaluating Academic and Economic Effects of CUNY’s Accelerated Study in Associate Programs (ASAP) and Its Replications,” MDRC, accessed August 25, 2026, https://www.mdrc.org/work/projects/evaluating-academic-and-economic-effects-cunys-accelerated-study-associate-programs. ↑
- The amount requested was coded as $0 for students who did not apply for a grant in the given term. ↑
- National Center for Education Statistics, “Graduation and Retention Rates: What Is the Graduation Rate Within 150% of Normal Time at 2-Year Postsecondary Institutions?” IPEDS Trend Generator, accessed June 18, 2026, https://nces.ed.gov/ipeds/TrendGenerator/app/build-table/7/21?rid=1&cid=50; National Center for Education Statistics, “Graduation and Retention Rates: What Is the Graduation Rate within 150% of Normal Time at 4-Year Postsecondary Institutions?” IPEDS Trend Generator, accessed June 18, 2026, https://nces.ed.gov/ipeds/TrendGenerator/app/trend-table/7/19?trending=column&rid=49. ↑
- “Enrollment,” Student Data Book, The City University of New York, accessed August 14, 2026, https://insights.cuny.edu/t/CUNYGuest/views/StudentDataBook/Enrollment. ↑
- Adela Soliz, “Improving Community College Student Persistence and Degree Completion,” Policy Insights from the Behavioral and Brain Sciences 12, no. 2 (2025): 139–46, https://doi.org/10.1177/23727322251361761; Jennie E. Brand, Fabian R. Pfeffer, and Sara Goldrick-Rab, “The Community College Effect Revisited: The Importance of Attending to Heterogeneity and Complex Counterfactuals,” Sociological Science 1 (2014): 448–65, https://doi.org/10.15195/v1.a25. ↑
- Associate degree-seeking students were classified as either first-year students, defined as having earned fewer than 30 credits entering the given term, or sophomores, defined as having earned 30 or more credits entering the given term. ↑
- “Enrollment,” Student Data Book, The City University of New York, accessed August 14, 2026, https://insights.cuny.edu/t/CUNYGuest/views/StudentDataBook/Enrollment. Missing values for the CUNY student population in Tables 3 and 4 indicate that the data book does not report that information. ↑
- We follow IPEDS conventions for reporting race/ethnicity categories, except that we combined Asian and Native Hawaiian or other Pacific Islander students into a single category to align with how CUNY reports statistics on these students. In our analysis of outcomes, we report results by race/ethnicity for students who identify as Hispanic or Latino or as Black or African American because sample sizes for other groups are insufficient for most outcome measures. ↑
- Bachelor’s degree-seeking students were classified as first-year students if they had earned fewer than 30 credits entering the given term; sophomores, if they had earned 30 to fewer than 60 credits entering the given term; juniors, if they had earned 60 to fewer than 90 credits entering the given term; or seniors, if they had earned 90 or more credits entering the given term. The shares of recipients who are first-year students, sophomores, juniors, and seniors in Table 4 do not add up to one because of rounding. ↑
- “Enrollment,” Student Data Book, The City University of New York, accessed August 14, 2026, https://insights.cuny.edu/t/CUNYGuest/views/StudentDataBook/Enrollment. ↑
- We follow IPEDS conventions for reporting of race/ethnicity categories, except that we combined Asian and Native Hawaiian or other Pacific Islander students into a single category to align with how CUNY reports statistics on these students. In our analysis of outcomes, we report results by race/ethnicity for students who identify as Hispanic or Latino and Black or African American because sample sizes for other groups are insufficient for most outcome measures. ↑
- The mean unmet request amount is the difference between the mean request amount and mean award amount among grant recipients when both values are not missing. ↑
- To estimate the number of students represented by these percentage point differences here and in subsequent calculations, we multiplied each coefficient estimate by the number of students in the treatment group included in the corresponding regression model. For example, the regression examining the relationship between grant receipt and persistence to the next term included 2,423 treatment group students. Multiplying this number by the coefficient estimate of 0.0324557 yields nearly 79 students. ↑
- Miriam Porras, Madeline Joy Trimble, and Daniel Rossman, “Using Student Data to Tackle Attrition and Boost Student Success and Retention,” Ithaka S+R, August 6, 2024, https://sr.ithaka.org/blog/using-student-data-to-tackle-attrition-and-boost-student-success-and-retention/. ↑
- Kim Parker, “What’s Behind the Growing Gap between Men and Women in College Completion?” Pew Research Center, November 8, 2021, https://www.pewresearch.org/short-reads/2021/11/08/whats-behind-the-growing-gap-between-men-and-women-in-college-completion/. ↑
- The secondary indicator agreed with the primary indicator for 99 percent of applications classified as approved and 93 percent of those classified as rejected. ↑
- For this set of regression models, students entered the treatment group in the first term in which they received a grant and remained in the treatment group for all subsequent terms of enrollment. ↑
- For this set of regression models, students entered the treatment group in the first term in which they received a grant and remained in the treatment group for all subsequent terms of enrollment. ↑
- For this set of regression models, we used award amount, rather than grant receipt, as the primary independent variable. The sample was limited to students who received a grant only. ↑
- For this set of regression models, we used award amount, rather than grant receipt, as the primary independent variable. The sample was limited to students who received a grant only. ↑
- For this set of regression models, we used unmet request amount (i.e., the difference between the request amount and award amount), rather than grant receipt, as the primary independent variable. The sample was limited to students who received a grant only. ↑
- For this set of regression models, we used unmet request amount (i.e., the difference between the request amount and award amount), rather than grant receipt, as the primary independent variable. The sample was limited to students who received a grant only. ↑
- For this set of regression models, students entered the treatment group in the first term in which they received a grant and remained in the treatment group for all subsequent terms of enrollment. ↑
- For this set of regression models, students entered the treatment group in the first term in which they received a grant and remained in the treatment group for all subsequent terms of enrollment. ↑
- For this set of regression models, we used award amount, rather than grant receipt, as the primary independent variable. The sample was limited to students who received a grant only. ↑
- For this set of regression models, we used award amount, rather than grant receipt, as the primary independent variable. The sample was limited to students who received a grant only. ↑
- For this set of regression models, we used unmet request amount (i.e., the difference between the request amount and award amount), rather than grant receipt, as the primary independent variable. The sample was limited to students who received a grant only. ↑
- For this set of regression models, we used unmet request amount (i.e., the difference between the request amount and award amount), rather than grant receipt, as the primary independent variable. The sample was limited to students who received a grant only. ↑