Breaking Down Barriers
The Impact of State Authorization Reciprocity on Online Enrollment
Abstract
State authorization, or the approval by a given state for a college to operate within its jurisdiction, is an important part of the regulatory triad. The triad is the three-pronged oversight of higher education that includes the federal government, accrediting bodies, and state governments. State authorization has become more complicated with the rapid expansion of online education that is blurring state geographic boundaries. Colleges seeking to enroll students from numerous states in online programs must obtain authorization in each of those states. The National Council for State Authorization Reciprocity Agreements (NC-SARA) seeks to limit this burden on colleges and expand access to online education to students who may have limited postsecondary options. This study examines the relationship between NC-SARA participation and online enrollments. Using a difference-in-differences approach, we find that colleges joining NC-SARA experience growth in students enrolling in online courses, that early adopters experience larger growths in enrollments, and that enrollments increase over time. We do not find evidence that for-profit institutions, colleges with large pre-NC-SARA online enrollments, or colleges that are highly reliant on online education benefit more than others from joining the agreement.
Introduction
States play a unique and essential role in regulating colleges and universities, serving alongside the federal government and accrediting bodies in the higher education regulatory triad. States, rather than the federal government, have the legal authority to authorize which institutions operate within their jurisdictions and are responsible for oversight of those institutions.[1] In theory, states’ authorization helps assure their residents that the institutions operating within the state are legitimate and meet a minimum standard of quality. From the institution’s perspective, state authorization is necessary for their receipt of federal Title IV aid.
The rise in online postsecondary programs over the last decade created increasingly complicated administrative challenges to state authorization: Institutions that sought to enroll “out-of-state” students in their online programs needed to seek authorization from every state in which those students resided. Since online education is an essential mechanism for expanding postsecondary access and options, many experts argued that state authorization rules were an unnecessary burden for colleges that limited students’ educational options and had little regulatory benefit.[2]
To address these challenges, a group of higher education leaders—including state higher education executive officers, representatives from regional higher education compacts, and accreditors—with with funding from Lumina Foundation, formed the National Council for State Authorization Reciprocity Agreements (NC-SARA) in 2014. NC-SARA’s purpose is to streamline the state authorization process by creating a broad network of reciprocity agreements between states. Under these agreements, a participating college that seeks to serve students who reside in other states must obtain authorization only from its home state, rather than from every state where its students reside. Other states that opt into the network would then automatically grant authorization, and the college can then enroll students who reside in any participating state. As of 2021, 49 states (all but California), the District of Columbia (DC), Puerto Rico (PR), and the US Virgin Islands (USVI) have joined NC-SARA, thus expanding educational options for roughly, thus expanding educational options for nearly 90 percent of US residents.
The higher education community is still debating the value of NC-SARA, partly because no study has examined the impact of NC-SARA on student enrollment and outcomes, despite nearly every US state participating. In this study, we use a difference-in-differences approach to estimate the relationship between an institution’s NC-SARA participation and the number and composition of students enrolled in online coursework. We take advantage of the fact that the number of states participating in NC-SARA grew over time, and we examine whether the year of joining moderates the impact on online enrollments. We also explore whether enrollment varies by certain institutional characteristics, specifically for-profit status and the robustness of the institution’s online programs prior to its state’s NC-SARA membership.
We find evidence that states’ NC-SARA participation is associated with online enrollment increases at the colleges in participating states. The colleges in states that joined NC-SARA in its earliest years—2014 and 2015—experienced larger increases in online enrollments relative to institutions in states that joined from 2016 through 2018. We find no evidence that for-profit colleges enrollments increased in response to states’ NC-SARA participation more than not-for-profit colleges. There is some evidence that those institutions most reliant on online enrollments before they joined NC-SARA saw decreases in online enrollments after they joined NC-SARA.
Our study makes important contributions to the research literature on the relationship between NC-SARA participation and online enrollments. This relationship, however, is only one of the many important questions about the impact of NC-SARA. For instance, our study does not examine how NC-SARA participation influences individual students to participate in higher education or move between colleges. Knowing more about patterns in student behavior is essential to evaluating the impact of NC-SARA on students’ educational options and outcomes. Relatedly, as we suggest, future studies should examine the impact of reciprocity on students’ outcomes, such as completion, credential type, and employment.
This paper proceeds to provide contextualizing information regarding the growth and importance of online education, as well as the role NC-SARA plays in helping to expand online education and increase access for students with few postsecondary options. We then provide an overview of our approach to estimating the relationship between NC-SARA participation and online student enrollments. We present evidence of the effectiveness of NC-SARA at improving online educational access and explore the possibility of heterogeneous effects across institutional characteristics. Finally, we propose three avenues for future research to address student outcomes, institutional responses, and state policymaking. We also include a methodological appendix providing additional details regarding our data and analytic approach.
Background
Students’ postsecondary educational options are often limited to those institutions that offer in-person programs in close proximity to their home.[3] In fact, roughly 42% of incoming first-year students attend an institution within 50 miles of their home.[4] Rural students may only have a few institutions or academic programs from which to choose.[5] Urban students may live in closer proximity to a greater number of colleges, but for some, their prior academic preparation may mean those colleges are out of reach.[6] Moreover, adult learners with full-time jobs or children require flexibility that is not always available through local in-person options. Limited access to postsecondary options can inhibit students’ future success if the available options are low quality, especially for lower-income students and students of color.[7]
Online programs may expand educational options both for those students already planning to attend college and those who may not have otherwise attended college.[8] This potential is only increasing, as online enrollments have grown nearly twentyfold over the last decade and the COVID-19 pandemic has shifted many programs online.[9] Expanding access to postsecondary options by offering more online programs, however, does not necessarily mean the programs are high quality. Evidence suggests that online education may be effective in some contexts. For instance, bachelor’s-seeking students taking online courses within their major during the summer to augment their in-person coursework during the traditional academic year may persist at higher rates than their peers who do not take these courses.[10] Yet, in most contexts, the evidence suggests that underprepared students and those attending for-profit institutions may benefit the least from taking classes online.[11] In fact, students completing a credential at a mostly online for-profit earn $5,000 per year less than students graduating from a public college.[12] At community colleges, which are traditionally open-access institutions, students taking online courses appear to persist in these courses at lower rates and earn lower grades in the courses than students who enroll in in-person courses.[13] Additionally, employers appear to value online credentials less than those from traditionally offered programs.[14] As such, some scholars question whether the social returns of online education are worth the public or private investment by taxpayers or students.[15] The variation in outcomes across online education underscores the importance of states fulfilling their regulatory obligations, ensuring programs meet quality standards and protecting students from predatory institutions. Given the aforementioned limited access to face-to-face educational opportunities for historically underserved students, this oversight is particularly important for protecting those with few postsecondary options as the balance between access and quality is of paramount importance.
In an increasingly digital world, though, traditional approaches to state authorization can limit students’ educational options. Under a traditional approach to authorization, states served as the gatekeepers to the postsecondary educational market, so students could only enroll in online programs at institutions authorized to operate in their state. If a student who lived in state A, for instance, wanted to enroll in an online program based in state B, they could do so only if state A had authorized the online program to operate in state A. Because the state authorization process was complex and lengthy, seeking authorization in multiple states was cost prohibitive for most institutions and online programs.
In 2011, a collection of higher education leaders came together to remedy this issue. Over the next few years, they developed a common set of agreements that would standardize the authorization process for degree-granting institutions that offer distance-learning programs across multiple states. Their vision was that institutions in compliance with the common rules and regulations in one state could operate in another state without needing separate authorization. These efforts led to the National Council for State Authorization Reciprocity Agreements (NC-SARA), which officially launched in 2014. In just a few short years, 49 states, DC, PR, and USVI joined the NC-SARA network and nearly 2,000 institutions have sought and gained authorization through the reciprocity agreements. Students can now enroll in any of the online programs at these institutions, giving students more educational options and expanding the pool of prospective students for participating institutions.
The implementation of NC-SARA completely transformed the higher education regulatory framework and the landscape of online providers.[16] Yet, the higher education community remains divided on whether this transformation is good for students. Proponents of authorization reciprocity argue that making it easier to enroll students, regardless of where they reside, in online programs will expand access for students with few postsecondary options. Opponents argue that NC-SARA dilutes institutional quality by lowering the standard of quality to that of the participating state with the lowest standard. Many worry that for-profit colleges, which are often agile and opportunistic, may expand enrollments in response to NC-SARA more quickly than non-profit or public institutions, which could have a negative impact on student outcomes.[17]
To inform these debates, we need more evidence on the impact of reciprocity agreements on program quality, student access, and student outcomes. Much of the recent research on the states’ role in regulating higher education focuses on states’ oversight functions—accountability and consumer protection—rather than its authorization role, much less the implications of standardizing authorization through reciprocity. Our study is the first to examine these implications, and we describe our approach and findings in the section below.
Approach
Once a state joins SARA, eligible institutions within its jurisdiction can apply to participate. Institutions that join SARA can then recruit and enroll online students who live in other SARA-participating states, which dramatically expands their pool of prospective students. We hypothesize that institutions will take advantage of this expanded pool to increase their online enrollments. We expect that institutions with prior experience running online programs or that can rapidly adapt to expanding markets (e.g., for-profit colleges) will increase online enrollments the most. We also expect that institutions that joined SARA sooner rather than later will gain greater market share in the expanded pool of prospective applicants. As such, our hypothesis is that institutions that joined SARA in 2014 or 2015 will increase online enrollments more than institutions that joined SARA after 2015.
To assess the effect of NC-SARA participation on online enrollments, we employ a difference-in-differences (DiD) approach that exploits the staggered adoption of the reciprocity agreement beginning in 2014. Examining data from 2012 through 2018, we estimate the effect of SARA participation on two institution-level outcomes: the headcount of undergraduate students enrolled exclusively online and the headcount of undergraduate students enrolled in a mix of online and in-person classes. We specify several models, varying our approach based on the institution’s SARA status, the year the institution joined, and the institution’s characteristics. Specifically, we estimate the following models on both of the aforementioned outcome measures:
Main estimates
- Treatment on the treated (TOT): We estimate the effect of SARA participation on online enrollments for SARA-participating institutions that joined SARA once they were eligible (because their state joined). The control in this specification includes those institutions not participating in SARA, whether or not their state joined. This specification includes all years that institutions and states joined SARA during our examination period, 2014 through 2018.
- Intent to treat (ITT): We estimate the effect of SARA participation on online enrollments for all institutions in a SARA member state, whether or not the institutions joined SARA. The control in this specification includes those institutions in states that had not yet joined SARA, including California, which has still not become a member state. This specification includes all years that institutions and states joined SARA during our examination period, 2014 through 2018.
Main estimate variations
- Early adopters: We repeat the two specifications above but only for the “early adopters,” those institutions in states that joined SARA in 2014 or 2015. As described in more detail in the methodological appendix, later adopters may differ in important ways that reduce our confidence in the estimated effects. As such, we exclude institutions in states that joined NC-SARA in 2016, 2017, or 2018 from our early adopter analysis.
- Change-over-time: We repeat the two specifications above but allow the effects to vary over time. We interact the treatment with a yearly counter indicating the number of years an institution has been participating in SARA. This allows us to examine how the effect size changes the longer an institution has benefited from the expanded market of students.
Heterogeneous effects
- For-profit status: We repeat the TOT specification for early adopters and include a binary variable that indicates whether an institution is private for-profit. Given their past tactics, we expect these institutions will more rapidly adapt to the expanded pool of prospective students. We include an interaction term that identifies whether an institution’s for-profit status moderates the relationship between SARA participation and online enrollments.
- Online enrollment count and share: We expect that institutions will more rapidly adapt to the expanded pool of prospective students if they have high levels of online enrollments or if online enrollments comprise a relatively large share of their total enrollments. We repeat the TOT specification for early adopters and separately include two measures of the robustness of the institution’s online programs in 2013, one year prior to the establishment of SARA. In both cases, we include interaction terms that identify whether the institution’s capacity for online enrollment (separately, count and share) moderates the relationship between SARA participation and online enrollments. The two measures we separately include are:
- The number of students enrolled in online programs in 2013, and
- The share of total enrollment comprised by students enrolled in online programs in 2013.
To perform these analyses, we collected data on institutional characteristics—including the number of online students enrolled—from the Integrated Postsecondary Education Data System (IPEDS). NC-SARA provided data on the participating states and institutions and the year that they joined. Our full sample includes all for-profit, private nonprofit, and public colleges and universities that are eligible for Title IV federal funding in the 50 US states and the District of Columbia. We include two-year institutions, four-year institutions, and less-than-two year institutions. To be included in the sample, the institution must appear in all years of the data and have complete data across all outcomes and covariates. A balanced panel helps to minimize the noise in a model by eliminating the additional error term associated with missing data.[18] We describe our data and methods in more detail in the methodological appendix at the end of this paper.
Table 1: The Number of States and Institutions Participating in NC-SARA by Year
| 2014 | 2015 | 2016 | 2017 | 2018 | |
| Number of Institutions | 16 | 294 | 861 | 1,418 | 1,656 |
| Number of States | 5 | 26 | 40 | 49 | 50 |
Note: The count of states includes Washington, DC.
The DiD approach we employ allows us to estimate the relationship between SARA adoption and online enrollments, but the staggered adoption of SARA may result in biased estimates.[19] As a robustness check to address this potential bias, we conduct cohort-specific estimations for institutions adopting in each year, with institutions not adopting prior to August 1, 2018, or never adopting serving as the control group. Additionally, because states and colleges must actively join SARA, we do not make causal claims from this research. Although we use appropriate covariates and fixed effects, without true exogeneity, we cannot rule out the possibility that effects are due to inherent differences in participants and non-participants. However, the DiD design allows us to precisely estimate the relationship between participation and online enrollments. In the next section, we describe our findings for each of our specifications.
Findings
Overall, our findings support our hypothesis that institutional participation in NC-SARA is associated with an increase in the number of students enrolled exclusively online as well as those enrolled partially online (e.g., through a hybrid program). As expected, “early adopters” appear to be driving most of the results and experienced the largest enrollment gains. We cannot speculate, however, whether these are students who would not have otherwise enrolled in postsecondary education or students who would have enrolled but are now making different decisions. We do not find evidence that for-profit colleges experienced larger enrollment effects after joining SARA. Additionally, neither the count nor the share of online students enrolled prior to SARA participation seem related to future increases in online enrollments. There is some evidence, however, that those colleges with the largest shares of online education may experience a reduction in their hybrid enrollments. The robustness checks we employed, described above and in the appendix, reinforce our findings.
Main Estimates
In Table 2, we show our main estimates of the effects of SARA participation on the number of students enrolled exclusively online (see our findings for hybrid enrollment in Table 3). Compared to institutions not participating in NC-SARA, institutions that joined NC-SARA annually enrolled an additional 46 students in fully online coursework, all else being equal (column 1). For context, the average pre-treatment number of online students at SARA institutions was 659, so the average treatment effect represents a 7% increase in exclusively online enrollments. Early adopting institutions, however, annually enrolled an additional 121 students, a 10% increase, in online programs compared to non-participating institutions (column 5). Our findings also suggest that the effect size grows over time (column 3); even if an institution joined in 2014, for example, they may need the time to launch or expand their programs and recruit and enroll students in new markets. It is worth considering that estimates for early adopters may have a downward bias. The early-adopting models limit the treatment group to colleges joining NC-SARA in 2014 and 2015 and the average treatment effect is estimated for the full treatment period, inclusive of 2018. As such, it is possible late-adopting institutions syphon students away from early adopters from 2016 through 2018, which would result in a downward bias of our estimates in columns 5 and 6.
Overall, our findings support our hypothesis that institutional participation in NC-SARA is associated with an increase in the number of students enrolled exclusively online as well as those enrolled partially online (e.g., through a hybrid program). As expected, “early adopters” appear to be driving most of the results and experienced the largest enrollment gains.
When a state joins SARA, an institution must opt to participate in the reciprocity, and between 2014 and 2018, about half of institutions in our sample joined. The ITT specifications (columns 2, 4, and 6) should capture whether a state’s SARA participation has spillover effects on those institutions in the state that decide not to join. Our ITT estimates are positive, relatively small, and imprecisely measured; no coefficients are statistically significant at the 0.10 level. If these coefficients were negative and significant, we might posit that participating in SARA has an overall negative effect on online enrollments, likely due to the loss of students to out-of-state colleges now operating across borders. This has important policy implications: If SARA only redistributed students between schools rather than expanding the market to new students, then the reciprocity agreements would do little to expand access. While NC-SARA was designed to lower administrative hurdles for colleges seeking to expand online education programs, the expansion of these programs stands to benefit many US residents by increasing their postsecondary access.
Table 2: Estimate Relationship Between SARA Participation and Exclusively Online Enrollment
| TOT | ITT | TOT | ITT | TOT | ITT | ||
| Full Sample | Full Sample | Full Sample | Full Sample | Early Adopters | Early Adopters | ||
| (1) | (2) | (3) | (4) | (5) | (6) | ||
| Inst. SARA Participant | 46.33*** | 121.8** | |||||
| (15.63) | (56.32) | ||||||
| State SARA Participant | 0.523 | 10.87 | |||||
| (12.32) | (14.87) | ||||||
| Year 1 | 38.82*** | 7.778 | |||||
| (12.52) | (12.83) | ||||||
| Year 2 | 46.74** | 7.309 | |||||
| (20.79) | (26.63) | ||||||
| Year 3 | 83.75** | 13.66 | |||||
| (37.29) | (42.04) | ||||||
| Year 4 | 171.7** | 53.10 | |||||
| (84.66) | (60.08) | ||||||
| Year 5 | 706.0 | 21.57 | |||||
| (564.2) | (71.89) | ||||||
| Controls | Yes | Yes | Yes | Yes | Yes | Yes | |
| Year FE | Yes | Yes | Yes | Yes | Yes | Yes | |
| Institution FE | Yes | Yes | Yes | Yes | Yes | Yes | |
| Observations | 22,603 | 22,603 | 22,603 | 22,603 | 13,125 | 13,125 | |
| R-squared | 0.594 | 0.593 | 0.595 | 0.594 | 0.649 | 0.648 | |
| Number of Institutions | 3,229 | 3,229 | 3,229 | 3,229 | 1,875 | 1,875 | |
|
Robust standard errors in parentheses |
|||||||
In Table 3, we show our main estimates on the effects of SARA participation on the number of students enrolled in a mix of online and in-person courses.[20] For our TOT models, we find similar, if slightly larger, absolute effects of SARA participation on hybrid online enrollments as we do on exclusive online enrollments. The increase of 119 and 171 students in columns 1 and 5 represent an 11% and 13% increase, respectively. SARA participation is positively associated with an increase in hybrid enrollments overall and for early adopters, and the enrollments likely grow over time (columns 1, 3, 5). Among early adopting institutions, however, our ITT estimates are negative and significant (0.05 level) (column 6). This finding suggests that participating institutions, both in- and out-of-state, are likely drawing students away from hybrid programs at non-participating institutions. This estimate may also suffer from the same downward bias described above for early-adopter models. However, given the negative point estimate on the full sample (column 2), it is unlikely that any downward bias would have changed the early-adopter estimate from positive to negative, but it may make the estimate somewhat more extreme. Understanding the extent to which SARA results in the redistribution of students across institutions requires student-level data, so is beyond the scope of this study. We encourage further examination of this and other SARA policy implications in our recommendations section below.
Table 3: Estimate Relationship Between SARA Participation and Partially Online Enrollment
| Temporal Effects | |||||||
| TOT | ITT | TOT | ITT | TOT | ITT | ||
| Full Sample | Full Sample | Full Sample | Full Sample | Early Adopters | Early Adopters | ||
| (1) | (2) | (3) | (4) | (5) | (6) | ||
| Inst. SARA Participant | 119.2*** | 171.0*** | |||||
| (16.81) | (39.67) | ||||||
| State SARA Participant | -27.83 | -75.94** | |||||
| (18.81) | (33.99) | ||||||
| Year 1 | 81.49*** | -31.60 | |||||
| (14.72) | (21.76) | ||||||
| Year 2 | 146.9*** | -34.10 | |||||
| (21.20) | (34.13) | ||||||
| Year 3 | 233.2*** | -50.27 | |||||
| (33.86) | (48.46) | ||||||
| Year 4 | 243.4*** | -57.39 | |||||
| (53.50) | (67.87) | ||||||
| Year 5 | 586.6*** | -53.40 | |||||
| (205.9) | (86.61) | ||||||
| Controls | Yes | Yes | Yes | Yes | Yes | Yes | |
| Year FE | Yes | Yes | Yes | Yes | Yes | Yes | |
| Institution FE | Yes | Yes | Yes | Yes | Yes | Yes | |
| Observations | 22,603 | 22,603 | 22,603 | 22,603 | 13,125 | 13,125 | |
| R-squared | 0.103 | 0.100 | 0.106 | 0.100 | 0.071 | 0.068 | |
| Number of Institutions | 3,229 | 3,229 | 3,229 | 3,229 | 1,875 | 1,875 | |
|
Robust standard errors in parentheses |
|||||||
Our study method compares outcomes of interest from a pre-intervention period to a post-intervention period. Yet, because states and institutions joined SARA at different periods within the examination period, our intervention (SARA implementation) takes effect at different points in time. Recent advances in the difference-in-differences analytic approach have revealed the potential for biased estimates when policy implementation is staggered. As institutions move from comparison to treatment groups, the comparison group changes over time, which may impact the average treatment effect in the main specifications.[21]
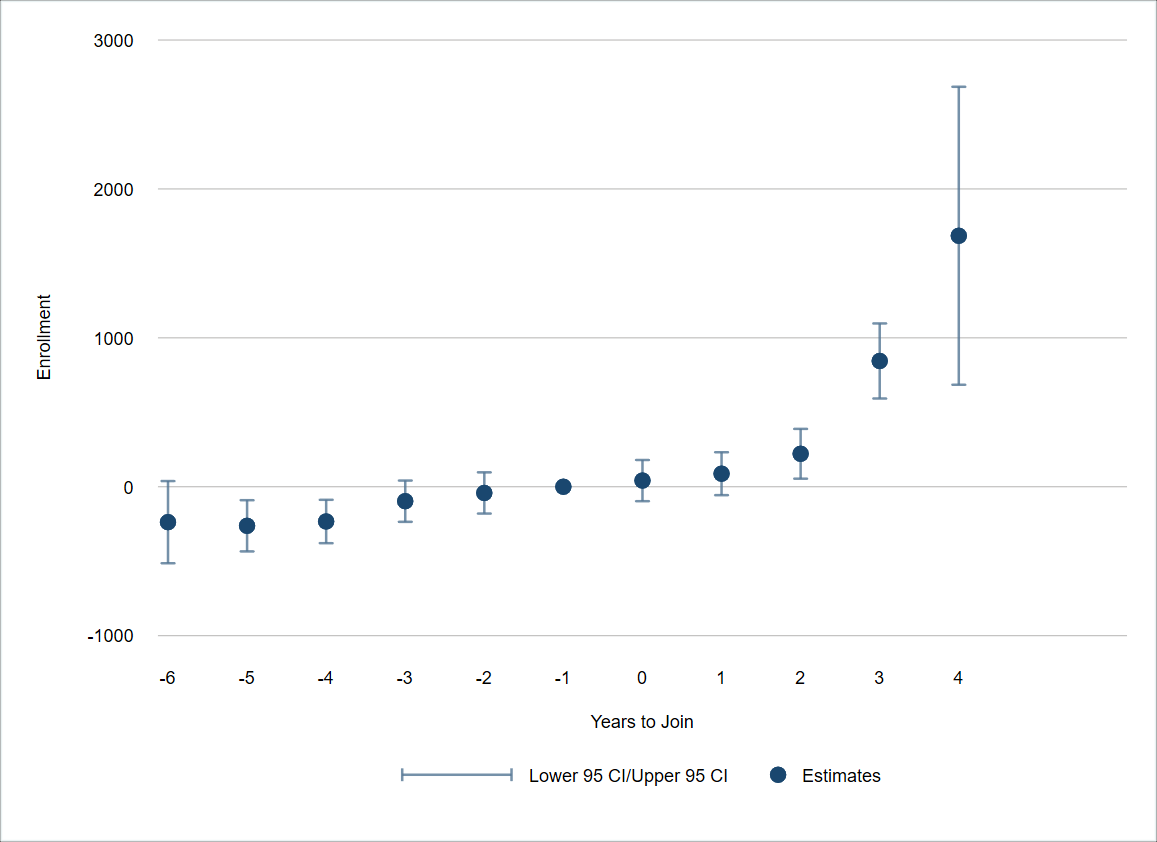
Below, we conduct a series of robustness checks to test whether the cohort-specific estimates vary across years (2014 through 2018).[22] Figure 1, below, shows the TOT point estimates and 95% confidence intervals for each cohort. For Figures 1 and 2 (described below), our outcome of interest is exclusively online enrollments. These estimates compare institutions that joined SARA in a given year with those that never joined or joined after our final year of analysis, 2018. This decomposition of the general DiD estimates confirms our main estimates that SARA-participating institutions experience an increase in online student enrollment and most of these increases are concentrated among early adopters. Perhaps not surprisingly, these checks suggest that the effect among early adopters is largely due to those that joined in 2014, rather than in 2015. These findings are not surprising, since one can imagine that 2014 adopters may have been the most eager to take advantage of the benefits of reciprocity.[23]
In Figure 2, below, we show the cohort estimates for the ITT specification. These cohort estimates shed additional light on the lack of statistical significance in our main ITT estimate (in Table 1), which may be due to a lack of specificity in the estimates for all years and variability in the direction of the point estimates. For both the TOT and ITT specifications, these robustness checks minimize concerns about large potential biases from staggered treatment.
Figure 1: Decomposition of Exclusively Online Enrollment Effects of TOT
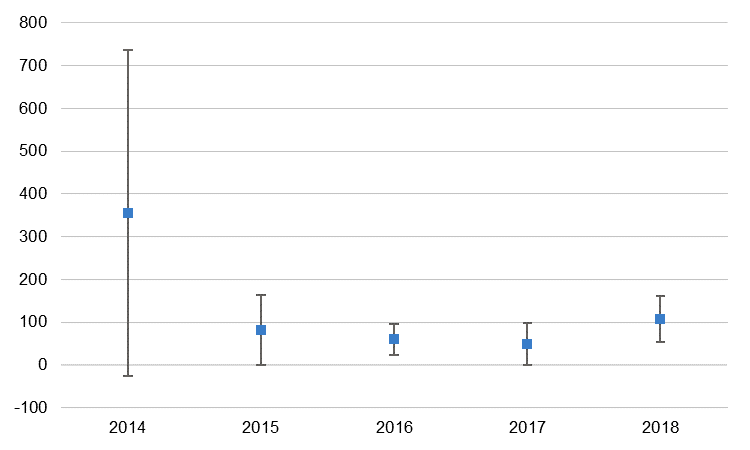
Note: The point estimate and a 95% confidence interval is included for each cohort of SARA participants
Figure 2: Decomposition of Exclusively Online Enrollment Effects of ITT
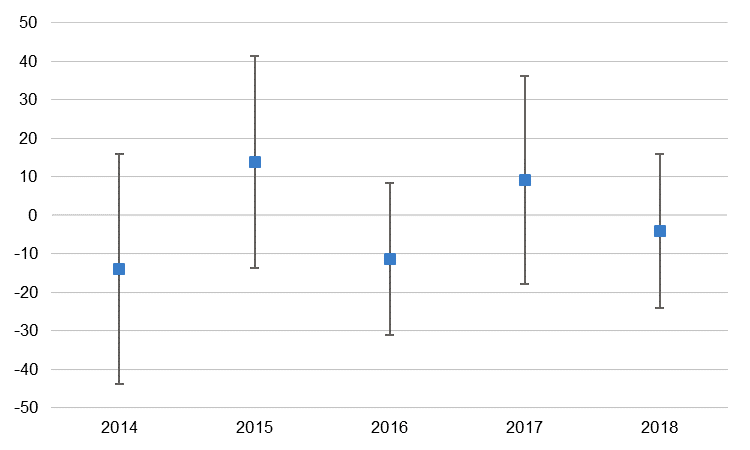
Note: The point estimate and a 95% confidence interval is included for each cohort of SARA participants
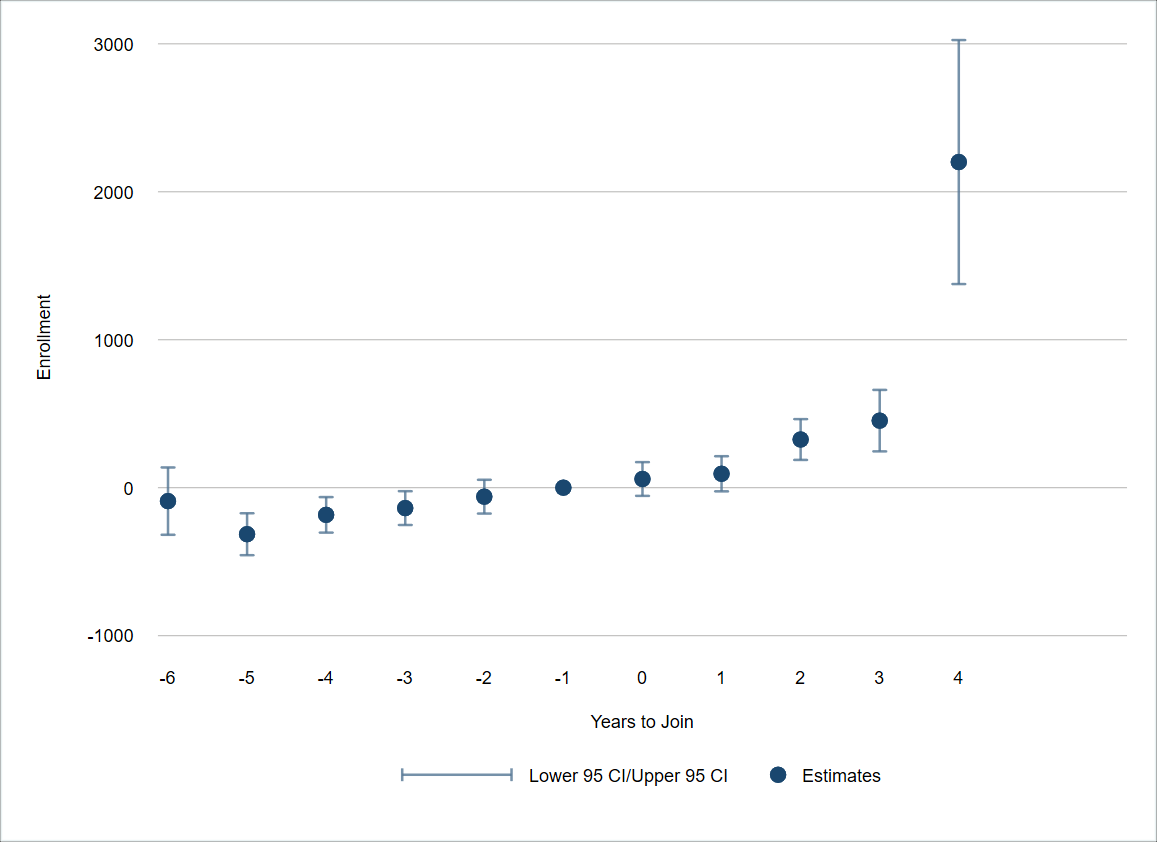
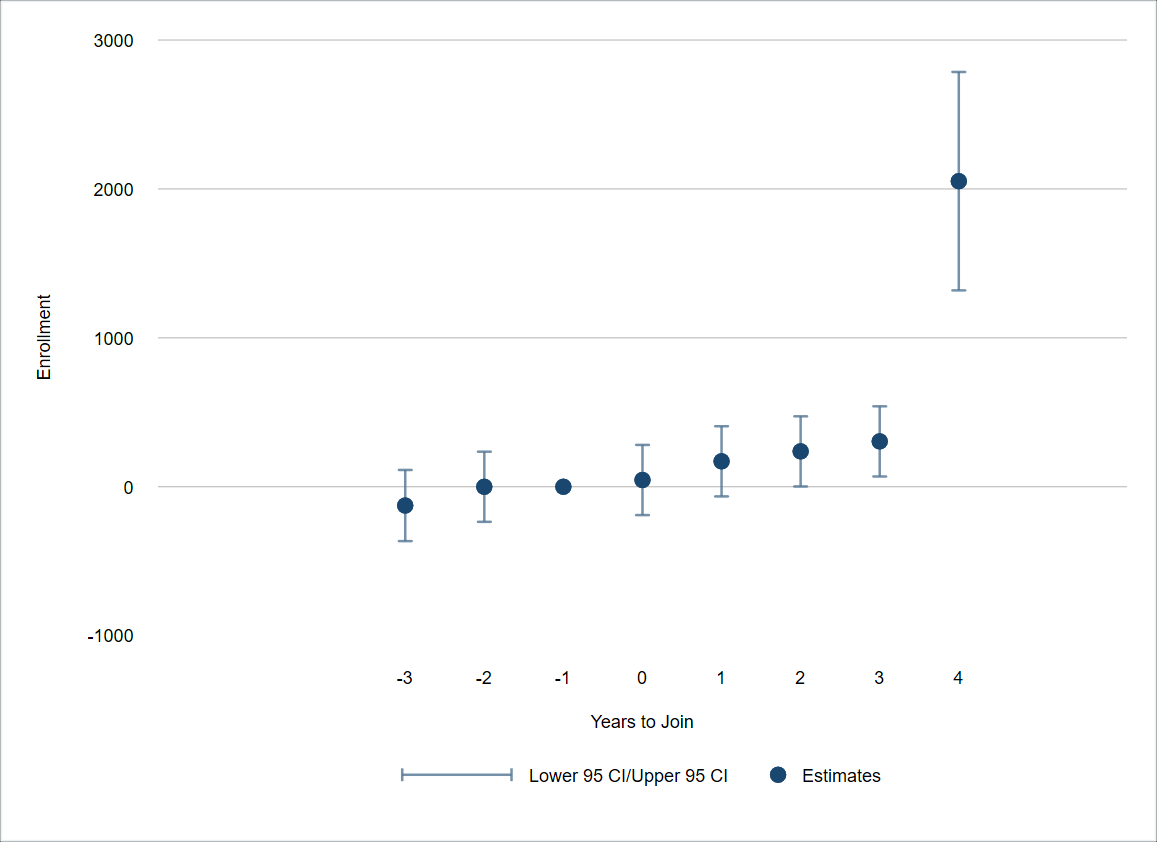
Figures 3 and 4 show the TOT and ITT effects on hybrid enrollments, respectively. The decomposition of the main DiD estimates tell a similar story to the exclusively online enrollments. The 2014 cohort is driving the positive effects of the TOT, with the other cohorts showing similar effect sizes. Similarly, the decomposition of the ITT on hybrid enrollments suggests that losses are concentrated in the early adopting states, however the difference between early and later adopters is much smaller than the TOT.
Figure 3: Decomposition of Partially Online Enrollment Effects of TOT
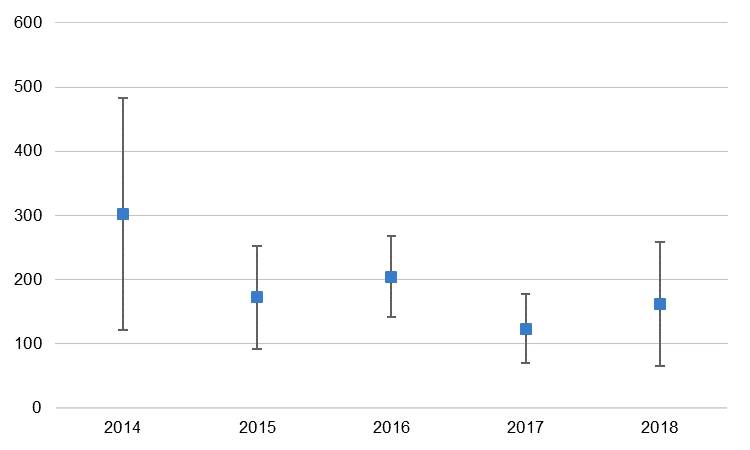
Note: The point estimate and a 95% confidence interval is included for each cohort of SARA participants
Figure 4: Decomposition of Partially Online Enrollment Effects of ITT
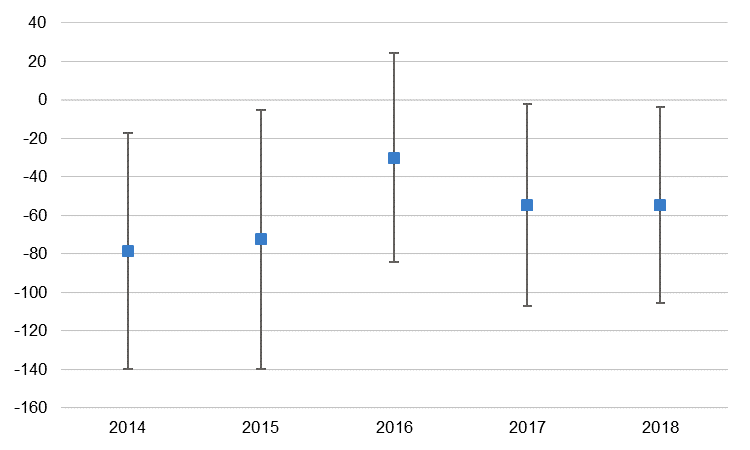
Note: The point estimate and a 95% confidence interval is included for each cohort of SARA participants
Heterogeneous Effects
In addition to our main estimates shown above, we tested for heterogeneous effects across three institutional characteristics: an institution’s for-profit status, its pre-SARA online student enrollment count (capacity), and its pre-SARA online student enrollment share (reliance). To explore these effects, we add these measures to our TOT specification that includes only institutions that were “early adopters” in the treatment group. The control group includes all those institutions that joined SARA after 2018 or non-participants.
We hypothesized that for-profit colleges may more quickly respond to reciprocity than private nonprofit or public colleges and universities, and as such, may see greater increases in online enrollments after joining SARA.[24] To explore this, we included a measure of the interaction between SARA participation and for-profit status (Table 4, columns 1 and 4). We found no evidence in support of our hypothesis: For-profit institutions are no more likely than private nonprofit or public institutions to increase exclusively online or hybrid enrollment after joining SARA. For both outcomes of interest—exclusively online and hybrid—the coefficient for the interaction between SARA participation and for-profit status is not statistically significant. For-profits had a strong foothold in the online education market before SARA’s onset in 2014, so they may have already invested resources to secure authorization in multiple states. Reciprocity, therefore, may have had a smaller impact on their prospective pool of students. Additionally, as described in the methodological appendix, the sample size for the number of for-profit colleges participating in SARA is small.
We also hypothesized that institutions with greater capacity for or reliance on online education prior to SARA would see the greatest increases in online enrollments after joining SARA. We measured an institution’s capacity to serve online learners using the total number of students enrolled in online education in 2013, one year prior to the formation of NC-SARA.[25] We measured an institution’s reliance on online enrollments using the share of total enrollment comprised by online learners in 2013.
We find no relationship between an institution’s capacity to serve online students and post-SARA online enrollments. Compared to institutions that joined SARA after 2018 and non-participants, early adopter institutions with relatively high capacity to serve online students pre-SARA were no more likely to increase online enrollments after joining SARA than those with relatively low online enrollments pre-SARA.
Table 4: Heterogeneous Effects of SARA Participation
|
Exclusively Online Enrollment |
Partially Online Enrollment |
|||||
| TOT | TOT | TOT | TOT | TOT | TOT | |
| Early Adopters | Early Adopters | Early Adopters | Early Adopters | Early Adopters | Early Adopters | |
| (1) | (2) | (3) | (1) | (2) | (3) | |
| Inst. SARA Participant | 115.5** | 79.99 | 74.86 | 180.9*** | 183.3*** | 256.5*** |
| (57.35) | (50.24) | (53.10) | (35.86) | (35.70) | (46.70) | |
| SARA x For-Profit | 86.67 | -137.5 | ||||
| (348.2) | (96.03) | |||||
| SARA x Capacity | 0.0340 | -0.0100 | ||||
| (0.0590) | (0.0129) | |||||
| SARA x Reliance | 304.4 | -554.3*** | ||||
| (409.6) | (160.3) | |||||
| Controls | Yes | Yes | Yes | Yes | Yes | Yes |
| Year FE | Yes | Yes | Yes | Yes | Yes | Yes |
| Institution FE | Yes | Yes | Yes | Yes | Yes | Yes |
| Observations | 13,125 | 13,125 | 13,125 | 13,125 | 13,125 | 13,125 |
| R-squared | 0.649 | 0.651 | 0.649 | 0.071 | 0.071 | 0.074 |
| Number of Institutions | 1,875 | 1,875 | 1,875 | 1,875 | 1,875 | 1,875 |
| Robust standard errors in parentheses *** p<0.01, ** p<0.05, * p<0.1 |
||||||
For reliance on online enrollments, our findings depend on the outcome measure we include, exclusively online enrollments (column 3) or hybrid enrollments (column 6). We find no relationship between an institution’s pre-SARA reliance on online enrollments and its likelihood of increasing exclusively online enrollments after joining SARA. We do see evidence of an inverse relationship between an institution’s pre-SARA reliance on online enrollments and their post-SARA enrollments in hybrid programs. In other words, the more reliant an institution is on online enrollment before joining SARA, the more likely they are to lose hybrid enrollment after joining SARA.
Assuming a linear effect, a ten-percentage-point increase in reliance (an institution with 10% of total students enrolled in online programs compared to an institution with 20%) is associated with decline of roughly 50 hybrid students after joining SARA, all else being equal. By combining our main estimate of SARA participation (257) with the reliance coefficient (-544),[26] we expect that the overall effect of SARA participation is positive for institutions with less than 50% online enrollment pre-SARA, but negative for schools with more than 50% online enrollment pre-SARA. This finding may disprove our hypothesis that higher reliance pre-SARA is associated with greater online enrollments post-SARA. Perhaps institutions that are highly reliant on online enrollment pre-SARA are in greater demand before the reciprocity agreement, and then post-SARA, when there are more online options, students migrate to different colleges. The academic reputation of institutions that have traditional campuses are likely stronger than those that are predominantly operated online, which may also affect student decision-making when the online market expands. As stated before, looking at student-level data and exploring the effect of SARA on student decision-making would help clarify this finding.
Key Takeaways
The dearth of research on state authorization is notable considering the important role states play in the regulatory triad. To help advance the study of this topic, we focus on how reducing the regulatory burden on colleges to obtain state authorization may impact online enrollments. The intent of NC-SARA is to increase postsecondary access by expanding the online education market. The reciprocity agreement allows colleges to bypass the requirement to obtain state authorization in every state in which it enrolls online students in an effort to reduce the time and financial burden of obtaining authorization from many different states. This means that colleges that meet the eligibility criteria can apply to have their state authorization reciprocated by all other NC-SARA member states. In this report, we show that SARA participation is associated with increased enrollments of online students. These enrollments come in the form of exclusively online students as well as hybrid students. We find some evidence that these gains at participating institutions may partly come from non-participating institutions, however, the overall increases experienced by participating colleges appears to outpace losses amongst non-participants and thus represents an expansion of access via online education. We believe it is important to continue examining any colleges that may have lost enrollments after the formation of NC-SARA. In recent years, some public flagship and well-known private institutions have grown in popularity and notoriety in the online education sphere. As these institutions expand, they may be crowding out lesser-known colleges that may be more tuition-dependent or syphoning in-person students away from local community colleges or regional comprehensive institutions. We believe this research demonstrates NC-SARA’s effectiveness at increasing postsecondary access by lowering the regulatory burden associated with obtaining state authorization across multiple states, but we call for a clearer understanding of the potential for larger online programs to cannibalize enrollments from smaller and regional colleges.
While we expected certain institutional characteristics to moderate the effects of SARA participation, we found limited evidence of heterogeneous effects. One potential issue raised by critics with NC-SARA is that reciprocity limits states’ ability to oversee the authorization process by granting authorization to all institutions that are approved by NC-SARA.[27] These critics claim that states lose control over regulating the institutions their residents attend and that there is the potential for colleges to seek out states with weak authorization standards, especially for institutions nimble enough to relocate or quickly open a campus in such a state. Given the for-profit sector’s history of nimble responses to market changes, and its history of predatory practices, even in states that have relatively strong standards, they may now have new opportunities to enter larger markets through weaker regulatory channels. However, we find no evidence that for-profits benefit disproportionately, compared to nonprofit institutions, from SARA participation. One reason may be the application process for institutions to join SARA ensures a minimal level of quality that surpasses even the weakest states’ authorization process. We recommend continual monitoring of this potential negative externality, but our findings should assuage these concerns in the short run.
Perhaps unsurprisingly, one of our most consistent findings was that early adopters benefited the most from participation in NC-SARA, which raises three important considerations: First, early adopters may benefit the most from participating because they have had the most time to adapt to the expanded markets. Because colleges need time to adjust their programmatic offerings, build and scale programs, and recruit new students, the longer NC-SARA participation period may benefit these early adopters. Second, early adopters may have had the greatest opportunity to claim a larger foothold in the expanded online educational market, and this competitive advantage resulted in larger online enrollments. Third, the schools that benefitted the most may have been more involved in the creation and adoption of NC-SARA. This issue is beyond the scope of this paper, but further research should explore these relationships and consider the politics and benefits of institutional involvement in developing and adopting reciprocity policies.
Avenues for Further Research
As the nascent literature on state authorization policies develops, we suggest future research needs to encompass student-, institution-, and state-level analyses. Below we outline important lines of research at each level and their practical implications for higher education leaders and students.
Student-level research is important to understand how state authorization affects students’ opportunities and outcomes, and how these effects may vary across student demographics.
- Researchers should consider the labor market outcomes of students who receive online degrees from out-of-state institutions. As most students attend college within 50 miles of their home, and these institutions may hold regional market value, we should know whether there is a penalty associated with a credential from an institution outside the local labor market, especially those without local name recognition.
- Researchers should also consider the reasons that motivate students to choose online programs at institutions in other states and examine the differences between in-state and out-of-state students enrolling in online programs at a given college. The educational goals, academic preparedness, and career trajectories may differ and shed light on ways in which certain jurisdictions can improve their educational pipeline.
- Researchers should further examine the demographics of online enrollments and how they change in response to NC-SARA. Evidence suggests that, in some cases, students who enroll in online courses have poorer outcomes than student who enroll in in-person courses. For example, graduates from predominantly online schools are less likely to be hired than similar graduates from predominantly in-person schools. There is also evidence that lower-income students and students of color may underperform in online environments compared to their more affluent and white peers.[28] If the market growth resulting from NC-SARA is concentrated among historically underserved students, we must examine these students’ outcomes to ensure they are receiving quality postsecondary opportunities.
Additional institution-level research is important because colleges and universities, as organizations, shape the experiences and opportunities available to students. Policymakers and institutional leaders must understand organizational responses and relationships to authorization policies.
- We believe it is important to understand if colleges change their program offerings in response to NC-SARA and what the institutional motivations for joining the agreement are. Our findings suggest colleges adapt quickly and expand online enrollments after joining SARA. Additional research into whether these expansions occur in established online programs or through the creation of new programs is important. If colleges are rapidly developing new programs in an effort to capitalize on the new enrollment opportunities, state leaders may want to put measures in place to ensure that those new programs are high-quality and high-value.
- We suggest researchers examine how institutions with multiple branch campuses change in response to NC-SARA. Some colleges may have maintained branch campuses in multiple states in order to obtain authorization. Under SARA, this may be unnecessary, and these campuses may close. Similarly, colleges may have opened campuses in early adopting states in order to access the NC-SARA market. Given that some states have historically treated the authorization process as little more than a rubber-stamping procedure, critics are concerned colleges will “shop around” for the least stringent authorizations standards in order to obtain access to a larger online market with the least regulatory burden. It is important to note that NC-SARA has a set of quality assurance guidelines participating states must include in their authorization process and requirements for participating colleges to meet.[29] An evaluation of institutional behavior should accompany the aforementioned research into out-of-state student outcomes of SARA participants.
- We also need to understand the influences of colleges on the policy-making process and avoid policy approaches that benefit certain institutions over others. There is a possibility that high-power institutions are shaping these laws and benefiting at the expense of low-power institutions that are likely to serve historically disadvantaged students. To do this, we need more information about how early adopters differ from later adopters, and the role these institutions may have played in the development and design of NC-SARA.
- We believe future research should explore the potential for cost savings from large scale, cross-state, online education collaborations. Research suggests that, in some contexts, society’s benefits from online education may not be worth the public or private investment into these programs.[30] However, as technology evolves and online education becomes more prevalent, the quality and efficiency of these programs may improve, thus altering the return on investment.
Finally, we should understand states’ motivations to join NC-SARA. States may join to expand educational opportunities for their residents or may join to expand educational markets for their colleges. These motivations may inform or contradict related postsecondary policy considerations.
- We believe additional research into authorization standards is important as states maintain their involvement with NC-SARA. The primary concern from critics is that NC-SARA allows states to abdicate their responsibility in authorization and makes the lowest authorization standards the universal standard. Our research suggests that NC-SARA allows colleges to increase enrollments, which may serve as an important source of revenue for colleges. We suggest future research examine if colleges shop around for the state with the least stringent standards, as reciprocity agreements may incentivize states to make their authorization process more attractive. Additionally, states may provide other incentives to lure new institutions or campuses to their state. For example, policymakers can use tax incentives to attract for-profit colleges that are predominantly online or seeking to expand their online offerings. Examining the unintended consequences of NC-SARA participation will provide a more robust understanding of the policy effects.
Methodological Appendix
To estimate the relationship between NC-SARA participation and online student enrollments, we leverage publicly available IPEDS data, combined with administrative records from NC-SARA, and use a difference-in-differences (DiD) estimation approach. Although the DiD design is often used to make causal estimates, we are hesitant to make causal claims from our data because states and then colleges must actively opt into participation. As such, joining NC-SARA is not an exogenous shock to an institution. However, the DiD strategy allows us to provide more accurate estimates of the changes in enrollment associated with participation in the agreement. The appendix is organized into the following sections: data overview, parallel trends assumptions, difference-in-differences approach, and the difference-in-differences decomposition.
Data Overview
In this report, we rely on institution-level data collected by the Department of Education. Starting in 2012, IPEDS began collecting enrollment counts of students in online and hybrid formats. These enrollment figures serve as our primary outcome variables and mark the earliest year of data included in our analysis. We also include a set of institution- and state-level controls, included in Table A1. Additionally, we include indicators for legislative and gubernatorial party control collected from the National Conference of State Legislatures.[31] We combine these data with administrative records from NC-SARA to identify when an institution joined. Because our modeling is based off fall enrollment numbers, we use August 1 of the cohort year as the cutoff for including it in that cohort. For example, an institution that joined NC-SARA in July 2015 would be part of the 2015 cohort, however a school that joined in December 2015 would be part of the 2016 cohort.
Our full sample includes all for-profit, private nonprofit, and public colleges and universities that are eligible for Title IV federal funding. We include two-year institutions, four-year institutions, and less-than-two-year institutions. To be included in the sample, the institution must appear in all years of the data and have complete data across all outcomes and covariates. We use listwise deletion for institutions with incomplete data. Our final analytic sample includes 3,239 institutions.
Table A1 provides descriptive data for observations in 2013. As described below, we use 2013 to estimate a college’s capacity for and reliance on online education, and thus use this base year for our descriptive table. Importantly, schools that participate in NC-SARA appear to be larger, more reliant on online education, less diverse, more likely to be public, and more likely to offer bachelor’s degree programs.
Table A1: Descriptive Statistics for Analytic Sample
| Control | 2014 | 2015 | 2016 | 2017 | 2018 | Total Sample | |
| Exclusive Online Enrollment | 220 | 2,268 | 1,185 | 546 | 496 | 585 | 444 |
| (639) | (4,009) | (4,026) | (1,122) | (1,881) | (1,272) | (1,643) | |
| Partially Online Enrollment | 443 | 2,824 | 1,262 | 1,117 | 837 | 1,189 | 765 |
| (958) | (5,242) | (2,130) | (1,576) | (1,299) | (2,441) | (1,501) | |
| Proportion Offering Bachelor’s | 0.54 | 0.69 | 0.76 | 0.65 | 0.74 | 0.69 | 0.63 |
| (0.50) | (0.48) | (0.43) | (0.48) | (0.44) | (0.46) | (0.48) | |
| Proportion Public | 0.36 | 0.94 | 0.62 | 0.64 | 0.48 | 0.54 | 0.47 |
| (0.48) | (0.25) | (0.49) | (0.48) | (0.50) | (0.50) | (0.50) | |
| Total Fall Enrollment | 3,457 | 13,664 | 7,443 | 6,361 | 5,547 | 6,765 | 4,960 |
| (5,631) | (24,270) | (9,054) | (7,760) | (6,430) | (9,123) | (7,183) | |
| Share URM | 0.34 | 0.15 | 0.17 | 0.24 | 0.25 | 0.31 | 0.29 |
| (0.26) | (0.09) | (0.13) | (0.19) | (0.22) | (0.22) | (0.24) | |
| Share Pell | 0.46 | 0.29 | 0.36 | 0.41 | 0.41 | 0.42 | 0.43 |
| (0.21) | (0.10) | (0.13) | (0.15) | (0.16) | (0.16) | (0.19) | |
| Share Enrolled Online | 0.06 | 0.26 | 0.15 | 0.11 | 0.10 | 0.09 | 0.08 |
| (0.14) | (0.21) | (0.22) | (0.15) | (0.16) | (0.12) | (0.15) | |
| Proportion For-Profit | 0.23 | 0.00 | 0.08 | 0.03 | 0.09 | 0.04 | 0.14 |
| (0.42) | (0.0) | (0.26) | (0.16) | (0.28) | (0.20) | (0.35) | |
| State Attainment Rate | 0.41 | 0.40 | 0.41 | 0.38 | 0.40 | 0.41 | 0.40 |
| (0.05) | (0.07) | (0.06) | (0.05) | (0.05) | (0.05) | (0.05) | |
| State Income per Capita | 46,277 | 45,829 | 43,835 | 42,014 | 44,171 | 44,671 | 44,839 |
| (6,574) | (7,648) | (4,848) | (4,570) | (7,527) | (7,023) | (6,555) | |
| State Population | 15,600,000 | 2,602,469 | 4,534,307 | 8,774,060 | 9,449,501 | 13,300,000 | 12,100,000 |
| (12,500,000) | (2,325,741) | (2,361,656) | (6,913,331) | (6,450,155) | (7,109,095) | (10,500,000) | |
| Number of New Institutions in SARA | 1,583 | 16 | 278 | 567 | 557 | 238 | 3,239 |
As shown in Table A2, as more states joined NC-SARA, both the TOT and ITT groups increased. Overtime, the growth in NC-SARA caused the change in potential control institutions to shrink. The shift in balance between treatment and control is particularly notable for estimating the ITT. This shift may contribute to the noisiness of the ITT estimates, as the population in each cohort may be substantially different.
Table A2: Institutional Count in TOT and ITT Groups
| 2014 | 2015 | 2016 | 2017 | 2018 | |
| Number of SARA Participants (TOT) | 16 | 194 | 861 | 1,418 | 1,656 |
| Number of Institutions in SARA-Approved States (ITT) | 286 | 1,418 | 2,171 | 2,723 | 2,950 |
| Number of Institutions in Non-SARA States | 2,953 | 1,821 | 1,068 | 516 | 289 |
Difference-in-Differences Approach
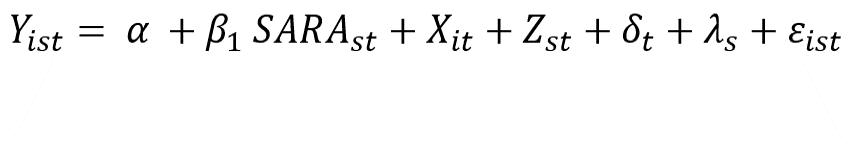
We use a DiD approach to estimate the relationship between NC-SARA participation and our outcome of interest, Yist, which is the number of students enrolled in distance learning programs at institution i in state s and year t. We use the follow equation to estimate this relationship with standard errors clustered at the IPEDS unitid to control for unitid-specific autocorrelation:
(1)

SARAist is a binary indicator equal to 1 if institution i operating in state s in year t is participating in SARA and 0 otherwise, Β1 represents the expected difference in student enrollment in distance learning between participating and non-participating institutions (i.e., the “treatment-on-the-treated”), Xit is a vector of time-varying institutional characteristics, Zst is a vector of time-varying state characteristics, δt a year fixed effect, and μi is an institution fixed effect. This estimation provides an estimated effect of the treatment on the treated.
We also estimate the intent to treat effect, which examines the effects at all institution (i.e., participants and non-participants) in states that have joined NC-SARA. Equation 2 provides our model specification, where SARAst is a binary indicator equal to 1 if state s in year t is participating in SARA and 0 otherwise, and λs is a state fixed effect:
(2)
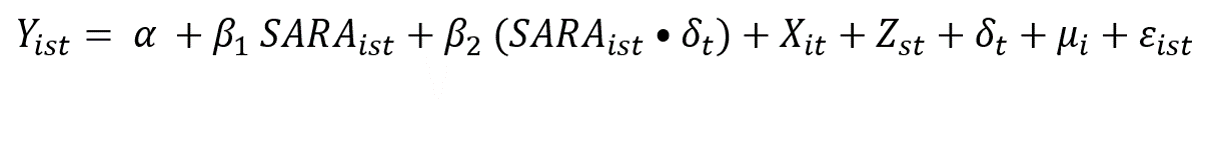
Evidence from higher education policy research suggests it may take time to see the effects of policy shifts. In the case of NC-SARA, it is likely to take time to recruit new students in expanded markets and thus the effect size may grow over time. In equation 3, we interact our treatment indicator from Equation 1 with an annual counter to estimate the temporal relationship:
(3)
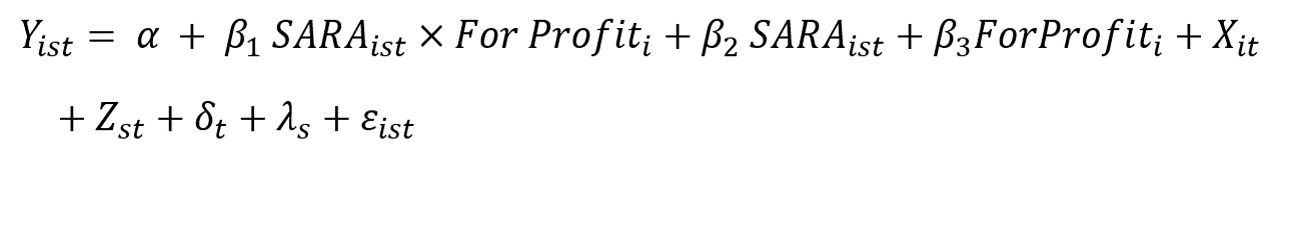
As described above, we have reason to believe that for-profit institutions may respond to NC-SARA more quickly and thus benefit from participation more than their nonprofit counterparts. In Equation 4, For Profiti is a binary indicator equal to 1 if an institution is a for-profit entity:
(4)
We also estimate how the relationship between NC-SARA participation and online enrollments varies by a school’s pre-treatment online enrollments. We conceptualize this in two ways: First, an institution’s pre-SARA capacity for online learning for which we use the total number of online students as a proxy; second, an institution’s reliance on online enrollments which we measure as the percentage of total enrollments that are online. Because these may change after an institution joins NC-SARA and would thus become endogenous to the model, we measure this as a static value in 2013, before NC-SARA began. We estimate these relationships using equations 5 and 6 below:
(5)
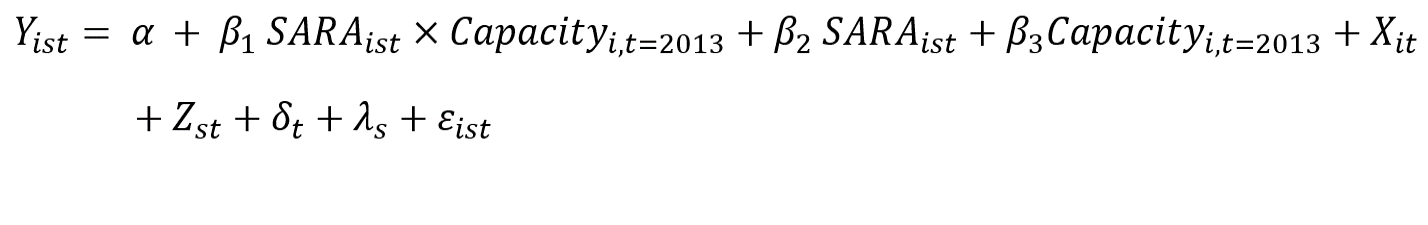
(6) 
Parallel Trends Assumptions
The DiD estimator relies on the assumption that the comparison group is equal in expectations, or that the pre-treatment trends in the outcome variable are parallel and the comparison group can be seen as a set of counterfactual institutions that join NC-SARA. We use an event-study design to test the parallel trends assumption. We test the assumption for each cohort and determine the pre-treatment trends match for institutions adopting in 2014 and 2015, however there are some deviations for the 2016, 2017, and 2018 cohorts. Because a violation of these parallel trends may bias the estimate, we conduct the estimates described below and presented above for the full sample as well as a subsample of the early adopters in 2014 and 2015.
Figure A1: Exclusive Online Enrollment Event Study
Panel A: Full Sample
Panel B: Reduced Sample
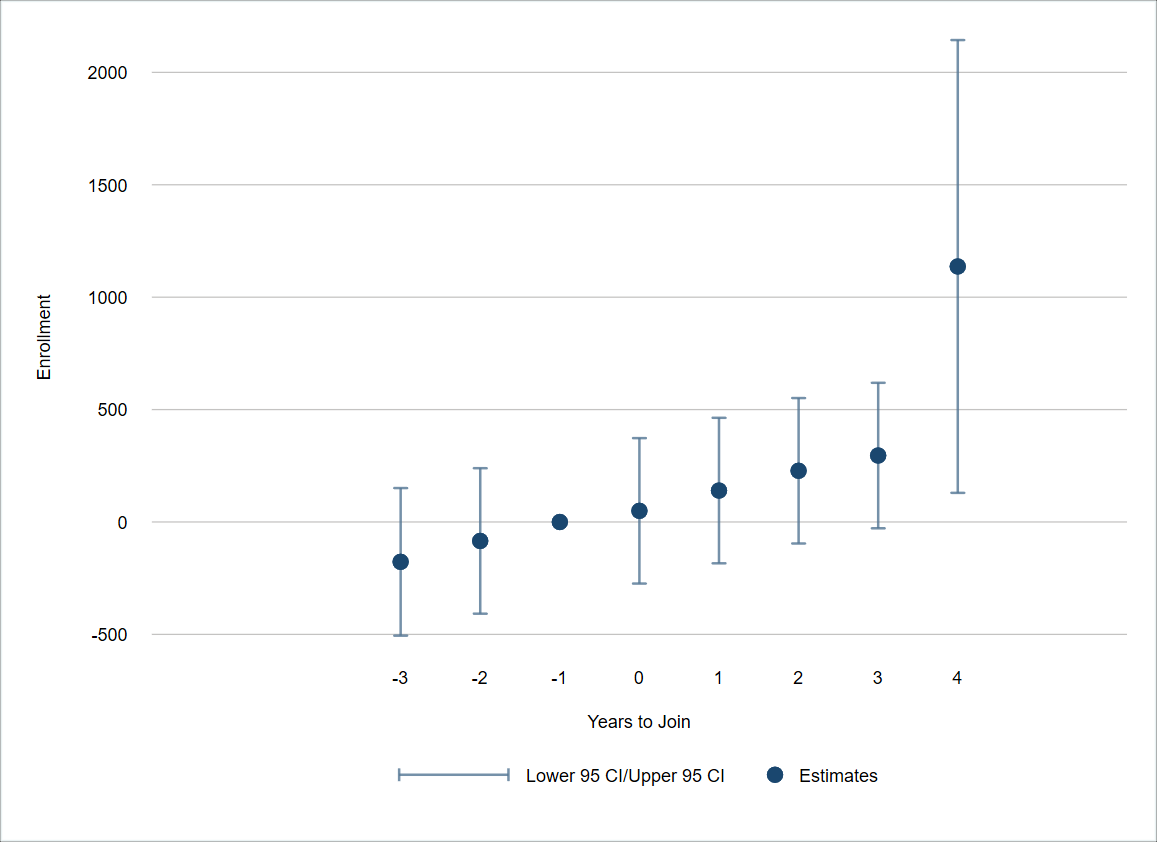
Figure A2: Partial Online Enrollment Event Study
Panel A: Full Sample
Panel B: Reduced Sample
Difference-in-Differences Decomposition
Recent advances in the DiD design point out methodological limitations in the ability to estimate relationships when a policy is implemented over time.[32] The staggered timing of implementation is likely to cause institutions that joined NC-SARA during the middle of the observation period to be more heavily weighted than those joining in early and late years. To address this potential bias in the estimate, we employ a cohort-based estimation strategy developed by Cengiz and colleagues.[33] The cohort-based modeling uses the same comparison group as the two-way fixed-effects (TWFE) models in equation 1, but we estimate the model separately for institutions that adopted in each year. The comparison group for each cohort-specific estimate is all institutions that never joined NC-SARA. Although each cohort-specific estimate uses a reduced sample, the full set of time periods, 2012 through 2018, are used for estimating the average treatment effect for each cohort of new adopters. As shown in Figures 1 through 4 in the body of the report, the cohort-modeling confirms the direction of our estimate but suggests institutions that joined NC-SARA in 2014 have much larger effects than other cohorts.
Endnotes
-
David A. Tandberg, Ellie M. Bruecker, and Dustin D. Weeden, “Improving State Authorization: The State Role in Ensuring Quality and Consumer Protection in Higher Education,” State Higher Education Executive Officers Association (2019), https://sheeomain.wpengine.com/wp-content/uploads/2019/07/SHEEO_StateAuth.pdf.↑
-
Ibid.↑
-
Nicholas Hillman and Taylor Weichman, “Education Deserts: The Continued Significance of ‘Place’ in the Twenty-First Century,” Viewpoints: Voices from the Field (2016), https://www.acenet.edu/Documents/Education-Deserts-The-Continued-Significance-of-Place-in-the-Twenty-First-Century.pdf.↑
-
Ellen Bara Stolzenberg, Melissa C. Aragon, Edgar Romo, Victoria Couch, Destiny McLennan, M. Kevin Eagan, and Nathaniel Kang, “The American Freshman: National Norms Fall 2019,” Higher Education Research Institute: Los Angeles (2020), https://www.heri.ucla.edu/monographs/TheAmericanFreshman2019.pdf.↑
-
Nicholas W. Hillman, “Geography of College Opportunity: The Case of Education Deserts,” American Educational Research Journal 53, no. 4 (2016): 987-1021, https://doi.org/10.3102%2F0002831216653204.↑
-
William G. Tierney and Linda Serra Hagedorn, Increasing Access to College: Extending Possibilities for All Students, SUNY Press, 2002, https://www.sunypress.edu/p-3578-increasing-access-to-college.aspx.↑
-
Cindy Le, Elizabeth Davidson Pisacreta, James Dean Ward, Jesse Margolis, and Heidi Booth, “Policies to Ensure Equitable Access to Well-Resourced Colleges and Universities,” Ithaka S+R. October 1, 2020, https://doi.org/10.18665/sr.313963.↑
-
Joshua Goodman, Julia Melkers, and Amanda Pallais, “Can Online Delivery Increase Access to Education?” Journal of Labor Economics 37, no. 1 (2019): 1-34, https://doi.org/10.1086/698895.↑
-
David J. Deming, Claudia Goldin, Lawrence F. Katz, and Noam Yuchtman, “Can Online Learning Bend the Higher Education Cost Curve?” American Economic Review 105, no. 5 (2015): 496- 501, https://scholar.harvard.edu/files/ddeming/files/aer.p20151024.pdf.↑
-
Christian Fischer, Rachel Baker, Qiujie Li, Gabe Avakian Orona, Mark Warschauer, “Increasing Success in Higher Education: The Relationships of Online Course Taking with College Completion and Time-to-Degree,” EdWorkingPaper: 21-427, .↑
-
David Figlio, Mark Rush, and Lu Yin, “Is it Live or is it Internet? Experimental Estimates of the Effects of Online instruction on student learning,” Journal of Labor Economics 31, no. 4 (2013): 763-784; William G. Bowen, Matthew M. Chingos, Kelly A. Lack, and Thomas I. Nygren, “Interactive Learning Online at Public Universities: Evidence from a Six‐Campus Randomized Trial,” Journal of Policy Analysis and Management 33, no. 1 (2014): 94-111; Eric P. Bettinger, Lindsay Fox, Susanna Loeb, and Eric S. Taylor, “Virtual Classrooms: How Online College Courses Affect Student Success,” American Economic Review 107, no. 9 (2017): 2855-75; Di Xu and Shanna S. Jaggars, “Performance Gaps Between Online and Face-to-Face Courses: Differences Across Types of Students and Academic Subject Areas,” The Journal of Higher Education 85, no. 5 (2014): 633-659.↑
-
Stephanie Riegg Cellini and Nicholas Turner, “Gainfully Employed? Assessing the Employment and Earnings of For-Profit College Students Using Administrative Data,” Journal of Human Resources 54, no. 2 (2019): 342-370, https://doi.org/10.3368/jhr.54.2.1016.8302R1.↑
-
Di Xu and Shanna Smith Jaggars, “The Impact of Online Learning on Students’ Course Outcomes: Evidence From a Large Community and Technical College System,” Economics of Education Review 37 (2013): 46-57, http://dx.doi.org/10.1016/j.econedurev.2013.08.001.↑
-
Spiros Protopsaltis and Sandy Baum, “Does Online Education Live Up To Its Promise? A Look At The Evidence And Implications For Federal Policy,” Center for Educational Policy Evaluation (2019), https://jesperbalslev.dk/wp-content/uploads/2020/09/OnlineEd.pdf.↑
-
Caroline M. Hoxby, “Online Postsecondary Education and Labor Productivity,” in Education, Skills, and Technical Change, pp. 401-464, University of Chicago Press, 2019, https://www.nber.org/system/files/chapters/c13709/c13709.pdf.↑
-
David A. Tandberg, Ellie M. Bruecker, and Dustin D. Weeden, “Improving State Authorization: The State Role in Ensuring Quality and Consumer Protection in Higher Education,” State Higher Education Executive Officers (2019), https://sheeomain.wpengine.com/wp-content/uploads/2019/07/SHEEO_StateAuth.pdf.↑
-
Tressie McMillan Cottom, Lower Ed: The Troubling Rise of For-Profit Colleges in the New Economy, The New Press (2017), https://thenewpress.com/books/lower-ed. David J. Deming, Claudia Goldin, and Lawrence F. Katz, “The For-Profit Postsecondary School Sector: Nimble Critters or Agile Predators?” Journal of Economic Perspectives 26, no. 1 (2012): 139-64, http://doi.org/10.1257/jep.26.1.139.↑
-
Adrian Colin Cameron and Pravin K. Trivedi, Microeconometrics Using Stata, Vol. 2, College Station, TX: Stata Press, 2010.↑
-
Andrew Goodman-Bacon, “Difference-in-Differences with Variation in Treatment Timing,” No. w25018. National Bureau of Economic Research (2018), https://www.nber.org/papers/w25018.↑
-
Hybrid degree programs are growing in popularity. One example of such a program is a clinical health science degree, such as a bachelor’s in nursing, that mixes online coursework with in-person field courses.↑
-
Andrew Goodman-Bacon, “Difference-in-Differences with Variation in Treatment Timing,” No. w25018, National Bureau of Economic Research (2018), https://www.nber.org/papers/w25018.↑
-
Each cohort refers to all institutions joining SARA in a given year and compares it to all institutions that never adopted SARA. The methodological appendix provides additional details of our approach.↑
-
The large confidence interval for the 2014 cohort is likely due to the small sample of institutions in this earliest group of adopters.↑
-
Guilbert C. Hentschke, Vicente M. Lechuga, and William G. Tierney, For-Profit Colleges and Universities: Their Markets, Regulation, Performance, and Place in Higher Education. Stylus Publishing, LLC (2010), https://eric.ed.gov/?id=ED515057; David J. Deming, Claudia Goldin, and Lawrence F. Katz, “The For-Profit Postsecondary School Sector: Nimble Critters or Agile Predators?” Journal of Economic Perspectives 26, no. 1 (2012): 139-64, http://doi.org/10.1257/jep.26.1.139.↑
-
As an additional robustness check, we estimated models interacting the treatment variable with a series of binary indicators equal to one if a college’s online enrollment was above the mean, 90th percentile, or 99th percentile, respectively. We do not report these findings, but these robustness checks confirm our estimates in Table 4 suggesting no meaningful relationship between an institution’s pre-SARA capacity to enroll online students and the treatment effect.↑
-
Reliance is a proportion that is measures on a 0 to 1 scale. A 50%, or 0.5, reliance on online education is associated with a loss of 272, or 544 divided by 2, hybrid students.↑
-
Angela Perry and Debbie Cochrane, “Going the Distance: Consumer Protection for Students Who Attend College Online,” Institute for College Access & Success (2018), https://ticas.org/wp-content/uploads/legacy-files/pub_files/going_the_distance.pdf; Stephanie Hall, Ramond Curtis, and Carrie Wofford, “What States Can Do to Protect Students from Predatory For-Profit Colleges: A 2020 Toolkit for State Policy Makers,” Century Foundation (2020), https://tcf.org/content/report/states-can-protect-students-predatory-profit-colleges/; Clare McCann and Amy Laitinen, “The Bermuda Triad: Where Accountability Goes to Die.” New America (2019), https://www.newamerica.org/education-policy/reports/bermuda-triad/.↑
-
Spiros Protopsaltis and Sandy Baum, “Does Online Education Live Up to Its Promise? A Look At The Evidence And Implications For Federal Policy,” Center for Educational Policy Evaluation (2019), https://jesperbalslev.dk/wp-content/uploads/2020/09/OnlineEd.pdf.↑
-
Lori Williams and Melanie Booth, “Quality Distance Education for Students is Within Reach.” Change: The Magazine of Higher Learning 53, no. 1 (2020): 55-59, https://doi.org/10.1080/00091383.2021.1850131.↑
-
Caroline M. Hoxby, “Online Postsecondary Education and Labor Productivity,” in Education, Skills, and Technical Change, University of Chicago Press, 2019, pp. 401-464, https://www.nber.org/system/files/chapters/c13709/c13709.pdf.↑
-
National Conference of State Legislatures, “State Partisan Composition,” 2020, https://www.ncsl.org/research/about-state-legislatures/partisan-composition.aspx.↑
-
Andrew Goodman-Bacon, “Difference-in-Differences with Variation in Treatment Timing,” No. w25018, National Bureau of Economic Research (2018), https://www.nber.org/papers/w25018.↑
-
Doruk Cengiz, Arindrajit Dube, Attila Lindner, and Ben Zipperer, “The Effect of Minimum Wages on Low-Wage Jobs,” The Quarterly Journal of Economics 134, no. 3 (2019): 1405-1454, https://doi.org/10.1093/qje/qjz014.↑