Expanding Opportunity for Lower-Income Students
Three Years of the American Talent Initiative
The American Talent Initiative, supported by Bloomberg Philanthropies, is co-managed by The Aspen Institute’s College Excellence Program and Ithaka S+R. If your college or university is interested in joining the American Talent Initiative, please email Benjamin Fresquez (benjamin.fresquez@aspeninstitute.org).
ACKNOWLEDGMENTS:
- The 128 members of the American Talent Initiative, especially the staff who set their goals, collected and submitted their data, and participated in numerous conversations and meetings.
- The members on the ATI steering committee who provide consistent leadership and strategic guidance on the direction of the American Talent Initiative.
- William E. “Brit” Kirwan, chancellor emeritus of the University System of Maryland, for his vision and leadership in the planning for and launch of the American Talent Initiative.
- The staff of the Aspen Institute and Ithaka S+R who devote their time and energy to the American Talent Initiative, including Ben Fresquez, Gelsey Mehl, McKenzie Maxson, Yazmin Padilla, Elizabeth Banes, and Sindy Lopez.
- Daniel Rossman, Researcher at Ithaka S+R, for his consultation throughout the data collection and analysis process.
ATI STEERING COMMITTEE:
- Ana Mari Cauce, President, University of Washington
- Michael V. Drake, President, The Ohio State University
- Christopher Eisgruber, President, Princeton University
- Martin Kurzweil, Director, Educational Transformation Program, Ithaka S+R
- Daniel R. Porterfield, President and CEO, The Aspen Institute
- Carol Quillen, President, Davidson College
- Eric F. Spina, President, University of Dayton
- Josh Wyner, Vice President and Executive Director, College Excellence Program, The Aspen Institute
ATI gratefully acknowledges Bloomberg Philanthropies, the Aronson Family Foundation, and the Gray Foundation for supporting this publication.
THE ASPEN INSTITUTE’S COLLEGE EXCELLENCE PROGRAM aims to advance higher education practices, policies, and leadership that significantly improve student outcomes. The program is part of The Aspen Institute, a global nonprofit organization committed to realizing a free, just, and equitable society.
ITHAKA S+R is a not-for-profit service that provides research and strategic guidance to help the academic and cultural communities serve the public good and navigate economic, technological, and demographic change. Ithaka S+R is part of ITHAKA.
BLOOMBERG PHILANTHROPIES invests in 510 cities and 129 countries around the world to ensure better, longer lives for the greatest number of people. The organization focuses on five key areas for creating lasting change: Arts, Education, Environment, Government Innovation, and Public Health. Bloomberg Philanthropies encompasses all of Michael R. Bloomberg’s giving, including his foundation and personal philanthropy as well as Bloomberg Associates, a pro bono consultancy that works in cities around the world. In 2019, Bloomberg Philanthropies distributed $3.3 billion. For more information, please visit bloomberg.org or follow us on Facebook, Instagram, YouTube and Twitter.
Executive Summary
The American Talent Initiative (ATI) was formed in December 2016 to address a persistent issue—specifically, that the American colleges and universities with the greatest resources, and where students have the highest likelihood of graduating, have historically served far too few young people from low- and middle-income backgrounds. The American Talent Initiative has a goal to enroll an additional 50,000 low- and middle-income students at these institutions by the year 2025.
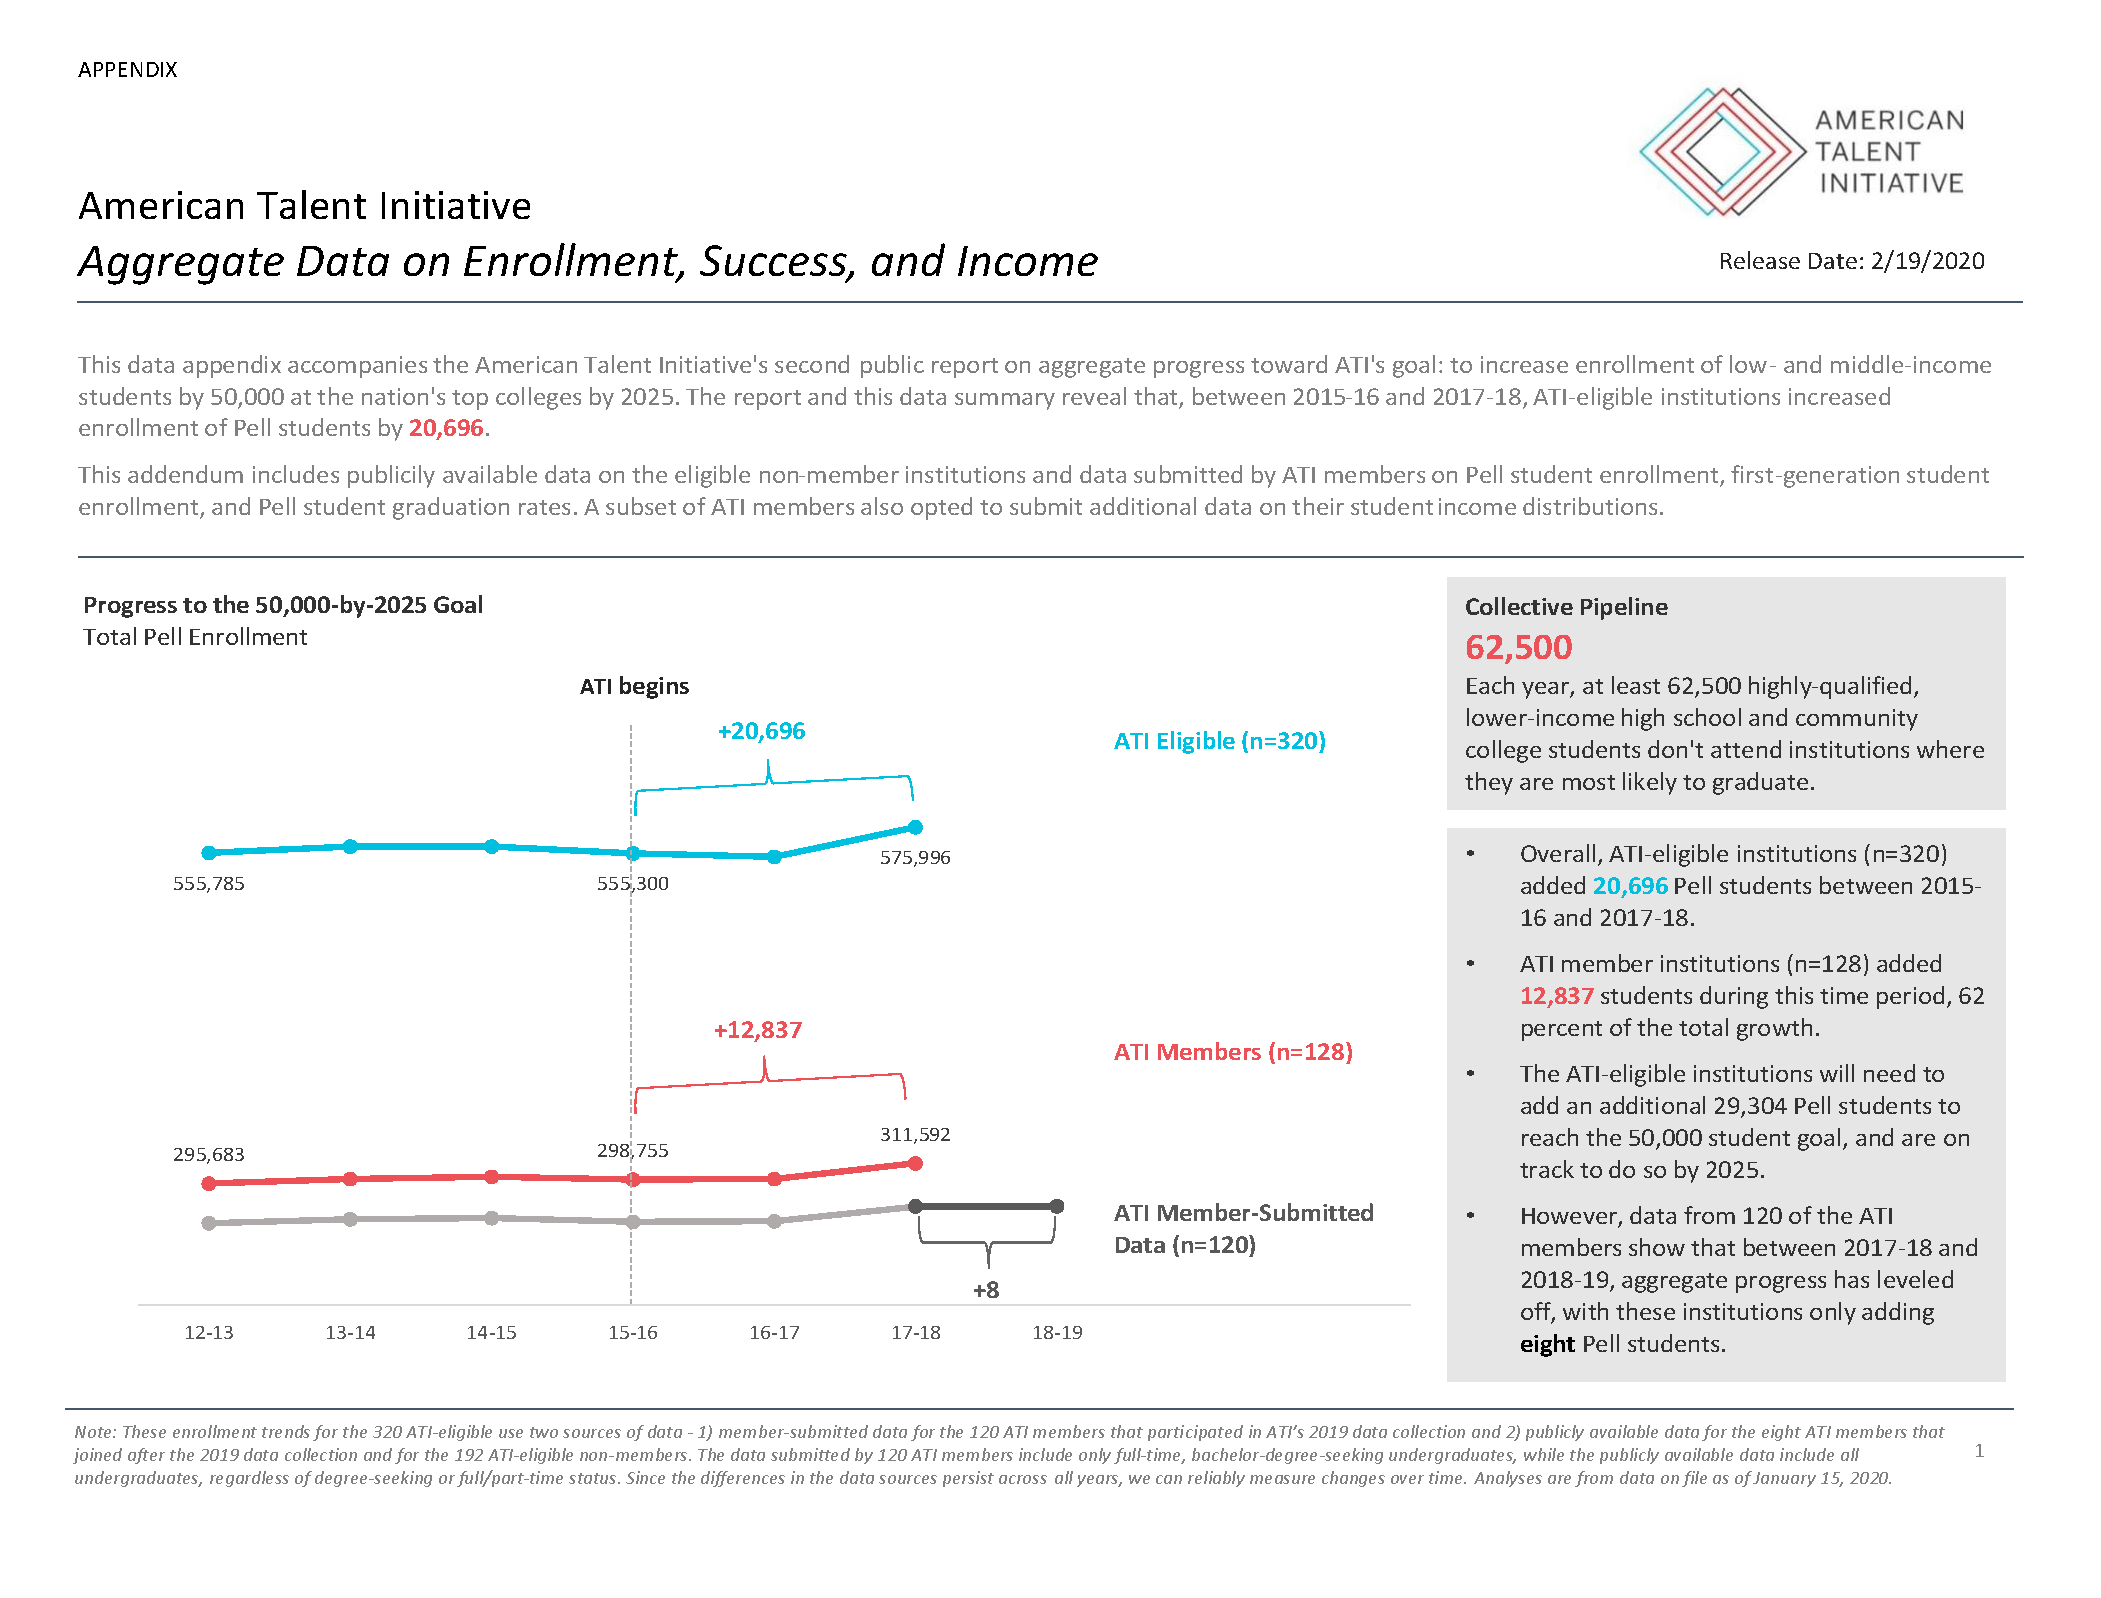
ATI is on track to meet its goal. Between 2015-16, the year before the initiative started, and 2017-18, enrollment of low- and middle-income students increased by 20,696 at the 320 ATI-eligible institutions with graduation rates at or above 70 percent. In just two years, the ATI-eligible colleges and universities progressed more than 40 percent of the way to the 50,000-by-2025 goal.
The 128 institutions that make up the ATI membership led the way, contributing disproportionately to the initiative’s early progress: ATI members account for 54 percent of all undergraduates enrolled at the ATI-eligible institutions, yet they were responsible for 62 percent of the progress toward the goal, accounting for an additional 12,837 low- and middle-income students.
Yet continued progress toward the goal is not guaranteed. Indeed, enrollment data collected directly from 120 member institutions for the 2018-19 academic year indicate that gains in lower-income enrollment have leveled off. While the majority of ATI members increased low- and middle-income student enrollment between 2017-18 and 2018-19, these increases were offset by declines at other institutions during the same period, resulting in a net, aggregate increase of just eight lower-income students. We do not yet have the data to determine whether the trend was similar for the remaining 200 ATI-eligible institutions.
The strong progress at many institutions and the mixed results at others have yielded important insights about the institutional strategies that are most effective in maintaining and increasing socioeconomic diversity, as well as challenges that must be overcome. This report explores these strategies and challenges in depth, focusing on four features common among the most successful institutions:
- Committing to a comprehensive strategy at the leadership and board level, with the investment of resources to support it
- Moving beyond traditional pipelines of incoming students
- Prioritizing need-based aid
- Ensuring that all students are set up to thrive on campus
The recent data indicating that progress from the first two years of ATI has not been replicated in year three raises the urgency of ATI’s mission and the need to overcome the challenges that may stand in the way. The success of many of the member institutions in expanding opportunity points to a path forward.
Introduction
America’s higher education institutions are key to cultivating talent and enabling upward mobility. For individuals, a bachelor’s degree is an essential conduit to the middle class; as the economy continues to evolve in ways that favor those who can think critically, apply technical knowledge to new challenges, and communicate across different media and cultural contexts, higher education will become even more crucial to a successful career. Expanding higher education attainment is also central to the national interest and our social fabric as populations diversify, sources of knowledge proliferate, and traditional democratic systems are at risk of increasing fragmentation. In an increasingly complex world, America must develop its greatest asset, the immense talent of its people, to navigate the economic, social, and political challenges that lie ahead.
While the importance of broadening access to the benefits of higher education is greater than ever, the realities of college access and success have failed to keep pace. Individuals from the top of the economic ladder are far more likely to earn a degree than those at the middle or lower rungs. More than three-quarters of bachelor’s degrees are granted to young adults from the top half of the income distribution.[1] Public perceptions of the value and fairness of higher education are at a low point, reflecting this inequitable reality. According to a 2018 Gallup poll, only 48 percent of American adults have confidence in higher education, a decline of nearly 10 percentage points in just three years.[2]
There are multiple contributors to the current state of affairs. One important factor is that American colleges and universities with the greatest resources—those where students have the highest likelihood of graduating—have historically served far too few young people from low- and middle-income backgrounds. More than half of the students at these institutions come from families in the top 20 percent of the national income distribution.[3] This pattern of enrollment does not reflect a shortage of talent. Each year, tens of thousands of highly talented low- and middle-income students graduate from high school or community college with academic records that indicate that they would thrive at one of these colleges, but they do not enroll in these, or in some cases any, four-year colleges.[4]
In short, talent is broadly distributed, but opportunity is not. Expanding opportunity at high-graduation-rate schools would yield great benefits: for students, who will gain a world-class education and pathways into leadership; for institutions, which will be enriched by the infusion of talent and diverse perspectives; and for the nation.
The American Talent Initiative formed in December 2016 to address this challenge—specifically, to support and encourage the 320 U.S. colleges and universities with the highest graduation rates in their efforts to expand opportunity for lower-income students. After starting with 30 members, ATI has now grown to include 128 institutions. Each member’s president or chancellor has signed on to do their part to ensure that ATI meets its goal of enrolling and graduating 50,000 additional low- and middle-income students at the high-graduation-rate colleges and universities by 2025.
This report presents the initiative’s progress to date, including new information on enrollment trends among the 128 members and the broader set of 320 institutions, insights about the strategies that have been most effective in advancing institutional success, and reflections on some of the challenges faced by members and the initiative overall.
Summary of Findings
Across all institutions eligible for ATI—that is, those with six-year graduation rates consistently above 70 percent—enrollment of lower-income students is on track to meet the initiative’s goal of 50,000 additional low- and middle-income students by 2025. As of the 2017-18 academic year, the most recent year for which we have complete data, there were 20,696 more low- and middle-income students enrolled at the 320 ATI-eligible institutions than there were in 2015-16, the year before the initiative started. In other words, just two years into the initiative, ATI-eligible colleges and universities were more than 40 percent of the way toward the 50,000 goal.
ATI members have led the way: While the 128 ATI members account for 54 percent of all undergraduates enrolled at the 320 eligible institutions, members were responsible for 62 percent of the increase, accounting for an additional 12,837 low- and middle-income students.
However, data collected directly from 120 member institutions indicate that aggregate progress has leveled off between 2017-18 and 2018-19. While most ATI members increased lower-income enrollment in the past year, these gains were offset by decreases at other institutions during the same period. Overall, the 120 members that submitted data collectively enrolled 277,437 low- and middle-income students in 2018-19, compared to 277,429 in 2017-18—an aggregate gain of only eight students.
Without comparable data for the remaining eligible institutions, we cannot say whether this leveling off reflects a trend across all institutions eligible for ATI. While we are encouraged by the continued progress of a majority of member institutions, the lack of aggregate progress across member institutions is a reminder of the urgency of the mission and the need to maintain its priority.
Investigations into these data and our work with dozens of member institutions have yielded important insights about the strategies that are most effective in pursuing ambitious socioeconomic diversity goals, and the challenges that must be overcome to achieve them.
The key, overarching insight is that ATI members that have increased or maintained relatively high levels of low- and middle-income enrollment do not pursue only one strategy, but rather prioritize and put resources behind a comprehensive strategy for expanded opportunity. Specifically, leaders of these institutions ensure that there is focused attention and a concrete plan for promoting socioeconomic diversity across the whole lifecycle of the student experience: outreach to prospective students, admissions and yield, financial aid, student belonging, the academic experience, and progression and graduation.
Beyond this broad insight about the need for a comprehensive strategy, we have identified some specific strategies that the most successful institutions have in common. Recognizing the coming demographic cliff in traditional-aged students, many ATI members are building pipelines to new populations of students. [5] In particular, more than 65 members have coalesced around two communities of practice: one focused on student veterans and one focused on community college transfer students.
Furthermore, building and sustaining increased socioeconomic diversity requires a different kind of financial model than many ATI institutions have traditionally employed. The most successful institutions have invested significantly more resources in need-based financial aid, and have innovated their overall financial approaches to advance and sustain those investments.
Finally, ATI members recognize that increasing enrollment and degree attainment is only the threshold. The most successful institutions have invested in ensuring that the lower-income students they enroll are able to thrive on campus—because their basic needs are met, because they feel a sense of belonging, and because they have equitable access to all the rich educational opportunities available at these institutions.
In the following sections, we share additional information about the progress of the initiative, the institutional strategies that are contributing to success, and some of the challenges that members will need to overcome to achieve the goal.
Progress to the 50,000-by-2025 Goal
ATI is on track to the goal of enrolling an additional 50,000 low- and middle-income students at the highest graduation rate colleges and universities by 2025, with member institutions making an outsized contribution toward that progress. Yet the most recent year of data from a subset of members shows almost no net gain and variation in the contributions of the members to the 50,000 goal. This serves as a warning sign and spur to redouble our efforts. To foreground the subsequent discussion of the strategies that point to a path forward, this section provides more detail on the characteristics of the ATI-eligible institutions and the ATI members, and unpacks the enrollment trends across the two groups.
ATI-eligible institutions and ATI members
There are currently 320 four-year public and private not-for-profit institutions eligible for membership in ATI, meaning that they have six-year graduation rates consistently above 70 percent. This group, referred to in this report as “ATI-eligible,” changes on a year-to-year basis, as more recent graduation rate data become publicly available.[6] Assuming graduation rates across the country continue to improve, the number of ATI-eligible institutions will increase.[7]
The leaders of all ATI-eligible institutions have the opportunity to endorse the ATI goal and join ATI to participate in the initiative’s activities.
ATI membership has grown from 30 member institutions at its founding in December 2016 to 128 members as of December 2019. The membership includes 91 private, not-for-profit institutions and 37 public institutions, 19 of which are state flagships. Member institutions vary in terms of selectivity, enrollment size, and endowment size. While there are more than double the number of private institutions, public members account for more than two-thirds of the total student enrollment across the membership.
The 128 institutions that have chosen to join ATI enroll a combined 1,357,122 students, or 54 percent of the 2,521,839 enrolled at all ATI-eligible institutions. The share of students who receive a Pell grant—which we use as a proxy for low- and middle-income since it is nationally reported and comparable across all institutions—is 23 percent at ATI member institutions, and 23 percent at all ATI-eligible institutions. By contrast, the Pell share at all other four-year public and private not-for-profit colleges and universities is 37 percent.[8]
Progress across the 320 ATI-eligible institutions: 2015-16 to 2017-18
ATI-eligible institutions are on track to the 50,000-student goal. Between 2015-16, the year before ATI launched, and 2017-18, the 320 ATI-eligible institutions added 20,696 Pell students, which represents more than 40 percent of the 50,000-student goal. The 128 ATI members accounted for a disproportionate 62 percent of this increase, adding 12,837 Pell students between 2015-16 and 2017-18.[9],[10]
The growth in Pell among the ATI-eligible institutions was broad-based:
- 217 institutions increased or maintained Pell enrollment over the two-year period, and 103 institutions declined.
- 110 institutions increased the number of Pell students each year.
- Of the 217 institutions that increased Pell enrollment since 2015-16, 114 reversed a downward trend in Pell enrollment between 2012-13 and 2015-16.
While both public and private institutions saw increases in Pell enrollment during this period, public ATI-eligible institutions contributed a disproportionate share of the increase:
- Public institutions (n=78) added 15,615 Pell students, or 75 percent of the growth. Public institutions enroll 62 percent of students across the ATI-eligible schools.
- Private institutions (n=242) added 5,081 Pell students, corresponding to 25 percent of the growth. Private institutions enroll 38 percent of students across the ATI-eligible schools.
More recent trends at the 120 ATI members that submitted data: 2017-18 to 2018-19
More recent data from 120 of the ATI members suggest that the aggregate growth between 2015-16 and 2017-18 may have leveled off in 2018-19. ATI members submit data each year to provide the initiative with timely, detailed insight—beyond what is available through public sources—on aggregate enrollment and success outcomes for lower-income students in comparison with other students. In 2019, 120 ATI members submitted data through the 2018-19 academic year. (Eight members joined ATI after the collection period ended.)
For those 120 members, there was virtually no net progress in enrolling lower-income students between 2017-18 and 2018-19. While a majority of members increased the number of Pell recipients in the most recent year, other institutions saw declines of a nearly equal number—yielding a net, aggregate increase of only eight Pell students. Many of the institutions with declines had previously increased Pell enrollment between 2015-16 and 2017-18, but saw declines only in the most recent year. If the institutions with declines had simply maintained their Pell enrollments from 2017-18 to 2018-19, ATI members would have collectively increased Pell enrollment by 5,262 students in the most recent year, instead of eight.
In the most recent year, the public member institutions that submitted data (n=34) saw a decline of 1,532 Pell students, while the private member institutions that submitted data (n=86) added 1,540 Pell students.[11] This is a stark contrast from the previous two years, when ATI-eligible publics had a much larger increase in Pell students than eligible private institutions.
A core group of ATI member institutions has consistently enrolled lower-income students at relatively high rates, and their ability to maintain that commitment is critical for ATI to reach its collective goal. Thirty-nine of the 120 member institutions had Pell shares at or above 20 percent in 2015-16, and all but two of those institutions still do as of 2018-19. Other institutions have surpassed that threshold, so currently 45 of 120 ATI members have Pell shares at or above 20 percent.
Figure 1 illustrates the key trends for both the ATI member institutions and all ATI-eligible institutions.
Figure 1: ATI Member and ATI-Eligible Non-Member Pell Enrollment
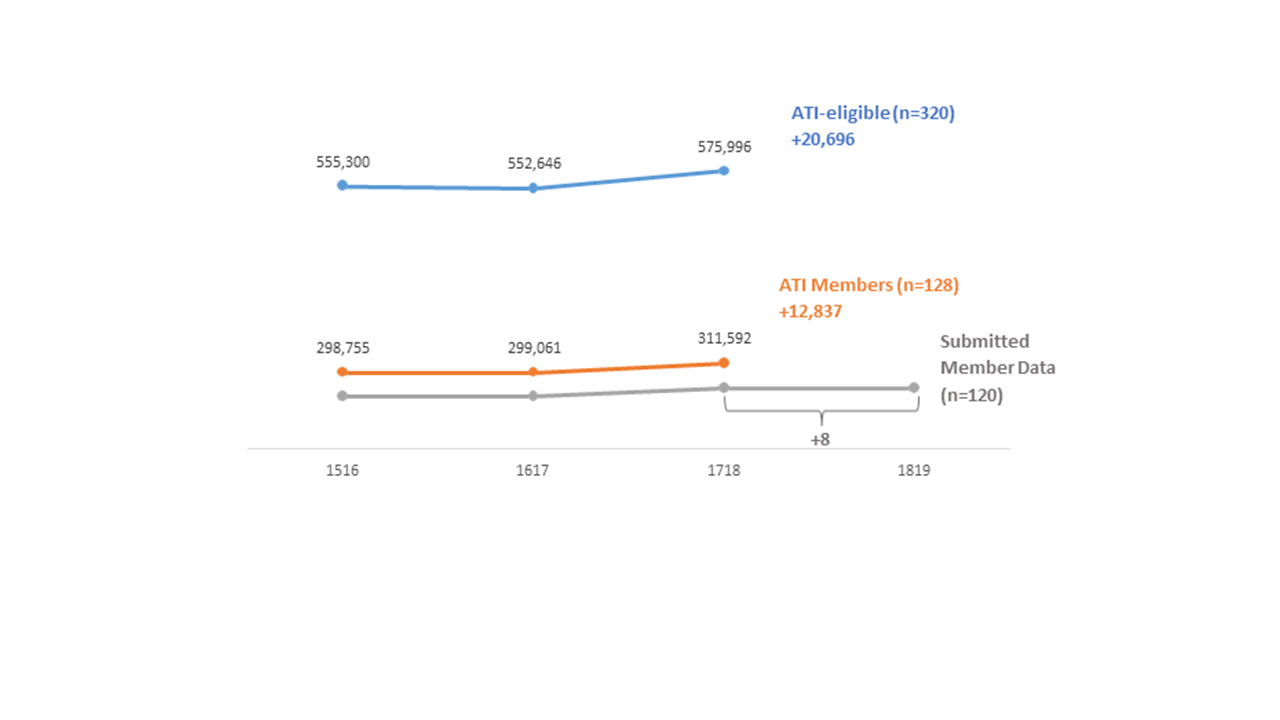
Table 1 lists the top ATI institutions by both Pell growth (2015-16 to 2018-19) and Pell share (2018-19).[12]
Table 1
| Top Institutions by Pell Growth, 2015-16 to 2018-19 | Top Institutions by Pell Share, 2018-19 | ||
|---|---|---|---|
| University of California, San Diego | +1,642 | University of California, Merced | 65% |
| University of California, Merced | +1,260 | University of California, Riverside | 53% |
| George Mason University | +1,125 | Spelman College | 46% |
| University of Illinois at Urbana-Champaign | +986 | University of California, Irvine | 40% |
| University of Michigan-Ann Arbor | +935 | Ripon College | 37% |
| Texas A & M University-College Station | +710 | University of California, San Diego | 37% |
| Boston University | +597 | University of California, Davis | 37% |
| University of California, Irvine | +587 | University of California, Santa Barbara | 36% |
| Washington University in St Louis | +429 | University of California, Santa Cruz | 35% |
| University of California, Riverside | +414 | Allegheny College | 35% |
| Ohio State University-Main Campus | +386 | Knox College | 35% |
| University of Iowa | +383 | University of California, Los Angeles | 32% |
| Drexel University | +371 | George Mason University | 31% |
| Cornell University | +366 | Rutgers University-New Brunswick | 30% |
| College of Saint Benedict | 29% | ||
For additional analyses of this year’s collected data, please see Appendix D.
Strategies for Success
While the reasons for progress are often institution-specific, a set of institutional practices has emerged as highly correlated with maintaining and increasing socioeconomic diversity. In this section, we highlight four key strategies utilized by ATI members:
- Committing to a comprehensive strategy at the leadership and board level, with the investment of resources to support it
- Moving beyond traditional pipelines of incoming students
- Prioritizing need-based aid
- Ensuring that all students are set up to thrive on campus
Committing to a comprehensive strategy at the leadership and board level, with the investment of resources to support it
ATI members that have been most successful in advancing socioeconomic diversity are those whose leaders prioritize and put resources behind a comprehensive strategy for expanded opportunity. Their presidents and boards of trustees show consistent commitment to serving lower-income students, not only in their words, but also in their actions and especially in their budgeting. They empower other leaders on campus to develop and execute a coherent set of plans for the multiple dimensions through which an institution engages and supports lower-income students: building a pipeline through outreach, recognizing lower-income students’ strengths in the admissions process, providing robust need-based financial aid, and ensuring that lower-income students have the supports and opportunities not only to graduate on time but to thrive on campus.
Focusing on one but not all of these dimensions may not yield overall gains. For example, several member institutions have focused on improving the four-year graduation rate of lower-income students as their primary strategy. This is a laudable goal, and there are several instances of noteworthy success. But for some such institutions, an increase in the four-year graduation rate of lower-income students has corresponded with a decrease in the number of lower-income students enrolled: Students who previously would have been on campus for a fifth or sixth year are graduating, and the institution has not enrolled enough lower-income, first-year or transfer students to replace them. The improvement in graduation outcomes is an outstanding accomplishment, but to move the needle on opportunity, an institution must also continue to expand the pipeline of new lower-income students to take advantage of that increased success rate.
By contrast, many ATI members have seen positive results from adopting a comprehensive approach. One such example is the University of California system, all of whose undergraduate campuses are members of ATI. In the 2018-19 school year, the system enrolled 217,116 full-time undergraduate students, 81,173 of whom received Pell grants. The system’s Pell share of 37 percent is higher than nearly all other ATI member institutions, with many UC institutions continuing to increase Pell enrollments. Five UC campuses were in the top 20 ATI members in Pell growth since 2015-16, including University of California, San Diego, which added 1,642 Pell students over the last three years, and University of California, Merced, which added 1,260.
UC San Diego’s progress makes it the top Pell grower among ATI members between 2015-16 and 2018-19. And at 37 percent Pell in the most recent year, UC San Diego has one of the highest shares across ATI members. However, enrollments tell only part of the story. UC San Diego recently launched a Strategic Plan for Inclusive Excellence, which outlines a variety of efforts to ensure that lower-income students are integrated into the fabric of the university. One such effort is to hire more faculty and staff from underrepresented minority populations, increasing the sense of belonging that students from those populations may feel. UC San Diego’s Center for Faculty Diversity and Inclusion contributes to this effort by advocating for inclusive hiring practices, providing skill-based professional development, and establishing communities of support for underrepresented faculty.[13] The university has also paid particular attention to lower-income California residents, establishing the Chancellor’s Associates Scholars Program (CASP). In addition to scholarship funds, students in CASP receive a host of supports throughout their time on campus, including a summer transition program, leadership seminars, and peer and faculty mentoring.[14]
UC San Diego has also taken proactive steps to ensure its lower-income students are retained and graduate. To that end, the institution has set goals through its ATI Collective Impact Framework (CIF) to maintain lower-income enrollment shares, continue need-blind admissions, analyze levels of student belonging and engagement, and—importantly—increase retention and graduation rates for lower-income students by at least 1 percent every two years. As Chancellor Pradeep Khosla articulates it, “By graduating students in a faster timeline, we can bring even more students on campus, serving a larger number of talented, low-income students.”[15]
UC campuses conduct extensive outreach to lower-income students, especially California residents, working closely with K-12 school districts and community colleges across the state. Each year, more than 200,000 students apply for admission to at least one UC campus, and all campuses have need-blind admissions policies.[16] This robust outreach has paid off: In 2018, the UC campuses collectively enrolled 46,485 full-time, first-time students, 34 percent of whom were awarded Pell, and 20,661 entering full-time transfer students, 44 percent of whom were awarded Pell.[17]
The University of California system is often touted as having some of the most generous financial aid in the country, allocating one-third of tuition revenue to aid and providing annual awards averaging around $20,000 per entering student.[18] Although the UC system benefits from relatively high state funding, many campus leaders are going further to commit financially to these low-income students, particularly as affordability receives increased scrutiny.[19] In 2014, University of California, Los Angeles launched its Centennial Campaign, which included a goal of raising $1 billion for financial aid and scholarships. To date, UCLA has raised $664 million, and plans to continue efforts until the goal is met.[20] Chancellor Gene Block has doubled down on these efforts by committing the university to contribute 50 percent in match funds for all scholarship donations between $75,000 and $1 million.[21]
In addition, the UC system recently set an ambitious goal to graduate 90 percent of all students in six years (and 75 percent in four years).[22] Graduating students more quickly not only reduces degree costs for students, but also allows each institution in the UC system the capacity to serve additional students. Setting a directive at the system level makes clear the commitment of system-wide leadership to these efforts.
While still looking to improve, the UCs already have a system-wide, six-year Pell graduation rate of 81 percent, higher than many peer institutions.[23] Hundreds of programs across the nine undergraduate campuses contribute to high levels of persistence and success. For example, all of the UC campuses use analytics to both predict student outcomes based on historical data and to identify at-risk students.[24] University of California, Davis is taking analytics a step further, piloting a dashboard with teaching resources that are customized by student characteristic. University of California, Irvine has focused efforts on connecting multiple cohort programs throughout the institution, allowing students to have smaller, personalized experiences within a larger institutional context.[25] Other campuses have created programs to respond to specific student needs. For instance, University of California, Santa Barbara provides housing vouchers to lower-income students who need emergency aid. Among other emergencies, these vouchers help address any misalignment between financial aid disbursement and rent payment timelines.[26]
A comprehensive commitment to increased access and success is also present at Washington University in St. Louis. WashU added 429 Pell students between 2015-16 and 2018-19, moving its Pell share from 8 percent to 14 percent. This growth surpasses the goal WashU publicly announced in 2015: to achieve 13 percent Pell by 2020. To accomplish this, WashU has invested in an array of interconnected strategies, setting goals in its ATI Collective Impact Framework to increase applications and enrollment numbers, support equitable onboarding of first-year students, improve student engagement, and increase the number of scholarships available. While WashU still enrolls a lower share of Pell students than some of its peers, its significant improvement demonstrates how an institution that recently lagged far behind can make rapid progress in expanding opportunity.[27]
Former chancellor Mark Wrighton, who was in the role from 1995 until May 2019, led the university through a time of huge growth, doubling undergraduate applicants and growing the endowment by more than $5 billion.[28] But even as the institution gained resources and prominence, its enrollment of low- and middle-income students remained strikingly low: With just 6 percent of students receiving Pell grants in 2013, WashU was cited as the “nation’s least economically diverse top college” by the New York Times.[29] This scrutiny, along with an uptick in student activism, led to the setting of an ambitious goal: more than doubling WashU’s Pell share. As an early step, with particular guidance from Provost Holden Thorp and support from former chancellor Wrighton, the Office for Student Success was created to serve as a hub for lower-income students, and the administration allocated an additional $25 million in scholarship funds for lower-income students.
After assuming leadership in June 2019, Chancellor Andrew Martin doubled down on the commitment made by his predecessor, launching two new funding commitments for lower-income students: a startup grant program to cover costs like academic materials, computers, and personal needs, and the WashU Pledge program, which provides financial assistance that covers the full cost of attendance (tuition, fees, room and board) for Missouri and southern Illinois residents from families with incomes below $75,000 and/or who are Pell-eligible. A recent capital campaign yielded $500 million to assist with these new financial aid and scholarship programs.
Chancellor Martin views socioeconomic diversity as the priority of the institution, firmly believing it is the right thing to do and infusing this messaging throughout his communications with students, faculty, and the public. Significantly, in his inaugural address, Martin announced a commitment to moving from need-aware admissions (where a student’s financial need is considered in application decisions) to a need-blind approach, framing the commitment as a moral responsibility. He also shared his commitment to continuing to provide students with the resources they need to thrive once they have matriculated.[30]
Beyond financial support, WashU has worked to achieve a culture of belonging across the university. One initiative within the Office for Student Success is the Deneb STARS program, which connects lower-income students in cohorts and provides them with mentorship, professional development, academic resources, and social programs. Looking ahead, the university plans to focus on ensuring that its academic offerings, particularly introductory classes, are fully inclusive of its diversifying student population.
Knox College has an endowment of about $178 million, one of the smallest of any ATI member.[31] Yet Knox has made a resounding commitment to enrolling lower-income students sustainably. In the most recent year, 35 percent of Knox students were awarded Pell grants.
The institution’s founders made this commitment to socioeconomic diversity in 1837, and a deep sense of mission is still embedded in the institution today. President Teresa Amott, who has led the college since 2011, ties this mission to the educational growth of students, emphasizing that “students will learn the most from the people least like them. That’s the core educational dimension of our community.”[32]
Despite the strong sense of mission, this commitment has not been easy—like many small-endowment liberal arts institutions, Knox has been forced to make some tough choices to respond to financial constraints. For example, the institution thinks critically about the decision to fill every vacancy, in an effort to keep labor costs in control. President Amott notes, “For every vacancy, we ask if the position has a strong impact on the student experience. If so, we have to replace it. If not, we think about whether we do. We have to be leaner and more efficient.”[33]
Knox is not able to meet the full need of all students given its financial status, which likely results in some qualified lower-income students not being able to attend the institution. However, despite not having high levels of resources, Knox has found low-cost ways to foster a sense of belonging for students who are on campus. For example, the college has a “share shop,” a place for students to bring things they no longer use, and, conversely, pick up items they need at no cost. Every student, regardless of need, also receives a “Power of Experience” grant of $2,000, to be used to support unpaid summer internships, study abroad expenses, and costs associated with other high-impact experiences. While relatively inexpensive for the institution, these efforts to build a sense of community and belonging have paid off: The six-year graduation-rate gap between Pell students and Knox students overall declined from 12 percentage points for the 2010 cohort to just 4 percentage points for the 2012 cohort.
Institutions where leaders develop and resource a comprehensive strategy to increase opportunity are able to maintain high levels of socioeconomic diversity or make consistent progress each and every year. Thirty-five ATI members have maintained Pell shares at or above 20 percent every year since 2015-16, including Rutgers University-New Brunswick, University of Massachusetts Amherst, University of Illinois at Urbana-Champaign, Vassar College, and Wabash College. Thirty-three ATI member institutions have increased Pell enrollment in each year, including Princeton University, Yale University, Claremont McKenna College, University of Dayton, and the University of Michigan. See Table 1, above, for a list of the top institutions by Pell growth and Pell share.
Moving beyond traditional student pipelines
The conventional view of four-year college students as recent high-school graduates attending their first higher education institution as dependents of their parents is no longer the norm. In fact, the share of today’s undergraduates who are over 25 years old is greater than the share who live on campus. Many of them come from low- and middle-income backgrounds and are exactly the type of talented students that ATI members have committed to serve.
Indeed, effort to expand educational opportunity and truly cultivate the nation’s talent must include a focus on older students and those who have some college experience. Not only is it the right thing to do, but for many colleges that have not moved beyond high school graduates as their core constituency, broadening the pipeline of talent is a matter of necessity. Various demographic trends are contributing to projections of a steep drop in the population of traditional-aged college students.[34]
One key way ATI members are broadening the pipeline is by enrolling transfer students who started at community colleges. George Mason University has made community college transfer a central part of its effort to close equity gaps in bachelor’s attainment and meet workforce demands in its region. In the 2018-19 school year, Mason enrolled 2,213 new transfer students, about 40 percent of whom were Pell students. Seventy-three percent of these transfers to Mason originate from neighboring Northern Virginia Community College (NOVA). Furthermore, nearly half of the university’s graduating class each year are transfer students.[35] About one in ten NOVA-Mason transfer students come through the Pathway to the Baccalaureate program, Mason and NOVA’s longstanding partnership aimed at increasing attainment amongst historically underserved populations.[36] Pathway identifies local high school students as early as 10th grade and provides them with individualized programming to support their transition from high school to NOVA, and subsequent transfer to Mason or another four-year institution of the student’s choice. Despite the vast majority of Pathway students hailing from lower-income, first-generation, and/or other underserved communities, over 80 percent of Pathway’s transfers to Mason complete their bachelor’s within three years of transferring.
To reinforce their shared commitment to transfer student success, Mason and NOVA have intensified their efforts to pave seamless pathways for community college students through the development of the ADVANCE program. ADVANCE students at NOVA take select classes at Mason while enrolled at NOVA, receive dedicated advising and mentoring, benefit from coordinated curricula for seamless credit transfer, and gain automatic admission to Mason as long as they meet program requirements.[37] They ultimately receive both an associate degree from NOVA and a bachelor’s degree from Mason.
Coordinated pathways programs thrive at other ATI member institutions as well, such as the University of Central Florida and University of North Carolina-Chapel Hill. At the University of Central Florida, the DirectConnect to UCF program guarantees admission to UCF for graduates of six local state colleges and coordinates advising at both the colleges and UCF. DirectConnect to UCF and other transfer students make up almost half of UCF’s student population and are posting successful outcomes.[38] In the 2018-19 academic year, UCF awarded 8,745 bachelor’s degrees to transfer students, representing 62 percent of all bachelor’s degrees awarded that year. Between Fall 2015 and Fall 2018, UCF increased its Pell enrollment by 1,191 students, demonstrating that broadening the student pipeline is a valuable strategy to increase socioeconomic diversity.[39]
At the University of North Carolina-Chapel Hill, the Carolina Student Transfer Excellence Program (C-STEP) also establishes a transfer student pathway through partnerships between state community colleges and the university. Students admitted to the C-STEP program receive a host of supports, including academic advising and peer mentoring, and ultimately transfer to UNC. Since the program launched in 2006, 84 percent of C-STEP students have graduated from UNC.[40]
These institutions are not alone among ATI members in their commitment to community college transfer. To date, 28 institutions have joined together to focus on improving access and success for community college transfer students. The community of practice convened in October 2019 for a full-day meeting, where teams from ATI member institutions shared best practices and strategized about building and strengthening partnerships between two-year and four-year institutions, smoothing credit transfer, and improving transfer student belonging and success.
Another strategy to broaden the pipeline at ATI colleges is to focus on enrolling U.S. military veterans, a population that has long been underrepresented at high-graduation-rate institutions, despite evidence demonstrating that veterans thrive when they do attend.[41] Furthermore, as most veterans are eligible for GI Bill or other higher education benefits, expanding opportunity for student veterans is both mission-aligned and financially feasible. Forty-one ATI member institutions have formed a community of practice focused on veterans’ access and success, which also convened in October 2019, to address challenges and share best practices related to veterans outreach and admissions, benefits, academics, and student life.
One ATI institution that is a leader in veterans’ enrollment is Columbia University, which enrolled more than 450 veterans in the 2018-19 school year—one of the largest veteran populations among all private not-for-profit institutions nationally. Columbia actively recruits veterans and strives for inclusivity once they enroll. Most are enrolling in Columbia’s School of General Studies (GS). GS hosts veterans-specific on-campus events and provides a variety of useful resources to help veterans navigate their time on campus. Notably, GS allows veterans to transfer a large share of their previously earned credits into a degree program.
Within the veterans community of practice, many members have been enrolling large numbers of student veterans for some time, like The Ohio State University and Penn State University. Others have set ambitious goals to serve more student veterans and serve them better. For example, the University of Michigan has enrolled close to 40 new military-connected undergraduates (veteran, National Guard, reserve, and active-duty), resulting in an increase of 20 percent over the past two years.[42] The University of Dayton has dedicated resources to establish a veteran and military service strategy and infrastructure that spans recruitment through graduation. Similarly, Indiana University is using institutional data to track veterans’ applications and admissions offers, increase veteran enrollment, and improve their retention and graduation rates. Harvard University has established a recruitment position specifically for engaging community colleges and regional veterans offices. Other institutions, like Allegheny College and Pomona College, have set preliminary goals to increase veteran enrollment.
Enrolling community college transfers and student veterans furthers ATI’s broader socioeconomic diversity goal. In the 2019 ATI data collection, we found that among a significant subset of ATI community of practice member institutions, 38 percent of veteran students and 36 percent of community college transfers were Pell recipients.[43]
Prioritizing need-based aid
Building and sustaining increased socioeconomic diversity requires a different kind of financial model than many ATI institutions have traditionally employed. The most successful institutions have invested significantly more resources in financial aid, ensuring that lower-income students have adequate support while enrolled. It is certainly a challenge to commit to affordability and a solid financial strategy while enrolling significant shares, or increasing numbers, of lower-income students, particularly at smaller institutions that are more dependent on tuition revenue. Nevertheless, some ATI members have shown that it is possible.
Centre College increased Pell enrollment from 14 percent in 2015-16 to 22 percent in 2018-19, while simultaneously increasing the average amount of institutional aid awarded to students by more than 12 percent.[44] A major campaign gift in 2014 created the Grissom Scholars Program, providing 10 full-tuition-plus scholarships annually to talented first-generation students. With the graduation of its first cohort in 2019, Centre has seen its overall first-generation entering cohorts more than double, from 8 to 21 percent, and its overall first-generation student population increase from 9 to 18 percent. Centre has demonstrated its commitment to affordability through its Third Century Campaign, a fundraising effort completed in 2019 that exceeded by $10 million its $200 million goal, 65 percent of which is designated to fund financial aid and scholarships.[45]
While ATI uses Pell enrollment to measure progress to its goal, many ATI members are committing to increasing socioeconomic diversity by broadening access to students whose family incomes slightly exceed the Pell cutoff.[46] The Ohio State University, for example, has increased its Pell enrollment by 386 students since 2015-16, largely through strategic finance and fundraising for need-based aid. Ohio State has also set goals to increase enrollment and retention of students just above the Pell-eligibility threshold, and is exploring strategies on how to achieve these goals. The President’s Affordability Grant program provides differentiated levels of grant support for students, depending on whether they are low-income or middle-income.[47]
University of California, Davis has also focused on middle-income students through its Aggie Grant Plan. The plan covers up to 30 percent of tuition and fees for students with family incomes between $80,000 and $120,000.[48] The plan supplements the UC system-wide Middle Class Scholarship, which provides a scholarship of up to 40 percent of tuition and fees for students with family incomes of up to $177,000.[49]
Colby College recently announced an expansion to its financial aid program to ensure affordability for both low- and middle-income families. In addition to a no-loan policy and a guarantee that families with incomes up to $65,000 and typical assets have a parent or guardian contribution of $0, the new Fair Shot Fund aims specifically at middle-income families by capping the parent/guardian contribution at $15,000 for families making up to $150,000 with typical assets.[50] These financial aid policies are made possible through a combination of institutional funds and donor support.[51]
Ensuring that all students are able to thrive on campus
The most successful ATI institutions recognize that simply enrolling more lower-income students is not enough; they must also take proactive steps so that their campus policies, supports, and culture provide all students with the opportunity to have meaningful and successful educational experiences. Accordingly, these institutions have focused on ensuring that students’ basic needs are met, promoting a sense of belonging, providing equitable access to co-curricular and extracurricular experiences, and instilling equity in the academic experience.
Claremont McKenna College has increased the share of Pell grant recipients in its entering class from 12 percent in 2016 to 20 percent in 2019; the share of first-generation students increased from 9 percent in 2014 to 21 percent in 2019. Consistent with its small size and culture, CMC has developed campus-wide programs that support its increasingly diverse campus community in a personalized way, on the basis of each student’s strengths, needs, and connection to college mission. These include: ten Scholar Communities, cohorts that receive academic counseling and career support, including guaranteed first-year summer experience funding and summer savings; the Kravis Opportunity Fund, which aims to remove a wide array of financial barriers beyond the cost of attendance; and the CARE Center, which helps members of the campus community develop the skills needed to have difficult conversations and identify with one another across social barriers or ideological difference. To finance these and other similar efforts, CMC has raised over $200 million since 2014.
Amherst College launched its efforts to increase socioeconomic diversity in the early 2000s, steadily increased its Pell enrollment for over a decade, and has maintained a Pell share of roughly 24 percent since 2015-16. More recently, Amherst has focused extensively on strengthening the student experience. It recently launched the Meiklejohn Fellows program, which provides first-generation and low-income students services such as dedicated academic advising, funds for unpaid internships, and career development programming.[52] This year, Amherst also launched its Financial Aid Peer Ambassador Program. Trained peer ambassadors hold office hours four times a week, focused on topics of particular salience for lower-income students, like securing employment, navigating study abroad, budgeting, and making sound decisions regarding student loans.
The University of Iowa has added 383 Pell students since 2015-16, bringing its Pell share to 20 percent. Iowa has made a specific commitment to rural students, a population that is often underrepresented at high-graduation-rate institutions, despite being well-qualified to succeed.[53] Iowa’s Rural Scholars program seeks to enrich rural students’ on-campus engagement through research opportunities in STEM fields, including a return trip to a student’s hometown to showcase what they have learned.
Aiming to strengthen connections between a student’s work experience, their academic endeavors, and the belonging felt on campus, Iowa has also established the GROW intervention. GROW, which stands for “Guided Reflection on Work,” is a model for conversations between student employees and their supervisors aimed at treating on-campus employment as a high-impact experience for students. Students who participate in GROW are more likely to be retained and much more likely to be able to articulate specific competencies they have gained from employment.[54]
ATI members are also focusing on these issues in partnership. Teams from 18 ATI member institutions—including Amherst and Iowa—came together to discuss and develop strategies related to these issues in June 2019 at the Summer Institute on Equity in the Academic Experience, an experience organized by Georgetown University and the University of Texas at Austin, with support from the American Talent Initiative.[55]
Challenges Need Not Prevent Progress
The efforts of these and dozens of other ATI member institutions yielded a significant expansion of opportunity for thousands of students over the past few years. But progress has not been linear, and in the most recent year, continued improvements in lower-income enrollment at a majority of ATI members was counterbalanced by declines at other institutions. We have confidence that the aggregate numbers can resume their upward trajectory—after all, aggregate Pell counts for this group were flat or even down for several years before 2016, and jumped by thousands in just two years. But to raise the likelihood of getting back on track, it is important to understand the challenges that may make progress harder.
As mentioned, the United States is on the precipice of a demographic cliff, and traditional college students will become far scarcer. Some ATI members are located in or draw from regions where high school cohorts have already experienced declines. The process of adapting to these changes is important and difficult, and can be slower in some institutions than others.
Some institutions, in the face of demographic challenges, have adapted their business models not only to sustain themselves, but to continue to serve a socioeconomically diverse student body. These examples are both instructive and encouraging. For instance, Saint Michael’s College, anticipating a trend of declining student enrollment, opted to proactively decrease instructional staff by 19 percent since 2009 – a prudent, although assuredly difficult, choice. Despite declines in student enrollment and instructional staff, Saint Michael’s has been able to maintain its Pell share.[56]
Among the ATI members that decreased Pell enrollment in the most recent year, 80 percent of the decline occurred at public institutions. For those institutions, declining state investment in higher education represents a major threat to opportunity. While recent data indicate that higher education funding is beginning to stabilize, longer-term trends are gloomier, with 45 states spending less per student in 2018 than in 2008, after adjusting for inflation. These decreases were not specific to the 2008 financial crisis: In 31 states, state per-student funding decreased between 2017 and 2018.[57] Decreases in state funding can result in higher tuition costs and reduced institutional spending on academic and student success programming, all of which disproportionately affects lower-income students.[58], [59]
Yet several ATI-member public institutions have made significant gains in lower-income enrollment, or maintained already high shares, in the face of some of the deepest cuts, indicating that state funding challenges and prioritizing socioeconomic diversity can occur concurrently. For example, the state of Illinois was without a complete budget from mid-2015 to mid-2017, with large ramifications for higher education funding; and yet, with a leader committed to expanding opportunity and a strategy of increasing total student body size, the University of Illinois was able to add 986 Pell students between the 2015-16 and 2018-19 school years.[60] Other ATI public institutions that increased Pell enrollment between 2015-16 and 2018-19 despite state funding declines since 2008 include the University of Iowa (+383 Pell students, 28 percent decline in per-student funding), the University of Wisconsin (+316 Pell students, 23 percent funding decline), and the University of Delaware (+153 Pell students, 26 percent funding decline).[61]
A third challenge: Some ATI members have reported decreases in the yield of lower-income students—measured as the number who accept admission offers—resulting in lower-than-expected Pell enrollment. And recently, the National Association for College Admissions Counseling, under pressure from the Justice Department, changed its rules to permit colleges to offer financial inducements to students committed through early or regular decision to another institution. This seems likely to exacerbate the competition for talented low-income students.[62] And yet, there are large numbers of talented lower income students graduating from high school and community college, or separating from the military, for whom none of the ATI colleges are currently competing. By expanding the pipeline, they do not have to engage in this kind of zero-sum game.
Conclusion
Two years after the start of the American Talent Initiative, 20,696 more low- and middle-income students are enrolled at the 320 colleges and universities with the highest graduation rates than in the year before the initiative launched. This progress represents more than 40 percent of the way toward the initiative’s goal of enrolling 50,000 additional lower-income students at those institutions by 2025. The 128 ATI members—those colleges and universities whose presidents have endorsed the goal and committed to work with one another to achieve it—are leading the way, contributing a disproportionate share of the increase. There is much to celebrate in these results, most importantly the thousands of talented, lower-income young people who now have the opportunity to take advantage of all these institutions have to offer.
At the same time, future progress is far from certain. Data from the most recent academic year for 120 of the member institutions reveal that aggregate progress has leveled off, with those institutions collectively enrolling nearly the same number of lower-income students in 2018-19 as they did in 2017-18. There is plenty of room for hope; many ATI members are continuing to expand opportunity, pointing the way forward for others. What we know now is that substantial progress can be sustained through a combination of strategies: a consistent commitment and resources from leadership, pipelines for new kinds of students, high levels of need-based financial aid, and efforts to ensure that all students thrive on campus.
Leaders of high-graduation-rate colleges and universities face many competing priorities and— even though their institutions tend to be wealthier than those in other sectors of higher education—they have a finite set of resources and political capital with which to address these challenges. Each priority has its own constituencies, and those advocating for other priorities are often louder than those speaking on behalf of lower-income students. It is all too easy for campus leaders and boards of trustees—even those committed to expanding opportunity in principle—to spend their capital on something else. One of the aims of the American Talent Initiative is to raise the priority level of increasing socioeconomic diversity by making it a shared aim of peer institutions; by bolstering not only the member institutions’ know-how, but also their stake in the mission.
We believe the results over the first three years of the initiative provide evidence that the initiative is having its intended effect. They also show that we need to keep our foot on the gas.
Appendix A: ATI Member List
As of December 2019, the American Talent Initiative has 128 members.
| Allegheny College | Meadville, PA |
| American University | Washington, DC |
| Amherst College | Amherst, MA |
| Bard College | Annandale-On-Hudson, NY |
| Barnard College | New York, NY |
| Bates College | Lewiston, ME |
| Baylor University | Waco, TX |
| Boston University | Boston, MA |
| Bowdoin College | Brunswick, ME |
| Brown University | Providence, RI |
| Bryn Mawr College | Bryn Mawr, PA |
| Bucknell University | Lewisburg, PA |
| California Institute of Technology | Pasadena, CA |
| Carleton College | Northfield, MN |
| Case Western Reserve University | Cleveland, OH |
| Centre College | Danville, KY |
| Claremont McKenna College | Claremont, CA |
| Colby College | Waterville, ME |
| College of the Holy Cross | Worcester, MA |
| College of Saint Benedict | St. Joseph, MN |
| Columbia University | New York, NY |
| Connecticut College | New London, CT |
| Cornell University | Ithaca, NY |
| Dartmouth College | Hanover, NH |
| Davidson College | Davidson, NC |
| Denison University | Granville, OH |
| Dickinson College | Carlisle, PA |
| Drexel University | Philadelphia, PA |
| Duke University | Durham, NC |
| Elizabethtown College | Elizabethtown, PA |
| Emory University | Atlanta, GA |
| Fordham University | New York, NY |
| Franklin & Marshall College | Lancaster, PA |
| George Mason University | Fairfax, VA |
| Georgetown University | Washington, DC |
| Georgia Institute of Technology | Atlanta, GA |
| Gettysburg College | Gettysburg, PA |
| Hamilton College | Clinton, NY |
| Harvard University | Cambridge, MA |
| Haverford College | Haverford, PA |
| Hobart & William Smith Colleges | Geneva, NY |
| Illinois Institute of Technology | Chicago, IL |
| Indiana University Bloomington | Bloomington, IN |
| James Madison University | Harrisonburg, VA |
| Johns Hopkins University | Baltimore, MD |
| Juniata College | Huntingdon, PA |
| Kenyon College | Gambier, OH |
| Knox College | Galesburg, IL |
| Lafayette College | Easton, PA |
| Lawrence University | Appleton, WI |
| Lebanon Valley College | Annville, PA |
| Lehigh University | Bethlehem, PA |
| Marist College | Poughkeepsie, NY |
| Massachusetts Institute of Technology | Cambridge, MA |
| Miami University | Oxford, OH |
| Middlebury College | Middlebury, VT |
| Muhlenberg College | Allentown, PA |
| New York University | New York, NY |
| Northwestern University | Evanston, IL |
| Occidental College | Los Angeles, CA |
| Pennsylvania State University | State College, PA |
| Pomona College | Claremont, CA |
| Princeton University | Princeton, NJ |
| Rhode Island School of Design | Providence, RI |
| Rice University | Houston, TX |
| Ripon College | Ripon, WI |
| Rutgers University | New Brunswick, NJ |
| Saint Mary’s College of Maryland | Saint Mary’s City, MD |
| Saint Michael's College | Colchester, VT |
| Smith College | Northampton, MA |
| Southern Methodist University | Dallas, TX |
| Spelman College | Atlanta, GA |
| Susquehanna University | Selinsgrove, PA |
| Stanford University | Stanford, CA |
| Stevens Institute of Technology | Hoboken, NJ |
| Swarthmore College | Swarthmore, PA |
| Texas A&M University | College Station, TX |
| Texas Christian University | Fort Worth, TX |
| The Ohio State University | Columbus, OH |
| The College of Wooster | Wooster, OH |
| Trinity College | Hartford, CT |
| University of California, Berkeley | Berkeley, CA |
| University of California, Davis | Davis, CA |
| University of California, Irvine | Irvine, CA |
| University of California, Los Angeles | Los Angeles, CA |
| University of California, Merced | Merced, CA |
| University of California, Riverside | Riverside, CA |
| University of California, San Diego | La Jolla, CA |
| University of California, Santa Barbara | Santa Barbara, CA |
| University of California, Santa Cruz | Santa Cruz, CA |
| University of Central Florida | Orlando, FL |
| University of Chicago | Chicago, IL |
| University of Dayton | Dayton, OH |
| University of Delaware | Newark, DE |
| University of Denver | Denver, CO |
| University of Illinois at Urbana-Champaign | Champaign, IL |
| University of Iowa | Iowa City, IA |
| University of Maryland, College Park | College Park, MD |
| University of Massachusetts Amherst | Amherst, MA |
| University of Miami | Miami, FL |
| University of Michigan – Ann Arbor | Ann Arbor, MI |
| University of Minnesota | Minneapolis, MN |
| University of Notre Dame | Notre Dame, Indiana |
| University of North Carolina at Chapel Hill | Chapel Hill, NC |
| University of Pennsylvania | Philadelphia, PA |
| University of Pittsburgh | Pittsburgh, PA |
| University of Richmond | Richmond, VA |
| University of South Carolina | Columbia, SC |
| University of Southern California | Los Angeles, CA |
| University of St. Thomas | Saint Paul, MN |
| University of Texas at Austin | Austin, TX |
| University of Tennessee, Knoxville | Knoxville, TN |
| University of Virginia | Charlottesville, VA |
| University of Washington | Seattle, WA |
| University of Wisconsin – Madison | Madison, WI |
| Vanderbilt University | Nashville, TN |
| Vassar College | Poughkeepsie, NY |
| Virginia Tech | Blacksburg, VA |
| Wabash College | Crawfordsville, IN |
| Wake Forest University | Winston-Salem, NC |
| Washington & Lee University | Lexington, VA |
| Washington University in St. Louis | St. Louis, MO |
| Wesleyan University | Middletown, CT |
| William & Mary | Williamsburg, VA |
| Williams College | Williamstown, MA |
| Wofford College | Spartanburg, SC |
| Worcester Polytechnic Institute | Worcester, MA |
| Yale University | New Haven, CT |
Appendix B: ATI Eligibility Criteria
Each year, ATI staff use data on colleges and universities’ six-year graduation rates from the National Center for Education Statistics (NCES) to determine the list of institutions that are eligible to participate in ATI. As of December 2019, there are 320 colleges and universities in the United States that meet the ATI eligibility criteria.
Using graduation rate data from academic years 2012-13 to 2016-17, we apply the following criteria to determine eligibility:
- The institution must be:
- Primarily located in the United States,
- Title IV-granting, and
- A four-year public or private, not-for-profit.
- Of those 2,324 institutions, the institution must:
- Enroll 500 or more undergraduate students in the most recent year of data (currently 2016-17);
- For at least three of the last five years (currently, 2012-13 through 2016-17), achieve a six-year graduation rate of 70 percent or higher.
- Any institution that does not meet the above criteria may be eligible if:
- The institution belongs to a state university system that, across all campuses, has an average six-year graduation rate of 70 percent or more.
Note: To be included, institutions must have six-year graduation rate data for all of the last five years, and must not have any obvious data anomalies or accreditation issues. Institutions belonging to the following Carnegie classes are also excluded: Special Focus Four-Year: Faith-Related Institutions and Special Focus Four-Year: Medical Schools & Centers. We plan to update the ATI eligibility list in Spring 2020 using updated 2017-18 graduation rate data.
Appendix C: Overview of ATI Data
The 2019 ATI data collection consisted of two parts, the “essential” collection and the “recommended” collection. In both collections, we requested that members submit data only on full-time, bachelor’s degree-seeking students. This request differs slightly from data on Pell enrollment that are publicly available through the National Center for Education Statistics (NCES), which include part-time students and non-bachelor’s-degree-seeking students.
Specifically, the data elements included in each collection are listed below:
- One hundred and twenty members submitted the following core data elements:
- Enrollment counts for all students and Pell students in the following categories:
- Students in the entering cohort (i.e., first-time, first-year students)
- All students enrolled
- Students who enter as transfer students
- All first-generation students enrolled
- For public institutions only: students who enter as “campus changers,” meaning they entered the ATI member institution from a different campus within the same university system
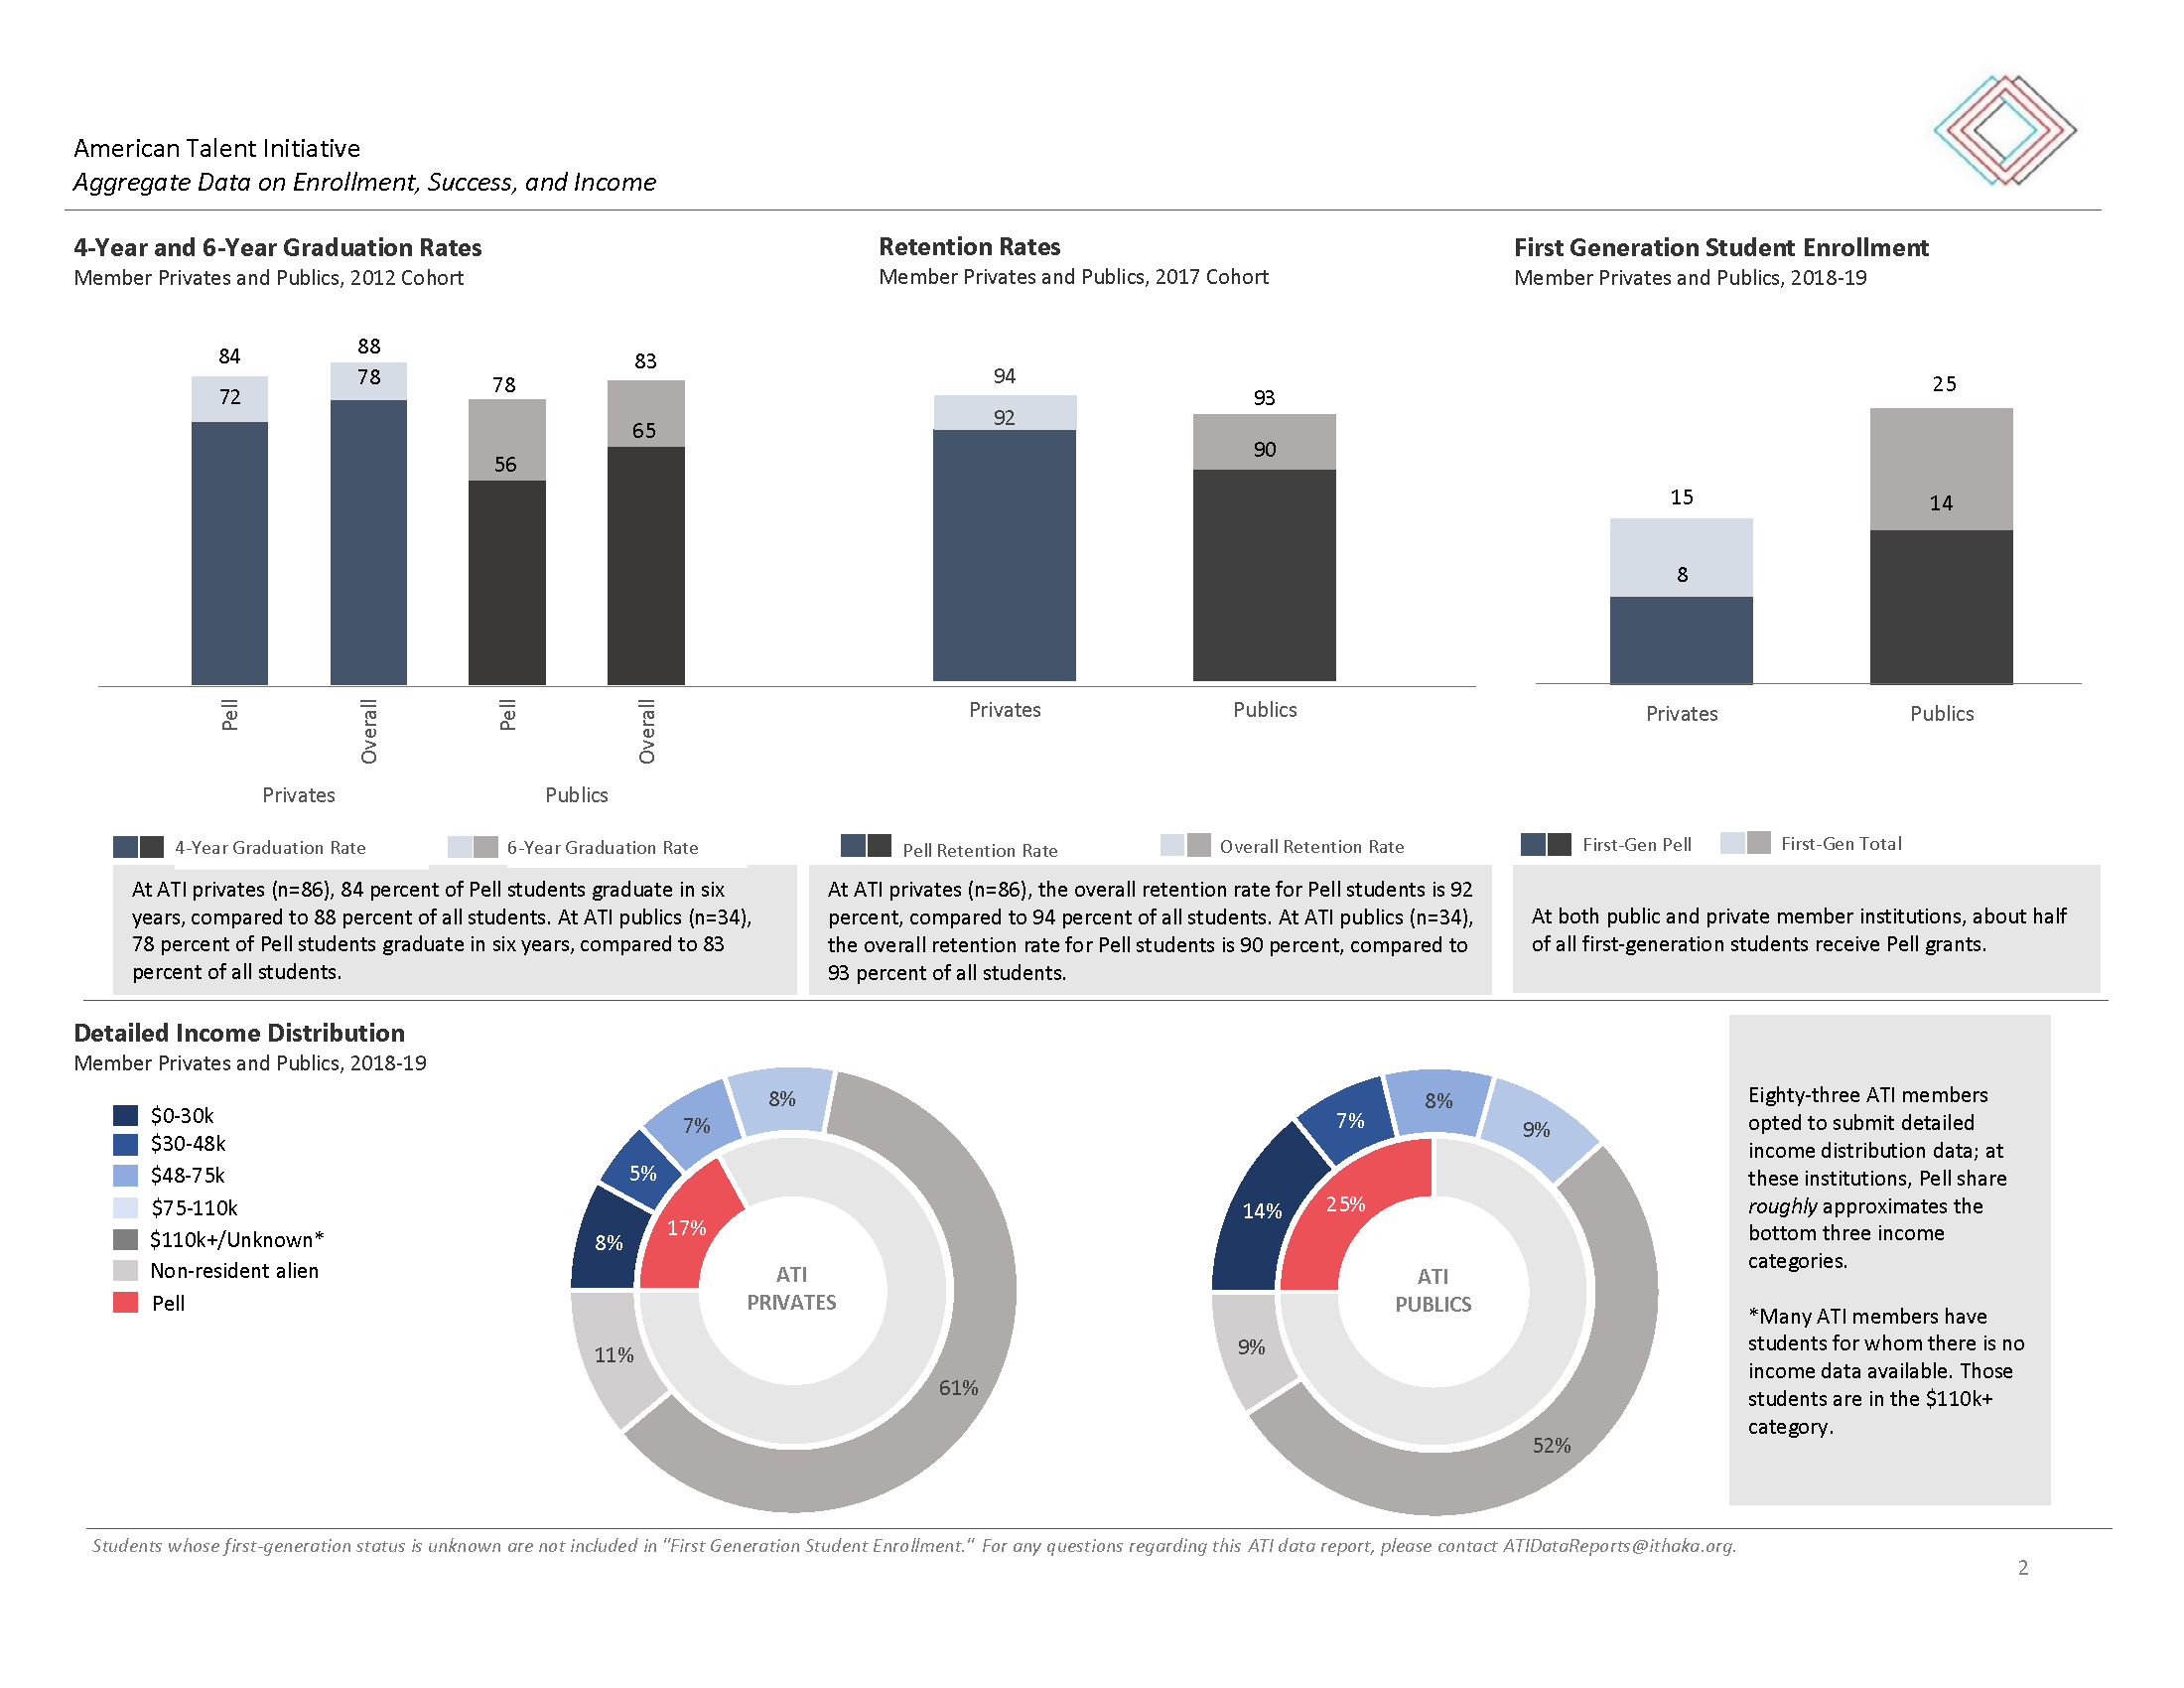
- Four- and six-year graduation rates
- First-to-second-year retention rates
- Enrollment counts for all students and Pell students in the following categories:
- Eighty-three members submitted the following optional data elements:
- All students enrolled whose families earned incomes in the following categories:
- $0-30,000
- $30,001-48,000
- $48,001-$75,000
- $75,001-110,000
- $110,001 and above
- We also requested enrollment counts for:
- All students enrolled for whom the institution had no family income data available.
- All students enrolled who were not U.S. residents (NCES refers to these students as “nonresident aliens”). Nonresident alien students, except for DACA students, were excluded from the income counts above.
- All students enrolled whose families earned incomes in the following categories:
- Eight ATI members joined the initiative after the 2019 data collection concluded.
- Members in the Veterans Community of Practice and Transfer Community of Practice also submitted enrollment data specific to those subpopulations.
To learn more about our data collection process, including our data definitions and our approach to collecting and aggregating data from ATI institutions, please email Emily Schwartz (Emily.Schwartz@ithaka.org).
Appendix D
Endnotes
- Cahalan, M., Perna, L., Yamashita, M., Ruiz, R., & Franklin, K. (2016). Indicators of Higher Education Equity in the United States: 2016 Historical Trend Report. Pell Institute for the Study of Opportunity in Higher Education. ↑
- 2 Jones, J.M. (2018) Confidence in Higher Education Down since 2015. Gallup. ↑
- Authors’ analysis of Opportunity Insights data. ↑
- Hoxby, C & Avery, C. (2013). The Missing “One-Offs”: The Hidden Supply of High-Achieving, Low-Income Students. Brookings Papers on Economic Activity; LaViolet, T., Fresquez, B., Maxson, M., & Wyner, J. (June 2018). The Talent Blind Spot: The Case for Increasing Community College Transfer to High Graduation-Rate Institutions. The American Talent Initiative. ↑
- Mathewson, T.G. (2015). NCES Data: Most College Students are ‘Nontraditional.’ Education Dive.; Zinshteyn, M. (2016). Colleges Face a New Reality, as the Number of High School Graduates will Decline. The Hechinger Report. ↑
- For more information about the process for determining ATI eligibility, please refer to Appendix B. ↑
- National Center for Education Statistics. (2018). Table 326.10 Graduation Rates, 1996 to 2011. Digest of Education Statistics. ↑
- Data from ATI member data submissions and the Integrated Postsecondary Education Data System. Please see endnote 9 for additional information about the two data sources. ↑
- Analyses that report enrollment trends for the 320 ATI-eligible use two sources of data – 1) member-submitted data for the 120 ATI members that participated in ATI’s 2019 data collection and 2) publicly available data for the eight ATI members that joined after the 2019 data collection and for the 192 ATI-eligible non-members. The data submitted by 120 ATI members include only full-time, bachelor-degree-seeking undergraduates, while the publicly available data include all undergraduates, regardless of degree-seeking or full/part-time status. Since the differences in the data sources persist across all years, we can reliably measure changes over time. Analyses in this report use the data on file as of January 15, 2020. ↑
- During this time period, ATI-eligible institutions also increased the total enrollment of students. ATI-eligible publics collectively added 63,606 students between 2015-16 and 2017-18, with ATI-eligible privates adding 1,458 students. While the details vary from institution to institution, a common approach to increasing Pell enrollment, especially among public institutions, has been to increase total enrollment, with a disproportionate increase in Pell students. The 2018 ATI Impact Report provides additional detail on this approach. ↑
- While there are more private institutions than public institutions, the private institutions are smaller, and therefore represent just 32 percent of enrolled students across the 120 members. ↑
- This table only includes institutions from the 120 members that submitted data through 2018-19 and gave approval to be included in the table. ↑
- University of California, San Diego. (2020). Center for Faculty Diversity and Inclusion. ↑
- University of California, San Diego. (2019). Chancellor’s Associates Scholars Program. ↑
- ATI Interview with Chancellor Khosla, 2020. ↑
- UC Office of the President. (2017). UC Applications Break Records for 13th Consecutive Year. ↑
- ATI Analysis of members’ submitted data. ↑
- Watanabe, T. (2017). UC Regents Seek Ways to Expand Financial Support and Speed Graduation. Los Angeles Times; Watanabe, T. (2017). New Study: When it Comes to Financial Aid, UC is the Most Generous of Top Public Universities. Baltimore Sun. ↑
- University of California. (2017). Total Cost of Attendance Working Group Final Report. ↑
- Data provided by the University of California, Los Angeles. ↑
- Hoang, K-V. (2018). UCLA Crosses $4.2 Billion Fundraising Goal, Lags Behind in Scholarship Funding. Daily Bruin. ↑
- University of California. (2019). UC’s Ambitious Plan to Help More Students Earn a Degree. ↑
- University of California. (2019). Accountability Report 2019. ↑
- University of California. (2016). How Big Data is Helping Students Graduate on Time. ↑
- UC Irvine was featured as a leader amongst ATI members for its efforts toward socioeconomic diversity on page 15 of the 2018 ATI Impact Report. ↑
- University of California, Santa Barbara. (2019). The Housing Voucher Program. ↑
- Leonhardt, D. (2015). The Least Economically Diverse Top College, Seeking to Change. The New York Times; Jenkins, W. (2019). Washington U. Is No Longer America’s Least Economically Diverse College. Is That Good Enough? The Chronicle of Higher Education. ↑
- Hemphill, E. (2019). Mark Wrighton Talks Legacy As Wash U Chancellor, Future At Better Together. KBIA. ↑
- Leonhardt, D. (2015). The Least Economically Diverse Top College, Seeking to Change. The New York Times. ↑
- Washington University in St. Louis. (2019). Chancellor Andrew D. Martin’s Inaugural Address. ↑
- The Chronicle List. (2019). Which Colleges Have the Largest Endowments? The Chronicle of Higher Education. ↑
- ATI interview with President Amott, 2019. ↑
- ATI interview with President Amott, 2019. ↑
- Grawe, N. (2018). Demographic Changes Pose Challenges for Higher Education. Econofact. ↑
- Data provided by George Mason University, January 2020. ↑
- Northern Virginia Community College. (2017). Pathway to the Baccalaureate College Success Consortium 2016-2017 Fact Sheet; Anderson, N. (2014). Community College-University Pipeline Eases Higher-Ed Route. The Washington Post. ↑
- George Mason University. (2019). Plan Your Path to Mason in ADVANCE. ↑
- Kurzweil, M. & Brown, J. (2015). Breaking the Iron Triangle at The University of Central Florida. Ithaka S+R. ↑
- Data provided by UCF outside of the ATI data collection window. The counts reported here align with the publicly available data from the National Center for Education Statistics. ↑
- LaViolet, T., Fresquez, B., Maxson, M., & Wyner, J. (2018). The Talent Blind Spot: The Practical Guide to Increasing Community College Transfer to High Graduation-Rate Institutions. The American Talent Initiative. ↑
- Hill, C. B., Kurzweil, M., Pisacreta, E. D. & Schwartz, E. (2019). Enrolling More Veterans at High-Graduation-Rate Colleges and Universities. Ithaka S+R. ↑
- Data from the University of Michigan, January 2020. ↑
- Data were submitted by 23 colleges in the veterans community of practice and 22 in the community college transfer community of practice. This analysis includes both full- and part-time veteran students, all of whom seek bachelor’s degrees. ↑
- Institutional aid data are only available through the 2017-18 school year. ↑
- Centre College. (2019). Most Successful Campaign in Centre History Exceeds Goal, Concludes with $210 Million. ↑
- We use Pell because it is nationally reported and comparable across all institutions. ↑
- The Ohio State University. (2015). $15 Million in President’s Affordability Grants Will Benefit 12,400+ Students Next Year. ↑
- University of California, Davis (2019). UC Davis Aggie Grant Plan. ↑
- University of California, Davis (2019). California’s Middle Class Scholarship (MCS) Program. ↑
- Colby College. (2018). Colby Announces New Financial Aid Fund for Middle-Income Families. In most cases, typical assets refers to a family’s net worth. ↑
- ATI Interview with President Greene, spring 2019. ↑
- Amherst College. (2019). Meiklejohn Fellows. ↑
- Lopez, S. & Schwartz, E. (2019). Supporting Postsecondary Access and Success for Rural Students. Ithaka S+R. ↑
- Data provided by University of Iowa. ↑
- A second iteration of the institute on Equity in the Academic Experience will be held in summer 2020. ↑
- Analyses from IPEDS and member-submitted data; Rivard, R. (2014). Shrinking as a Strategy. Inside Higher Ed. ↑
- Mitchell, M., Leachman, M., Masterson, K., & Waxman, S. (2018). Unkept Promises: State Cuts to Higher Education Threaten Access and Equity. Center on Budget and Policy Priorities. ↑
- Ward, J. D., Le, C. & Pisacreta, E. D. (2019). The Strategic Alignment of State Appropriations, Tuition, and Financial Aid Policies. Ithaka S+R. ↑
- Palmer, J. (2020). Annual Grapevine Compilation of State Fiscal Support for Higher Education Results for Fiscal Year 2020. Grapevine. ↑
- Pisacreta, E. D., Schwartz, E. & Kurzweil, M. (2018). A 2018 Report on the Progress of the American Talent Initiative in Its First Two Years. American Talent Initiative. ↑
- Mitchell, M., Leachman, M., Masterson, K., & Waxman, S. (2018). Unkept Promises: State Cuts to Higher Education Threaten Access and Equity. Center on Budget and Policy Priorities. ↑
- Jaschik, S. (2019). NACAC Agrees to Change Its Code of Ethics. Inside Higher Ed. ↑
Attribution/NonCommercial 4.0 International License. To view a copy of the license, please see http://creativecommons.org/licenses/by-nc/4.0/.