Ithaka S+R US Faculty Survey 2021
Introduction
The Ithaka S+R US Faculty Survey has tracked the changing research, teaching, and publishing practices of faculty members within higher education triennially since early digital transformation at the turn of the century. This project has aimed to provide actionable findings to help colleges and universities, among other relevant stakeholders such as academic libraries, learned societies, and scholarly publishers, make evidence-based decisions for their planning and strategy.
Against the backdrop of the global pandemic and its numerous impacts to many different facets of higher education, this eighth cycle of the survey once again queried faculty nationally on topics such as scholarly discovery and access, data management, research dissemination, and the value of the library. We also added new questions on key areas of interest, including equitable and holistic teaching practices, instructional support, perspectives on scholarly outputs and open access models, as well as on faculty capacity and evaluation. Our key findings below highlight the most notable results from the 2021 US Faculty Survey.
Key Findings
- Faculty are according less importance to a journal’s impact factor when deciding where to publish their scholarly research. Despite this decrease, faculty members continue to emphasize the importance of characteristics that have historically been most highly valued that help contribute towards favorable scholarly incentives, such as a journal’s content area and high readership.
- While faculty members continue to view the library’s most important function to be that of buyer of scholarly resources, they consider the library’s role in providing direct support to students as essential. This includes the library’s provision of access to technology and informal learning spaces. Faculty members continue to endorse the role of the library primarily as a buyer of scholarly resources needed for their research and teaching and generally as a primary support for student learning.
- Faculty members continue to be interested in an open access publication model and see their library as key in financially supporting open access infrastructure. Faculty members want the library’s involvement in financially supporting an open access system and are specifically open to their college or university library investing in open journal platforms and infrastructure to do so.
- Very few faculty members believe there are adequate processes in place to protect against research fraud, and there is widespread support for additional efforts to ensure research integrity. While the majority of respondents do not believe that fraud is growing, they are not sanguine. There is strong support for dataset deposit, disclosure of funding sources, and registering research questions prior to analysis.
- The disruptions of recent years have yielded a substantial increase in the use and creation of open educational resources (OER), textbooks, course modules, and video lectures. Despite increased creation and usage of OER, faculty are less interested in creating and using them for their courses as incentives for integrating OER into instructional approaches have not changed since 2018.
- In the aggregate, the importance of the monograph has declined. The print monograph is decreasing in importance across all disciplines. Among humanists, a growing share compared with 2018 indicated that electronic monographs are important for their teaching and research.
- Notwithstanding the disruptions of recent years, faculty members report that attending conferences and workshops remains the most important way they keep up to date with their current field. With conferences transferring to digital options during the global pandemic, they remain just as relevant to keep up with scholarly information.
Methodology
The Ithaka S+R US Faculty Survey 2021 has been designed to track critical trends in higher education over time, while also including new questions and thematic areas to address newly emerging trends in the field. As such, new questions to the survey were tested before fieldwork through an iterative testing process alongside cognitive interviews. This report covers findings from the eighth cycle of the Ithaka S+R Faculty Survey.
The population for this survey is faculty members at four-year colleges and universities that offer a bachelor’s degree or higher. In the 2018 survey cycle, we added faculty members from the fields of foreign languages and agriculture, and in 2015 we added faculty from medical institutions. While these respondents are included in our disciplinary analysis, they are excluded from our aggregate analysis so that the appropriate comparisons can be drawn against all previous survey cycles.
The survey was fielded in fall 2021 to a sample of 145,099 faculty members. We received a total of 7,615 completed surveys for an overall response rate of 5.2 percent.[1] Invitation and reminder messages were deployed from Ithaka S+R and partner scholarly societies (see the Methodology Appendix for full list). Additionally, several colleges and universities fielded a version of the survey locally during the fall semester. As the responses varied by discipline, we weighted the aggregated results proportionally to match population parameters.
Datasets from the 2006, 2009, 2012, 2015, and 2018 cycles of the US Faculty Survey have been deposited with ICPSR for long-term preservation and access.[2] We intend to deposit the 2021 dataset similarly. Please contact us directly at research@ithaka.org if we can provide any assistance in accessing and working with the underlying data.
More detailed information on the survey methodology is available in the Appendix.
Acknowledgements
This project was guided by an advisory committee who supported the development of the survey, establishing thematic priorities, any revisions made to the instrument, as well as provided reactions to a draft of this report. We thank them for their fantastic contributions:
- Consuella Askew, Associate University Librarian, Rutgers University
- MJ Bishop, Vice President for Integrative Learning Design, University of Maryland Global Campus
- Flower Darby, Associate Director of the Teaching for Learning Center, University of Missouri
- Bethany Nowviskie, Dean of Libraries, Chief Academic Technology Officer, Professor of English, James Madison University
- Devin Savage, Dean of Libraries, Illinois Institute of Technology
- Peter Schiffer, Frederick W. Beinecke Professor of Applied Physics, Yale University
- Denise Stephens, Dean of Libraries, University of Oklahoma
- Elaine Westbrooks, Carl A. Kroch University Librarian, Cornell University
We are immensely grateful to our colleague Nicole Betancourt who led the administration of the faculty survey. This project would not be possible without her substantive contributions. We also thank our colleagues Danielle Cooper, Dylan Ruediger, Roger Schonfeld, and Kimberly Lutz for their input on this report, as well as Christine Wolff-Eisenberg for her contributions towards developing the survey instrument.
The individuals named in this section provided a variety of important contributions to this project, and we thank them for their partnership. Final responsibility for the survey and its analysis rests with the author.
Understanding Faculty Workload
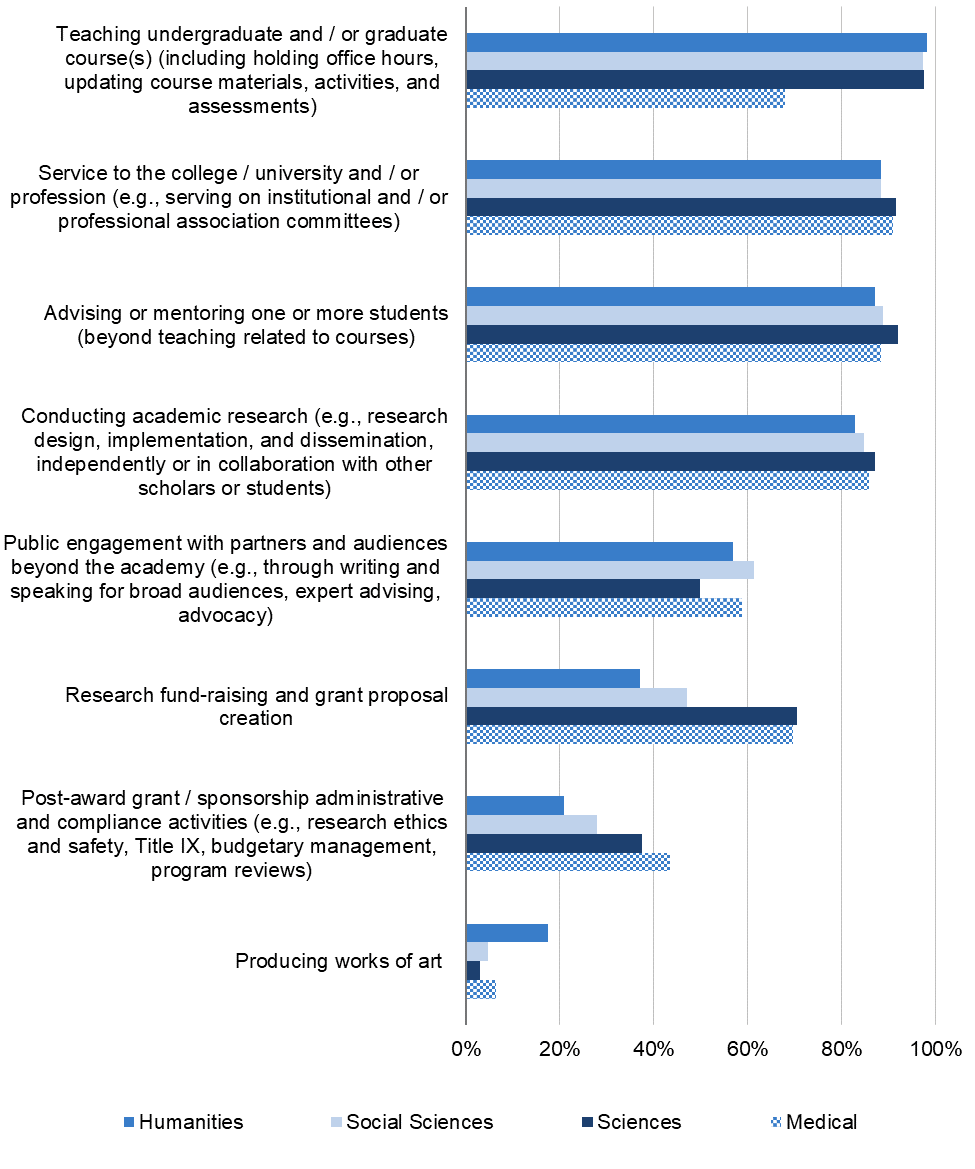
The 2021 cycle of the US Faculty Survey sought to track the many different professional activities of faculty, including both their teaching- and research-related professional responsibilities to visualize how faculty are spending and prioritizing their time. Ninety-eight percent of respondents are teaching undergraduate and graduate courses, 89 percent are responsible for service to their institution or profession and are also advising or mentoring students beyond their classes (see Figure 1).
About eight in ten faculty members are currently conducting academic research, half are involved in fundraising and/or submitting grant proposals, and about 30 percent are conducting post-award grant or sponsorship administrative and compliance activities (see Figure 1). Those faculty with fundraising or post-award responsibilities are spending approximately 4.5 hours in a typical week towards each these activities.
Figure 1 demonstrates that although similar shares of faculty members in all disciplines are conducting academic research, larger shares of scientists are fundraising, writing grant proposals for their research, and conducting post-grant award activities than their humanist or social scientist colleagues. Meanwhile, humanists and social scientists more often engage with public partners and audiences beyond the academy, including speaking to broad audiences, advocacy work, or providing expertise.
Figure 1. Please indicate which, if any, of the following are among your professional responsibilities.
Percent of respondents who indicated each activity is among their professional responsibilities.
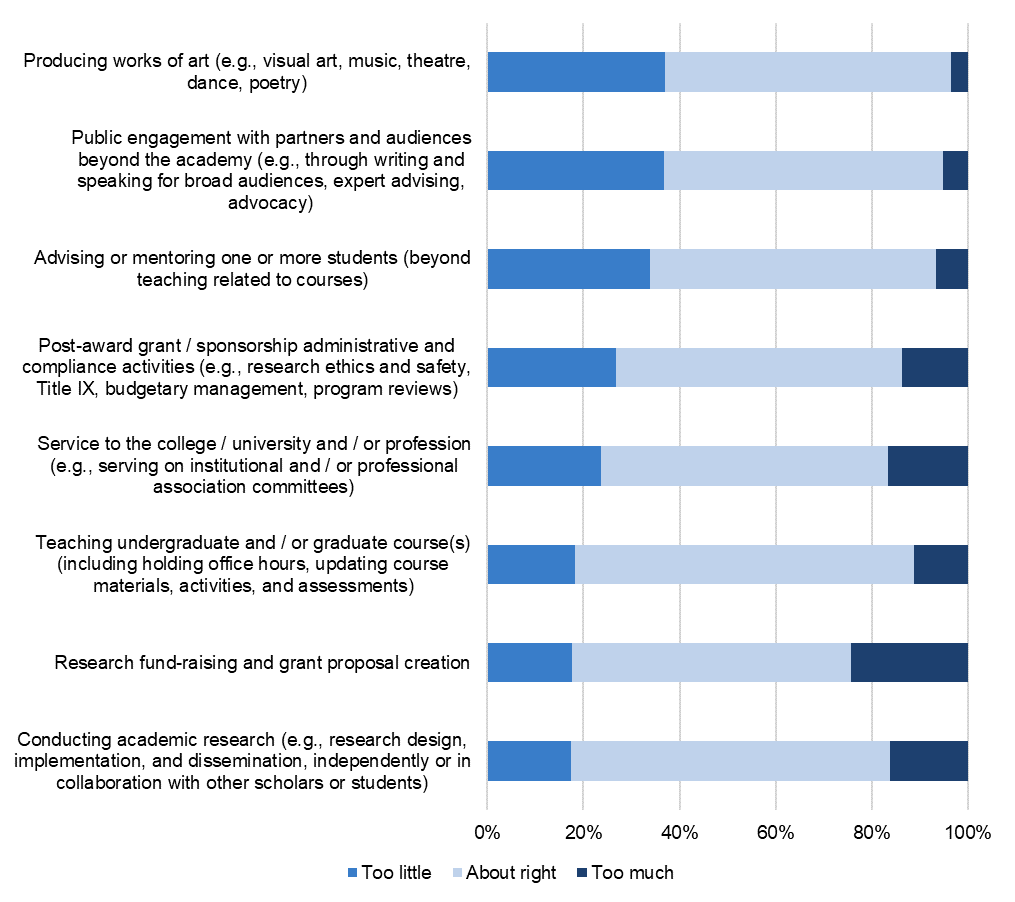
The majority of faculty members believe that the amount of consideration given to their professional responsibilities is sufficient in terms of how they are assessed for tenure, promotion, research funding, continuing appointment, contract renewal, or annual review. For instance, 71 percent of faculty think their teaching related activities are being considered about the right amount in their evaluations, followed by 66 percent for their academic research, and about 60 percent for the rest of their professional responsibilities (see Figure 2).
Despite this, 70 percent of faculty members agree that they clearly understand the criteria that are being used to evaluate them for tenure and promotion, and 45 percent share their research outputs and make publication choices to match the criteria they perceive are necessary for tenure and promotion. We also see some variations by discipline: about 30 percent of scientists indicated that there is too much recognition towards research fundraising and grant proposals in their tenure and promotion processes, compared to 23 percent of social scientists and 18 percent of humanists who feel there is too much recognition given to these activities.
Figure 2. You previously indicated you are currently performing the following activities. When you think about how your work is assessed, such as for tenure, promotion, research funding, continuing appointment, contract renewal, or annual review, do you think that the right amount of consideration given to each of the following activities is too much, too little, or about right?
Percent of respondents who indicated they perform each of the following activities and who indicated they think the consideration given to each is too little, about right, or too much.
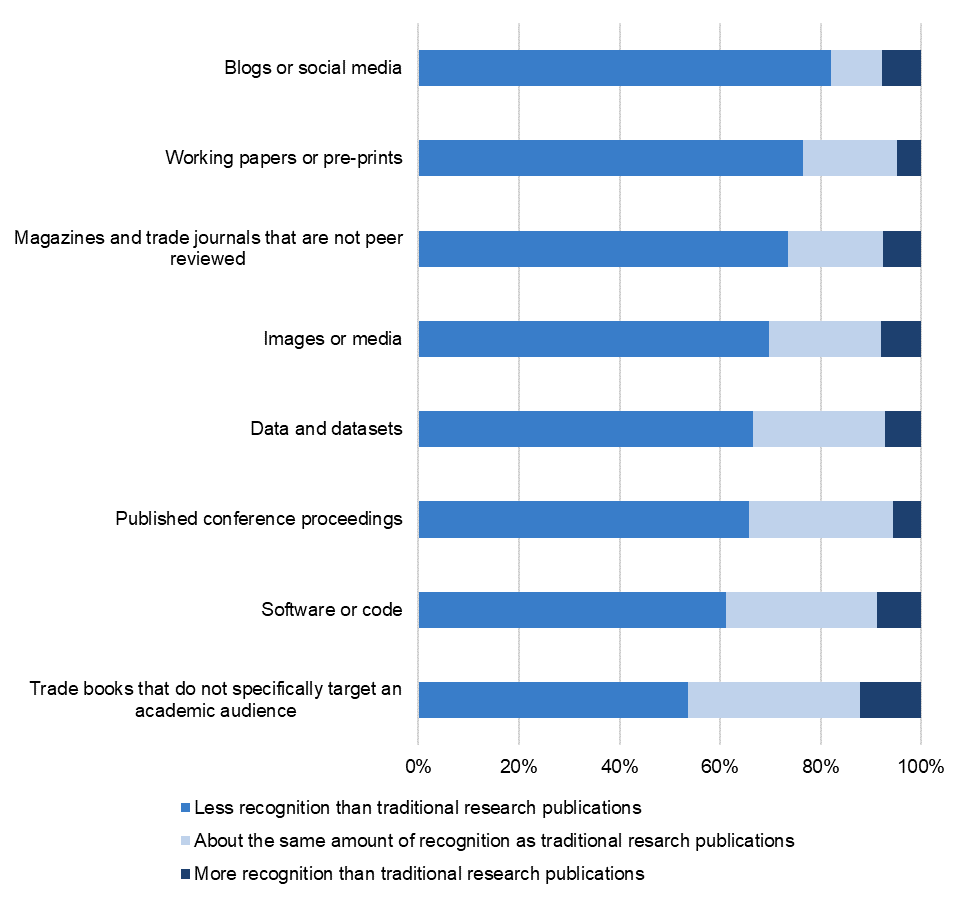
For faculty members who are conducting academic research, and who indicated they often or occasionally share their research products in various formats, perceptions on criteria for tenure, promotion, and evaluation remain grounded in publishing traditional research products such as peer-reviewed journal articles or scholarly monographs. Consistent with past survey findings, faculty believe that traditional scholarly publications hold more value in assessments for tenure and promotion than alternative research products, such as blogs or social media, working papers or pre-prints, and images or media. More specifically, the majority of faculty think these research products should not have as much recognition compared to more traditional research products such as peer-reviewed journal articles or scholarly monographs (see Figure 3).
Figure 3. In a previous question, you indicated that you share your research in the following research product(s). When you think about how your work is assessed, such as for tenure, promotion, research funding, continuing appointment, contract renewal, or annual review, how much recognition should you receive for these research products compared to traditional research publications such as journal articles and scholarly books?
Percent of respondents who indicated each research product they produce should receive less, about the same, or more recognition as traditional research publications.
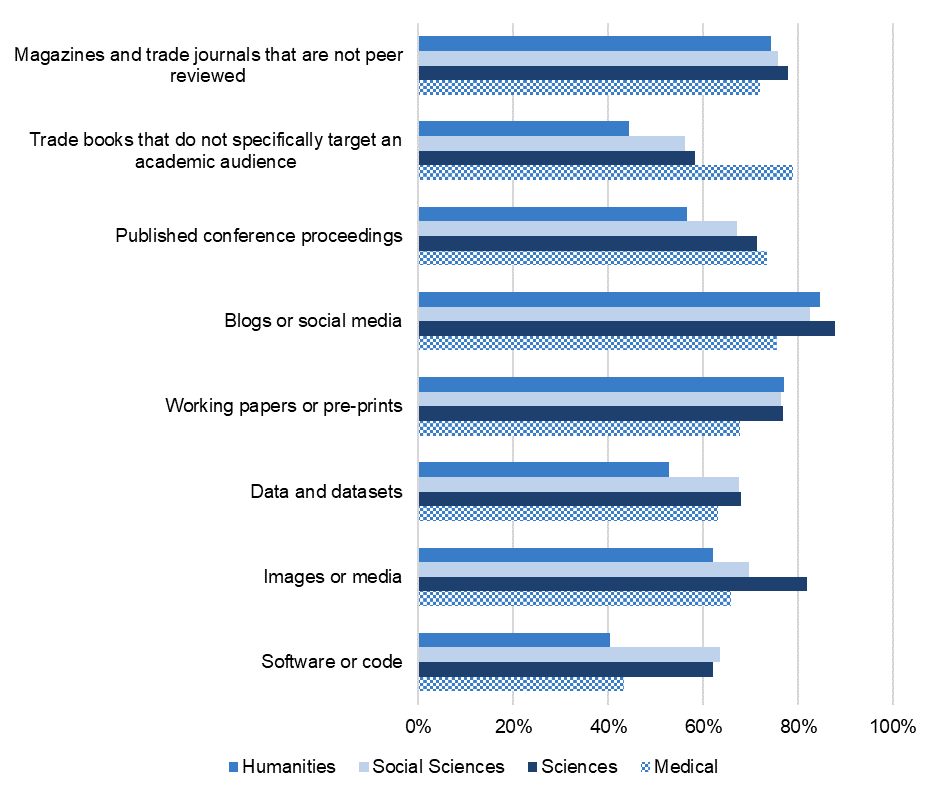
Faculty across disciplines, apart from medical faculty, are relatively aligned that magazines and non-peer reviewed trade journals, blogs or social media, and working papers or pre-prints should deserve less recognition towards tenure and promotion processes than traditional research publications (see Figure 4). A higher share of medical faculty believe that trade books that do not specifically target an academic audience should be given less consideration than traditional publications in these evaluation processes, compared to faculty in other disciplines. A larger share of scientists think that images or media should receive less recognition in tenure and promotion processes as compared to their colleagues in other disciplines.
Figure 4. In a previous question, you indicated that you share your research in the following research product(s). When you think about how your work is assessed, such as for tenure, promotion, research funding, continuing appointment, contract renewal, or annual review, how much recognition should you receive for these research products compared to traditional research publications such as journal articles and scholarly books?
Percent of respondents who indicated each research product they produce should receive about the same recognition as traditional research publications.
Discovery
The following section reviews how faculty are currently discovering new scholarly literature for their research and teaching and how they are keeping up with current scholarship. Overall, faculty continue to discover new scholarly materials using specific scholarly databases along with Google Scholar. To keep up with relevant research from their discipline, the majority of faculty are attending conferences and reading journal articles suggested by their peers.
Discovery of Scholarly Information
Similar to earlier survey cycles, faculty are generally discovering scholarly literature through searching on specific scholarly databases and Google Scholar. In 2021, a third of faculty members indicated that they most often begin their discovery of scholarly materials using specific databases, such as EBSCOhost, JSTOR, or PubMed, followed by 29 percent who search on Google Scholar, 17 percent on a general search engine and 14 percent on their college or university library’s website or online catalog (see Figure 5).
Figure 5. When you explore the scholarly literature to find new journal articles and monographs relevant to your research interests, how do you most often begin your process?
Percent of respondents who indicated that each option is the starting point for their exploration.[3]
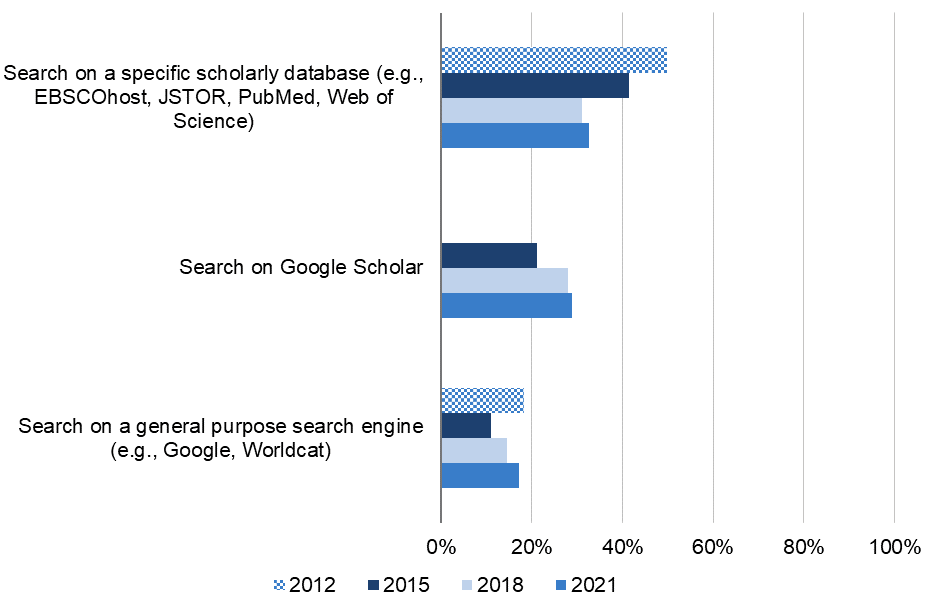
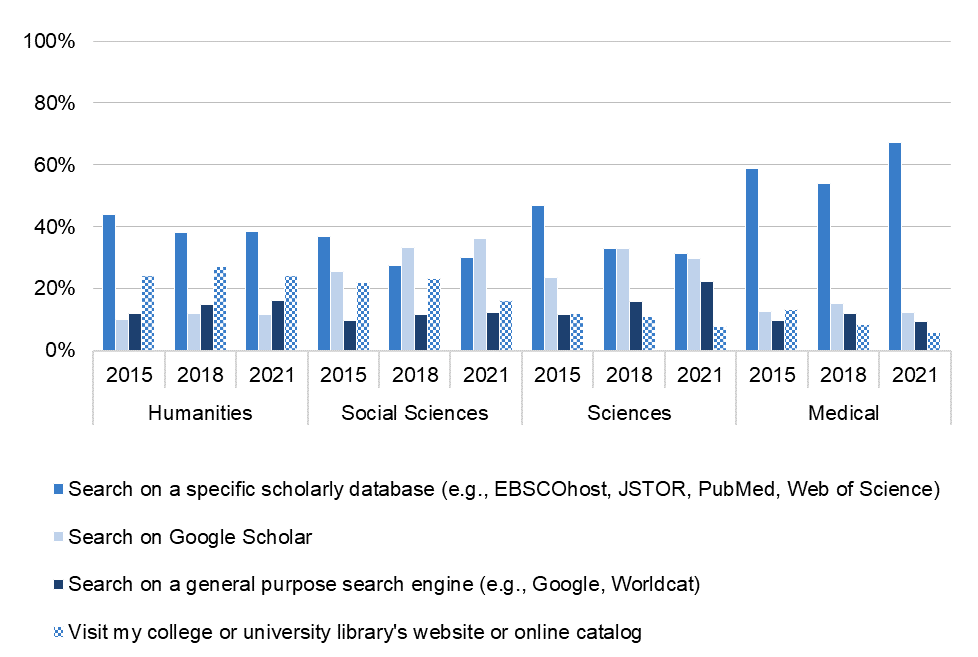
Over time, we have seen a general decrease in the percentage of faculty using specific scholarly databases, and an increase in using Google Scholar. However, since 2018, we see similar shares of faculty indicate they use these sources to discover their research materials (see Figure 5). There are some differences based on discipline: 39 percent of humanists are searching on a specific scholarly database compared to around 30 percent of their social scientist and scientist colleagues (see Figure 6).
Larger shares of social scientists are using Google Scholar compared to their colleagues in other disciplines: 36 percent of social sciences faculty are starting their search here, compared to 30 percent of scientists and 12 percent of humanists. Humanists are using specific scholarly databases to start their search of scholarly materials at a similar level as in 2018. Medical faculty, however, have increased their usage of specific databases since 2018. This increase could be due to the inclusion of PubMed as an example in this survey cycle. Lastly, the share of scientists who indicated that they use a general purpose search engine has been increasing over time, whereas the share of faculty who use their college or university’s website or catalog has decreased across each discipline (see Figure 6).
Figure 6. When you explore the scholarly literature to find new journal articles and monographs relevant to your research interests, how do you most often begin your process?
Percent of respondents who indicated that each option is the starting point for their exploration.[4]
Keeping up with Scholarship
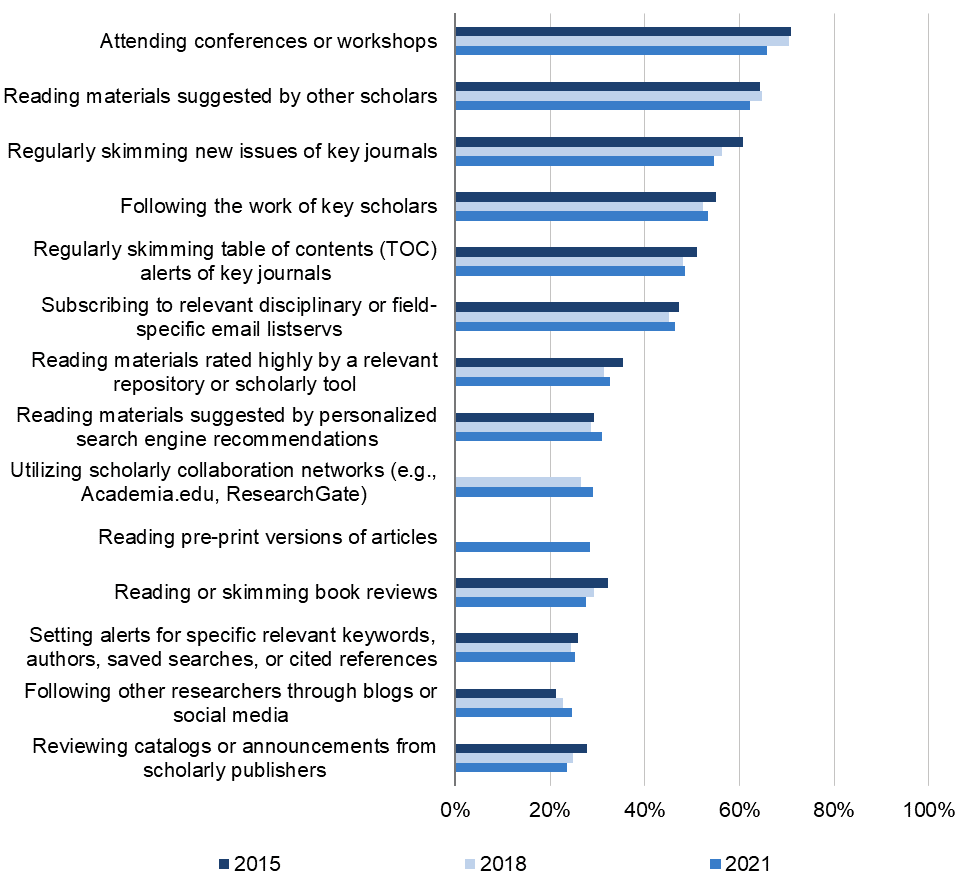
Despite the global pandemic’s disruption to conferences, faculty members still consider attending conferences and workshops as their most important tactic for keeping up with current scholarship in their field (see Figure 7). In 2021, two thirds of faculty members rated conferences and workshops as highly important for keeping up with current scholarship, followed by 62 percent who see reading materials suggested by other scholars as highly important. A little more than half of faculty respondents see skimming new issues of key journals and following the work of key scholars as highly important.
Notwithstanding the disruptions of recent years, faculty members report that attending conferences and workshops remains the most important way they keep up to date with their current field.
Figure 7. You may employ a variety of different tactics to “keep up” with current scholarship in your field on a regular basis. Please use the scales below to rate from 10 to 1 how important each of the following methods is for staying current with new scholarship in your field.
Percent of respondents who indicated each of these tactics are highly important.
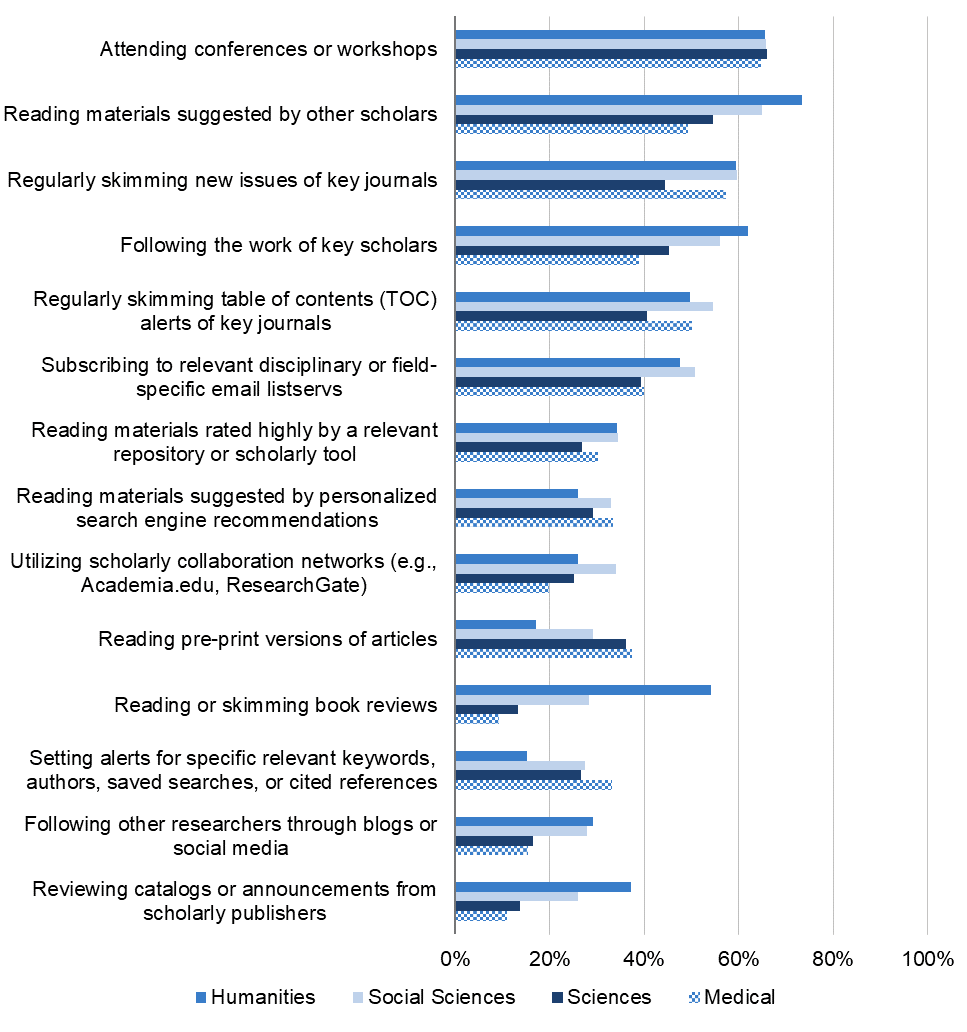
With the increase in remote and virtual conferences throughout the pandemic, and recent developments with conference platforms and Zoom capabilities, it has gotten easier and less expensive to attend conferences and workshops, which may be why we only saw a rather small decrease to their value compared to the 2018 and 2015 cycles.[5] Conference attendance is a highly important tactic for faculty in any discipline (see Figure 8). Larger shares of medical faculty, scientists, and social scientists are reading pre-print versions of articles and are setting alerts for specific keywords compared to their humanist colleagues, whereas larger shares of humanists are reading and skimming journals and materials, as well as following key scholars compared to scientists.
Figure 8. You may employ a variety of different tactics to “keep up” with current scholarship in your field on a regular basis. Please use the scales below to rate from 10 to 1 how important each of the following methods is for staying current with new scholarship in your field.
Percent of respondents who indicated each of these tactics are highly important.
Access
To access materials needed for their research and teaching, faculty members overwhelmingly regard their academic library’s collections and subscriptions as their most important source for these scholarly materials, followed by freely available materials online, and their own personal collection or subscriptions. The survey also asked a number of questions about faculty preferences for print and electronic monographs.
Gaining Access to Materials for Research and Teaching
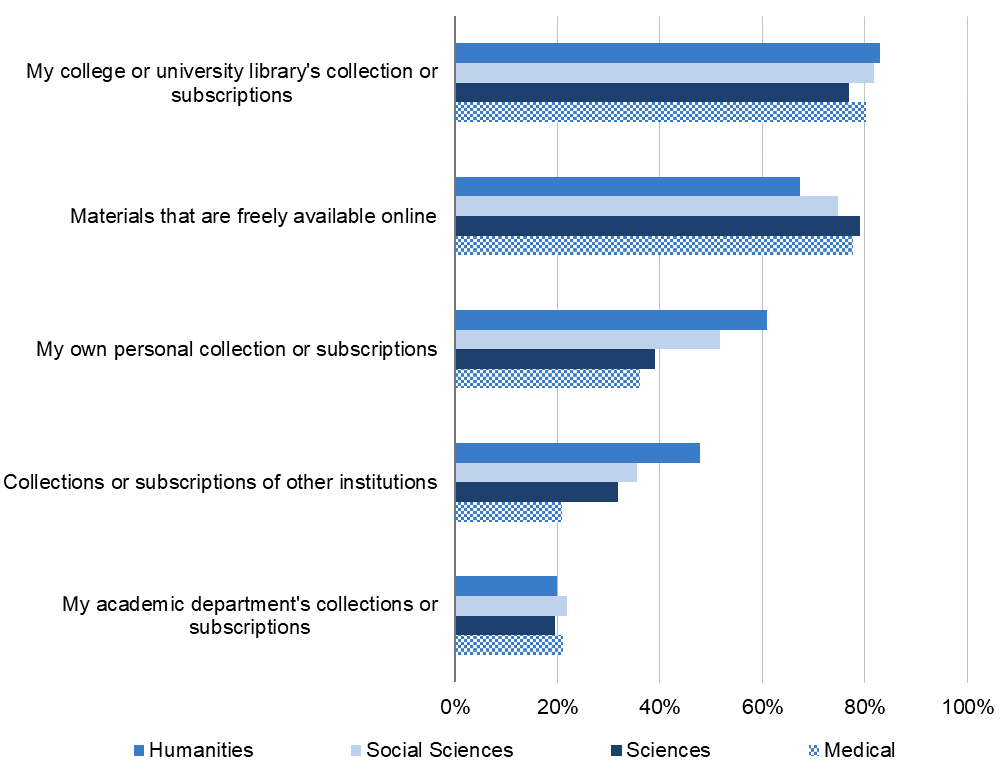
Over time, academic library’s collections or subscriptions remain the most important source of scholarly materials for faculty research and teaching—eight in ten faculty members rated the library’s collections and subscriptions as highly important. Seventy-five percent named materials that are freely available online as highly important, and roughly half describe their personal collections as highly important (see Figure 9). The importance of the library’s collection has remained roughly the same in the past four survey cycles. By discipline, a larger share of humanists find their own personal collections or the collections and subscriptions of other institutions to be more important than their colleagues in other disciplines, whereas larger shares of social scientists, scientists, and medical faculty find freely available materials online to be highly important compared to their humanist colleagues (see Figure 10).
Figure 9. When you think about the journal articles and/or scholarly monographs that you routinely use—for research as well as for teaching—how important are each of the following sources?
Percent of respondents who indicated that each of these methods is highly important.
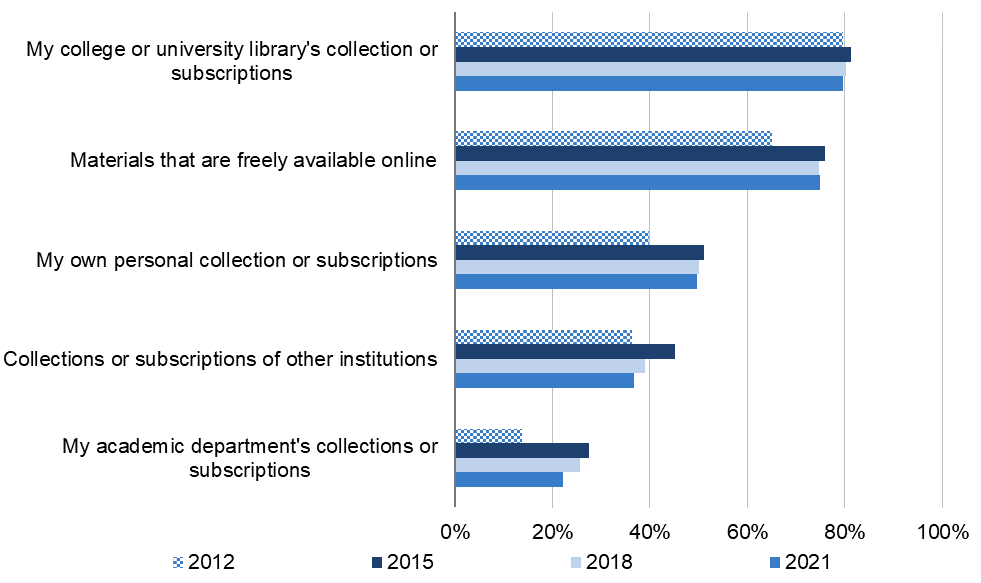
Figure 10. When you think about the journal articles and/or scholarly monographs that you routinely use—for research as well as for teaching—how important are each of the following sources?
Percent of respondents who indicated that each of these methods is highly important.
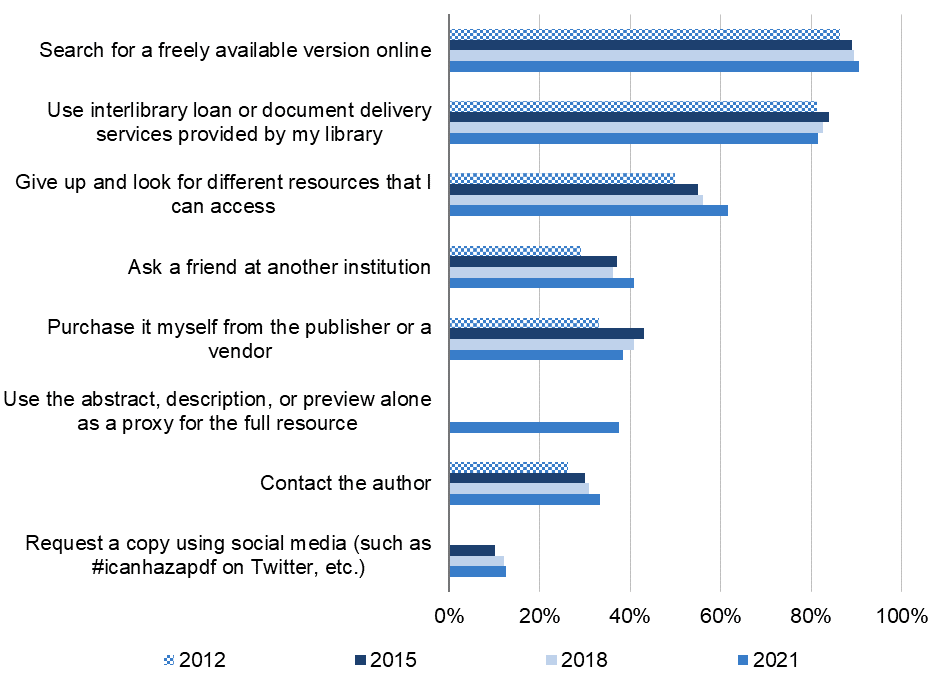
When a scholarly monograph or journal article is not immediately accessible, faculty members continue to search for a freely available version online or use interlibrary loan (ILL) and document delivery services provided by the library. Nine in ten faculty members often or occasionally search for a freely available version online, eight in ten use ILL or document delivery services, and six in ten give up and look for different, accessible resources (see Figure 11). Over time, we see that faculty are increasingly giving up and looking for different resources that are accessible, though they are not changing the frequency with which they are using other methods to identify accessible resources.
Figure 11. When you want a scholarly monograph or journal article that you do not have immediate access to through your college or university library’s physical or digital collections, how often do you use each of the following methods to seek access to that material?
Percent of respondents who often or occasionally use each method to access materials.
Monograph Format Transition
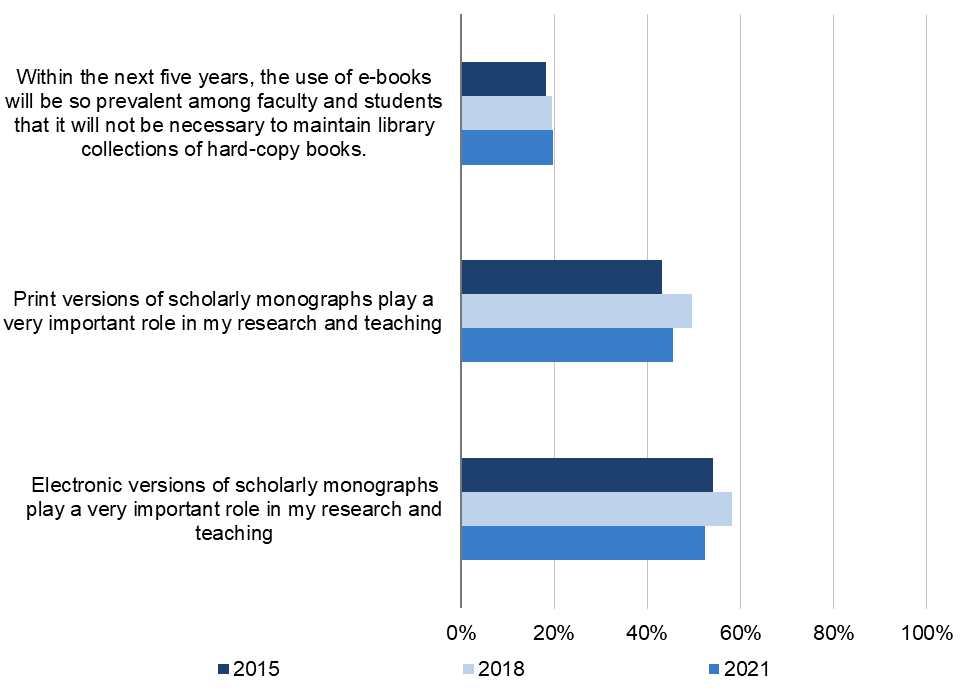
Like faculty members in previous survey cycles, the majority consider their library’s maintenance of physical monographs to be of continued importance. However, while the 2018 cycle saw an uptick in the importance faculty members ascribed to both print and electronic scholarly monographs for their research and teaching specifically, this 2021 survey cycle saw a decrease in their importance to these activities overall (see Figure 12).
In the aggregate, the importance of the monograph has declined. The print monograph is decreasing in importance across all disciplines. Among humanists, a growing share compared with 2018 indicated that electronic monographs are important for their teaching and research.
Figure 12. Please use the 10 to 1 scales to indicate how well each statement describes your point of view.
Percent of respondents who strongly agreed with the following statements.
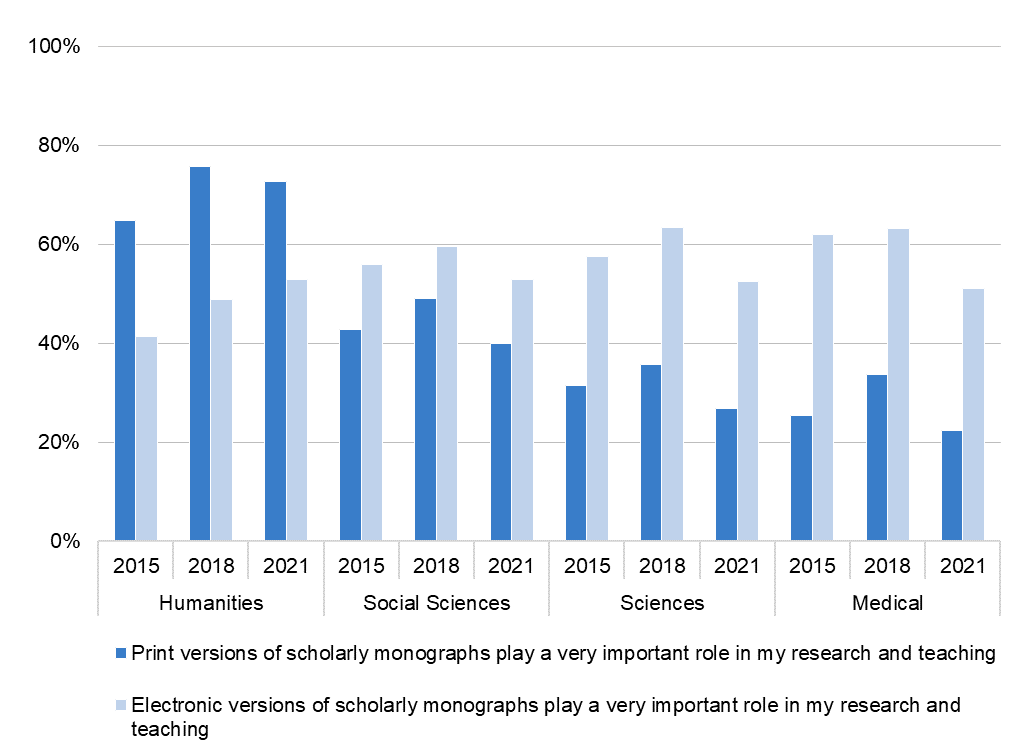
Unsurprisingly, much larger shares of humanists agree that print monographs are important to their needs compared to their colleagues in other disciplines—73 percent of humanists agree that print monographs are important compared to 40 percent of social scientists and 27 percent of scientists. However, since 2018, we see that the importance of print monographs have decreased in importance for faculty in each discipline, including humanists. The importance of electronic monographs for humanists has increased since 2018 but has decreased for faculty in the social sciences, sciences, and medical fields (see Figure 13).
Figure 13. Please use the 10 to 1 scales to indicate how well each statement describes your point of view.
Percent of respondents who strongly agreed with the following statements.
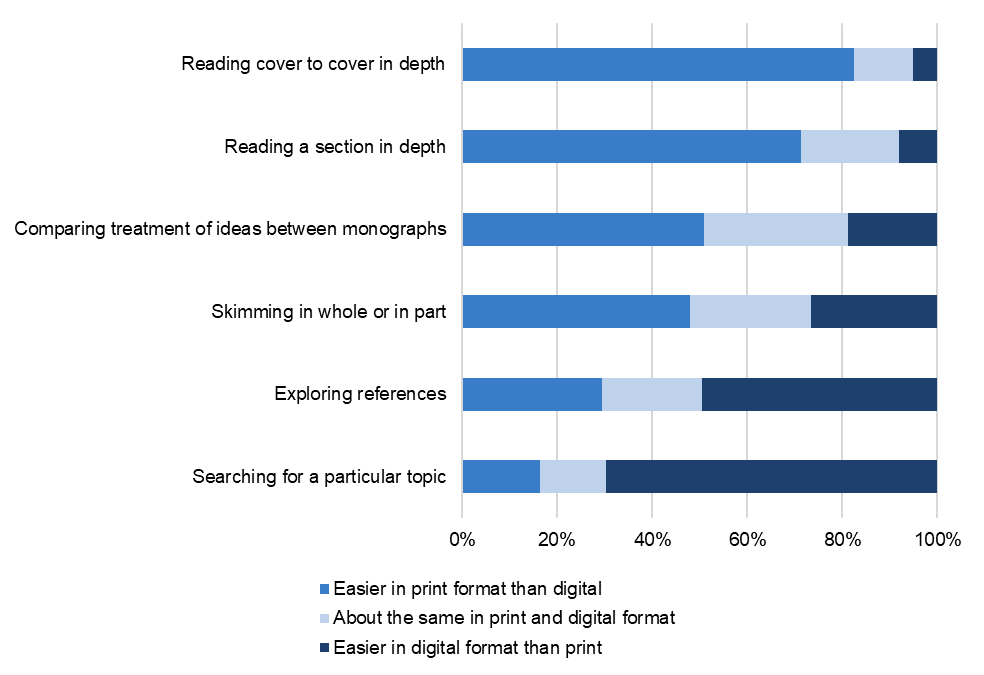
Faculty who agreed that print or electronic scholarly monographs are important to their research and teaching were also asked to rate whether a variety of activities were easier to perform using a print or digital version of a scholarly monograph. As in past survey cycles, faculty find it easier to read a scholarly monograph cover to cover, as well as to read sections of those monographs in depth, in print. Meanwhile, searching for specific topics within the monograph and exploring references are easier in digital formats (see Figure 14).
Figure 14. Below is a list of ways you may use a scholarly monograph. Please think about doing each of these things with a scholarly monograph in print format or in digital format, and use the scales below to indicate how much easier or harder is it to perform each activity in print or digital format.
Percent of respondents who rated each activity as easier in print than digital, about the same in print and digital format, or easier in digital format than print.
Research Practices
This section focuses on the data collection, analysis, management, storage, and preservation practices of faculty members and how their perspectives and practices have evolved over time. Questions on research practices were only displayed to the 83 percent of respondents who indicated they are currently conducting academic research. The share of faculty varies slightly by institution type, with 87 percent of faculty from Doctoral universities indicating they conduct research, followed by 85 percent from Baccalaureate institutions, and 79 percent from Master’s colleges and universities. Additionally, 93 percent of tenure-line faculty are conducting academic research compared to 41 percent of contingent faculty members.[6]
Since 2015, the share of faculty members who are receiving external funding for their scholarly research from a public or government grant-making organization such as the National Science Foundation (NSF) or the National Endowment for the Humanities (NEH) has decreased. In 2021, 32 percent of faculty indicated they are receiving external public funding, compared to 35 percent in 2018, and 50 percent in 2015. Seven in ten medical faculty are currently receiving external public funding, followed by 59 percent of scientists, 24 percent of social scientists, and 13 percent of humanists.
Data Analysis
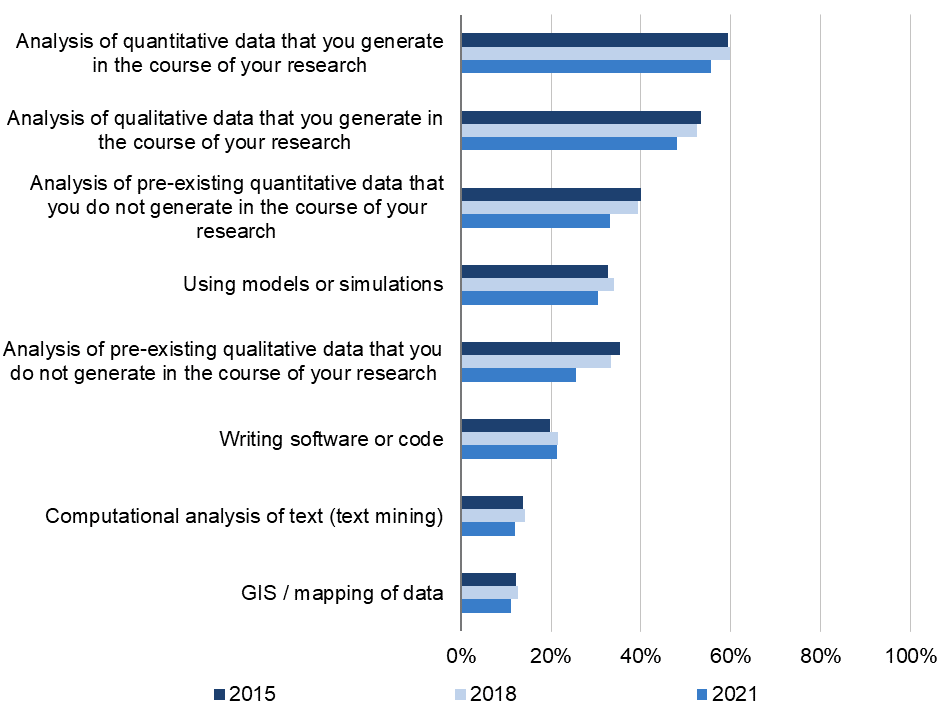
Overall, faculty find the data they generate to be more important for their research than using pre-existing data. Fifty-six percent of faculty rated quantitative data generated during their research as highly important to their research activities, followed by 48 percent for self-generated qualitative data. On the other hand, a third of faculty members rated analysis of pre-existing quantitative data and models or simulations as highly important. Compared to previous survey cycles, the share of faculty members who find each of these methodologies important has decreased, apart from writing software and code (see Figure 15).
Figure 15. How important to your research is each of the following digital research activities and methodologies today?
Percent of respondents who indicated that each of these activities and methodologies is highly important.
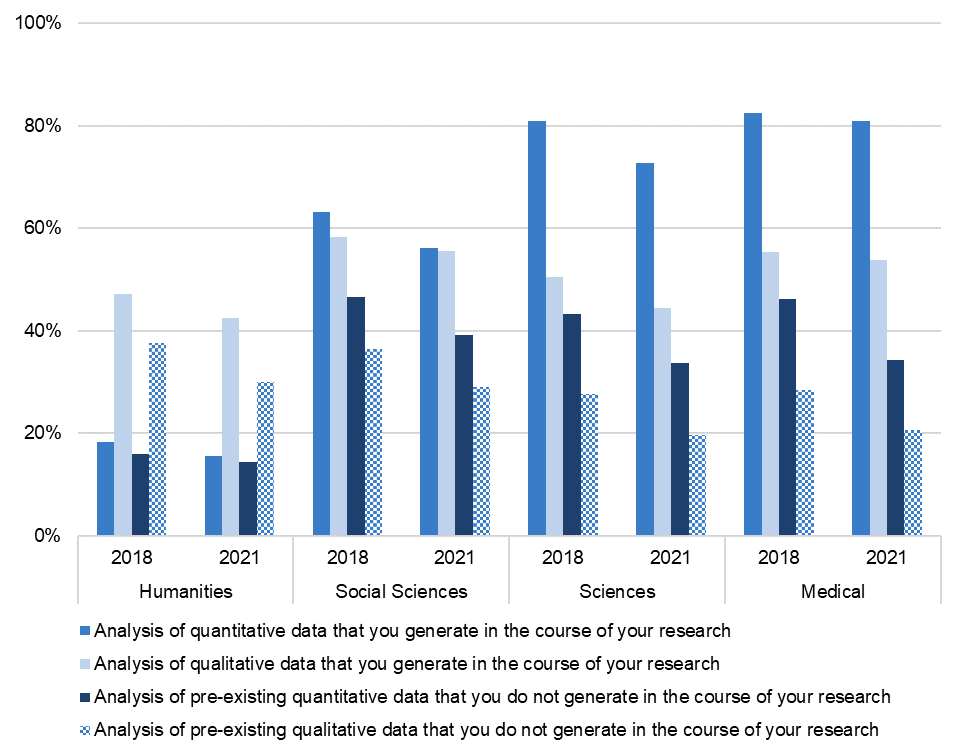
This decline in importance is mostly driven by social scientists and scientists—social scientists and scientists designate much less importance towards generating quantitative data or using pre-existing quantitative data, whereas faculty in every discipline find pre-existing qualitative data to be less important (see Figure 16). Medical faculty’s responses on using self-generated quantitative and qualitative remain relatively unchanged from previous survey cycles while using pre-existing quantitative and quantitative data is rated as much less important in 2021 than 2018.
Figure 16. How important to your research is each of the following digital research activities and methodologies today?
Percent of respondents who indicated that each of these activities and methodologies is highly important.
Data Management and Preservation
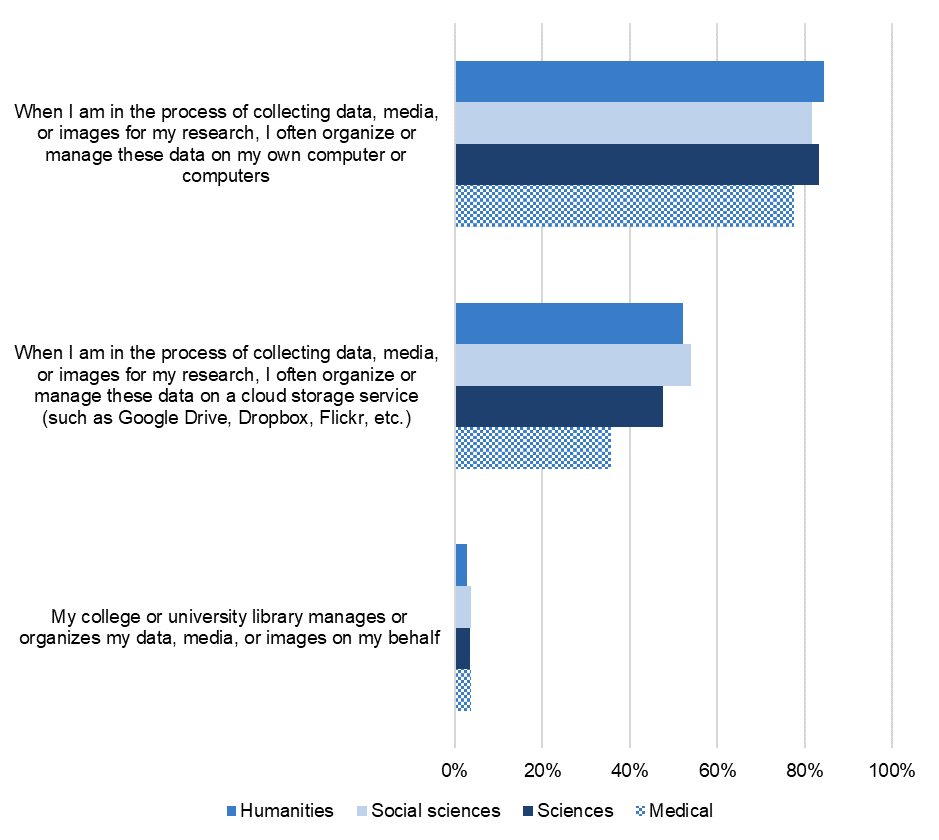
A growing share of faculty members are using cloud-based storage services to manage their data, though the majority still prefer to manage these data on their own computers. Over 80 percent of faculty are organizing and managing their data collection on their own computer, and two thirds are using a cloud storage service such as Google Drive or Dropbox. Over time, a larger share of faculty members are managing their data on cloud storage services, whereas there is a marginal decline since 2015 in the share of faculty who are using their own computers (see Figure 17). Additionally, very few faculty members are using their institution’s library to manage their data. By discipline, a smaller percentage of medical faculty strongly agree that they organize and manage their research data on their own computers or use a cloud storage service compared to their peers in other disciplines (see Figure 18).
Figure 17. Please use the 10 to 1 scales to indicate how well each statement describes your point of view.
Percent of respondents who strongly agreed with the following statements.
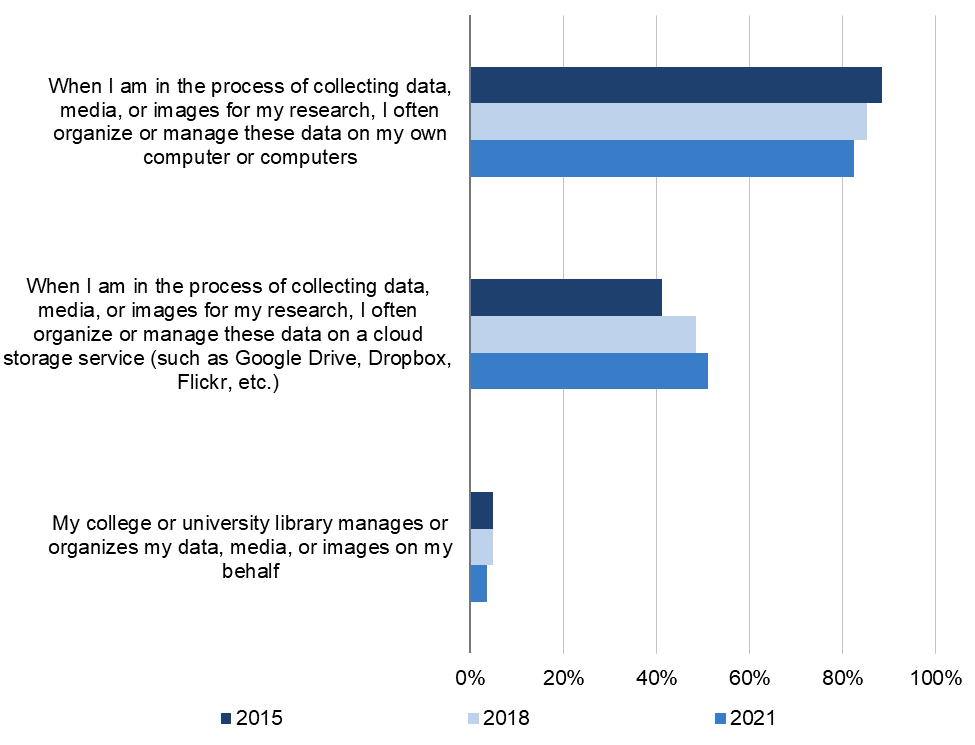
Figure 18. Please use the 10 to 1 scales to indicate how well each statement describes your point of view.
Percent of respondents who strongly agreed with the following statements.
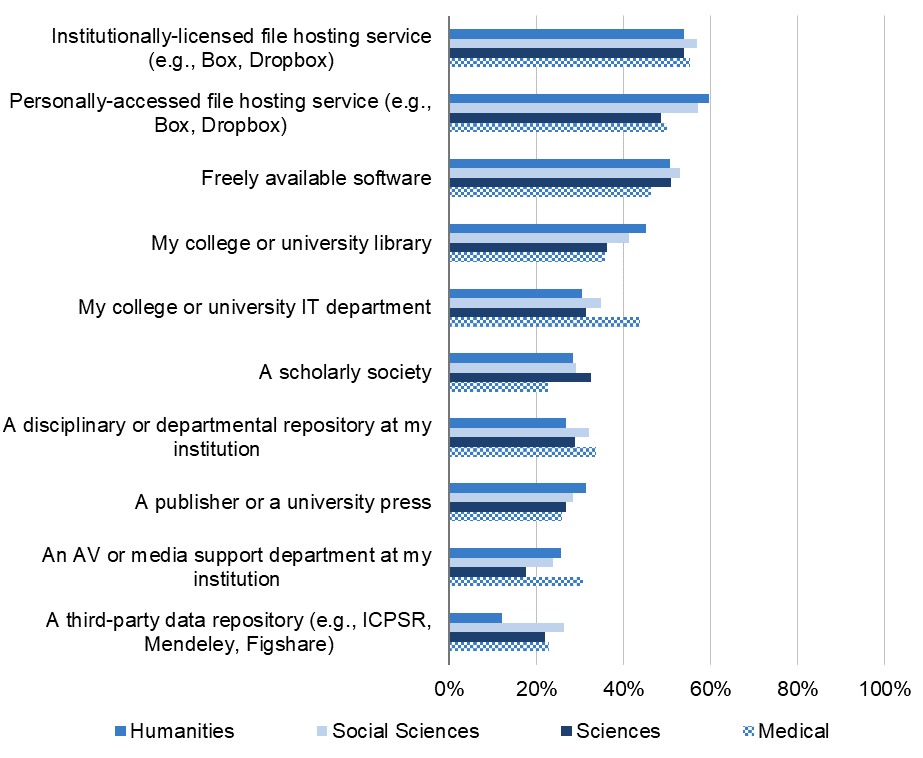
When considering their most important sources of support for managing and preserving their research data, the majority of faculty continue to prefer online sources and software. A little over half of faculty indicated that institutionally licensed file hosting services and personally accessed file hosting services—such as Box and Dropbox and other freely available software—are valuable sources of support for managing and preserving their research data (see Figure 19).[7]
Whereas institutional access to a file hosting service is valuable to faculty across disciplines, larger shares of faculty in the humanities and social sciences also value the support of a file service they personally host as well as their college or university library compared to their peers in the sciences and medical fields. Additionally, a larger share of medical faculty indicated they find their college or university’s IT department to be a highly valuable source of support compared to their peers in other disciplines.
Figure 19. Please use the scale below to rate from 10 to 1 how valuable you would or do find each of the following possible sources of support for managing or preserving research data.
Percent of respondents who indicated each of these sources is highly valuable.
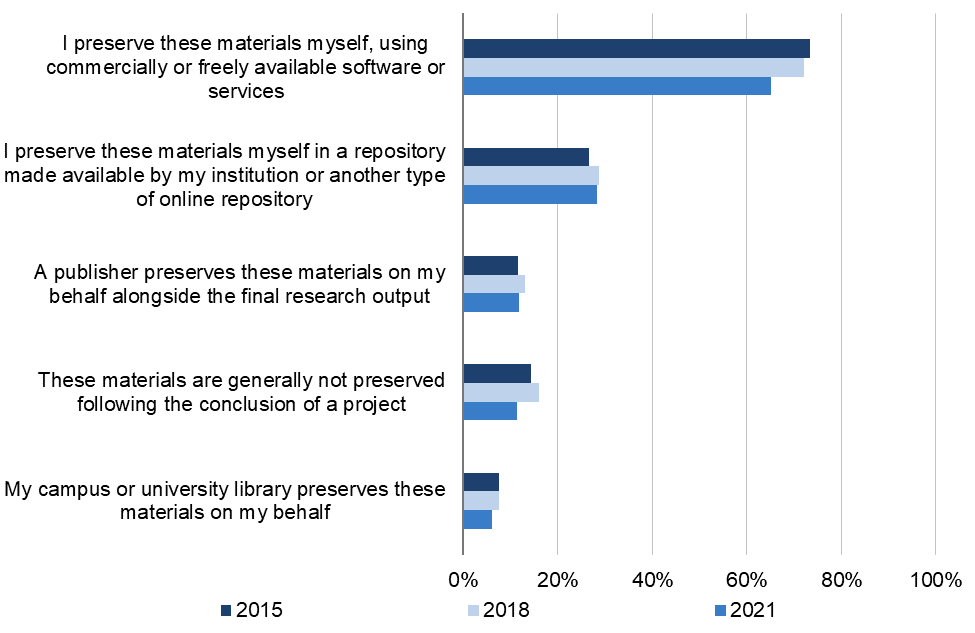
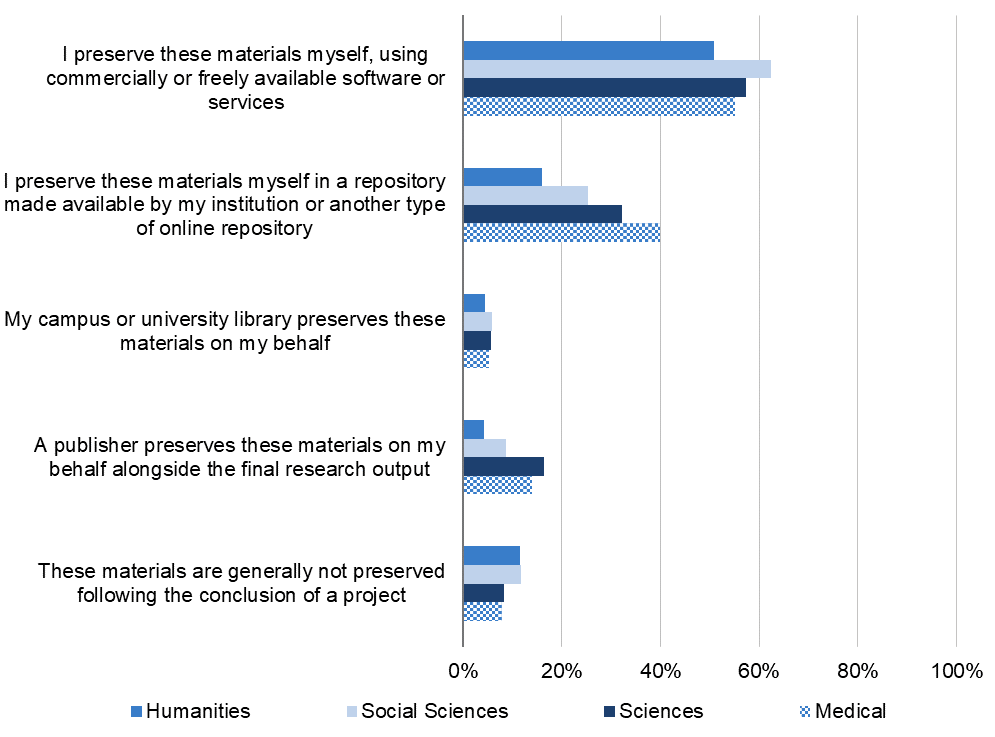
At the conclusion of research projects, the majority of faculty prefer to preserve research data themselves, though there has been a considerable decrease in the share of faculty who preserve their materials using commercially or freely available software since the last survey cycle. In 2021, 65 percent of faculty members preserve these materials using commercially or freely available software or services, compared to 72 percent of faculty in 2018 and 73 percent in 2015. The share of faculty who are preserving these materials in a repository made available by their institution or another type of online repository has remained stable over time, with a little under 30 percent of respondents selecting this method (see Figure 20).
Figure 20. If your collections or sets of research data are preserved following the conclusion of your projects, what methods are used to preserve them?
Percent of respondents who selected each method.
This change is primarily driven by faculty in different disciplines—larger shares of social scientists are preserving their research materials using accessible software online compared to their peers in other disciplines, particularly humanists (see Figure 21). A much larger share of medical faculty also indicated that they preserve their materials in a repository compared to their peers in other disciplines. By age, a larger share of younger faculty members are using online software to preserve their research materials compared to their older colleagues: 63 percent of faculty ages 22 to 44 use online software compared to 57 percent of those aged 44 to 54, 56 percent of those aged 55 to 64, and 55 percent of those older than 65.
Figure 21. If your collections or sets of research data are preserved following the conclusion of your projects, what methods are used to preserve them?
Percent of respondents who selected each method.
Perspectives on Research Fraud
Since 2018, faculty remain unsure if data fabrication, falsification, and other types of research fraud are becoming increasingly prevalent—seven in ten respondents somewhat agree or disagree, or neither agree nor disagree that these faulty practices are becoming increasingly prevalent. Sixty-five percent of faculty, however, believe there are sufficient processes in place to minimize this fraud (see Figure 22). As possible solutions to data fabrication, falsification, and fraud, the majority of faculty agree or strongly agree that defining research questions and analysis plans prior to conducting research and disclosing funding sources improves the credibility of scholarly research.
Figure 22. Please read the following statements and indicate the degree to which you agree or disagree with each.
Percent of respondents who strongly agreed/agreed, somewhat agreed/neither agree nor disagree/somewhat disagreed, or strongly disagreed/disagreed with each statement.
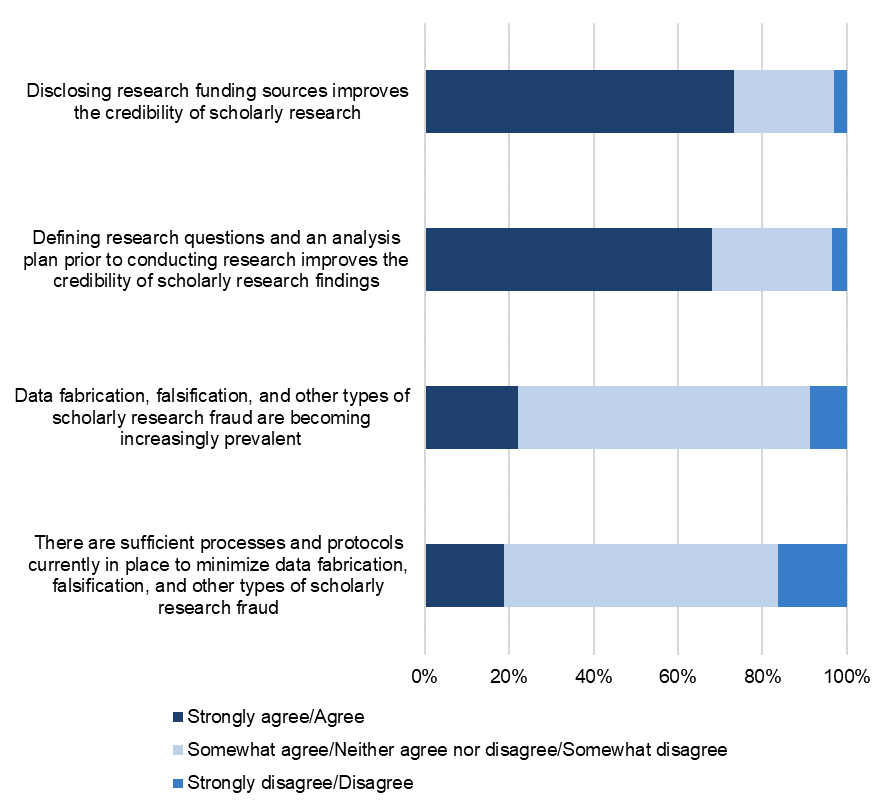
Very few faculty members believe there are adequate processes in place to protect against research fraud, and there is widespread support for additional efforts to ensure research integrity.
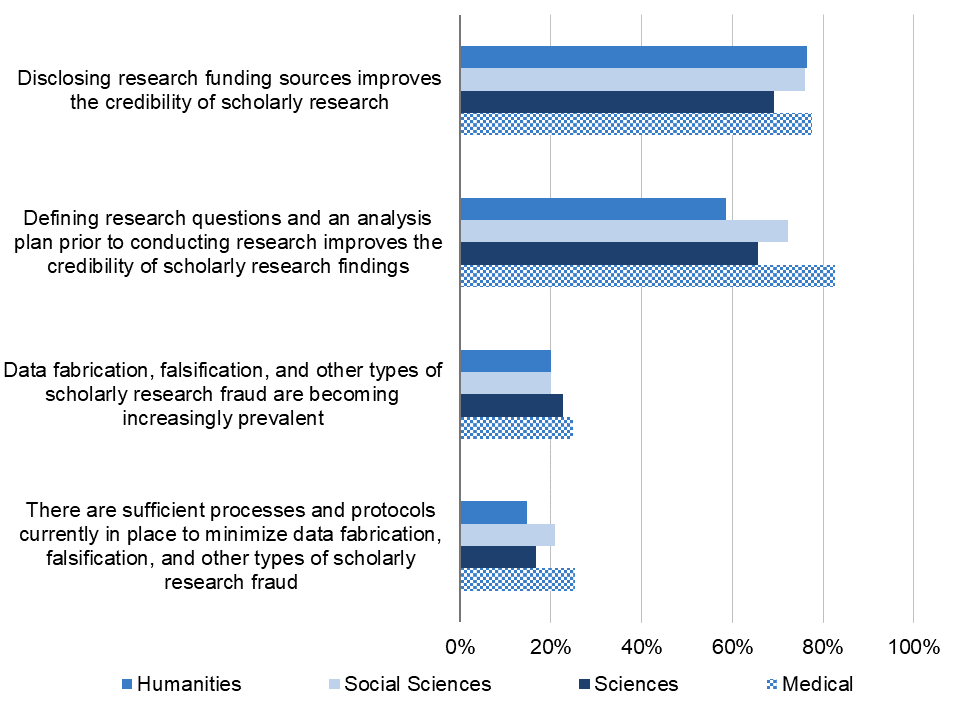
Faculty in all disciplines are similarly unsure if fraudulent data practices are becoming increasingly prevalent. Slightly larger shares of medical and scientist faculty agree or strongly agree that there are sufficient protocols in place to minimize this fraud, even though just a quarter of medical faculty agree or strongly agree that there are sufficient protocols in place (see Figure 23). On the other hand, larger shares of medical and social sciences faculty agree or strongly agree that defining research questions and analysis plans is important towards research credibility compared to their colleagues in other disciplines. Across disciplines, faculty agree that disclosing research funding improves the credibility of research findings.
Figure 23. Please read the following statements and indicate the degree to which you agree or disagree with each.
Percent of respondents who strongly agreed/agreed with each statement.
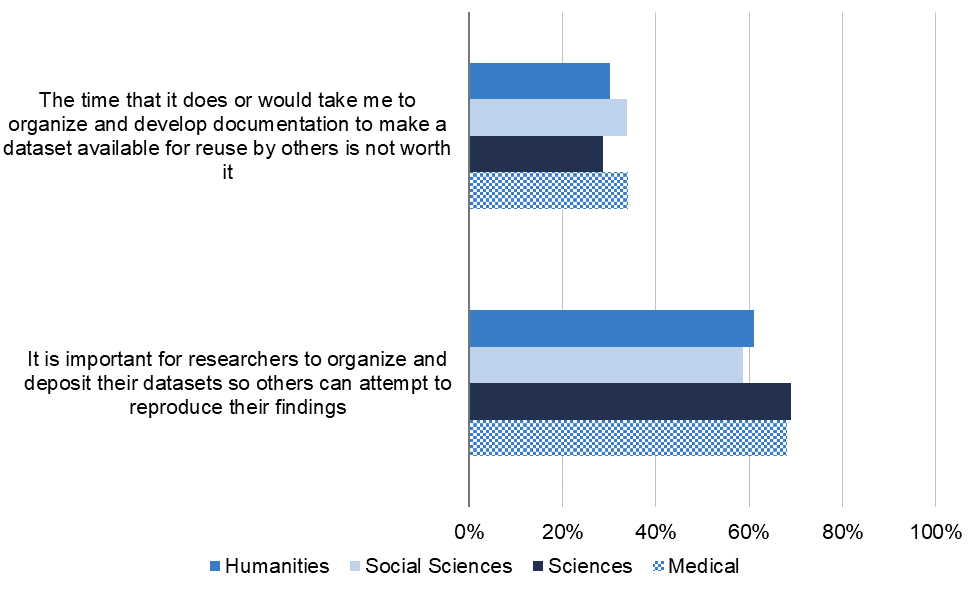
When considering the importance of developing and depositing datasets to promote reproducibility and credibility, consistent with past survey cycles, two thirds of faculty members agree that researchers should deposit their datasets to promote reproducibility, though about a third think that the time it takes to make these datasets available for their own work is not worth the effort (see Figure 24). By discipline, scientists were more likely than their colleagues in other disciplines to strongly agree that depositing data is an important practice for others, and that their time to do this for their own research is worth it.
Figure 24. Please read the following statements and indicate the degree to which you agree or disagree with each.
Percent of respondents who strongly agreed/agreed with each statement.
Research Dissemination
This section primarily reviews faculty’s preferred publication formats, the characteristics of journals they perceive as important when deciding where to publish, and their perspectives on open access models for scholarly publishing. Questions on research dissemination were only displayed to those who indicated they are conducting academic research among their professional responsibilities—83 percent of respondents. Overall, faculty prefer to publish in peer-reviewed journals, conference proceedings, and scholarly monographs, and are generally in favor of open access publication, though traditional incentives for tenure and promotion guide their publication decisions. New for the 2021 survey cycle, we asked how faculty would like to see an open access publication model financially supported—with most indicating their library should stay involved to help pay to make articles open access.
When considering the audiences of their disseminated research, the majority of faculty members specify that it is highly important that they reach other scholars in their specific sub-discipline or field of research—90 percent of faculty members rate scholars in their specific sub-discipline or field of research as a highly important audience for their work. As in past survey cycles, 75 percent of faculty members rate it highly important that their research reaches graduate students, and 71 percent see scholars in their discipline, beyond their specific sub-discipline, as an important audience. Half of faculty members rated it highly important that their research reaches policy makers in areas related to their field of research, and 39 percent that it reaches the general public beyond the scholarly and associated professional community.
Publication Formats
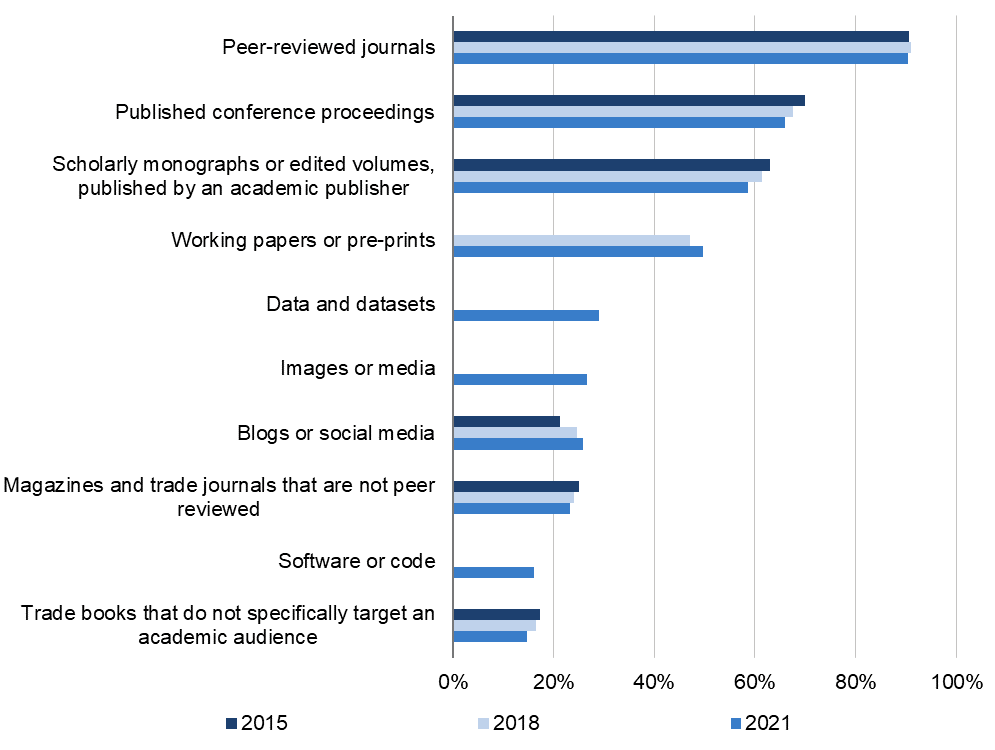
Overall, the majority of faculty members most often share their scholarly research via peer-reviewed journals, conference proceedings, and scholarly monographs or edited volumes–90 percent are often or occasionally publishing in peer-reviewed journals, 66 percent in conference proceedings, and 59 percent in scholarly monographs or edited volumes by an academic publisher (see Figure 25). Since 2015, there has been a marginal decrease in the frequency of faculty publishing scholarly monographs and conference proceedings, while faculty are consistently publishing in peer reviewed journals.
Figure 25. You may have the opportunity to share your scholarly research in a variety of different formats. Please use the scales below to indicate how often you have shared your scholarly research in each of the following ways in the past five years.
Percent of respondents who indicated they often or occasionally share their findings in each format.
By discipline, larger shares of faculty in the medical and science fields publish their research through peer-reviewed journals, conference proceedings, pre-prints, and datasets than their peers in the social sciences and humanities (see Figure 26). On the other hand, humanists and social scientists more frequently publish scholarly monographs with academic publishers. Scientists also more frequently publish software or code than faculty in other disciplines.
Figure 26. You may have the opportunity to share your scholarly research in a variety of different formats. Please use the scales below to indicate how often you have shared your scholarly research in each of the following ways in the past five years.
Percent of respondents who indicated they often or occasionally share their findings in each format.
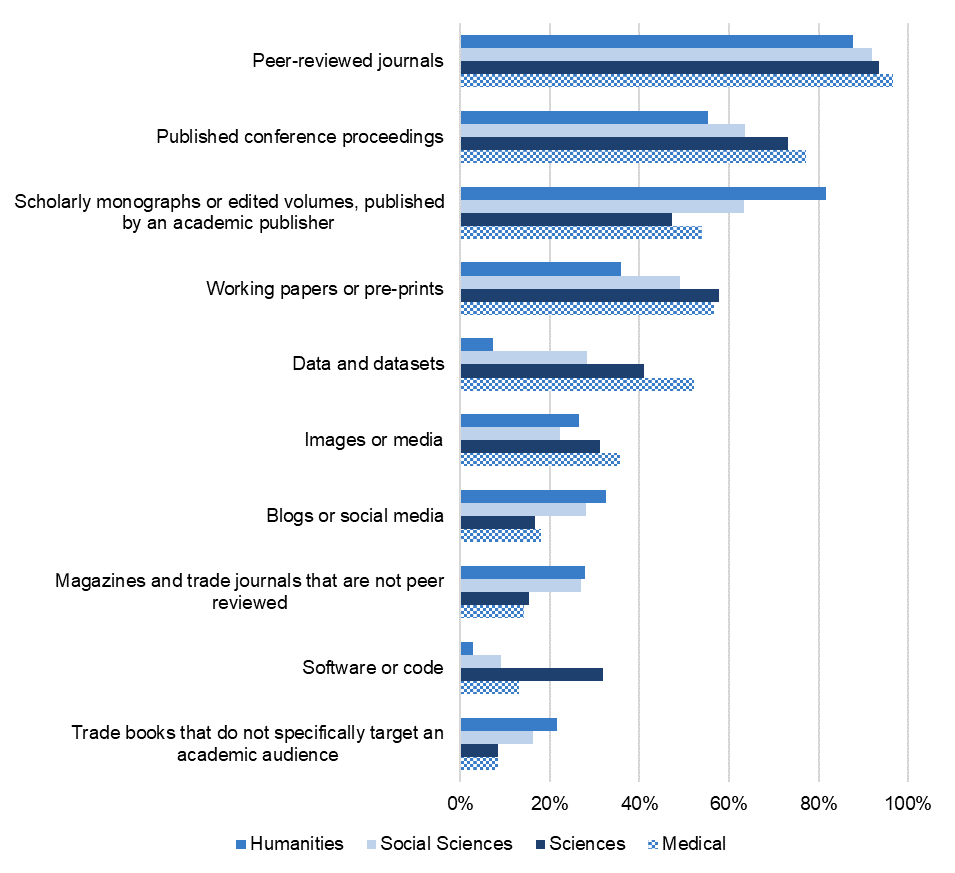
Over time, faculty publishing habits have remained largely consistent, apart from publishing pre-prints. In 2021, science and medical faculty increased their frequency of publishing pre-prints: 57 percent of medical faculty in 2021 often or occasionally publish their research through pre-prints compared to 43 percent in 2018. Similarly, the percent of scientists frequently publishing pre-prints grew from 49 percent in 2018 to 58 percent in 2021. This rise may be due in part to the greater urgency of disseminating scientific and medical findings quickly during the global pandemic.
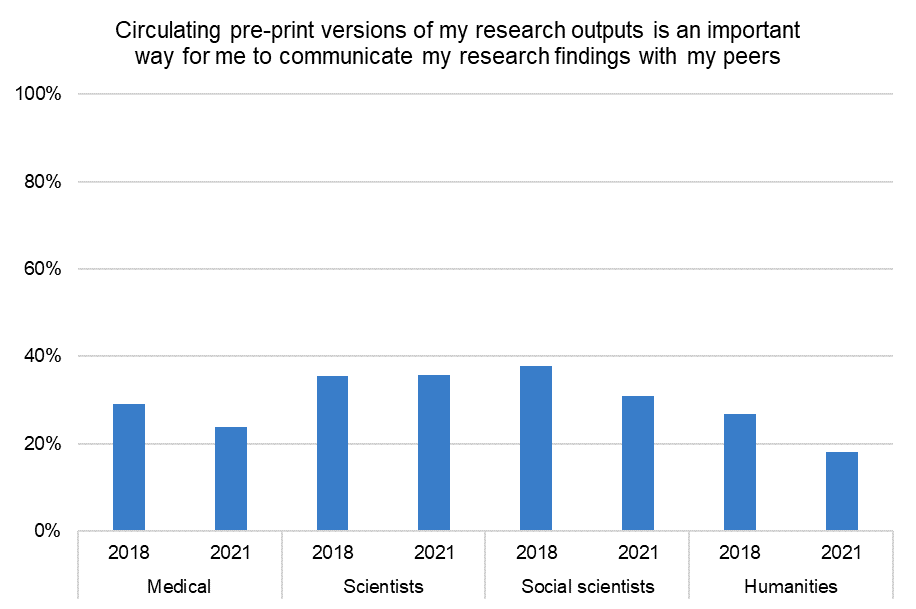
However, the value of circulating pre-prints appears to be depreciating over time. Only 30 percent of faculty in 2021 strongly agree that circulating pre-prints is an important way to communicate research findings, compared to about 36 percent of faculty in 2018 and 2015. By discipline, just a quarter of medical faculty strongly agree that circulating pre-prints is important compared to 36 percent of scientists, 31 percent of social scientists, and 18 percent of humanists. Over time, this decrease is primarily driven by humanists, social scientists, and medical faculty, with scientists remaining fairly consistent in their valuation of circulating pre-prints (see Figure 27).
Figure 27. Please use the 10 to 1 scales to indicate how well each statement describes your point of view.
Percent of respondents who strongly agreed with the following statements.
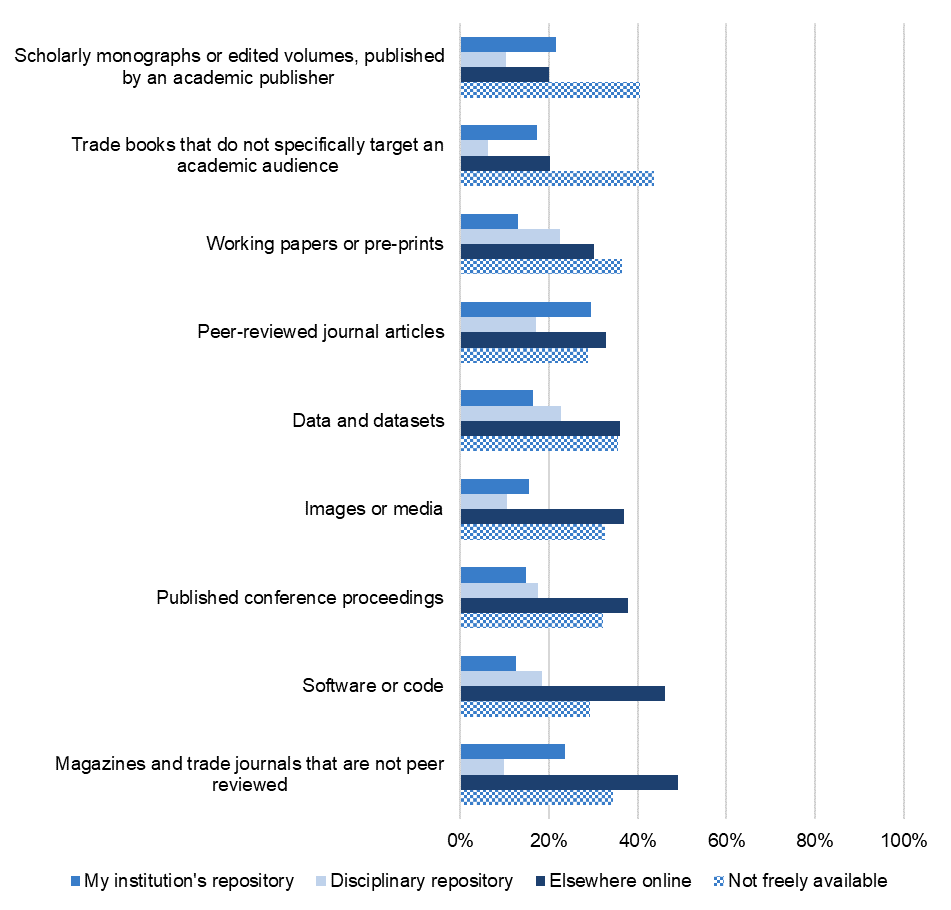
The majority of faculty members are also not using either their institution’s or a disciplinary repository to disseminate their research freely online. Only three in ten faculty members make their peer-reviewed journal articles freely available online through their institution’s repository, and a smaller share deposit magazine or trade journal articles (24 percent) or scholarly monographs (22 percent) in their institutional repository (see Figure 28).
Figure 28. Are your research publications and/or products freely available online through your institution’s repository, a disciplinary repository (such as arXiv, SSRN, etc.), or available elsewhere online (such as your personal webpage)?
Percent of respondents that selected each hosting source for each research product they publish.
Publication Characteristics
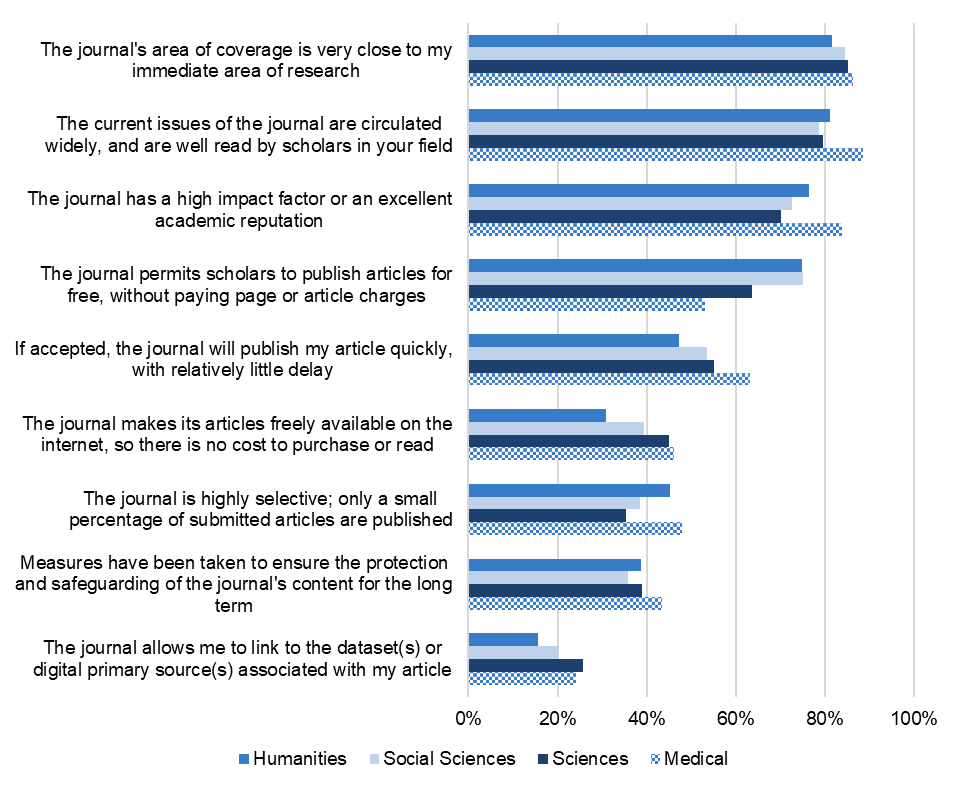
When making decisions on where to publish their articles, faculty continue to emphasize the importance of a journal’s area of coverage, wide circulation and readership, and impact factor and reputation—characteristics that tend to be valued by tenure and promotion committees (see Figure 29). Larger shares of medical faculty rate wide circulation, high impact factor, quick publication, and selectively as highly important compared to faculty in other disciplines. Humanists and social scientists are more apt than their science and medical colleagues to look for journals that do not have article processing fees. (see Figure 30).
Figure 29. When it comes to influencing your decisions about academic journals in which to publish an article of yours, how important to you is each of the following characteristics?
Percent of respondents who indicated that each of these characteristics is highly important.
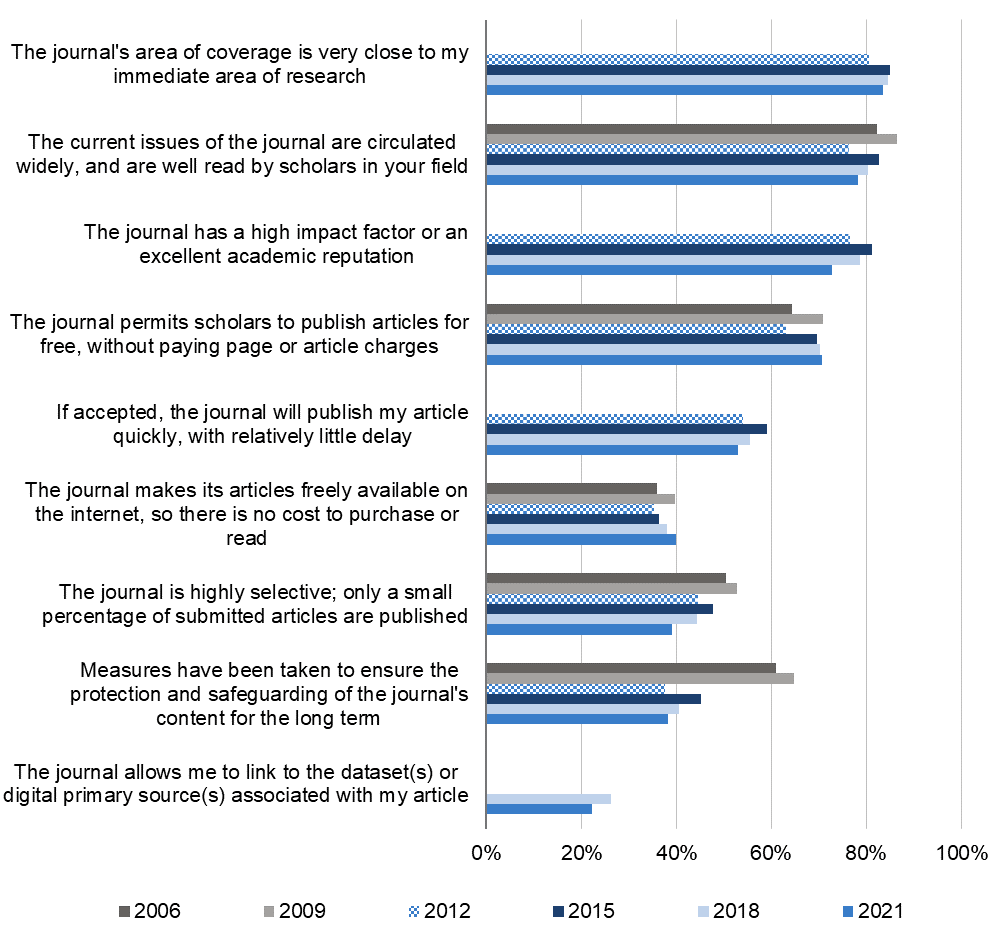
Of the three most important characteristics that faculty consider when deciding where to publish, there is a steady decline of the importance impact factor over time, while the importance of area of coverage and high readership have remained relatively similar to previous survey cycles. In 2021, 73 percent of faculty rated a high impact factor as highly important compared to 79 percent in 2018, and 81 percent in 2015. This decrease in the impact factor’s importance is primarily driven by scientists and medical faculty though the importance of a journal’s impact factor decreased in all disciplines—in 2021, 84 percent of medical faculty and 70 percent of scientists rated a high impact factor as highly important when deciding where to publish compared to 91 percent and 77 percent of faculty in these disciplines respectfully (see Figure 30).
Faculty are according less importance to a journal’s impact factor when deciding where to publish their scholarly research.
Figure 30. When it comes to influencing your decisions about academic journals in which to publish an article of yours, how important to you is each of the following characteristics?
Percent of respondents who indicated that each of these characteristics is highly important.
Perspectives on Open Access
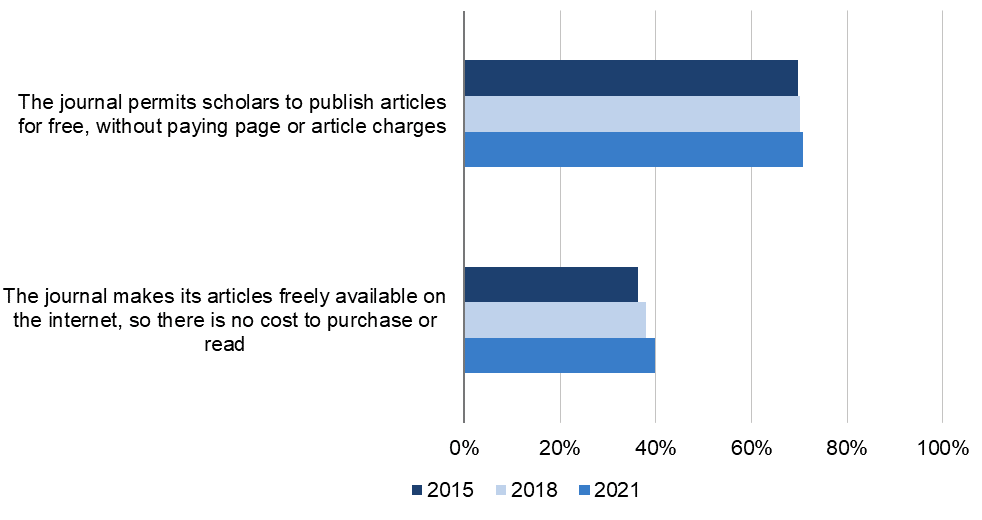
While the majority of faculty are interested in open access publication models, traditional scholarly incentives continue to motivate their publication preferences. Faculty are placing more importance on a journal having no processing fees (71 percent) over a journal making its content freely available to the public (40 percent). This is largely consistent with previous survey cycles (see Figure 31).
Figure 31. When it comes to influencing your decisions about academic journals in which to publish an article of yours, how important to you is each of the following characteristics?
Percent of respondents who indicated that each of these characteristics is highly important.
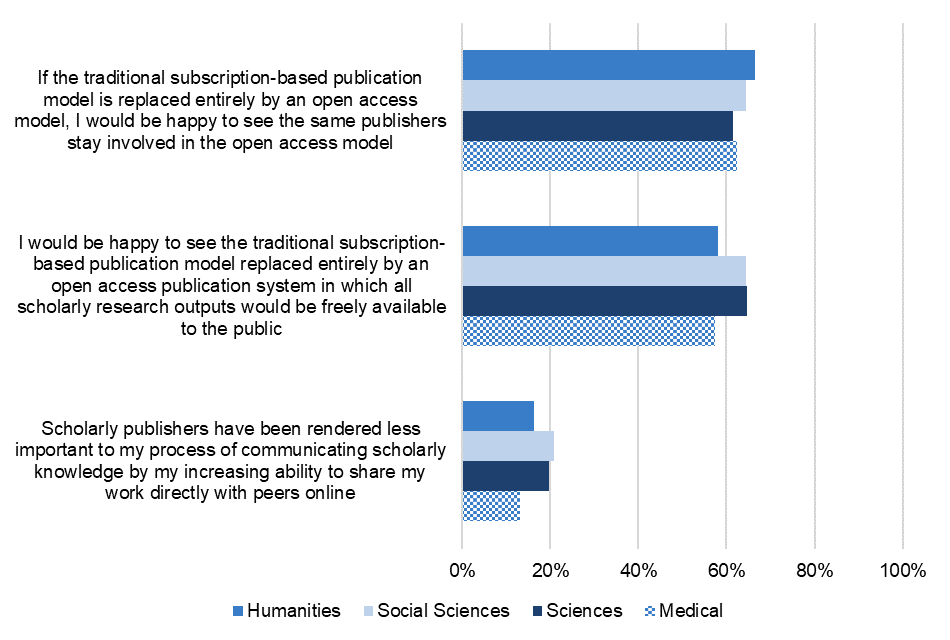
Despite these publication preferences, faculty members remain generally interested in seeing the traditional subscription-based publication models replaced entirely by an open access model–63 percent of faculty members in 2021 agree they would be happy to see this change and would be happy to see the same publishers stay involved (see Figure 32). By discipline, larger shares of social scientists and scientists agree that they would be happy to see the current publication system replaced by an open access one, compared to their peers in other disciplines (see Figure 33).
Additionally, younger faculty are more open to an open access publication model than their older peers: 70 percent of faculty ages 22 to 44 agree that they would be happy to see an open access publication system replace the traditional subscription-based system, followed by 63 percent of faculty ages 44 to 54, 61 percent ages 55 to 64, and 57 percent ages 65 and older. Larger shares of contingent faculty (55 percent) rate a journal making its articles freely available on the internet highly important compared to their tenure-line colleagues (38 percent).
Figure 32. Please use the 10 to 1 scales to indicate how well each statement describes your point of view.
Percent of respondents who strongly agreed with the following statements.
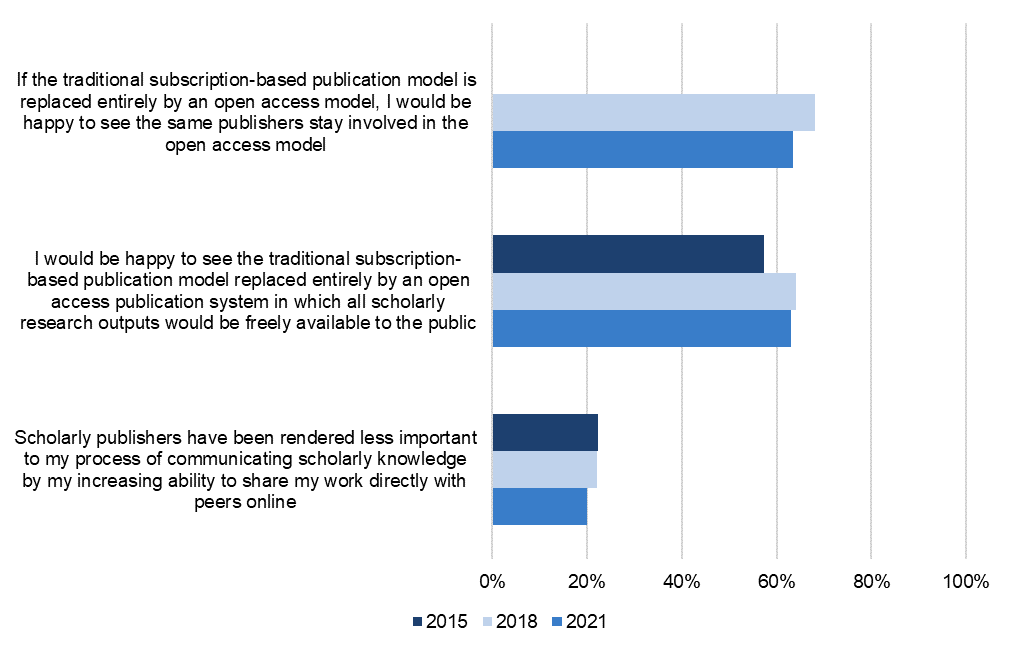
Figure 33. Please use the 10 to 1 scales to indicate how well each statement describes your point of view.
Percent of respondents who strongly agreed with the following statements.
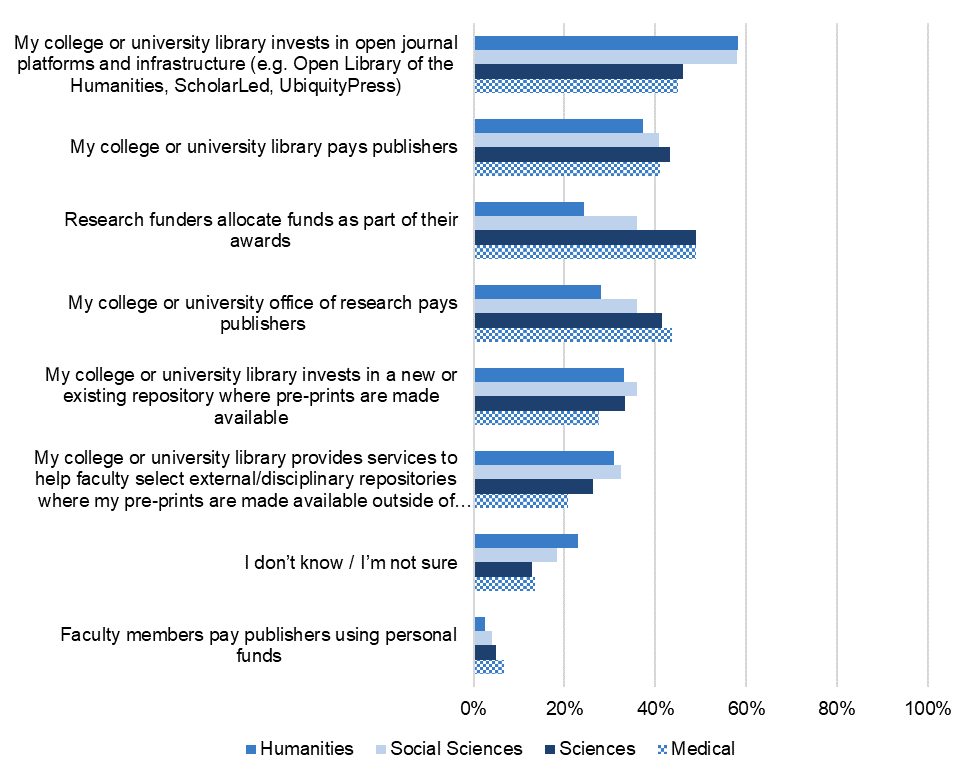
Newly added to the 2021 survey cycle, faculty who responded that they would be open to an open access publication model were asked which payment models they would most prefer. Here, the majority think that the library should play a large role. Half of faculty indicated that they would be open to their college or university library investing in open journal platforms and infrastructure, such as the Open Library of the Humanities and ScholarLed, followed by four in ten who indicated that libraries could pay publishers for open access. One third believe that research funders should allocate open access fees as part of their awards, or that their college or university office of research should pay publishers directly (see Figure 34). Less than 20 percent of faculty don’t know or are unsure of their preference for an open access payment model, and unsurprisingly, only 4 percent selected that faculty members should pay using personal funds. When given the option to write in another payment model, most cited government (either federal or state) support, support from scholarly societies, or community-based publications replacing the current subscription-based system.
Faculty members continue to be interested in an open access publication model and see their library as key in financially supporting open access infrastructure. Faculty members want the library’s involvement in financially supporting an open access system and are specifically open to their college or university library investing in open journal platforms and infrastructure to do so.
By discipline, more humanists and social scientists are in favor of library investment in open infrastructure and services for repository publication, whereas more scientists and medical faculty wish to see open access paid for through research funders and their institution’s research support (see Figure 34). Faculty members at Doctoral institutions are keen on their library paying publishers directly—43 percent of faculty at doctoral institutions selected this payment method compared to 36 percent of faculty at both Master’s and Baccalaureate institutions. Additionally, 40 percent of faculty at Doctoral institutions are in favor of research funders allocating funds towards open access compared to about a third of faculty at Master’s and Baccalaureate institutions.
Figure 34. You previously indicated you would be happy to see the traditional subscription-based publication model replaced entirely by an open access publication system in which all research outputs would be freely available to the public. What payment model would you most prefer under an open access publication system? Please select all that apply.
Percent of respondents that selected each payment model.
Teaching and Learning
The following section covers faculty instructional practices and attitudes, including their perceptions and use of Open Educational Resources (OER). In light of the complex nature of the global pandemic and calls for racial equity in higher education and beyond in 2020, along with the demand for unique instructional approaches, questions were added to this survey cycle on instructional support and equitable and holistic teaching practices. Questions on teaching and learning were only displayed to those who indicated they are teaching undergraduate or graduate courses. Overall, 98 percent of faculty members are teaching undergraduate and graduate courses, with 81 percent of those faculty teaching an upper division course, 64 percent a lower division course, and 57 percent a graduate level course.
Perspectives on Instructional Support
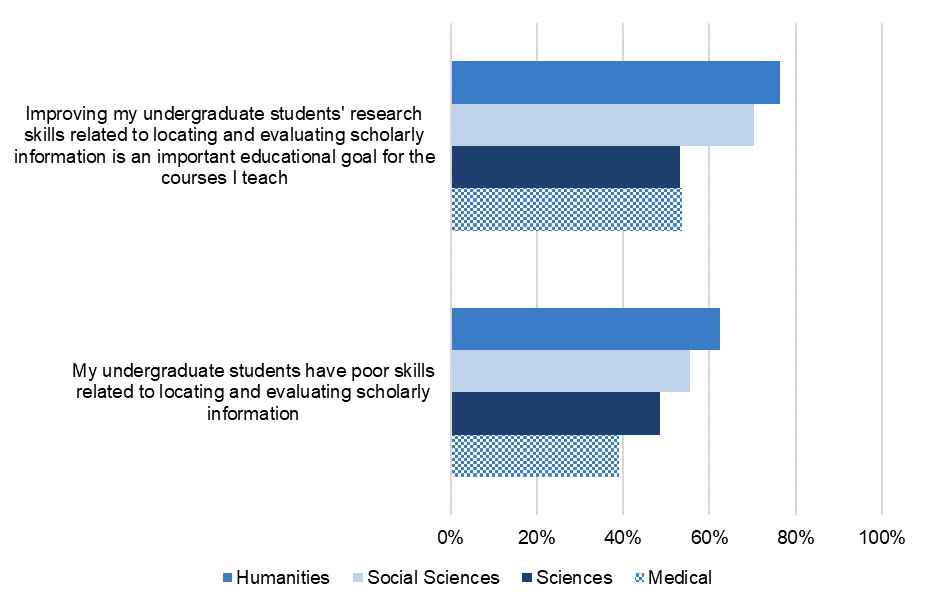
Consistent with shares of faculty from previous survey cycles, two thirds of faculty members agree that improving their undergraduate students’ research skills related to locating and evaluating scholarly information is an important goal for the courses they teach, yet 55 percent agree that their undergraduate students have poor skills in these areas. A larger share of instructors in the humanities and social science disciplines strongly agree that improving these research skills is an important objective of their courses yet feel that their students have poor skills in these areas (see Figure 35).
Figure 35. Please use the 10 to 1 scale to indicate how well each statement describes your point of view.
Percent of respondents who strongly agreed with the following statements.
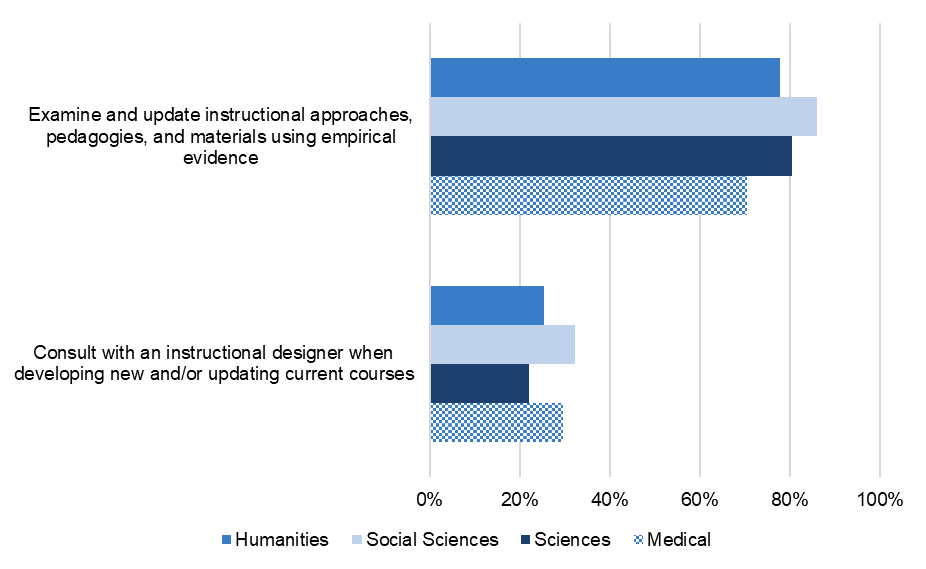
When designing and structuring their undergraduate courses, the majority of faculty more frequently consult empirical evidence than an instructional designer. Eight in ten faculty members often or occasionally examine their instructional approaches, pedagogies, and materials using empirical evidence, such as learning analytics tools, or other scholarly literature, compared to three in ten who consult with an instructional designer. By discipline, social science faculty more often update their instructional approaches compared to their peers in other disciplines, with scientists and social scientists more frequently using empirical evidence to examine their instructional approaches, and social scientists and medical faculty more frequently consulting with instructional designers (see Figure 36).
Figure 36. In general, how often do you perform each of the following when designing or structuring your undergraduate courses?
Percent of faculty teaching undergraduate courses who are often or occasionally performing each activity.
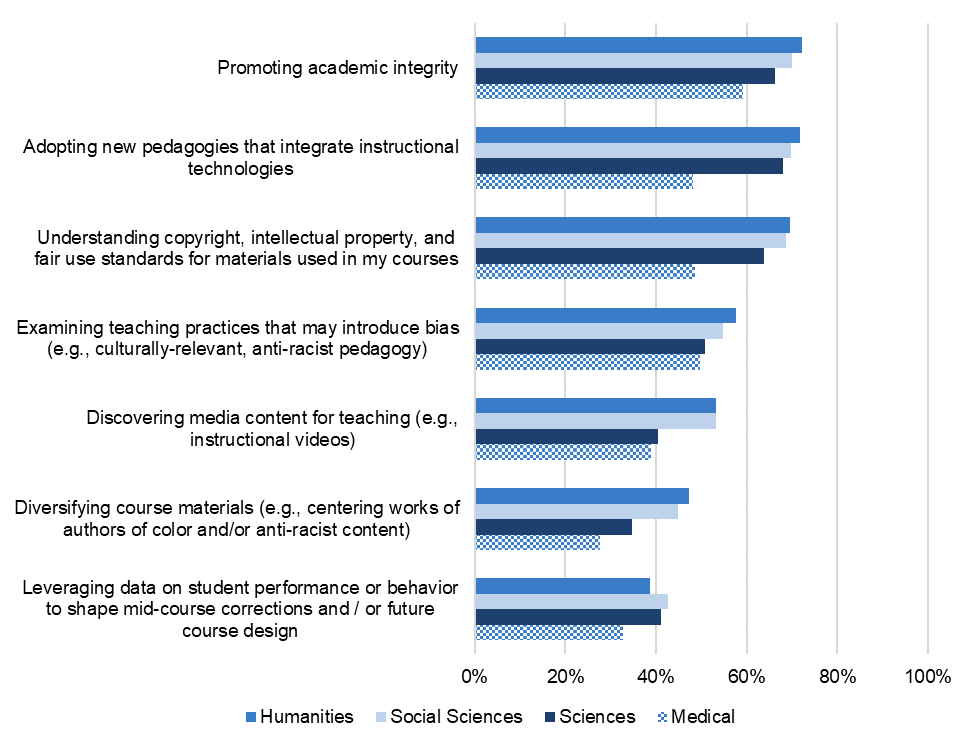
New this cycle, the survey included a question on the various instructional supports faculty receive, either through their college or university library, an instructional designer, teaching and learning center, or elsewhere. Overall, seven in ten teaching faculty are receiving support to promote academic integrity, adopt new pedagogies that integrate instructional technology, and understand copyright standards for their instructional materials (see Figure 37). Medical faculty members are not receiving the same level of support compared to their peers in other disciplines. Larger shares of humanists and social scientists are also receiving support towards discovering media content and diversifying course materials than their colleagues in other disciplines.
Figure 37. Does your college or university library, instructional designer, teaching and learning center, or another service provider assist you with any of the following aspects of instruction?
Percent of respondents that indicated they receive support on each of the following instructional activities.
Open Educational Resources
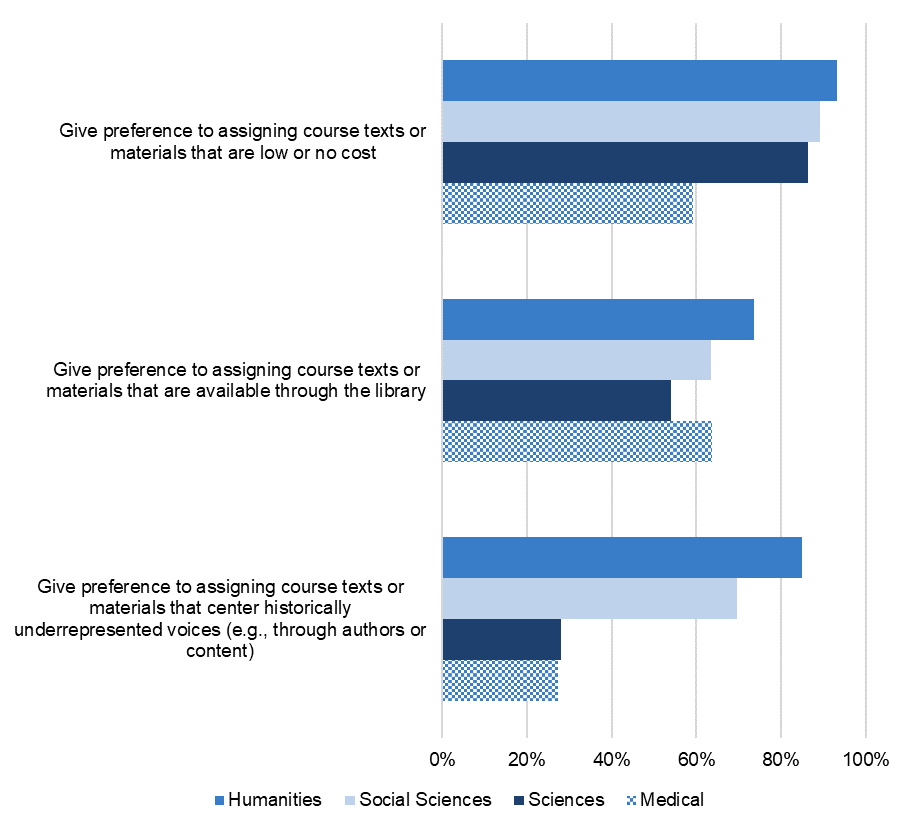
Consistent with previous survey cycles, the majority of faculty want to ease the cost burden of course materials for their students, preferring to assign texts that are available at low or no cost (88 percent) or through the library (61 percent). Relatively speaking this is less of a concern for medical faculty. On the other hand, humanists rely on the library more so than faculty in other disciplines (see Figure 38). Fifty-six percent of faculty members also give preference to assigning materials that center historically underrepresented voices, with higher percentages of humanists (85 percent) and social scientists (70 percent) taking this approach than scientists (28 percent) and medical faculty (27 percent).
Figure 38. In general, how often do you perform each of the following when designing or structuring your undergraduate courses?
Percent of faculty teaching undergraduate courses who are often or occasionally performing each activity.
Another option when providing low- or no-cost options for students is through the creation and use of Open Educational Resources (OER). OER are defined as teaching, learning, and research materials used for educational purposes that reside in the public domain or have been released under an open license, such as Creative Commons, that permits no-cost access, use, adaptation, and redistribution by others with no or limited restrictions.[8]
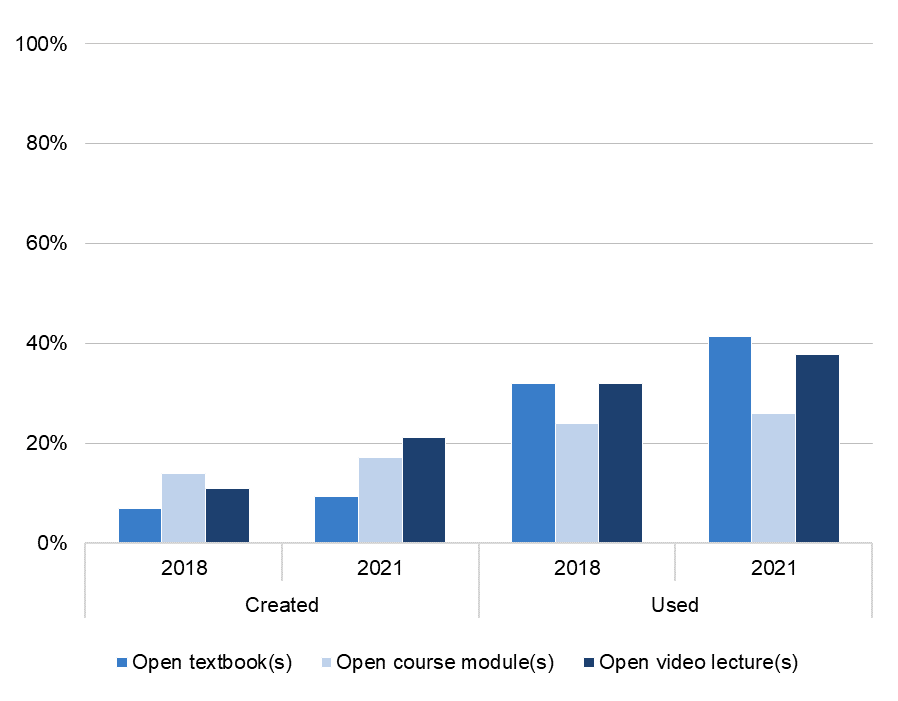
The global pandemic led to an increased need for virtual learning environments, and there has been a notable increase in the amount of faculty creating and using OER since 2018 (see Figure 39). Overall, more faculty members use OER than create them, though the share of faculty who have created any OER increased has also increased along with the share of faculty who have used OER. In 2021, 41 percent of faculty reported using open textbooks, 38 percent have used open video lectures, and 26 percent have used open course modules (see Figure 39).
The disruptions of recent years have yielded a substantial increase in the use and creation of open educational resources (OER), textbooks, course modules, and video lectures.
Figure 39. Which, if any, of the following open educational resources have you created and/or used in your courses? Please check all that apply.
Percent of respondents who indicated they have created and/or used each of the following.
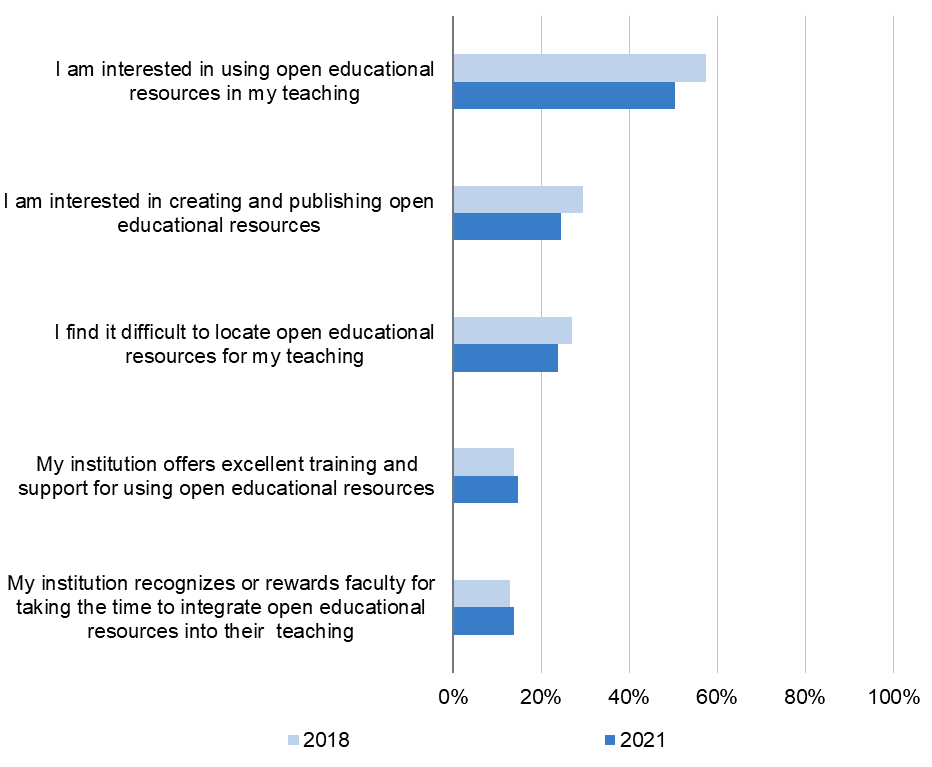
Unintuitively, while more faculty are using and creating OER since 2018, interest in using and creating OER has declined in that same period. In 2018, 57 percent agreed they were interested in using OER compared to 51 percent in 2021. We see a similar decrease for those interested in creating and publishing OER–30 percent of faculty in 2018 were interested in creating OER in 2018 compared to 25 percent in 2021 (see Figure 40). This may be due to the continued lack of incentive, either monetary or through new professional development opportunities, for adopting OER into their courses.
Figure 40. Please read the following statements and indicate the degree to which you agree or disagree with each.
Percent of respondents who agreed or strongly agree with each statement.
In 2021, scientists and social scientists are relatively more interested in using or creating OER—with around half agreeing or strongly agreeing that they are interested in using OER compared to 45 percent of humanists and 38 percent of medical faculty (see Figure 41). Slightly greater shares of humanists and social scientists agree or strongly agree that they find OER difficult to locate. We also see a difference based on faculty age. Fifty-eight percent of faculty aged 22 to 44 agree or strongly agree they are interested in using OER in their courses, followed by 52 percent in the 45 to 54 age range, 48 percent of those aged 55 to 64, and 42 percent of those 65 years old or older. We also saw stronger interest from younger faculty in creating and publishing, though across age ranges, the interest was relatively low (19-30 percent). Additionally, 61 percent of contingent faculty agree they are interested in using OER and 31 percent are interesting in creating them compared to 48 percent and 22 percent of tenure-line faculty respectively.
Figure 41. Please read the following statements and indicate the degree to which you agree or disagree with each.
Percent of respondents who agreed or strongly agree with each statement.
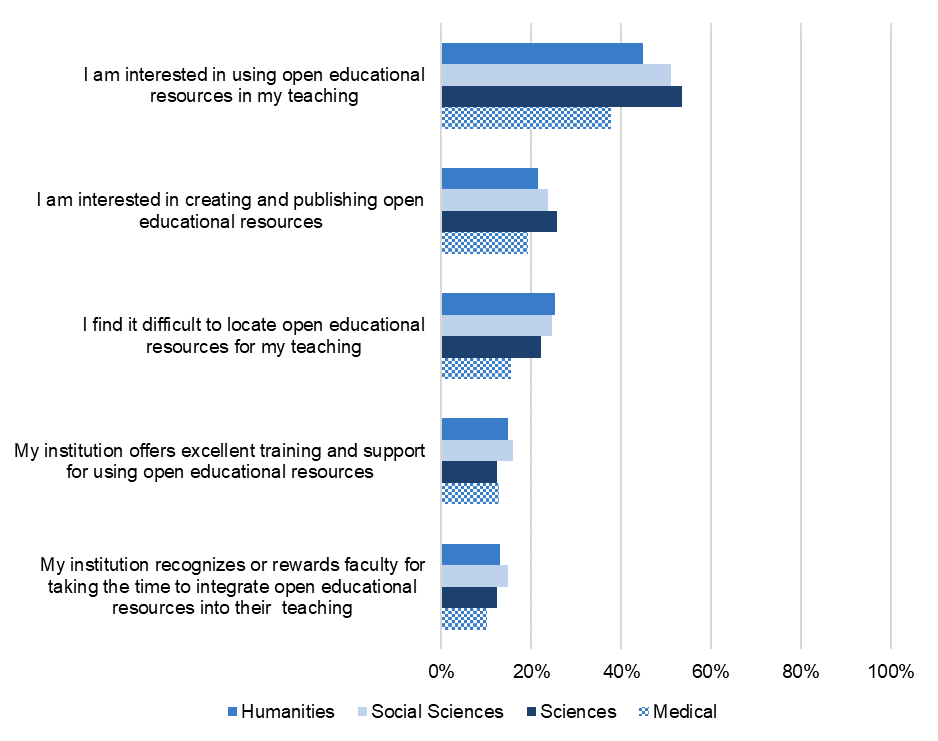
Offering incentives and informative training to create and use OER may be an effective way to bolster their adoption, though since 2018, less than 20 percent of faculty members agree or strongly agree that their institution rewards faculty for integrating OER into their courses or provides training for using them (see Figure 40). Additionally, faculty members are on the fence when it comes to locating OER for their teaching—a quarter of faculty members agree that they find it difficult to locate OER for their teaching compared to 15 percent who disagree, the remaining share of faculty members neither agree nor disagree that OER are difficult to locate.
Role of the Library
The following section considers faculty’s perception of the role of their university or college’s library. Since 2003, we have been querying faculty on the importance of various functions of their college or university library to track perceptions of the library over time. Two new items were added to the 2021 survey cycle: the role of the library in supporting access to needed technological resources and its role as an informal environment to support student learning. The following are the nine items presented to respondents, including a shorthand name used in this document (but not presented to respondents in the survey) for reference:
- Archive: “The library serves as a repository of resources—in other words—it archives, preserves, and keeps track of resources”
- Buyer: “The library pays for the resources I need, from academic journals to books to electronic databases”
- Gateway: “The library serves as a starting point or “gateway” for locating information for my research”
- Graduate Support: “The library supports graduate students in conducting research, managing data, and publishing scholarship”
- Physical space: “The library provides an informal academic environment and space that supports student learning”
- Research Support: “The library provides active support that helps to increase the productivity of my research”
- Teaching Support: “The library supports and facilitates my teaching activities”
- Technology access: “The library provides access to technology resources that support student learning”
- Undergraduate Support: “The library helps undergraduates develop research, critical analysis, and information literacy skills”
Despite that the buyer role is consistently reported as the most important library function—with 84 percent of respondents in 2021 rating this function as highly important—the majority of faculty perceive the library’s support of students, including providing access to technology and serving as an informal academic space, as the library’s most important functions over direct support to faculty themselves. Still, the library’s role as a buyer of needed scholarly resources and databases is rated as relatively more important than other library roles (see Figure 42). Eight in ten faculty members rate technology access and physical space as highly important, followed by three quarters who rated undergraduate support as highly important. Additionally, endorsement of the library’s graduate support role has increased since 2018 when we first asked about this library function.
While faculty members continue to view the library’s most important function to be that of buyer of scholarly resources, they consider the library’s role in providing direct support to students as essential.
Figure 42. How important is it to you that your college or university library provides each of the functions below or serves in the capacity listed below?
Percent of respondents that rate each function of the library as highly important.
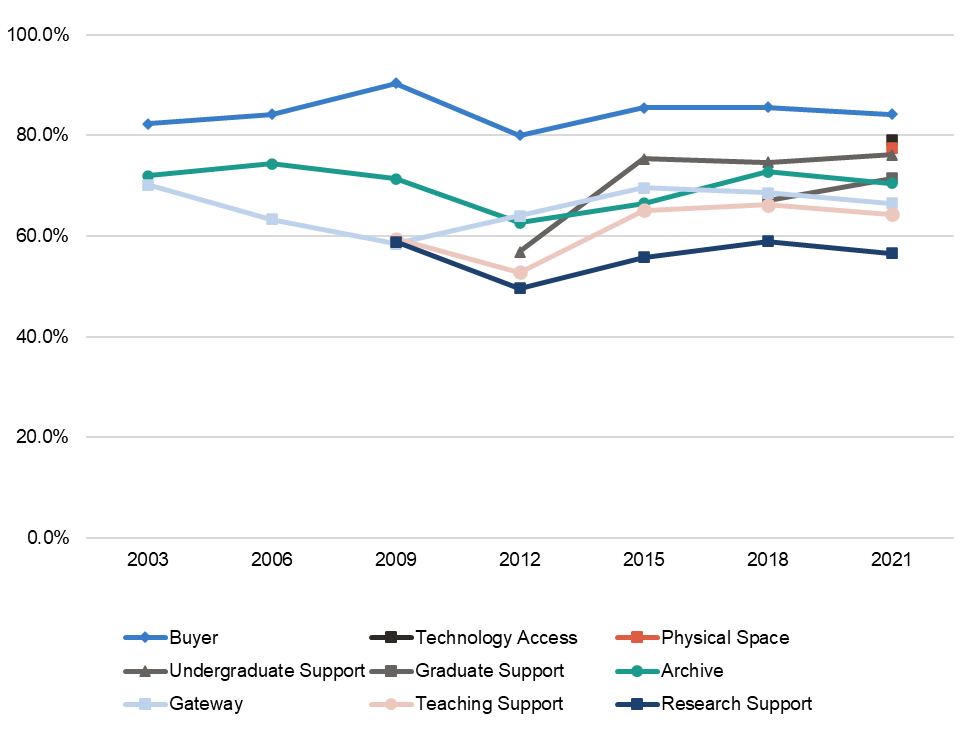
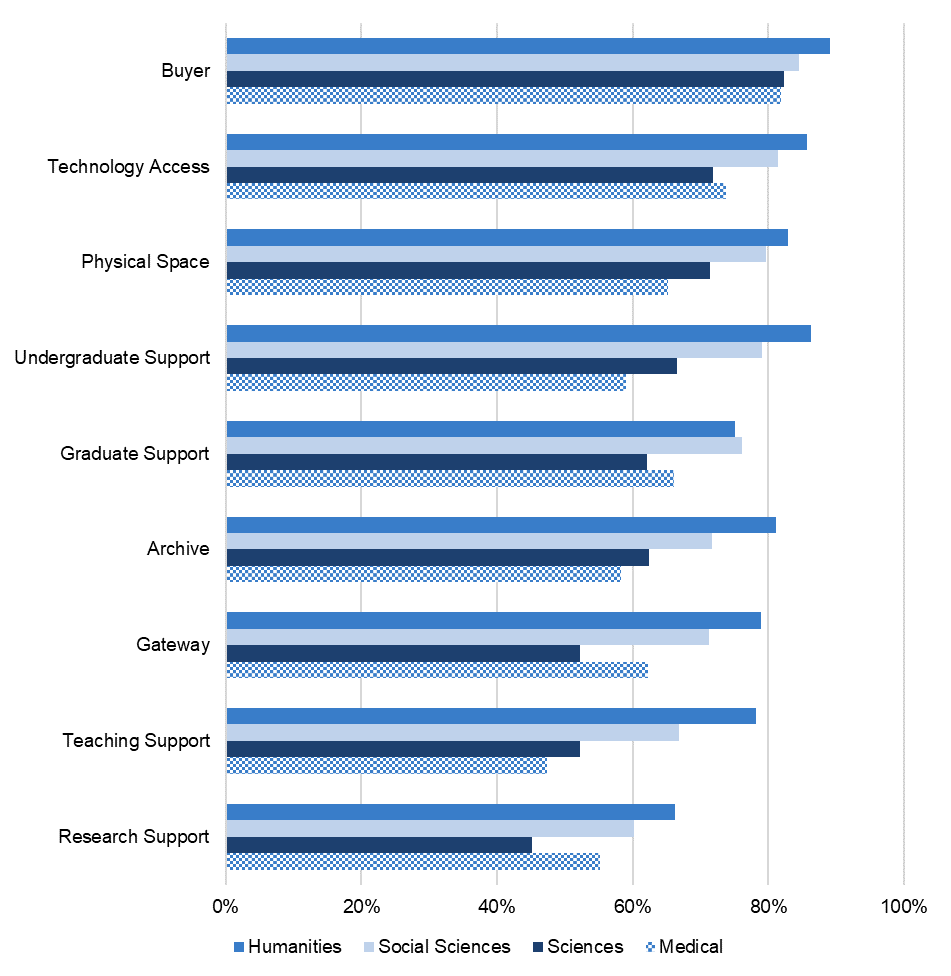
By discipline, larger shares of humanists and social scientists rated each role of the library as highly important compared to their scientist and medical peers, whereas over 80 percent of faculty across all disciplines rated the library as buyer of needed resources as highly important (see Figure 43). Larger shares of medical faculty than their scientist peers rated the library’s support of their research as relatively more important—specifically as a gateway for locating information for their research and increasing their research productivity. Since 2015, endorsement for the buyer role has not changed across any discipline. Scientists rated the libraries support of graduate students more highly in 2021 than in 2018, but we did not see an increase for other disciplines.
Figure 43. How important is it to you that your college or university library provides each of the functions below or serves in the capacity listed below?
Percent of respondents that rate each function of the library as highly important.
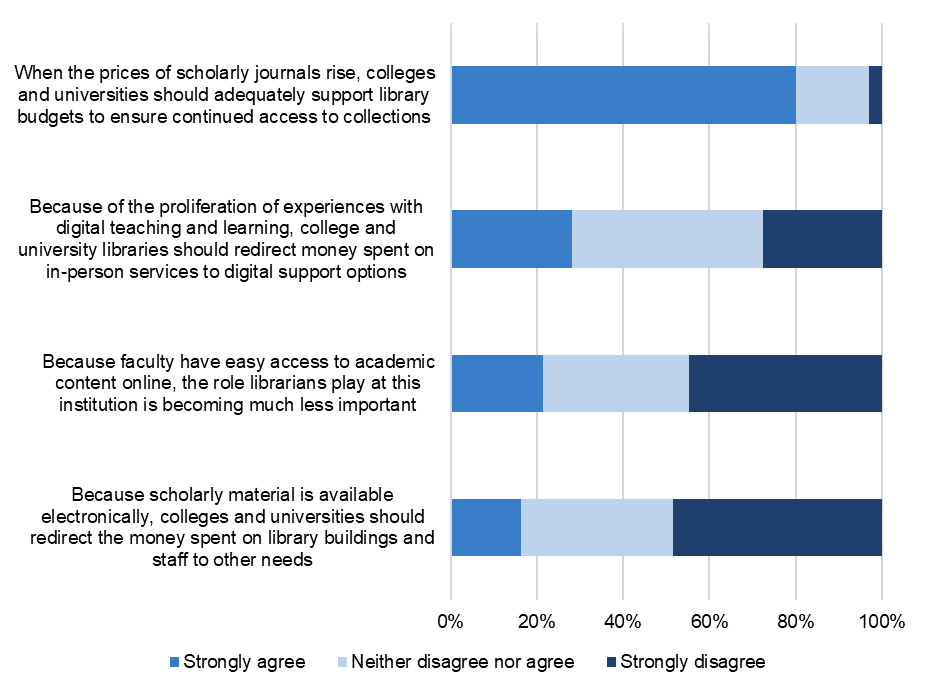
With faculty endorsing the buyer role as the most important library function for the past two decades, we see that faculty generally support sustaining the library’s budget despite the increase in electronic and online content. Similar to past survey cycles, 80 percent of faculty strongly agree that when the prices of scholarly journals rise, their college or university should adequately support library budgets to ensure continued access, and 45 percent disagree that because of easier access to content online that the library’s role is less important (see Figure 44).
Because the majority of faculty consider the library as an informal academic space to promote student learning, many faculty support the library’s budget to maintain library buildings and staff—half of faculty members disagree that because scholarly materials are available electronically that funding towards library buildings and staff should be reallocated to other needs (see Figure 44). However, faculty are relatively unsure if libraries should reallocate money spent on in-person services to digital support options because of the proliferation of digital teaching and learning experiences, as 44 percent of faculty neither agreed nor disagreed with this sentiment.
Figure 44. Please use the 10 to 1 scale below to indicate how well each statement describes your point of view.
Percent of respondents who strongly agreed, neither agreed nor disagreed, or strongly disagreed with each statement.
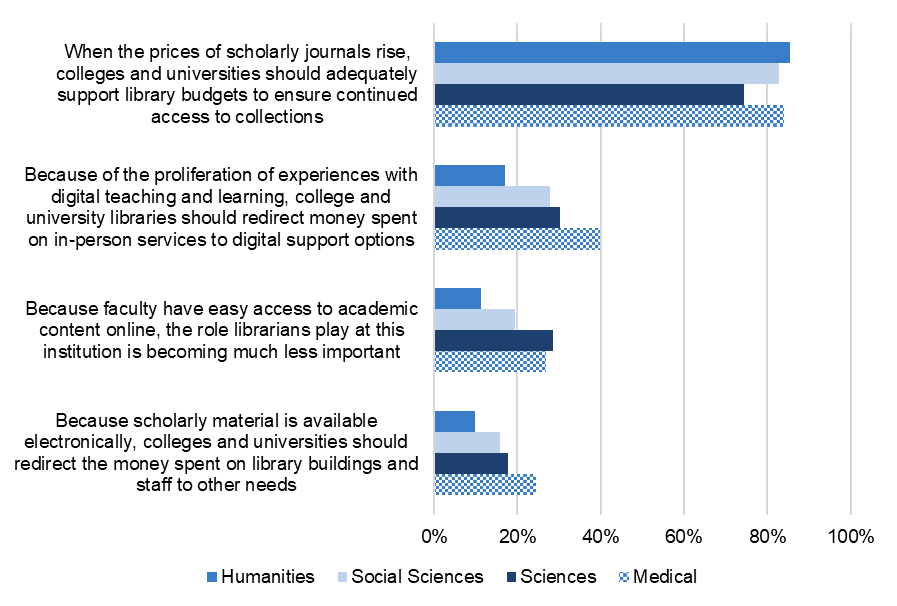
By discipline, more humanists and social scientists disagree that library budgets should be redirected elsewhere or that the role librarians play is becoming less important due to increased digital resource and service offerings compared to their medical and scientist peers (see Figure 45). However, a similar share of medical faculty along with faculty members in the humanities and social sciences strongly agree that their institutions should support library budgets over time to ensure continued access to collections compared to their scientist colleagues.
Figure 45. Please use the 10 to 1 scale below to indicate how well each statement describes your point of view.
Percent of respondents who strongly agreed with each statement.
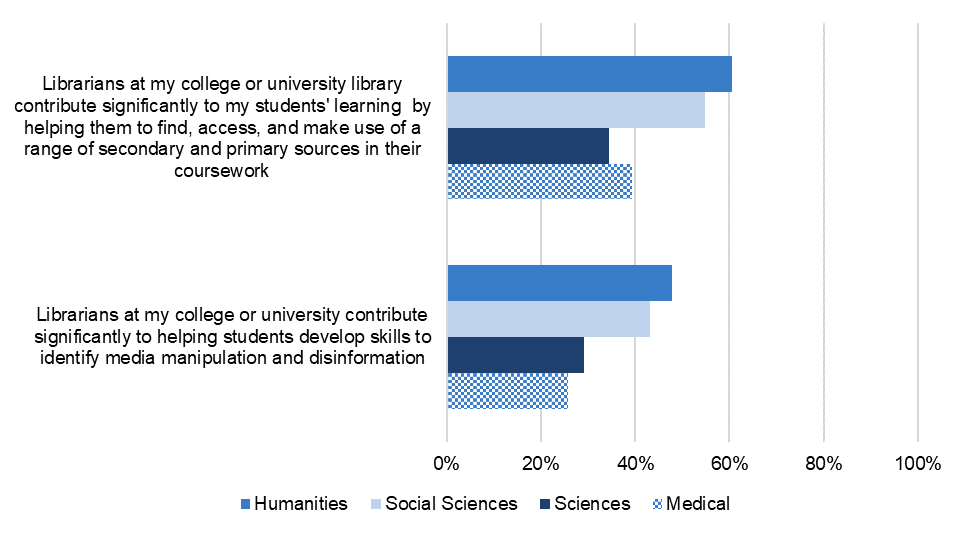
Faculty view the library, not only as the buyer of needed scholarly materials, but also as a support towards student learning. This is exemplified by over 70 percent of faculty rating both the undergraduate and graduate student support roles of the library as highly important. Despite this, half of faculty strongly agree that librarians themselves contribute towards student learning by helping them find and access primary and secondary sources in their coursework, and only four in ten faculty members strongly agreed that librarians support the development of skills related to identifying media manipulation and disinformation (see Figure 46).
Additionally, over time, faculty are relatively less likely in 2021 to agree that librarians are supporting student’s discovery and use of scholarly materials—56 percent of faculty strongly agreed in 2018 and 2015 compared to 49 percent of faculty in 2021. Perceptions surrounding the library’s role in helping students develop skills to identify media manipulation has remained relatively the same over time. By discipline, humanists and social scientists are more likely to agree that librarians provide these direct supports for students than their scientist and medical faculty peers (see Figure 46).
Figure 46. Please use the 10 to 1 scales to indicate how well each statement describes your point of view.
Percent of respondents who strongly agreed with the following statements.
Faculty Support at the Library
Even though the majority of faculty see the library’s roles as a buyer of scholarly resources and in supporting student learning as most important, there are many ways in which faculty would find additional support from their library valuable for both their research and instructional practices. Faculty would generally value additional instructional support from their library over services related to their publication process.
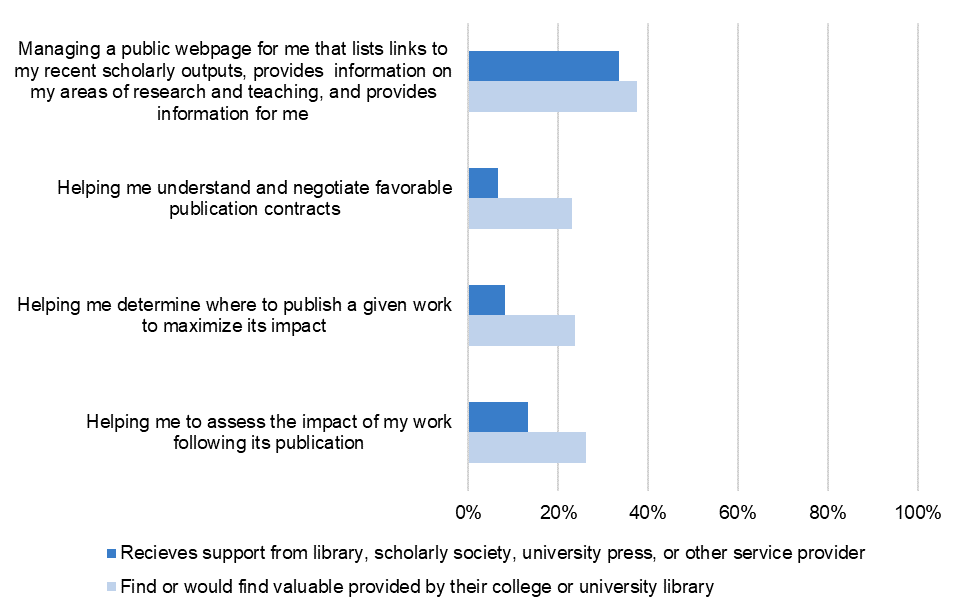
The majority of faculty are not receiving any support throughout their publication process from their college or university library, scholarly society, university press, or other service provider. Only a third indicated that they receive support from their library, scholarly society, university press, or another provider in managing a public webpage that links to their recent scholarly outputs, and less than 20 percent are receiving any support for assessing the impact of their work following publication, determining where to publish to maximize the impact of their work, or understanding and negotiating favorable publication contracts (see Figure 47). Since 2018, lower rates of faculty indicate they are receiving support for any of these aspects of the publication process from any service provider.
When considering if these publication support services are or would be valuable at their college or university library specifically, 38 percent of faculty rated support with managing a public webpage as highly valuable, followed by around a quarter of faculty who would find support for other publication activities highly valuable. These rates are consistent with the previous two survey cycles.
Figure 47. Does your college or university library, scholarly society, university press, or another service provider assist you with any of the following aspects of the publication process? And, how valuable do you find support from your college or university library for each of the following aspects of the publication process, or how valuable would you find it if this support was offered to you?
Percent of respondents who currently receives each support from any provider and find or would finds each support service from their library highly valuable.
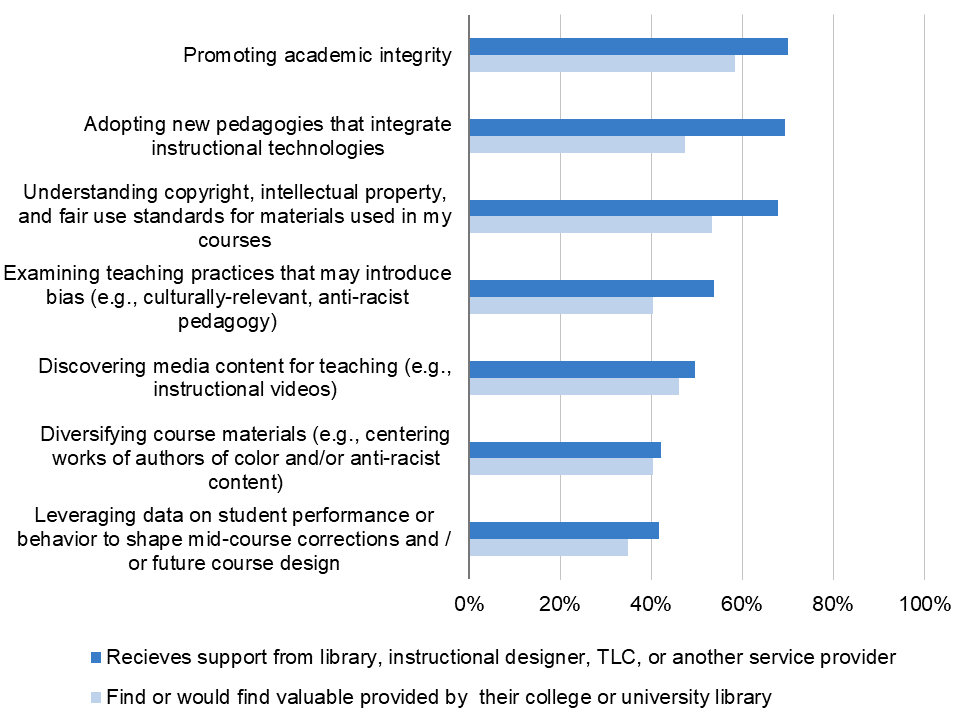
This survey cycle introduced new questions on the various instructional supports faculty are provided with, either through the library, an instructional designer, teaching and learning center (TLC), or elsewhere. Over half of faculty are receiving support in a number of areas from one or more of these providers (see Figure 37 above). Despite that other units on campus do provide support, many faculty members consider the library a valuable source of support for a range of instructional activities, from promoting academic integrity (60 percent), to helping faculty understand copyright, intellectual property, and fair use standards for the materials used in their courses (53 percent), to adopting new pedagogies that integrate instructional technologies and discovering media content such as instructional videos for their teaching (47 percent) (see Figure 48).
Figure 48. Does your college or university library, instructional designer, teaching and learning center, or another service provider assist you with any of the following aspects of instruction? And, how valuable do you find support from your college or university library for each of the following aspects of instruction, or how valuable would you find it if this support was offered to you?
Percent of respondents who currently receives each support from any provider and finds or would find each support service from their library highly valuable.
Appendix: Methodology
Consistent with previous cycles of the US Faculty Survey, our sample was drawn from a population of US faculty contact information collected and maintained by MDR, a marketing names list vendor.
Our sampling strategy for 2021 closely aligned with that from previous cycles of the survey. We selected a sample of faculty members at four-year colleges and universities from MDR’s list affiliated with the following Carnegie Classifications: Baccalaureate Colleges – Arts & Sciences; Baccalaureate Colleges – Diverse Fields; Master’s Colleges & Universities (smaller programs); Master’s Colleges & Universities (medium programs); Master’s Colleges & Universities (larger programs); Doctoral/Professional Universities; Doctoral Universities (high research activity); Doctoral Universities (very high research activity); Special Focus Four-Year: Medical Schools & Centers; Special Focus Four-Year: Other Health Professions Schools.[9]
Within these Carnegie Classifications, we sampled from the same range of fields and disciplines as the 2018 sample. As in 2015 and 2018, we also included medical faculty members who were sampled from a separate population; these faculty were from all departments of medical schools and not from departments of nursing, dentistry, or other health professionals. Due to the addition of medical faculty, in 2015, and the addition of faculty in the Agriculture and Foreign Language disciplines in 2018, respondents from these fields have been excluded from aggregate results presented in this report to enable comparability with previous cycles. However, faculty from these disciplines are included in stratified analysis in this report.
Consistent with previous survey cycles, we slightly adapted the sampling procedure for faculty members at five colleges and universities out of the roughly 1,500 included in our sample. These institutions fielded the US Faculty Survey locally, concurrent with the administration of the national survey. Respondents at these institutions received the core national questionnaire and then following the national survey, faculty members at some of these locally participating institutions received a set of additional questions. In this way, responses to the national questionnaire were not influenced by the additional thematic items.
Faculty members at these five institutions received email invitations from a member of their own campus community, and only those faculty members who were originally selected in the MDR sample were included in the national analysis of results. We enabled this by embedding metadata for any faculty members at the five local institutions who would have otherwise been selected as part of the national survey sample; faculty members who were identified within both the local and national survey sample only received one set of communications for the survey via their local institution, but their responses were merged into the dataset containing the responses to the national survey as garnered from the MDR sample.
In July 2021, we conducted nine in-depth cognitive interviews to ensure that instrument for the 2021 cycle was understood clearly and consistently across respondents. Survey testers were from a variety of different fields, institution types, and roles.
The survey was distributed via email to a sample of 145,099 randomly selected faculty members with the parameters detailed above. Invitations were deployed on October 6th and four reminder messages were sent to those who had not yet completed the survey.
As in previous cycles of the survey, we partnered with selected scholarly societies who served as signatories for communications to faculty members in corresponding disciplines. These societies included:
- American Academy of Religion
- American Anthropological Association
- American Council on the Teaching of Foreign Languages
- American Educational Research Association
- American Historical Association
- American Mathematical Society
- American Musicological Society
- American Philosophical Association
- American Physical Society
- American Society for Engineering Education
- Archaeological Institute of America
- Association for Public Policy Analysis and Management
- Geological Society of America
- Modern Language Association
- National Association of African American Studies
- National Council of Teachers of English
- National Women’s Studies Association
- Society of Biblical Literature
For all other faculty members, invitation and reminder messages were sent from Ithaka S+R’s Catharine Bond Hill and Roger Schonfeld.
The survey closed on December 13, 2021. In total, we received 7,615 completed surveys for an overall response rate of 5.2 percent. Our analysis covers a number of key stratifications, including by discipline, institution type, job title/role, and age. Response rates at the disciplinary level varied when compared against the MDR population due in large part to the effectiveness of outreach and communications via our scholarly society partners; the average response rate for respondents in disciplines who received invitations and reminders from these partners was 8.3 percent (ranging from 3.2 percent to 15.9 percent), whereas the average under the Ithaka S+R signatory was 3.7 percent.
As in previous cycles, we continue to categorize respondents into disciplinary groupings of humanities, social sciences, sciences, and medical. In order to compare 2021 results to previous survey iterations, we categorized these demographic criteria in the same manner and report disciplinary findings at the level of these broad groupings. Additionally, to adjust for uneven response rates by field, we have weighted the aggregate results from our sample proportionally to match population parameters. This approach is consistent with methodological adjustment techniques employed for previous cycles of the survey and affects results only to a very marginal degree. Consistent with previous survey cycles, we have excluded area studies from disciplinary analyses in this report due to the large difference in response levels between area studies faculty members and faculty members affiliated with the four other broad disciplinary categories. However, these faculty members are included in the aggregate response figures.
In this report, we also highlight stratified responses from respondents from different institution types, job titles/roles, and age when clear and meaningful patterns present themselves. See Appendix: Participant Demographics for a breakdown of disciplinary affiliations among other participant demographics.
Question Types
In this report, questions are presented as they were presented in the questionnaire itself. Many of our questions fell into three categories of response types: those that asked respondents to rate something between 1 and 10, those that asked them to rate the degree to which they agree or disagree with something, or those that asked them how often they do something from among the choices of “never,” “rarely,” “occasionally,” and “often.”
A common type of question posed a strongly worded statement, such as “Because faculty have easy access to academic content online, the role librarians play at this institution is becoming much less important,” and asked scholars to rate from 1 to 10 how well each statement describes their point of view, where a 10 equals “extremely well” and a 1 equals “not at all well.” In our reporting here, we have aggregated responses to simplify the presentation of findings; responses of 8, 9, and 10 are grouped together for analysis and characterized as “strongly agreeing” with the statement; responses of 1, 2, and 3 are grouped together for analysis and characterized as “strongly disagreeing” with the statement; and responses of 4, 5, 6, and 7 are grouped together and characterized as relatively neutral responses.
Another type of question posed a statement to which a respondent was asked to rate their actual degree of agreement or disagreement on seven-point scale. In our reporting, we have combined levels of agreement and disagreement to further simplify findings: respondents who indicated either “strongly agree” or “agree” are grouped together; responses for “somewhat agree,” “neither agree nor disagree,” and “somewhat disagree” are grouped together; and responses of “disagree” and “strongly disagree” were grouped together.
We also often asked scholars other questions with 1-10 answer ranges, such as when we asked them to rate the importance of a given library role from “not at all important” to “extremely important.” Again, we segmented responses as strong negative responses (1-3), neutral responses (4-7), and strong positive responses (8-10). We sometimes asked similar questions on a 1-6 scale, where this is required to track findings over time, and in those cases we segmented responses as strongly negative (1-2), neutral (3-4), and strongly positive (5-6).
In addition, several questions asked scholars how often they do something, with answer options of “never,” “rarely,” “occasionally,” and “often.” We typically group the responses of “often” and “occasionally” together, in order to characterize things that are done with some degree of regularity.
Appendix: Participant Demographics
| Population demographic | Frequency | Percentage* |
| Carnegie Classification | ||
| Doctoral Universities | 4,367 | 60% |
| Master’s colleges and Universities | 1,915 | 26% |
| Baccalaureate colleges | 1,027 | 14% |
| Discipline** | ||
| Area Studies | 103 | 1% |
| Humanities | 2,206 | 29% |
| Social Sciences | 2,533 | 33% |
| Sciences | 2,464 | 32% |
| Medical | 309 | 4% |
| Age | ||
| 22 to 44 | 1,775 | 25% |
| 45 to 54 | 1,825 | 25% |
| 55 to 64 | 1,970 | 28% |
| 65 and older | 1,588 | 22% |
| Title/Role | ||
| Professor | 3,133 | 45% |
| Associate Professor | 1,874 | 27% |
| Assistant Professor | 957 | 14% |
| Adjunct Professor | 413 | 6% |
| Lecturer | 399 | 6% |
| Instructor | 165 | 2% |
| *Percentages may not add up to 100 percent due to rounding.
**Area studies includes African American studies, African studies, American studies, Asian studies, Indian studies, Latin American studies, Middle Eastern Studies, and Slavic studies (including Russia). Humanities includes art history, classical studies, foreign languages, history (including the history of science), law, literature, music, philosophy, religion, and theater and drama. Social sciences includes anthropology (includes archeology), business and finance, economics, education (includes higher education), geography, political science, psychology, public policy (including health policy), sociology, and women’s studies. Sciences includes agricultural studies, biology (includes botany, ecology, zoology), chemistry, engineering, geology, mathematics (includes statistics), physics, physical sciences/astronomy, and public health. |
||
Endnotes
-
Margin of error at 1 percent for an n – 7,615 at the 95 percent confidence level.
-
Datasets from Ithaka S+R’s series of surveys may be found at https://www.icpsr.umich.edu/web/ICPSR/series/226/studies.
-
Fewer than two percent of respondents selected “Ask a colleague” or “Ask a librarian” as their starting point in the 2012 through 2021 survey cycles, so these answer choices were removed from this figure.
-
Fewer than two percent of respondents selected “Ask a colleague” or “Ask a librarian” as their starting point in the 2012 through 2021 survey cycles so these answer choices were removed from this figure.
-
For more on the evolution of the scholarly conference, see Dylan Ruediger and Danielle Cooper, “COVID-19 and the Future of the Annual Meeting,” Ithaka S+R, 18 October 2021, https://doi.org/10.18665/sr.316000.
-
Tenure-line faculty include respondents who are professors, associate professors, and assistant professors. Contingent faculty include respondents who are adjunct professors, lecturers, and instructors.
-
Both “institutionally-licensed” and “personally-accessible file-hosting services” were added to the 2021 survey cycle. Prior survey cycles included the item “file-hosting services” in this question, which was considered the most valuable source of support for managing and preserving research data in 2018.
-
While we provided a definition of open educational resources to respondents, interpretations of open educational resources often vary; this was evident in our testing of this survey instrument.
-
Institutions were categorized based on their 2018 classification.