Ithaka S+R US Library Survey 2019
Preface
Every three years Ithaka S+R conducts our Library Survey to track the changing strategic directions and priorities of the deans and directors of academic libraries. The data are gathered during a relatively brief window of approximately four weeks. In the case of this most recent survey cycle, that moment in time was the fall of 2019, well before any of us had heard of COVID-19.
In early April 2020, as we publish these findings, the world of US higher education has changed dramatically. Hundreds of colleges and universities have suspended face-to-face instruction in a bid to slow the spread of the pandemic, and hundreds of academic libraries have closed their doors, in some cases providing expanded online services.[1] Beyond these immediate measures, it is impossible to avoid the grim longer term reality. As The Chronicle of Higher Ed reported, “On March 18, Moody’s Investors Service downgraded its outlook for the higher-education sector from ‘stable’ to ‘negative.’ In doing so it cited unprecedented enrollment uncertainty, risks to multiple revenue streams, and potential material erosion in their balance sheets.”[2] Much of Ithaka S+R’s work in recent weeks has focused on helping the community grapple with the impact of the COVID-19 pandemic.[3] All of this is to say that so much has changed for academic libraries and their leaders over the past two months—and so much more will now necessarily change as we look ahead to the future.
I nevertheless believe that there is substantial value to the findings of our survey from this fall. I recognize that to many readers, the findings may seem like a time capsule from a past that feels emotionally distant. But, the deep and representative findings in this report help us understand the strategies and aspirations that were being pursued immediately before the crisis hit. And, they can thereby serve as a guide to academic libraries—so many of which for the present are virtual organizations—as they determine which strategies to double down on, and which to abandon, when they resume campus operations. We will conduct a follow-up survey of library leaders later in 2020 on the impact of this global pandemic on current and future strategic directions.
I am incredibly proud of the team that has worked tirelessly on this project even as so much has changed in the world around us, and I also want to express our gratitude to all the deans and directors that responded to the survey this cycle.
Roger C. Schonfeld
Director, Libraries, Scholarly Communication, and Museums Program
Ithaka S+R
Executive Summary
The Ithaka S+R Library Survey 2019 examines strategy and leadership issues from the perspective of academic library deans and directors. This project aims to provide academic librarians and higher education leaders with information about chief librarians’ visions and the opportunities and challenges they face in leading their organizations.
In fall 2019, we invited library deans and directors at not-for-profit four-year academic institutions across the United States to complete the survey, and we received 662 responses for a response rate of 46 percent.
In this survey cycle, we added new coverage of three key topics: equity, diversity, and inclusion strategies, changes to collections strategies, and the library’s role in ensuring student success outcomes. The key findings below highlight many of the most notable results on these topics as well as longer-standing thematic areas of interest, both from the current cycle and over time.
Key Findings
- Library directors continue to perceive the value of their roles—and the roles of their libraries—as declining in the eyes of their supervisors and other higher education leaders. Continuing a trend found in the previous cycle, directors at all institution types feel less valued by, involved with, and aligned strategically with their supervisors and other senior academic leadership. Further, as library directors’ perceptions of the value of various functions of the library from the perspective of their supervisors have decreased, the perceived valuation gap between library directors and their supervisors has grown wider.
- Student success remains a top objective for library directors and they see the contributions of their library toward this success most strongly in relation to increasing student learning and enhancing student well-being. Contributions toward more traditional metrics of success—such as enrollment and graduation—have not been similarly identified.
- Priorities continue to shift from collections to services. Directors anticipate increased expenditures for services and staffing related to teaching and research support. Correspondingly, decreases in collections expenditures are anticipated over the next five years.
- A declining share of directors expect to increase financial support for technology, systems, and infrastructure. While in previous survey cycles, doctoral university directors expressed relatively more interest in adding support in this area, this has plateaued to levels more similar to other institution types.
- Spending on electronic books now roughly equals that for print books. For the first time, the percentage of library budget spent on e-books has risen to nearly the same level as print books. This reflects the general trend of increased spending on all forms of electronic resources and decreased spending on all types of print resources.
- Half of library directors will likely cancel a major journal package in the next five years. Fewer respondents compared to the previous cycle believe that the value of electronic resources is rising faster than cost, possibly contributing to the likelihood of cancellations. A relatively small share plan on pivoting to transformative agreements to bundle publishing and subscription costs.
- Roughly half of library directors are interested in contributing to institutional learning analytics tools. However, about half are also concerned about third-party vendors having access to individual-level data. Both interest and concern is highest amongst leaders at doctoral universities.
- Relatively few library directors agree that their library, as well as their broader institution, have well-developed strategies related to equity, diversity, inclusion, and access. While only one in three feel confident in these strategies, many are implementing relevant practices for recruiting and selecting candidates, including having separate minimum requirements and preferred qualifications in job descriptions.
Introduction
The Ithaka S+R Library Survey has examined the attitudes and behaviors of library deans and directors at not-for-profit four-year academic institutions across the United States on a triennial basis since 2010. The Library Survey is part of a larger program of survey research carried out by Ithaka S+R, which also includes the Ithaka S+R Faculty Survey and local surveys of faculty members and students. The full set of these surveys brings together the perspectives of different stakeholder communities in order to provide libraries and higher education leaders with comprehensive data-gathering and planning resources.
The Library Survey provides unique insights into the perspectives, priorities, and long-term plans of the leaders of academic libraries. By focusing on the chief executive of each academic library, this survey provides insight on high-level issues including strategy, leadership, budget, and staffing. These decision-makers play an important role in shaping the future of library services and collections at their colleges and universities.
In this report, we aim to provide academic librarians and higher education leaders with information about the important issues and trends that are shaping the purpose, role, and viability of the academic library. For the 2019 survey cycle, working with an advisory board, we added new coverage of topics related to equity, diversity, and inclusion strategies, changes to collections strategies, and the library’s role in ensuring student success.
Methodology
Population and Distribution
The list of US institutions that Ithaka S+R sampled from for the 2019 survey was generated from the Carnegie Classification of Institutions of Higher Education database in a manner consistent with previous cycles. The population included institutions with any of the following nine “Basic” classifications:
- Baccalaureate Colleges: Mixed Baccalaureate/Associate’s
- Baccalaureate Colleges: Diverse Fields
- Baccalaureate Colleges: Arts & Sciences Focus
- Master’s Colleges & Universities: Small Programs
- Master’s Colleges & Universities: Medium Programs
- Master’s Colleges & Universities: Larger Programs
- Doctoral/Professional Universities
- Doctoral Universities: High Research Activity
- Doctoral Universities: Very High Research Activity
This generated a list of 1,608 colleges and universities in the United States. Of these, 89 were excluded for a variety of reasons: they closed or lost accreditation, they did not operate their own library, there was no active library director, or the library director couldn’t be identified.
One individual from each institution was chosen as the contact person for the survey. Our final list of contacts included 1,481 library directors.[4] This list included 30 individuals who serve as the director of the library for multiple institutions. Of the 1,481 individuals we attempted to contact, 39 email invitations bounced or failed. This brought our total population of invited directors to 1,442.
Roger Schonfeld, director of Ithaka S+R’s Libraries, Scholarly Communication, and Museums Program, sent an email invitation to our population of library directors on October 22, 2019. The first of three reminder emails was sent to non-respondents by Ithaka S+R managing director Catherine Bond Hill, senior advisor Deanna Marcum, and manager of surveys and research Christine Wolff-Eisenberg on October 28. The second and third reminder emails were sent to remaining non-respondents by Trevor A. Dawes (a recent president of ACRL and member of our project advisory board), vice provost for libraries and museums and May Morris University Librarian at the University of Delaware, on November 6, and by Roger Schonfeld on November 18.
Participation
Of the 1,442 directors who received emails inviting them to participate in our survey, we received completed responses from 662, for an overall response rate of 46 percent. This response rate varied based on Carnegie Classification, as shown below:
| Number of Responses[5] | Number of Individuals Invited[6] | Response Rate | |
|---|---|---|---|
| Baccalaureate | 180 | 489 | 36.81% |
| Master’s | 257 | 574 | 44.77% |
| Doctoral | 208 | 374 | 55.61% |
Consistent with previous cycles, response rates have remained highest with doctoral universities. The data presented in this report have not been weighted or otherwise transformed in any way, so we ask the reader to bear in mind that response rates differed to some degree by institutional type.
The majority of respondents reported being White (88 percent), women (61 percent), and 55 and older (52 percent). Most have been library director at their current institution for five years or less (60 percent). The most common previous positions are director at another institution (24 percent) and associate university/college librarian (23 percent). More details on participant demographics can be found in Appendix A.
Questionnaire
The Ithaka S+R Library Survey 2016, as well as previous cycles in 2013 and 2010, served as a starting point for the 2019 cycle. A group of external advisors provided input on current trends impacting academic libraries in the United States—including equity, diversity, and inclusion strategies, changes to collections strategies, and the library’s role in ensuring student success—and corresponding questions were added to the instrument, while selected others were retired.[7] After receiving feedback from these advisors on a draft instrument, we tested the survey via cognitive interview with eight additional library directors.[8] During these conversations, we received further feedback on the clarity of the survey and relevance to directors at a variety of different institution types. We then made final revisions and prepared the survey for fieldwork. The final survey included randomization on the order of items within question sets as well as display logic on a few items such that they would only display to participants if they selected particular responses.
Data Analysis and Reporting
To identify the distribution of responses at a high level, we ran frequency or descriptive analyses (averages) on each response option for each survey question. We used averages for items in which respondents were asked to generate a percentage (e.g. the percentage of time spent on different activities) and frequencies for the remaining questions. Frequencies and averages were computed on both the aggregate data and subgroup data (e.g. grouped by Carnegie Classification). These analyses were used to create the figures shown in this report.
In figures based on frequencies, we display responses at the high end of the scales used. For items with 10-point scales, frequencies of the top three response options (8-10) are displayed. We considered these responses to indicate strong agreement. Similarly, for items with 4—7 point scales, we display frequencies of the top two response options.
Additional subgroup analyses were performed for groups with at least 30 respondents.[9] In cases where some groups reached this threshold while others did not, we created dummy variables for the groups with enough respondents. When possible, responses were recoded to align with these variables.[10] See Appendix B for a full list of groups used for analysis.
Using these groups, we ran independent samples t-test, paired samples t-tests, and one-way ANOVA with Tukey’s HSD tests when appropriate. These tests allowed us to make all possible comparisons between groups. Results of these analyses are reported throughout this report if they are statistically significant at the p <.05 level. We have also reported on the frequencies of responses over time in this report, noting where there are particularly large differences between the survey cycles.[11]
Datasets from the 2010, 2013, and 2016 cycles of the Library Survey have been deposited with ICPSR for long-term preservation and access.[12] We intend to deposit the 2019 dataset in a similar fashion. Please contact us directly at research@ithaka.org if we can provide any assistance in accessing and working with the underlying data.
Acknowledgements
We would like to acknowledge and thank our advisory board for this project. They helped us establish the questionnaire and provided feedback at key stages of the process. The members of our advisory board were:
- Jerome Conley, Miami University
- Trevor Dawes, University of Delaware
- Jennifer Fabbi, California State University at San Marcos
- Alexia Hudson-Ward, Oberlin College
- Brian Keith, University of Florida Libraries
- Sarah Pickle, The Claremont Colleges Libraries
- Brigitte Shull, Cambridge University Press
- Mackenzie Smith, UC Davis
- Enrique Yanez, New York University Libraries
We are grateful to our colleagues who contributed to our work on this project in a variety of ways, including Kimberly Lutz and Roger Schonfeld. In particular, this work would not be possible without the significant contributions of our colleague Nicole Betancourt who administered the survey.
Leadership and Management
One of the goals of the Library Survey 2019 is to provide insight into academic library directors’ perceptions of their roles within their broader institutions and how they manage their often limited resources. To this end, we are particularly interested in what has been most valuable, as well as most constraining, to library directors in executing strategy, how they are perceived within their institutions, how they allocate resources, and how they manage, recruit, and hire talent.
Director Role and Strategy
In this section, we explore how library directors spend their time, what their biggest constraints are, what skills and competencies they find valuable, and how they are perceived by other senior leadership.
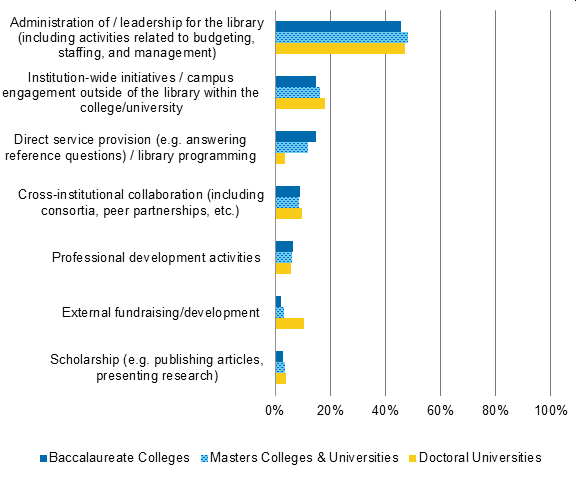
For the current survey cycle, we updated our question on how library directors spend their time, first asked in 2016, to more accurately reflect the day-to-day activities library directors undertake.[13] Despite these changes, however, there are few differences over time in the percentages of time spent on each activity. As in 2016, respondents who completed the 2019 survey spend approximately half of their time on administrative or leadership activities. The rest of their time is fairly evenly split across remaining activities, including institution-wide and cross-institutional initiatives, direct service provision, professional development, scholarship, and external fundraising.
There are, however, a few key differences based on institution type, with respondents from doctoral universities spending their time differently from those at other institutions. In particular, they spend a greater share of their time on external fundraising and institution-wide initiatives/campus engagement outside of the library.[14] In addition to these differences, directors from all institution types differ from each other on the percentage of their time spent on direct service provision, with baccalaureate college library directors spending the greatest share and those at doctoral universities spending the smallest share of time on this activity. Given relatively larger and more complex organizational structures at doctoral institutions, it is intuitive that directors at these institutions would more often have other staff (as opposed to themselves) oversee and engage in this direct service provision and programming. See Figure 1.
Figure 1. In your current role, what percentage of your time do you spend on the following activities? Average percentage of time spent on each activity in 2019 by Carnegie Classification.
For a few cycles now, we have asked respondents to reflect on their top constraints to making desired changes. While respondents have responded similarly over time, there are a few trends to note. A lack of financial resources continues to overwhelmingly be selected by the biggest share of respondents, but the proportion of respondents who chose this has slowly decreased with each cycle, driven in particular by those at master’s and doctoral institutions. Similarly, challenges in implementing new technologies has also been proportionally selected less over time by respondents at all institution types. The latter difference might indicate that, over time, library staff have become more comfortable with technology, have made fewer changes in technology systems, or have received greater support from their institutional IT services or another support provider. See Figure 2.
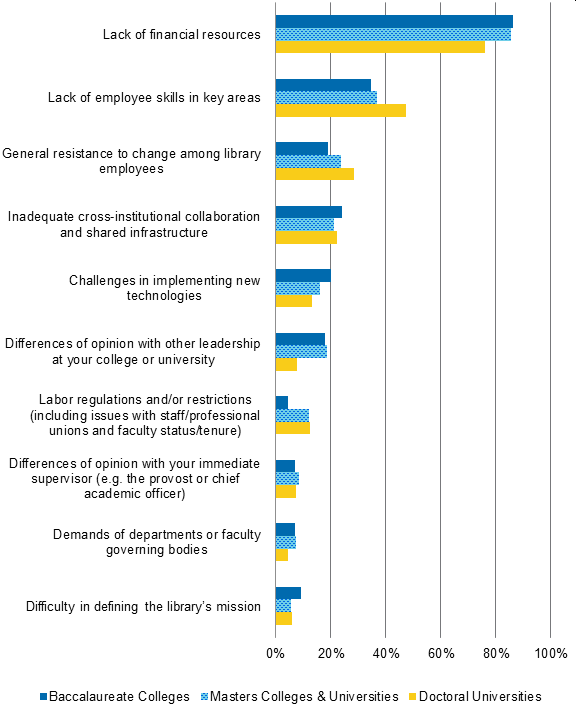
In the 2019 survey, many of these constraints were selected at different levels across institution types. A smaller proportion of doctoral university respondents struggle with a lack of financial resources and differences of opinion with their direct supervisor, but a higher share are constrained by a lack of employee skills in key areas.[15] Labor regulations and restrictions was selected less by respondents at baccalaureate colleges compared to those at the other institution types. See Figure 3.
Figure 2. What are the primary constraints on your ability to make desired changes in your library? Please select up to three items that have the greatest impact at your institution, or leave the question blank if none of these items apply. Percentage of respondents that selected each item, by survey cycle.[16]
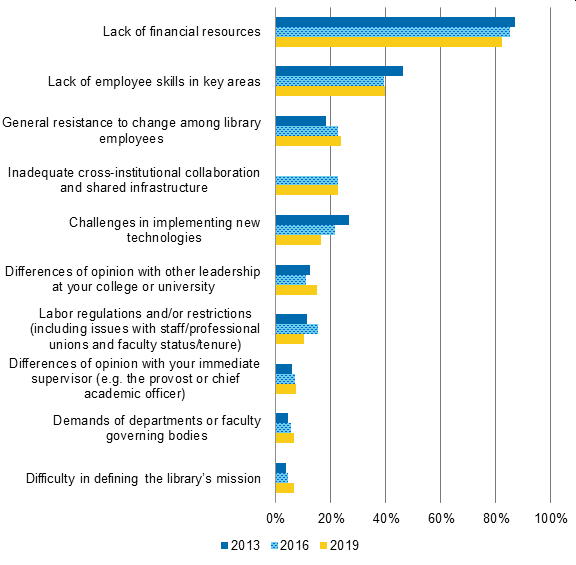
Figure 3. What are the primary constraints on your ability to make desired changes in your library? Please select up to three items that have the greatest impact at your institution, or leave the question blank if none of these items apply. Percentage of respondents that selected each item in 2019 by Carnegie Classification.
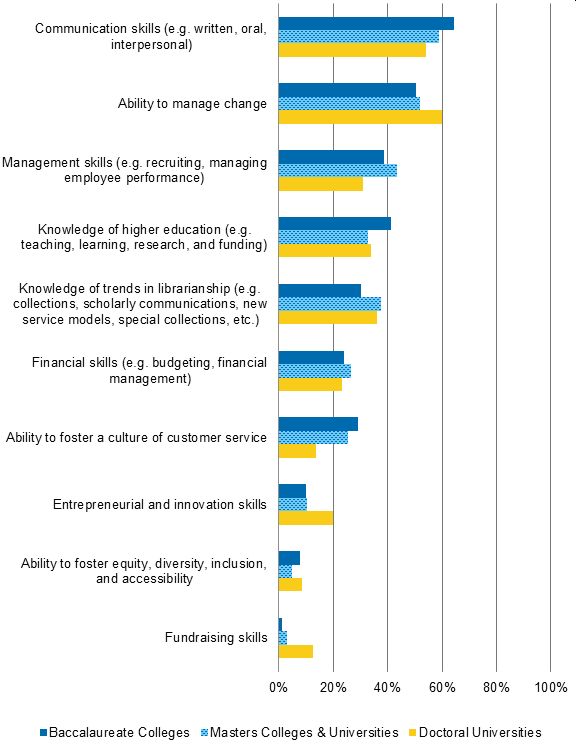
In this cycle, we added a new question addressing respondents’ perceptions of the most valuable knowledge, skills, abilities, and competencies in their current position. This question allows us to provide insight into the strengths library leaders develop in the profession. It also affords the opportunity to compare and contrast against similar requirements listed in library director job descriptions.
Of the 10 items in the list, communication skills and an ability to manage change are endorsed by the largest share of directors as most important; approximately half of respondents chose each. On the other hand, the ability to foster equity, diversity, inclusion, and accessibility, as well as fundraising skills, are the least selected with less than 10 percent of respondents choosing each.
While most respondents answered similarly across institution type, there are a few skills endorsed more or less by directors at different types of institutions, particularly by doctoral university respondents. A greater share of doctoral university respondents considers entrepreneurial skills and fundraising skills to be valuable, and a smaller share selected management skills and the ability to foster a culture of customer service.[17] See Figure 4. These differences, along with those from the previous question, represent the extent to which doctoral university library directors are less focused on activities that involve directly interacting with users and staff than are other directors; they instead focus greater effort on fundraising and developing new ways to deploy resources.
Since skills can be developed over time, we also examined the relations between respondents’ age, number of years in their current position, and which skills were selected. However, there are no major patterns in which skills were selected across groups. Thus, respondents broadly value the same skills regardless of age or years in position.
Figure 4. Which of the following knowledge, skills, abilities, and competencies have been most valuable for you in your current position? Please select up to three items or leave the question blank if none of these items apply. Percentage of respondents that selected each item in 2019 by Carnegie Classification.
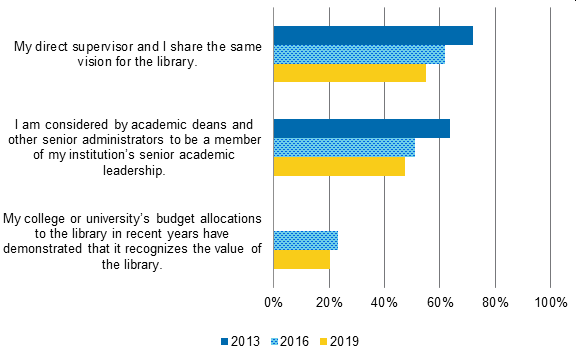
An area of long-standing focus in the survey has been on director relationships and alignment with their institution’s senior leadership, as well as perceptions of the value of the library. In each of the items related to these topics, responses have trended toward less positive perceptions across all institution types. In particular, a declining share of respondents strongly agree that they and their direct supervisor share the same vision, that they are considered to be part of their institution’s senior academic leadership, and that their institution’s budget allocations demonstrate that the library’s values are recognized. See Figure 5.
There are two group differences in agreement. Directors at doctoral universities more strongly agree that they are considered to be part of their institution’s senior academic leadership compared to respondents at both other institution types. Black respondents also more strongly agree with this item on inclusion in senior leadership in comparison with non-Black respondents.
Figure 5. Please use the 10 to 1 scales to indicate how well each statement below describes your point of view. Percentage of respondents that strongly agree with each statement, by survey cycle.
Budget and Staff
Another key aspect of leadership and management examined is budgeting and staffing. Coverage of these topics includes three forecasting questions on how academic library directors expect or would like to allocate their financial resources. In particular, we ask how respondents would allocate a 10 percent increase in their budget, how they expect to spend their resources in the next five years, and whether they expect to change staffing positions in a variety of areas.
Since the first survey cycle in 2010, respondents have shared the top three areas to which they would allocate funds if they received a 10 percent increase in their library’s budget. Given that a lack of financial resources is the biggest reported barrier to enacting change, these areas represent the greatest priorities directors would like to address if this barrier was somewhat relieved. In other words, this question is more about defining areas of priority as compared to actual decision-making. The top four areas identified—new employees or redefined positions, online or digital journals and databases,[18] facilities expansions and renovations, and employee salary increases—have remained fairly consistent over time. See Figure 6.
There continues to be a trend of a smaller proportion of respondents selecting technology, systems, and infrastructure across Carnegie Classification, with the biggest decreases coming from doctoral universities (36 percent in 2013 to 22 percent in 2019). In the 2019 survey, a similar proportion of directors at all institution types selected technology, systems, and infrastructure (19-22 percent) whereas previously directors at baccalaureate and master’s institutions have chosen this less than respondents at doctoral universities. Thus, doctoral university directors in particular have substantially decreased their desire to add support in this area.
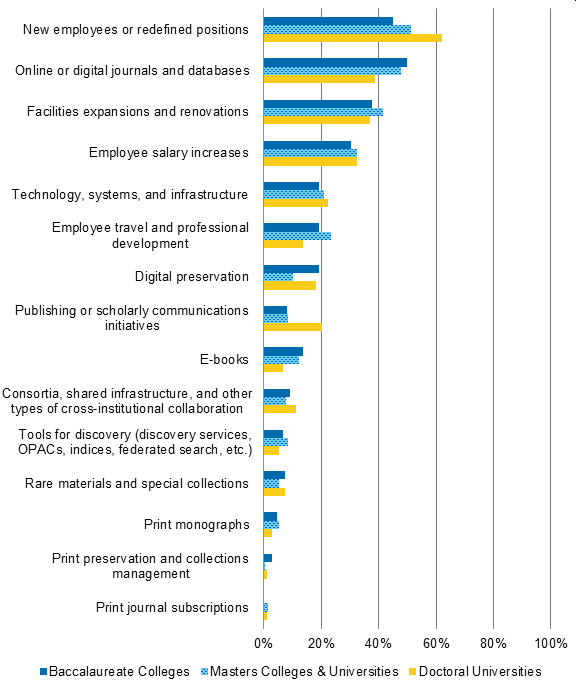
Each institution type is associated with a greater percentage of respondents selecting particular options. Respondents at doctoral universities are more likely to desire new employees or redefined positions as well as publishing or scholarly communications initiatives. Master’s institution respondents would be more likely to pick employee travel and professional development, and respondents at baccalaureate colleges selected digital preservation at higher rates than respondents at other institution types. See Figure 7.
Figure 6. If you received a 10 percent increase in your library’s budget next year in addition to the funds you already expect to receive, in which of the following areas would you allocate the money? Please check up to three areas that you would invest in.[19] Percentage of respondents that selected each item, by survey cycle.
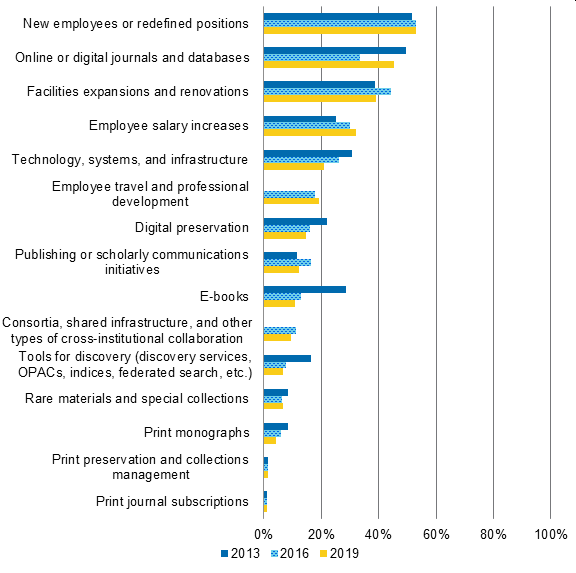
Figure 7. If you received a 10 percent increase in your library’s budget next year in addition to the funds you already expect to receive, in which of the following areas would you allocate the money? Please check up to three areas that you would invest in. Percentage of respondents that selected each item in 2019 by Carnegie Classification.
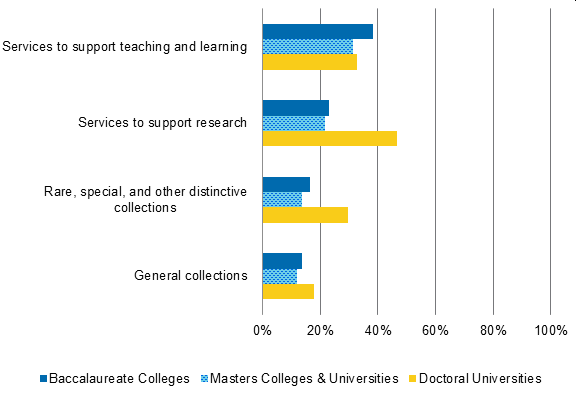
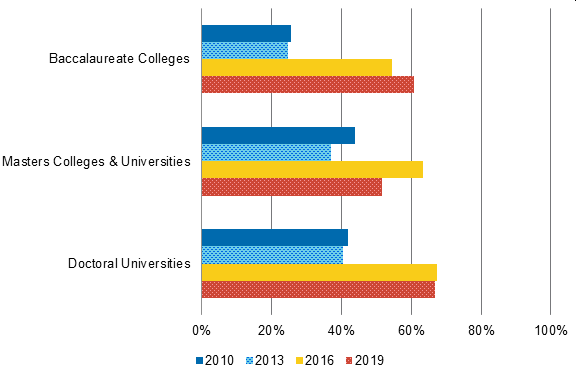
Next, we asked respondents to indicate whether they plan to increase, decrease, or keep resource expenditures the same for several broad areas over the next five years. Overall, half or more of respondents (50-60 percent) expect the share of their expenditures toward services and collections to remain the same, indicating the extent to which budgets are not expected to dramatically increase or decrease. The areas with the most expected increases are those associated with services, while the areas with the most expected decreases are associated with collections. In particular, approximately one-third of respondents, consistent across institution type, expect to decrease expenditures on general collections. See Figure 8.
For each of the Carnegie Classification groups, respondents expect to increase expenditure on one of the two services most. For baccalaureate and master’s institution directors, services to support teaching and learning are most expected to increase, while respondents from doctoral universities most expect to increase expenditure on services to support research. The latter is the only case in which a greater share of respondents expect to increase expenditure rather than keep it the same. See Figure 9.
Figure 8. In the next five years, do you anticipate the share of overall resource expenditure (including direct expenditures and staffing) to increase, remain the same, or decrease for each of the following? Percentage of respondents that selected “decrease” in 2019 by Carnegie Classification.
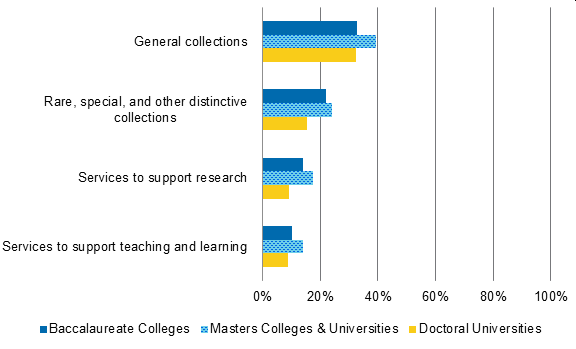
Figure 9. In the next five years, do you anticipate the share of overall resource expenditure (including direct expenditures and staffing) to increase, remain the same, or decrease for each of the following? Percentage of respondents that selected “increase” in 2019 by Carnegie Classification.
Similarly, respondents predicted whether they would add, reduce, or make no changes in the number of employee positions in a range of areas.
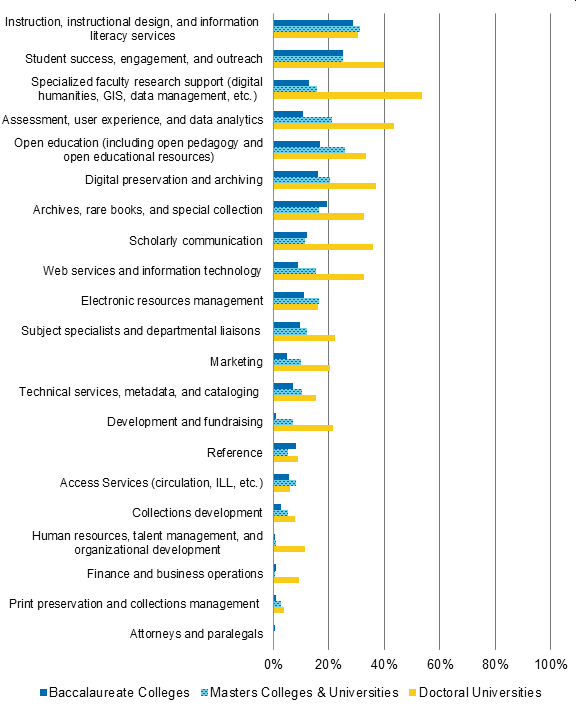
For each position type, the majority of respondents (66-93 percent) expects to make no changes, again perhaps reflecting the extent to which budgets are expected to remain relatively stable. The top areas in which respondents expect to add employee positions are instruction and information literacy, student success, and specialized faculty research support, with approximately one-quarter expecting to add employees in each area. On the other hand, the employee positions that respondents most expect to reduce are technical services, metadata and cataloging, reference, and print preservation and collections management. In each of these cases, less than one-quarter predict reducing positions. For most positions, directors at doctoral universities predict adding employee positions more than others. See Figure 10.
Although most respondents expect to keep expenditure and staffing positions the same across the board, we examined the relationship between expenditure and staffing for those who do plan to make changes. As mentioned above, the most substantial increases in expenditure are expected for services to support teaching and learning. Of the directors who plan to add this capacity, they also want to add employee positions in the following three areas related to teaching and learning: instruction, instructional design, and information literacy services; student success, engagement, and outreach; and open education. For services to support research, those who plan to add expenditure also seek more employee positions in reference, subject specialist and department liaison positions, and specialized faculty research support. On the other hand, many directors expect correspondingly to decrease expenditure allocated toward both general and special collections, with the biggest decreases expected for general collections. Those who plan to decrease this expenditure also plan to decrease employee positions in collections development, print preservation and collections management, and electronic resources management. Finally, directors who expect to decrease expenditure in rare, special, and other distinctive collections also plan to decrease employee positions in archives, rare books, and special collections, and digital preservation and archiving. These relationships demonstrate an alignment between anticipated expenditure and corresponding staffing.
Figure 10. To the best of your knowledge, will your library add or reduce employee positions in any of the following areas over the next five years? For each area, please indicate whether you anticipate adding employee positions, making no change, or reducing employee positions. Percentage of respondents that indicated they expect to add employee positions in 2019 by Carnegie Classification.
Talent Management
In the previous survey cycle, we asked for the first time a series of questions related to how library directors attract, retain, and reward their employees. In this cycle, we expand on that coverage to include new questions on the involvement of various parties in talent management processes, perceptions of the effectiveness of strategies related to equity, diversity, inclusion, and access, and corresponding practices employed to recruit and select employees.
Equity, Diversity, Inclusion, and Accessibility
Directors had the opportunity to share their level of agreement with statements about equity, diversity, inclusion, and accessibility strategies at their library specifically and at their institution as a whole. These issues have increasingly gained attention in the library field, with conferences devoted to them, such as IDEAL ’19,[20] largely due to the work by librarians and students of color who have shared their experiences within a White-dominated profession.[21]
Additionally, in our previous work on equity, diversity, and inclusion with ARL institutions, we found a disconnect between perceptions in these areas and actual diversity of staff. In particular, those at more racially homogenous libraries than the average not only saw themselves as more equitable and inclusive than the overall library community, they did so by a larger margin than those at more diverse institutions.[22] In the current survey, we were especially interested in library directors’ perceptions of strategies aimed at improving these facets of their organizations.
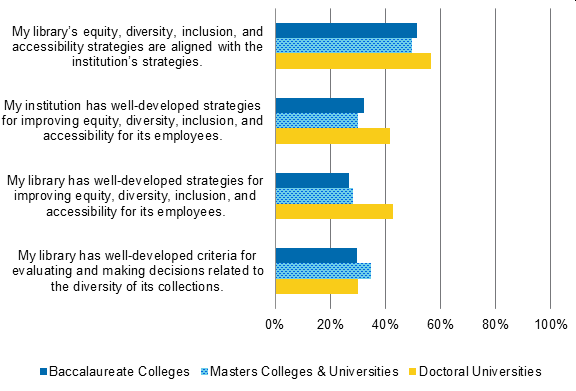
Approximately half of respondents strongly agree that their library’s strategies in these areas are aligned with their institution’s strategies. However, only about one-third believe their institution and their library have well-developed equity, diversity, inclusion, and accessibility strategies for their employees. Likewise, a similar share sees their library as having well-developed criteria for evaluating the diversity of its collections.
Most of the respondents who did not strongly agree with these questions responded closer to the mid-point of the scales, suggesting that they feel somewhat ambivalent about the strength of their library’s and institution’s strategies. These ratings do not differ based on respondents’ racial-ethnic or gender identities.[23]
However, there are differences based on institution type, with respondents at doctoral universities agreeing more strongly with many of the statements. In particular, they more strongly agree that their library and institution have well developed strategies for its employees and that their library’s and institution’s strategies align.[24] This is the only instance in which a majority of respondents strongly agree. See Figure 11.
Figure 11. Please use the 10 to 1 scales to indicate your level of agreement with each statement. Percentages of respondents that strongly agree in 2019 by Carnegie Classification.
Recruitment, Selection, and Hiring
In addition to perceptions about equity, diversity, inclusion, and accessibility strategies, we were interested in a range of practices that library directors might take to enact such strategies. Our focus on recruitment, selection, and hiring practices is intended to produce an inventory of whether and to what extent library directors are addressing one of the major barriers to equity, diversity, inclusion, and accessibility.
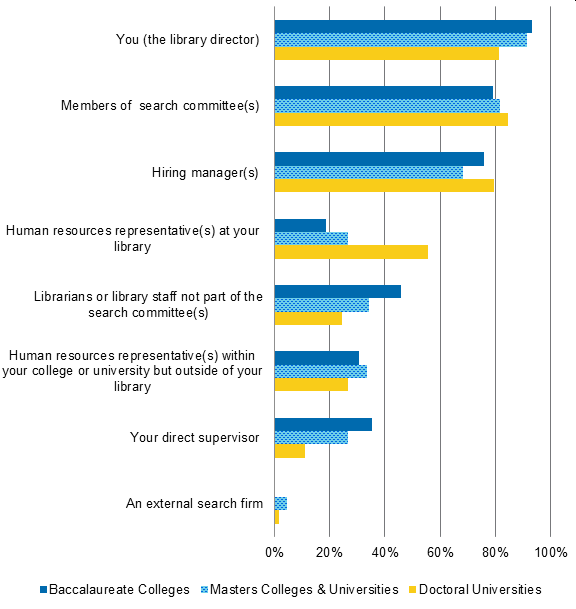
We started with a set of items on the general extent to which different individuals are involved in recruitment, selection, and hiring at the library. Directors report that the most commonly involved are themselves, along with members of search committees and hiring managers; three-quarters or more indicate that each of these groups are highly involved. On the other hand, only about one-quarter report that their direct supervisor—that is, the supervisor of the library director—and human resources representatives in their institution but outside of their library are highly involved. While external search firms are often engaged in processes for recruiting candidates for library director positions, especially at large research universities, almost no directors utilize an external search firm during the hiring processes they oversee.
Findings reflect the vastly different organizational realities at larger and smaller institutions. Respondents at doctoral universities are more likely to involve human resources representatives at their library—perhaps due to the presence of dedicated internal human resources representatives at institutions with larger staff sizes—and are themselves less involved in these practices compared to other directors. Thus, it is likely that directors themselves are more actively involved in these processes for staff at all levels at smaller institutions, while those at larger institutions may only be involved in searches for positions that report directly to them. Librarians and library staff as well as directors’ direct supervisors (e.g. provosts) are more involved at baccalaureate colleges, while direct supervisors of library directors are also more involved at master’s institutions compared to doctoral universities. See Figure 12.
Figure 12: Generally speaking, to what extent are each of the following individuals involved in determining the recruitment, selection, and hiring processes employed at your library? Percentage of respondents that selected “a lot” or “a great deal” in 2019 by Carnegie Classification.
While most directors themselves are highly involved in recruitment and hiring processes, White respondents report being more highly involved than non-White directors; 90 percent of White directors are highly involved compared to 80 percent 0f non-White directors. Slightly more than half of non-White respondents, on the other hand, involve human resource representatives at their library when hiring compared to 40 percent of White directors. Institutional type does not account for these differences given that there are no racial-ethnic differences in the institution type with which directors are associated. Rather, these differences reflect the relatively greater value that non-White directors place on including multiple perspectives during the hiring process.
Another set of practices that could influence equity, diversity, inclusion, and accessibility at academic libraries relates to how directors and other parties involved in recruitment, selection, and hiring go about advertising job postings.[25] Where job advertisements are posted directly impacts who is likely to see and subsequently apply to those positions. For the following questions, items were not displayed to library directors who reported not being involved in these processes, given their limited exposure to or knowledge of the practices under examination.
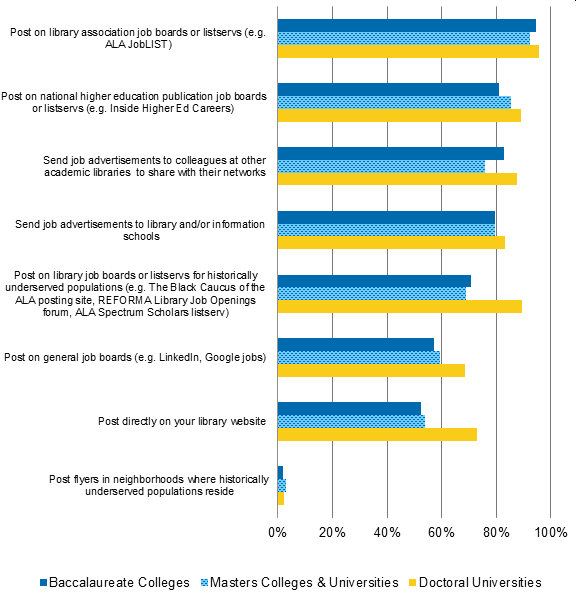
The most common places respondents share advertisements are on library job boards or listservs, higher education publication job boards or listservs, with colleagues at other academic libraries, and with library and/or information schools, with 80 percent or more of respondents indicating they do each occasionally or often. While it is relatively less common for directors or other involved parties to post advertisements in places targeting historically underserved populations, the majority—approximately three-quarters—do occasionally or often post on library job boards or listservs for historically underserved groups. By far, the least common practice is to post flyers in neighborhoods where historically underserved populations reside; nearly no directors report engaging in this practice.
Many of these practices differ across type of institutions. In general, respondents at doctoral universities carry out five of the practices more frequently than other respondents; differences with other groups range from 11-23 percentage points. The biggest differences are for posting on library job boards or listservs for historically underserved populations and posting directly on their library website (18-23 percent percentage points more each). See Figure 13.
Figure 13. Generally speaking, how often do you, a hiring manager, a human resources representative, and/or members of a search committee do each of the following when advertising job postings for library positions? Percentages of respondents that selected “occasionally” or “often” in 2019 by Carnegie Classification.
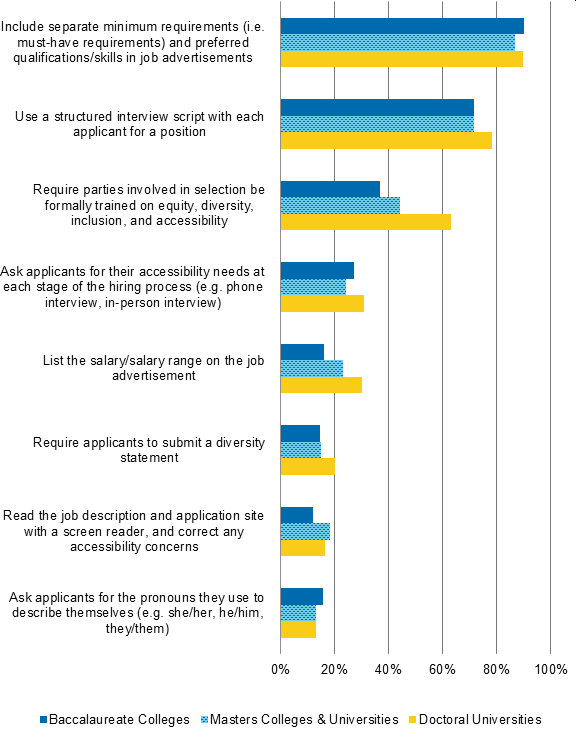
To supplement the previous sets of questions, we also added a new series of items about hiring practices that spanned from how job advertisements are written to whether parties involved in selection are trained in equity, diversity, and inclusion.[26] These items give us a fuller picture of the hiring process.
Nearly all directors indicated that they or someone involved in the hiring process include separate minimum requirements and preferred qualifications in advertisements and use a structured interview script at least occasionally, while the remaining practices under examination are much less common. About one-quarter ask applicants for their pronouns, read the job description and application site with a screen reader, and require applicants to submit a diversity statement. While asking for pronouns is a relatively uncommon practice, women and Black directors report they or someone involved in hiring do so more frequently than men and non-Black directors respectively.
A number of these practices —including requiring training in equity, diversity, inclusion, and accessibility as well as listing salaries or salary ranges on job postings—are relatively more likely to take place at doctoral universities compared to other types of institutions (17-20 percentage points difference). See Figure 14.
We were particularly interested in the specific practice of listing salaries or salary ranges on job advertisements in the context of public vs private institutions. Given that many public colleges and universities share employee salaries online for anyone to see, we expected that it would be a more common practice. Indeed, more than twice the share of respondents at public institutions indicate they or someone involved in hiring occasionally or often list the salary or salary range on job advertisements compared to respondents at private institutions. However, even at public institutions, it was not the most common practice. Only about half of respondents or their hiring managers at public institutions list the salary or salary range on advertisements.[27]
Figure 14: Generally speaking, how often do you, a hiring manager, a human resources manager, and/or members of the search committee do the following when recruiting and hiring library employees? Percentages of respondents that selected “occasionally” or “often” in 2019 by Carnegie Classification.
Roles and Services of the Library
In the current survey cycle, we continue to ask questions about the overall functions of the library while adding a selection of questions covering the library’s role in student success objectives specifically. These questions allow us to gain an understanding of perceptions of the library within the context of higher education institutions broadly. Since many of these questions have also been included in the US Faculty Survey 2018, we can also make comparisons across to the two survey groups, yielding insight into how the perspectives of library directors differ from those held by one of their most important campus communities.
Overall Library Roles
Since 2010, we have asked respondents to share their views on the importance of high-level library functions and services. These functions have historically focused on undergraduate skill development, faculty research and teaching needs, and collection provision. This cycle, we added an item about supporting graduate students to round out our coverage of groups on campus.
Generally speaking, there have been few differences in importance ratings over time. Only one service has continuously decreased in importance: the library serving as a starting point or “gateway” to faculty research (almost 10 percentage points decrease from 2010 to 2019).
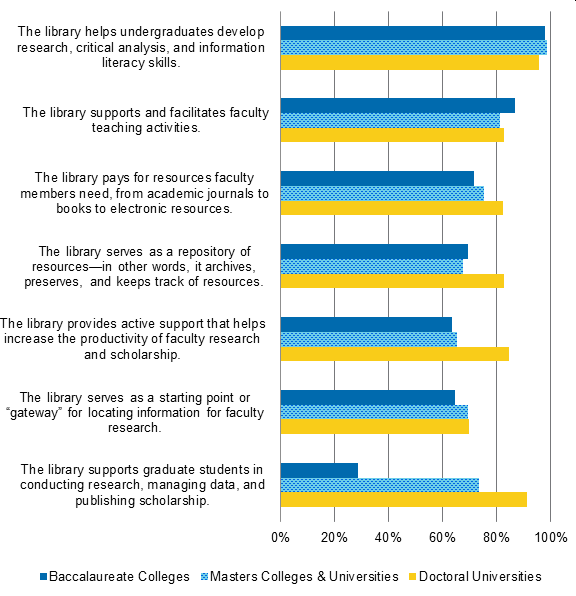
Respondents at doctoral universities consider the library’s functions and services related to research support and preservation as more important than do other respondents. Indeed, for doctoral university directors, supporting graduate student research is the second most important capacity after helping undergraduates develop skills. See Figure 15.
Figure 15. How important to you is it that your college or university library provides each of the functions below or serves in the capacity listed below? Percentage of respondents that selected “highly important” in 2019 by Carnegie Classification.
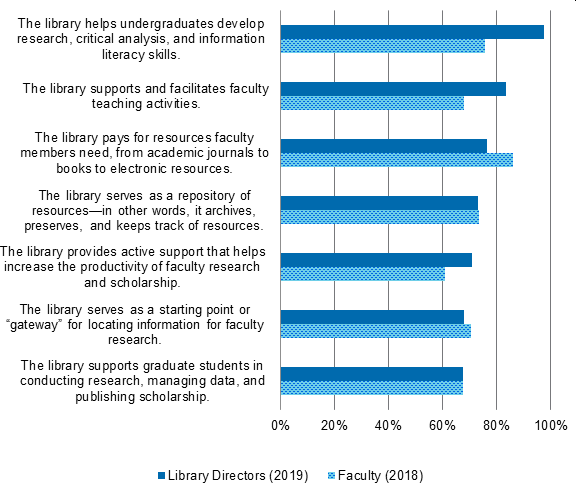
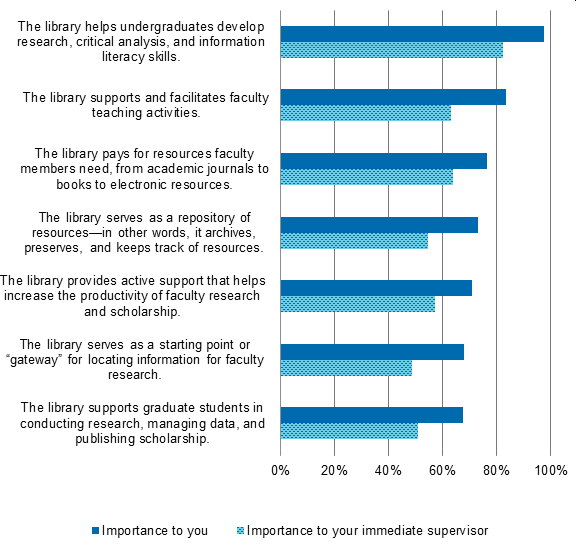
The same set of items was included in our most recent faculty survey, and library directors rated many of the functions and services differently than did faculty. In particular, library directors continue to consider it more highly important that the library helps undergraduates develop skills, supports faculty teaching activities, and provides support to help increase faculty research productivity. On the other hand, faculty believe it is more important that the library pays for needed resources compared to library directors. Overall, library directors perceive the library as more broadly important than do faculty. See Figure 16.
Figure 16. How important to you is it that your college or university library provides each of the functions below or serves in the capacity listed below? Percentage of respondents that selected “highly important,” by survey sample.
We also ask respondents to indicate how important the same functions are to their immediate supervisor. As with the previous question, the main trend in declining importance ratings over time is for the library serving as a starting point or “gateway” for faculty research. There was also a spike in perceived direct supervisor importance ratings for the library supporting and facilitating faculty teaching activities in the 2016 cycle, but this rating has come back down to similar levels to 2013 this cycle. Perhaps the most important takeaway from the results over time is the extent to which perceived importance in the eyes of one’s supervisor has decreased across the board since three years prior. See Figure 17.
Focusing on the current cycle, we compared the importance ratings that directors made for themselves with their perceptions of their direct supervisors’ importance ratings. Consistent with previous cycles, library directors perceive every library function and service as more important to them than it is to their immediate supervisors. See Figure 18. This remains true for directors at all institution types.[28] The smallest gap in importance—that is, where library directors perceive alignment in valuation across themselves and their supervisors—is for the library paying for needed resources and providing faculty research support, while the largest gaps tend to relate to teaching support, graduate research support, and faculty information discovery.
There are a few overall differences in perceived importance ratings for directors at different institution types. Directors at doctoral universities generally believe that their immediate supervisor considers the functions and services to be more highly important than do directors at other institutions. However, baccalaureate college respondents think helping undergraduates develop skills as well as supporting and facilitating faculty teaching activities are more important to their immediate supervisors compared to directors at doctoral universities. These activities are more associated with teaching than research, which naturally aligns more with the functions of baccalaureate colleges than doctoral universities.
Figure 17. How important do you believe it is to your immediate supervisor that your college or university library provides each of the functions below or serves in the capacity listed below? Percentage of respondents that selected “highly important” in 2019 by Carnegie Classification.
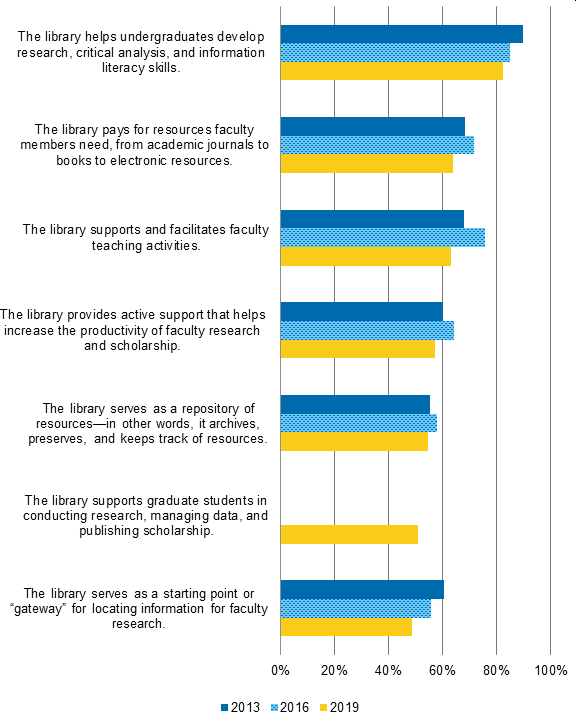
Figure 18. How important do you believe it is to you/your immediate supervisor that your college or university library provides each of the functions below or serves in the capacity listed below? Percentage of respondents that selected “highly important”.
In order to ensure that these important functions and services are provided by the library, directors may utilize a variety of strategies. To that end, we asked respondents to indicate their agreement with a series of statements on the strategies employed.[29]
Approximately six in ten respondents see the selection of particular library technology systems as tied to strategic priorities. Roughly half of library directors feel confident in the clarity of their collections strategy and their vision for space on campus. Relatively fewer directors feel that they have clearly defined strategies related to changing user needs and research habits. See Figure 19.
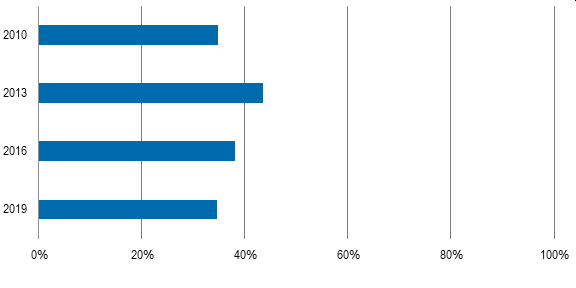
While there was an increase early on from 2010 to 2013 in strength of agreement that the library has a well-developed strategy to meet changing user needs and research habits,[30] since 2013, this agreement has continuously decreased. In the current cycle, the proportion of directors who strongly agree has fallen back to 2010 levels, largely driven by decreases in the percentage of doctoral university respondents who strongly agree with this statement (54 percent in 2016 to 40 percent in 2019). See Figure 20. Otherwise, respondents’ agreement ratings are similar to those given in 2016. Library directors across institution types have similar levels of confidence in the various strategies outlined below.
Figure 19. Please use the 10 to 1 scales to indicate your level of agreement with each statement. Percentage of respondents that strongly agree with each statement.
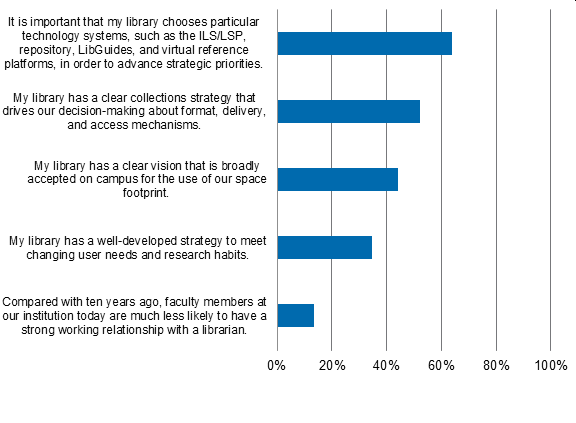
Figure 20. My library has a well-developed strategy to meet changing user needs and research habits. Percentage of respondents that strongly agree, by survey cycle.
Information Discovery
The library as a means to information discovery is one of many specific capacities we have tracked over time, though our emphasis on this topic in the survey has decreased over time.
Approximately two-thirds of respondents strongly agree that it is strategically important that their library be seen as the first place to discover scholarly content and about half strongly agree that the library is always the best place for researchers to start their search for scholarly information. Further, approximately three-quarters highly prioritize providing an index-based discovery service to facilitate access to information resources. These demonstrate a general desire for the library to be valued for discovery and access on campus, though there was a notable decrease in the percentage of respondents that indicated this perspective between 2013 and 2016. Additionally, few directors are concerned with guiding users to a preferred source when identical sources are available; only one-third strongly agree that it is important to do so.
Research and Data Management Support
For nearly a decade, we have included coverage of how directors prioritize support for research and data management and preservation in their library. To broadly examine how library directors prioritize specific functions of their libraries, we provided them with a non-exhaustive list of 26 library supports and asked them to indicate how much of a priority these functions are within their library; see Appendix C for the full breakdown of items. We explore responses to this question throughout the report and here focus on those related to research and scholarly communications supports.
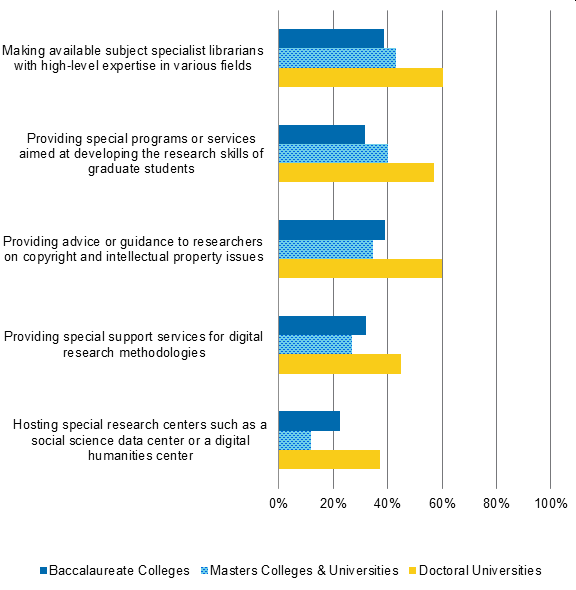
Overall, there were increases from 2013 to 2016 in the proportion of respondents who highly prioritized almost all of these functions, but this trend has reversed with several decreases since 2016. Further, there are two functions with particularly large decreases this cycle: providing special programs or services aimed at developing the research skills of graduate students and providing advice or guidance on copyright and intellectual property issues. Agreement with this latter item has continually decreased since the 2013 cycle. Generally speaking, these decreases are consistent across different institution types. However, for baccalaureate directors, there has been a continuing increase in the proportion of respondents who strongly agree that hosting special research centers is a high or very high priority. Further, those who do prioritize research support are more likely to increase expenditures for research services and staffing in research support roles. See Figure 21.
Further, respondents at doctoral universities consider each function as a higher priority than other respondents.[31] Intuitively, these differences reflect the greater priority doctoral institutions place on research support. See Figure 22.
Figure 21. How much of a priority is each of the following functions in your library? Percentage of respondents that selected “high priority” or “very high priority,” by survey cycle.[32]
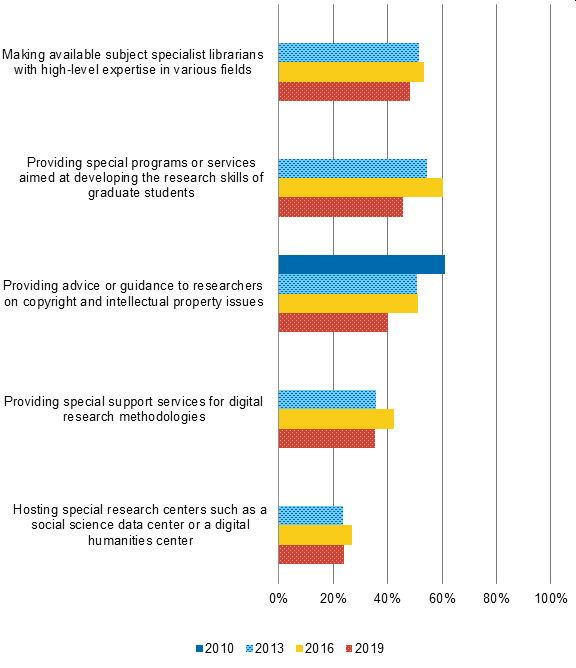
Figure 22. How much of a priority is each of the following functions in your library? Percentage of respondents that selected “high priority” or “very high priority” in 2019 by Carnegie Classification.
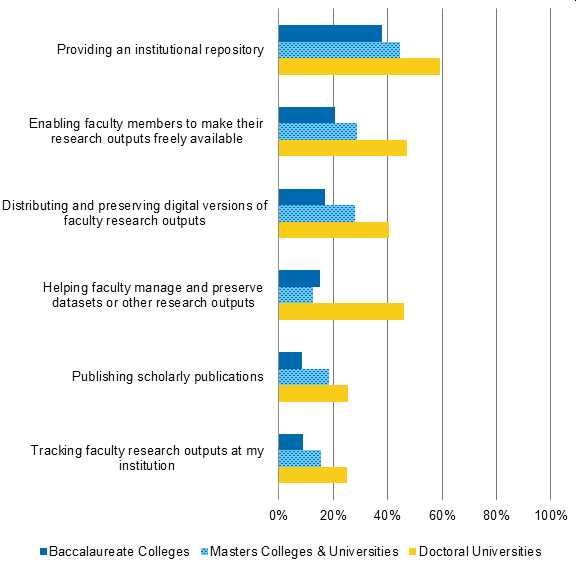
Within the same set of questions, we asked directors to also rate their prioritization of specific data management and preservation functions and services in their library. Over time, a smaller percentage of respondents have considered many of the functions and services dealing with preserving research outputs in the library as a priority. Specifically, a declining share prioritize providing an institutional repository, enabling faculty members to make their research outputs freely available, distributing and preserving digital versions of faculty research outputs, and tracking faculty research outputs. These decreases were largest for respondents at doctoral universities. Further, although there is an overall trend of decreasing prioritization, respondents at baccalaureate colleges actually increased their priority ratings of enabling faculty members to make their research outputs freely available. See Figure 23.
Again, doctoral university respondents more highly prioritize each of these functions and services.[33] Since these items also relate to research production, these differences continue to reinforce the greater prioritization of research outputs at doctoral universities compared to other institution types. See Figure 24.
Figure 23. How much of a priority is each of the following functions in your library? Percentage of respondents that selected “high priority” or “very high priority,” by survey cycle.[34]
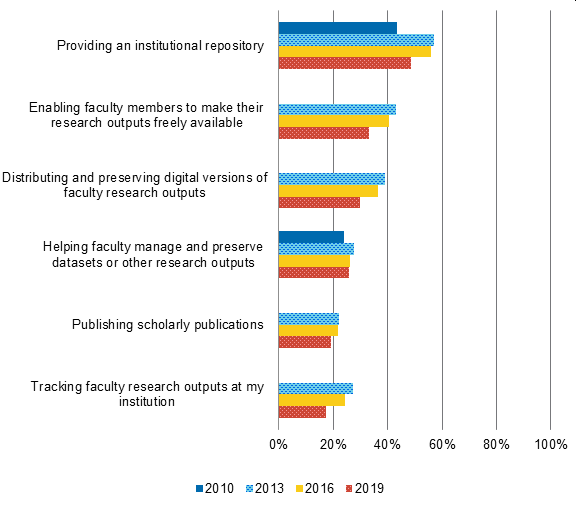
Figure 24. How much of a priority is each of the following functions in your library? Percentage of respondents that selected “high priority” or “very high priority” in 2019 by Carnegie Classification.
Support for Student Success
In the 2016 cycle, we asked for the first time how library directors prioritize student success. This cycle, we increased coverage of this topic by adding additional questions on the importance of various contributors—including the library—to student success. These questions also allow us to make comparisons with our most recent faculty respondents to determine how similarly or differently library directors and faculty conceptualize and make efforts to improve student success.
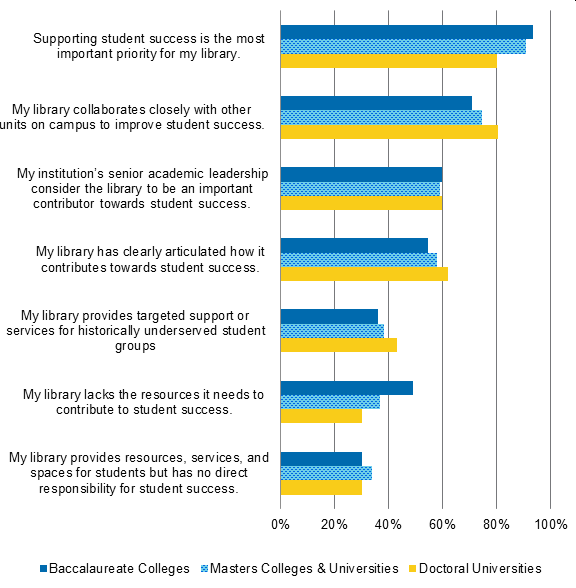
Consistent with findings from the previous survey cycle, the overwhelming majority of library directors view student success as the top priority of their library and collaborate with other units on campus to improve these outcomes. However, a smaller majority—roughly six in ten—feel that their library has clearly articulated its contributions toward these outcomes. Over time, an increasing share of respondents have strongly agreed that their library lacks the resources it needs to contribute to student success, with nearly 10 percent more indicating this statement well described their point of view compared to in the 2016 cycle. This is especially true for baccalaureate college respondents; nearly double the percentage of baccalaureate college directors strongly agree this cycle compared to last (29 percent in 2016 compared to 49 percent in 2019).
Further, in the current cycle, respondents at doctoral universities differ from other directors in their ratings of these statements. They more strongly agree that their library provides targeted support or services for historically underserved student groups, but less strongly agree that supporting student success is the most important priority for their library and that their library lacks the resources it needs to contribute to student success. Despite these differences, the vast majority still do consider supporting student success to be the most important priority (80 percent strongly agree compared to about 90 percent of master’s and baccalaureate respondents). These responses continue the trends of doctoral university directors reporting that their library better handles equity, diversity, and inclusion and that they have less resource constraints than other library directors. They also may prioritize student success less than others because they focus more on other groups such as faculty. See Figure 25.
Figure 25. Please use the 10 to 1 scales to indicate how well each statement below describes your point of view. Percentage of respondents that strongly agree with each statement in 2019 by Carnegie Classification.
An additional question from the Ithaka S+R Faculty Survey 2018 addressing how important different groups of people are to student success was added to this survey cycle. Comparing responses across the two surveys, library directors and faculty unsurprisingly consider different groups of people to be more important to student success, though both groups view faculty as the most important contributors.[35] Library directors believe faculty, academic advisors, librarians and library staff,[36] tutors, peers, and personal counselors/mental health professionals are more highly important than do faculty. Faculty, however, rate teaching/graduate assistants to be more highly important compared to library directors. See Figure 26.
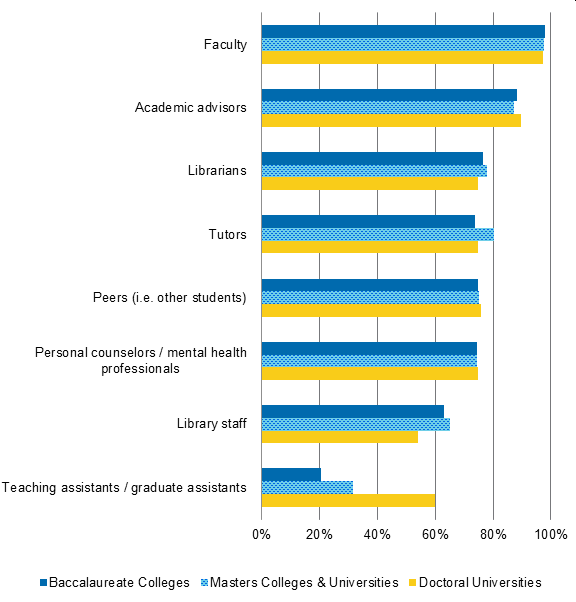
Across institution type, there are a number of clear differences, especially for master’s institution respondents. They consider librarians and library staff as well as tutors to be relatively more important.[37] There are also differences in perceived importance of teaching/graduate assistants for all institution types with doctoral university directors giving them the highest importance ratings and baccalaureate college directors providing the lowest ratings; this is likely due to teaching and graduate assistants being more prevalent at research universities. See Figure 27.
Figure 26. How important are each of the following in contributing to student success at your college or university? Percentage of respondents that selected “highly important,” by survey sample.
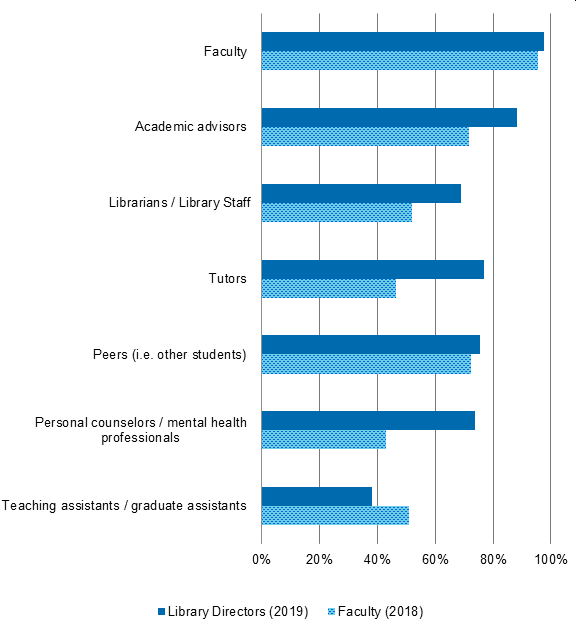
Figure 27. How important are each of the following in contributing to student success at your college or university? Percentage of respondents that selected “highly important,” 2019 by Carnegie Classification.
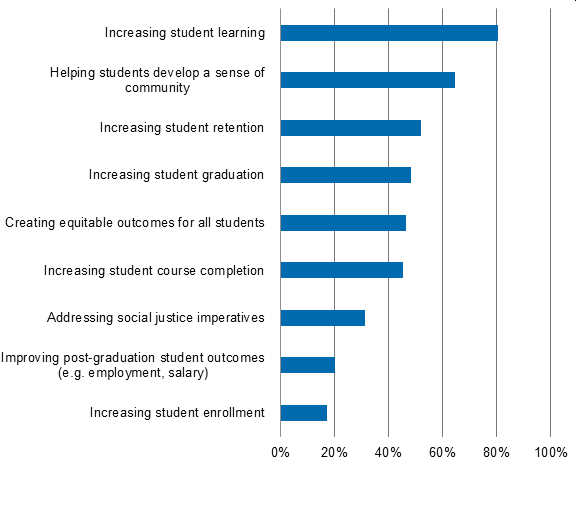
Another set of questions added this cycle asked respondents to indicate the extent to which they believed their library contributes to different student success objectives. These questions included both traditional objectives such as increasing student retention and graduation as well as more holistic objectives such as increasing student learning and helping students develop a sense of community.
Generally, directors believe the library contributes more to holistic objectives than traditional ones. Two-thirds to three-quarters consider their library to greatly contribute to outcomes of increased student learning and sense of community. Meanwhile, a relatively smaller share—roughly half—think their library greatly contributes to increasing the more outcome-based measures of student retention and graduation. In addition, few respondents believe the library greatly contributes to improving post-graduation student outcomes and increasing student enrollment. See Figure 28.
While increasing student learning is the objective most highly rated across institution types, baccalaureate college respondents believe their library contributes even more to student learning than do respondents from doctoral universities (a difference of about 10 percentage points).
Figure 28. In your opinion and/or based on evidence gathered, to what extent does your library contribute to each of the following possible student success objectives? Percentage of respondents that selected “a lot” or “a great deal.”
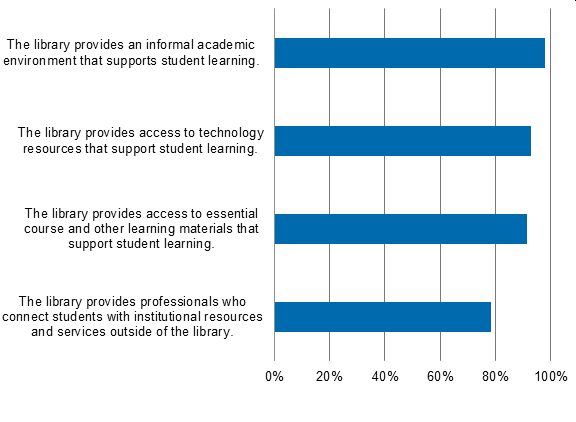
Given the importance of student success and learning to library directors, we included for the first time a set of questions on the importance of a variety of resources the library offers that may contribute to student learning. The vast majority (91 percent or more) believe it is highly important that the library provides an informal academic environment, access to technology resources, and access to essential course and other learning materials. About three-quarters also consider it important for the library to provide professionals who connect students with institutional resources and services outside of the library. See Figure 29. Importance ratings remain largely similar across institution types. These ratings again suggest that the library contributes to student learning through access to a variety of offerings that create a holistic learning environment.
Figure 29. How important is it to you that your library provides each of the following? Percentage of respondents that selected “highly important.”
To evaluate even more specific functions that the library offers toward support for student learning, a set of items was included asking directors to report how they prioritize these functions. As has been the case since 2013, nearly all respondents report that providing physical spaces, for independent and collaborative student learning, and providing reference instruction to undergraduates are high priorities, although there has been a slight decline in the latter over time, particularly for directors at doctoral universities. A number of other functions have also been rated as smaller priorities this survey cycle, particularly those related to more targeted forms of support for faculty and students, including providing special services for online students, hosting centers that support teaching or learning, and providing instructional design assistance for faculty members. See Figure 30.
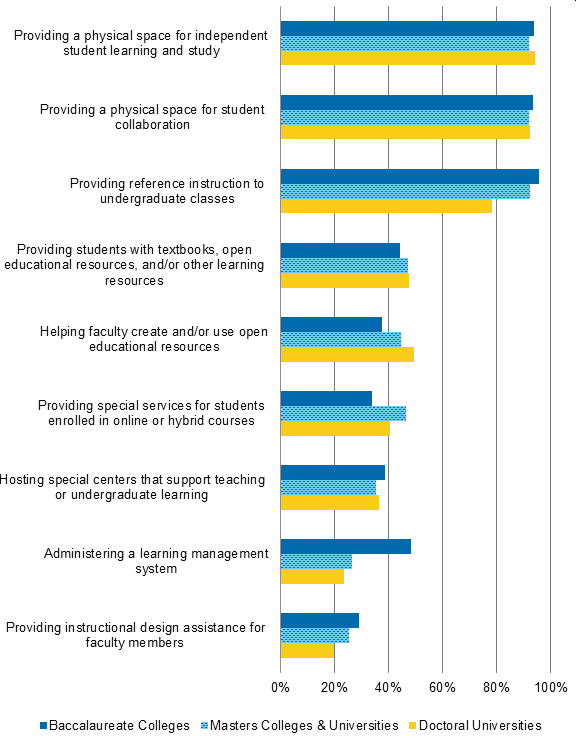
A number of differences also emerged based on institution type, with doctoral and baccalaureate institution respondents prioritizing certain functions differently. Specifically, doctoral university respondents prioritize their library helping faculty create and/or use open educational resources more and providing reference instruction less.[38] On the other hand, baccalaureate college respondents prioritize their library administering a learning management system and providing instructional design assistance for faculty more and providing special services for online students less.[39] This suggests baccalaureate college directors are more concerned with assisting with general faculty instruction rather than more specialized services. See Figure 31.
Figure 30. How much of a priority is each of the following functions in your library? Percentage of respondents that selected “high priority” or “very high priority,” by survey cycle.
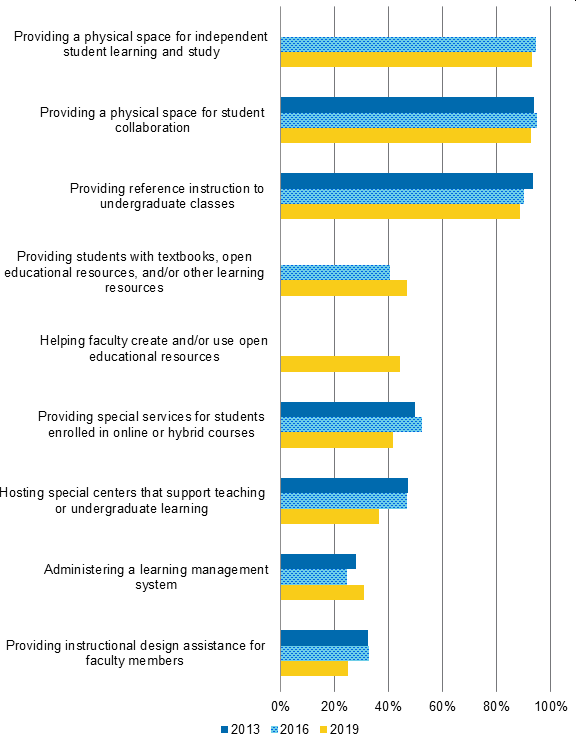
Figure 31. How much of a priority is each of the following functions in your library? Percentage of respondents that selected “high priority” or “very high priority” in 2019 by Carnegie Classification.
The last set of questions on student success specifically focuses on the contributions of librarians. Many of our questions on this topic have been included for numerous survey cycles, but we also added an item on librarians’ contributions to helping students develop skills to identify media manipulation and disinformation. Given the increasing availability of information, both factual and not, these skills are becoming increasingly important.
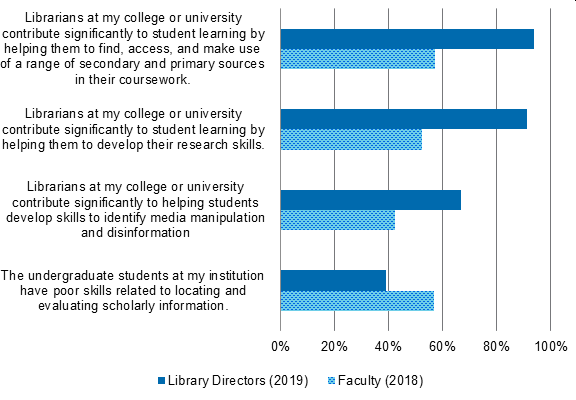
Nearly all library directors believe librarians significantly contribute to student learning in two key areas: they help students find, access, and use sources in their coursework, and they help them develop research skills. These represent increases of about 10 percentage points since 2016, particularly for directors at master’s and doctoral institutions. The majority of respondents also strongly agree that librarians help students identify media manipulation. A similar share of respondents compared to the survey three years ago—roughly four in ten—think undergraduates at their institution have poor skills in locating and evaluating scholarly information. See Figure 32.
Comparisons with the Ithaka S+R Faculty Survey 2018 indicate that library directors more highly recognize the contributions of librarians in all three areas, consistent with previous cycle findings. For each, only approximately half of faculty strongly agree that librarians contribute to student learning in these ways, yet they also more strongly believe that undergraduate students have poor skills related to locating and evaluating scholarly information. See Figure 33.
Figure 32. Please use the 10 to 1 scales to indicate how well each statement below describes your point of view. Percentage of respondents that strongly agreed with each statement, by survey cycle.
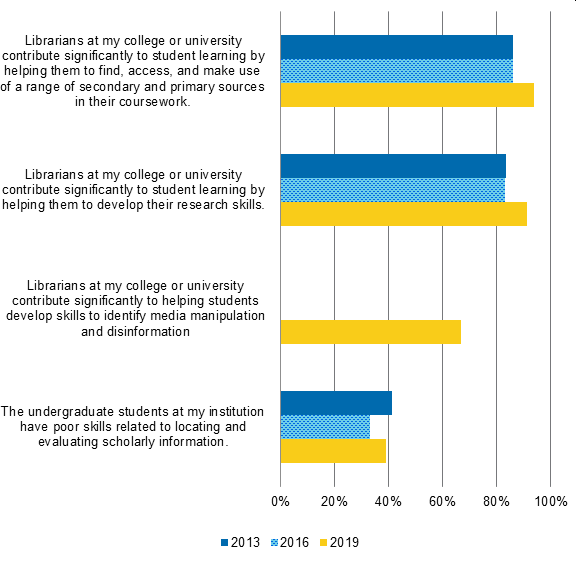
Figure 33. Please use the 10 to 1 scales to indicate how well each statement below describes your point of view. Percentage of respondents that strongly agreed with each statement, by survey sample.
Assessment, Analytics, and Privacy
This survey cycle, we added a new section on library assessment with questions designed to capture library directors’ perceptions of the utility of data collection and dissemination as well as any broad concerns about data privacy. We included questions on what kinds of data most effectively demonstrate the impact of the library and whether directors feel comfortable with contributing data to larger learning analytics initiatives.
Broadly, approximately three-quarters of directors, across institution type, strongly agree that presenting data on the contributions or impact of the library on college or university objectives is a compelling way to advocate for additional resources for the library. While this shows that directors see the value of presenting data, we were also interested in what types of data they most find useful for this advocacy work.
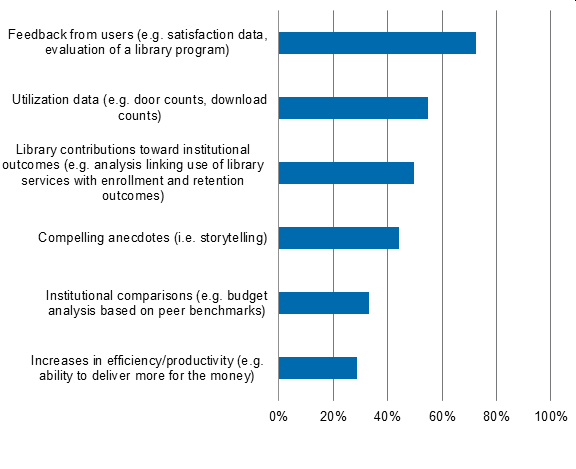
Respondents were asked to select their top three most effective types of data used to demonstrate the impact of the library. The most selected item, chosen by approximately three-quarters of respondents, is feedback from users, including but not limited to satisfaction data or evaluation of a library program. The majority of respondents also believe in the effectiveness of utilization data and library contributions linked to institutional outcomes. A much smaller share, about one-third or less, believe institutional comparisons with peer libraries and increases in efficiency/productivity effectively demonstrate the library’s impact. See Figure 34. There are no differences in how these types of data are perceived by directors at different institution types.
Figure 34. What types of data most effectively demonstrate the contributions or impact of the library when shared with other senior academic leadership? Please select up to three items or leave the question blank if none of the items apply. Percentage of respondents that selected each item.
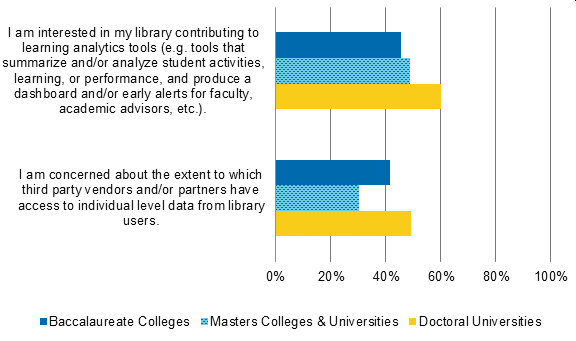
Although many recognize the importance of collecting and presenting particular types of data in the context of advocating for the library, only about half strongly agree that they are interested in contributing data to institution-wide learning analytics tools. Directors at doctoral institutions more strongly agree that they are interested in contributing (a difference of about 15 percentage points), perhaps due to the prevalence of these tools at larger research institutions, underlying differences in privacy concerns, or greater perceived benefits given the institution size.[40]
A relatively smaller share—less than half—of respondents strongly agree that they are concerned about the extent to which third parties have access to individual user data. Notably, this concern is highest among respondents at doctoral universities where half strongly agree that they are concerned, despite this group being the most interested in contributing to learning analytics tools. By contrast, only approximately one-third of directors at master’s institutions strongly agree that they are concerned about this external data access. See Figure 35. Further, there is no association between interest in the library contributing to learning analytics tools and concern about the extent to which third party vendors and/or partners have access to individual level data, suggesting that directors differently conceptualize the risk and rewards afforded by each.
Figure 35. Please use the 10 to 1 scales below to indicate your level of agreement with each statement. Percentage of respondents that strongly agreed with each statement, 2019 by Carnegie Classification.
Collections and Licensing
The final section of the survey included a variety of questions on library collections. These covered topics such as predicted and actual spending on materials, perceptions of the cost and value of resources, and likelihood of canceling major journal packages. Given recent events and trends in scholarly communications, we were particularly interested in whether spending has already or is expected to change and how directors are reacting to rising costs of resources.
Collections Spending
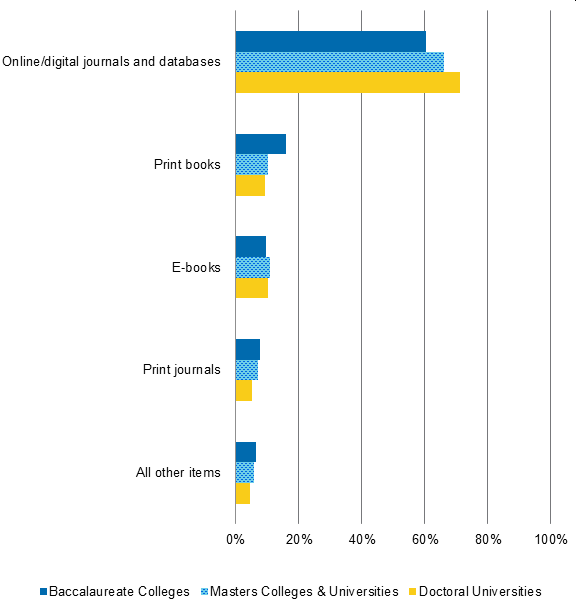
Since our first library survey in 2010, we have asked directors to indicate the percentage of their budget they currently spend on different types of materials in their collections, including both online and print versions of journals and books. Similar to previous cycles, directors are currently spending the majority (about two-thirds) of their materials budget on online journals and databases. While they spend the next highest share of their budget on print books, the percentage of their budget spent on e-books has risen to nearly the same level as print books for the first time this cycle. This is despite only one-third of respondents strongly agreeing that electronic versions of scholarly manuscripts are very important for research and teaching at their institution.
Spending has changed considerably—and consistently—over the past decade. Particularly, library directors have continuously spent a higher proportion of their library’s materials budget on electronic resources and a smaller proportion on print resources. The biggest changes have been for spending on different types of journals with respondents spending about 15 percentage points more on online journals and databases and 10 percentage points less on print journals since 2010. See Figure 36. Further, two-thirds of library directors strongly agree that libraries must shift their collecting to include new materials types as scholarship moves away from its exclusive dependence on text. Therefore, there are likely a number of new types of collections—for example, those of datasets—that we will track in the next survey cycle.
The largest libraries are also the most digital. All subgroups by institution type differ in their proportion of materials budget spent on online journals and databases with directors at doctoral universities spending the highest proportion and directors at baccalaureate colleges spending the lowest proportion (a difference of about 10 percentage points). Despite this difference, directors at all institution types have increased their proportion spent on these resources. On the other hand, directors at baccalaureate colleges have continued to spend approximately the same proportion on print books in 2019 as they did in 2016 (about 16 percent each), unlike directors at the other institution types where spending on print has decreased. This has led to a higher proportion spent on print books compared to directors at master’s institutions and doctoral universities (about 10 percent each), both of which have seen decreases in percentages spent.[41] See Figure 37.
In a 2019 Ithaka S+R report on library acquisitions patterns from 2014-2017, we found slightly different percentages in actual spending. For instance, only about 40 percent of materials budgets was spent on print and electronic serials and approximately 25 percent was spent on books (compared to the roughly 70 percent and 20 percent estimated in this survey).[42]
Figure 36. What percentage of your library’s materials budget is spent on the following items? Percentages must add to 100 percent. Average percentages across all participants, by survey cycle.[43]
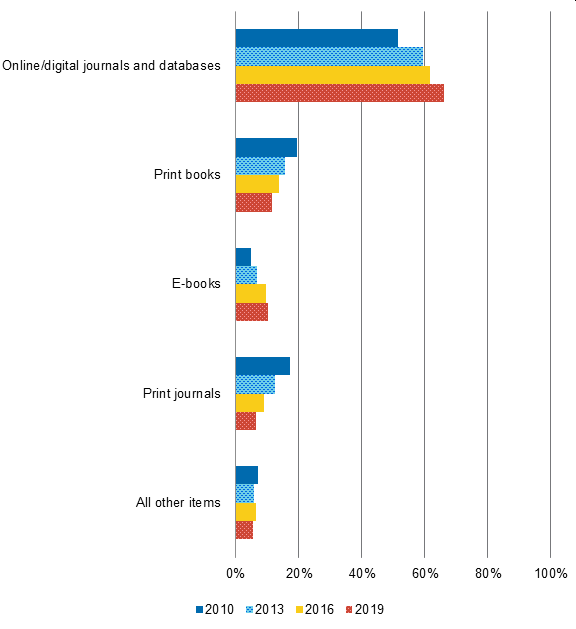
Figure 37. What percentage of your library’s materials budget is spent on the following items? Percentages must add to 100 percent. Average percentages across all participants at each institution type, 2019 by Carnegie Classification.
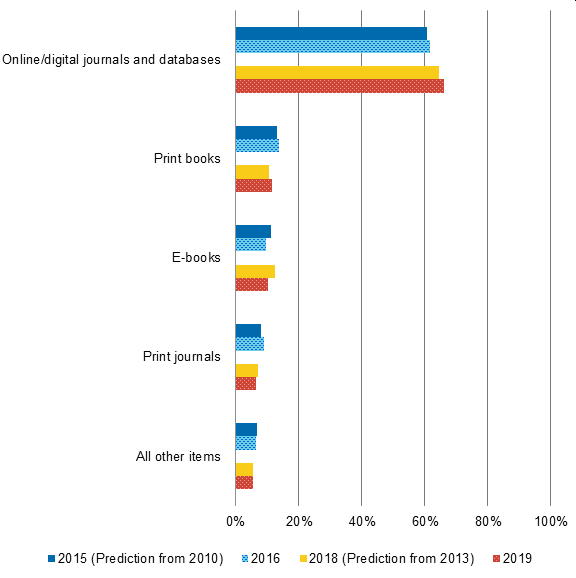
We have also asked directors to predict their spending five years out on the same materials categories since 2010. Overall, respondents continue to expect to spend a higher proportion on online resources and a lower percentage on print resources. In addition, directors at baccalaureate colleges predict spending a larger proportion on print books and a smaller percentage on online journals and databases than do other directors.
Starting in 2016, we have also been able to compare predictions with self-reported spending. In the current survey, we compare 2018 predictions (from 2013) with current spending in 2019 alongside 2015 predictions (from 2010) and actual spending in 2016. In both cases, these predictions have been largely accurately. See Figure 38. Of course, directors are in part responsible for determining these budget allocations, but spending also involves other decision-makers and parties who set pricing for various resources. Thus, the accuracy of these predictions indicate an understanding of the market for scholarly communications.
Figure 38. What percentage of your library’s materials budget is spent on the following items? In five years, what percentage of your library’s materials budget do you estimate will be spent on the following items? Average estimated percentage of budget spent and predicted average percentage to be spent on each type of item, by survey cycle.[44]
In addition to actual and predicted spending, we included questions about how library directors prioritize building and providing access to specific types of materials. Over time, there have not been clear trends in prioritization of most of these functions; some have increased, some have decreased, and some have taken non-linear paths. However, it is clear that smaller shares of directors over time have prioritized digitizing materials and making them publicly available. This could indicate either that libraries have already digitized much of their collections or that they are currently less concerned about doing so. See Figure 39.
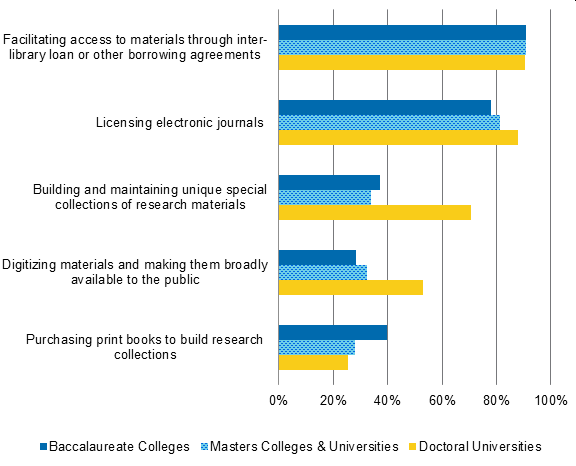
Further, library directors at doctoral universities more highly prioritize building and maintaining special collections, digitizing materials and making them broadly available to the public, and licensing electronic journals. These differences follow greater access to financial resources at doctoral universities in comparison with other institutions. However, there is one area of spending that baccalaureate college directors prioritize above other respondents: purchasing print books to build research collections. As we have seen in the Ithaka S+R US Faculty Survey 2018, faculty members, especially those in the humanities, very much continue to value print monographs; for certain long-form reading activities, the print format is especially valued over electronic. Results across the two surveys may reflect the extent to which print collections have already been built up at doctoral universities and/or the extent to which upcoming purchasing priorities are aligned with faculty demand. See Figure 40.
Figure 39. How much of a priority is each of the following functions in your library? Percentage of respondents that selected “high priority” or “very high priority,” by survey cycle.[45]
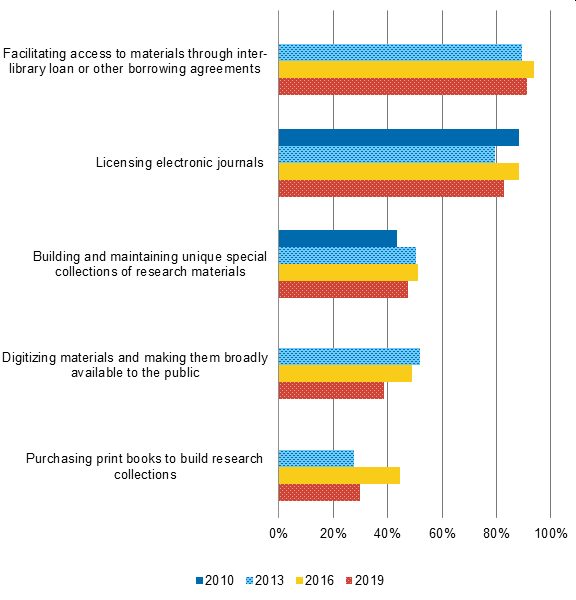
Figure 40. How much of a priority is each of the following functions in your library? Percentage of respondents that selected “high priority” or “very high priority,” 2019 by Carnegie Classification.
Collections Formats
In the 2016 survey, there was a spike in the percentage of directors who had formal deaccessioning policies for print resources that were also digitally available. Since 2016, this proportion has leveled off. Currently, about two thirds of respondents have deaccessioning policies, with greater shares of directors at doctoral universities than at master’s colleges and universities currently having these policies (a difference of 15 percentage points). This difference is reflected in a decrease in the proportion of directors from master’s institutions who have had formal deaccessioning policies from 2016 to 2019. See Figure 41.
Figure 41. Does your library have formal collections management policies for when and how to de-accession print materials that are available to you digitally as well? Percentage of respondents that selected yes, by survey cycle and Carnegie Classification.[46]
Although many library directors have formal deaccessioning policies for print books that are available digitally, very few directors strongly agree that the use of e-books will be so prevalent among faculty and students that it will not be necessary to maintain library collections of hard copy books (less than 10 percent). These responses are similar to directors’ responses since 2010, indicating a recognition of the value of having print books in their collections even if they are more heavily investing in digital.
Journal Licensing
Finally, we included questions on directors’ perceptions of journal licensing agreements and their expectations of future continuations or cancellations of packages. These questions are of particular interest given the high profile media attention of recent cancellations, especially the University of California system cancellation of their deal with Elsevier.[47] Thus, we seek to understand how library directors, who may or may not have similar concerns to those at the UC system, are reacting to the issues at the heart of these cases.
We asked directors to report their agreement with two statements related to journal licensing agreements. Specifically, these include statements about whether it is a high priority for directors to bundle open access publishing fees along with subscription costs (what are colloquially known as “transformative agreements”[48]) and whether the value of licensed e-resources increases at a faster rate than cost. The former is a new item and the latter has been asked since 2016. In both cases, only a small proportion of directors strongly agree.
While about one-quarter of respondents believed the value of licensed e-resources resources was rising faster than cost in 2016, this share has fallen to just 14 percent in 2019. Further, only about 20 percent strongly agree it is a high priority to bundle open access publish fees with subscription costs. While there is no statistically significant difference across Carnegie Classification, a greater share of doctoral university respondents is interested in these transformative agreements compared to both master’s and baccalaureate college respondents; slightly more than 20 percent of doctoral respondents, slightly less than 20 percent of master’s institution respondents, and about 15 percent of baccalaureate college respondents strongly agree with the statement provided.
For the first time, we asked library directors how likely they are to cancel one or more major journal packages in the next licensing cycle. Nearly half of respondents in our survey report that they are very or extremely likely to do so, and this proportion is consistent across institution type. Additionally, approximately two-thirds of respondents strongly agree that the high price of scholarly publications to their library constrains faculty members’ ability to access materials they need. However, about half strongly agree that they expect the library to become increasingly dependent on externally-provided electronic resources in the future. We expect to continue tracking these changes over time.
Directors also reported for the first time the importance of talking to key stakeholders about the possibility of these cancellations. These results demonstrate whose opinion library directors value in decision making around scholarly communications. Unsurprisingly, nearly all library directors consider librarian and faculty opinions to be highly important. Librarians are likely to be the most involved in making decisions that enable library users finding and accessing resources, thus directors may want to know how cancellations would impact them. Faculty, on the other hand, are most likely to be involved in seeking this scholarly information and producing articles that may be published in cancelled journals. Therefore, library directors recognize the value of their perspective.
Cancellation exercises are clearly more complicated at doctoral institutions, not only because of the institutional scale, but also because far more stakeholder groups are likely to be involved. Respondents at doctoral universities consider all groups except undergraduate students to be more highly important to talk to about the possibility of cancelling major journal packages. Similar to other items, respondents at doctoral universities consider the perspectives of graduate students to be the most important and baccalaureate college respondents rate their perspectives as least important with master’s institution respondents falling between these. See Figure 42.
Figure 42. How important, if at all, is discussing the possibility of cancelling one or more major journal packages with each of the following? Percentages of respondents that selected “highly important” in 2019 by Carnegie Classification.
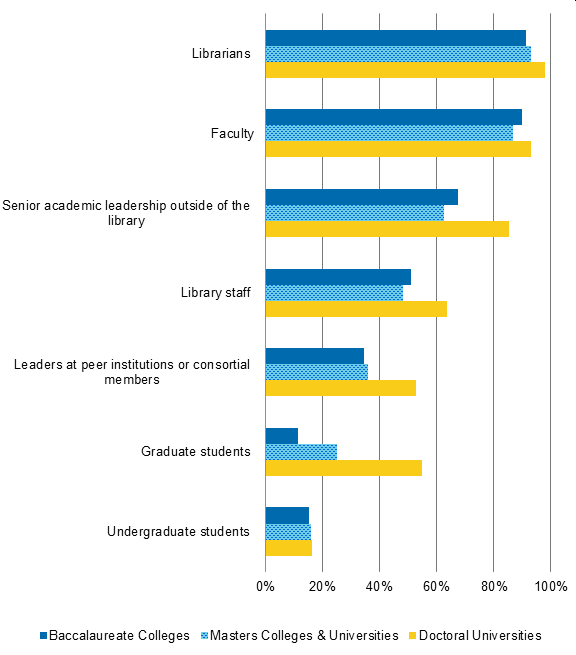
Conclusion
The 2019 cycle of the Library Survey has tracked the ways that library strategy has evolved—both since the previous cycle three years prior as well as since the first survey nearly a decade ago. We see in this cycle that library directors anticipate greater investment in services to support research and teaching, while spending on collections—particularly print collections—is expected to decrease, at least comparatively. Many anticipate major journal package cancellations in the coming years, while few plan to pivot to transformative agreements to bundle publishing and subscription costs.
Challenges in executing on these strategies have been identified. We continue to document a decreasing sense of institutional alignment and support. Current strategies to bolster diversity, equity, inclusion, and accessibility have not been identified as strong. Financial constraints continue to loom large.
Since this latest survey was fielded, the still-developing COVID-19 pandemic has disrupted all manner of assumptions about higher education and academic libraries. Libraries have been comparatively well positioned to operate remotely given the extensive digital services they provide. Yet, the economic and fiscal consequences of the pandemic are not yet clear. We will survey library directors later in 2020 to better understand the impact. In the meantime, we look forward to hearing your thoughts, reflections, and questions on this latest cycle of findings.
Appendix A: Participant Demographics
| Population Demographic | Frequency | Percentage |
|---|---|---|
| Carnegie Classification | ||
| Baccalaureate Colleges: Mixed Baccalaureate/Associate’s | 13 | 2% |
| Baccalaureate Colleges: Diverse Fields | 67 | 10% |
| Baccalaureate Colleges: Arts & Sciences Focus | 100 | 16% |
| Master’s Colleges & Universities: Small Programs | 37 | 6% |
| Master’s Colleges & Universities: Medium Programs | 77 | 12% |
| Master’s Colleges & Universities: Larger Programs | 143 | 22% |
| Doctoral/Professional Universities | 54 | 8% |
| Doctoral Universities: High Research Activity | 76 | 12% |
| Doctoral Universities: Very High Research Activity | 78 | 12% |
| Job title[49] | ||
| Director | 283 | 50% |
| Dean | 194 | 34% |
| Chief, head, college, or university librarian | 94 | 17% |
| Other (e.g. vice provost, vice president, professor) | 48 | 8% |
| Direct supervisor | ||
| Provost, chief academic officer, or vice president of academic | 526 | 80% |
| Deputy/Assistant/Associate provost, deputy/assistant/associate chief academic officer, or deputy/assistant/associate dean of academic affairs | 68 | 10% |
| Chief Information Officer (CIO) | 21 | 3% |
| College or university president | 10 | 2% |
| Other | 34 | 5% |
| Teaching and research balance | ||
| My institution is primarily focused on teaching | 254 | 39% |
| My institution is somewhat more focused on teaching | 203 | 31% |
| My institution has an equal focus on research and teaching | 133 | 20% |
| My institution is somewhat more focused on research | 33 | 5% |
| My institution is primarily focused on research | 36 | 5% |
| Years as director at current institution | ||
| Less than 2 years | 166 | 25% |
| 2-5 years | 226 | 34% |
| 6-10 years | 136 | 21% |
| 11-15 years | 66 | 10% |
| More than 15 years | 64 | 10% |
| Previous position | ||
| Interim director | 109 | 17% |
| Director at another institution | 155 | 24% |
| Associate university/college librarian | 154 | 23% |
| Department head | 107 | 16% |
| Other position in higher education | 38 | 6% |
| Other position outside of higher education | 20 | 3% |
| Other | 75 | 11% |
| Age | ||
| 22-34 | 12 | 2% |
| 35-44 | 77 | 12% |
| 45-54 | 219 | 34% |
| 55-64 | 226 | 35% |
| 65 and over | 108 | 17% |
| Gender | ||
| Man | 249 | 39% |
| Woman | 394 | 61% |
| Transgender | 3 | <1% |
| Non-binary | 2 | <1% |
| Another option not listed | 0 | 0% |
| Race-ethnicity | ||
| White | 564 | 88% |
| Black or African American | 46 | 7% |
| Asian or Asian American | 10 | 2% |
| Hispanic, Latino, Latina, or Latinx | 10 | 2% |
| Middle Eastern | 7 | 1% |
| American Indian or Alaska Native | 3 | <1% |
| Native Hawaiian or Other Pacific Islander | 2 | <1% |
| Other | 6 | <1% |
Appendix B: Analysis Groups
| Grouping variable | Code | Group |
|---|---|---|
| Carnegie Classification | ||
| 1 | Baccalaureate Colleges | |
| 2 | Master’s Colleges and Universities | |
| 3 | Doctoral Universities | |
| Gender | 0 | Men |
| 1 | Women | |
| Race-ethnicity: White | 0 | Non-White |
| 1 | White | |
| Race-ethnicity: Black/African American | 0 | Non-Black |
| 1 | Black | |
| Survey | 0 | Faculty Survey |
| 1 | Library Survey |
Appendix C: Prioritization of Library Functions
How much of a priority is each of the following functions in your library? Top 13 priorities. Percentage of respondents that rated each function as a high or very high priority.
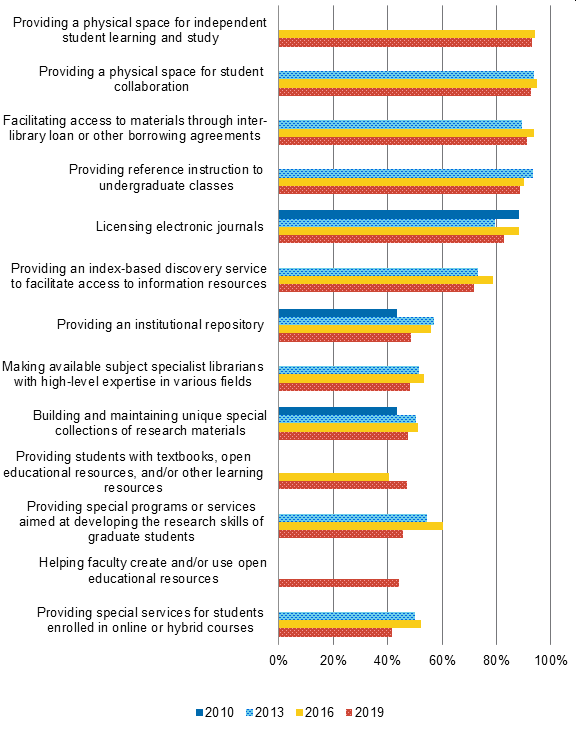
How much of a priority is each of the following functions in your library? Bottom 13 priorities. Percentage of respondents that rated each function as a high or very high priority.
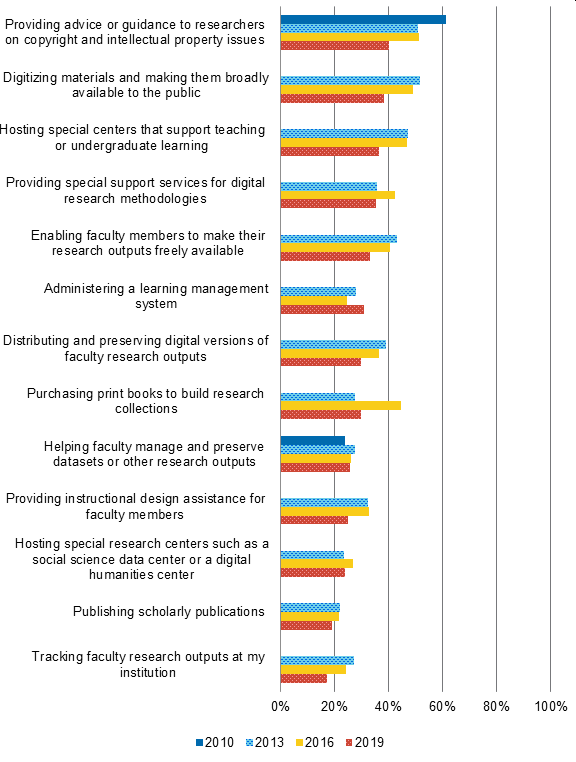
Endnotes
- Lisa Janicke Hinchliffe and Christine Wolff-Eisenberg, “First This, Now That: A Look at 10-Day Trends in Academic Library Response to COVID-19, Ithaka S+R, 24 March 2020, https://sr.ithaka.org/blog/first-this-now-that-a-look-at-10-day-trends-in-academic-library-response-to-covid19/. ↑
- “The Coronavirus Is Upending Higher Ed. Here Are the Latest Developments,” The Chronicle of Higher Education, https://www.chronicle.com/article/The-Coronavirus-Is-Upending/248175. ↑
- “COVID-19: Resources for Higher Education and Academic Libraries,” Ithaka S+R, https://sr.ithaka.org/our-work/covid-19/. ↑
- While individuals held a variety of titles, for simplicity we refer to them collectively as “directors” in the remainder of this report. ↑
- Excludes participants without Carnegie Classification information, such as library directors who work at multiple institutions. Thus, the total adds up to less than 662 (our total number of participants). ↑
- Excludes participants without Carnegie Classification information and does not account for bounced or failed emails, which cannot be tracked at the individual level. ↑
- See Jennifer K. Frederick and Christine Wolff-Eisenberg, “Gearing Up for the Ithaka S+R National Library Director Survey,” Ithaka S+R, July 17, 2019, https://sr.ithaka.org/blog/gearing-up-for-the-ithaka-sr-national-library-director-survey/ for more on the themes covered in this survey cycle. ↑
- For more information about cognitive interviews, see Christine Wolff-Eisenberg, “Employing Cognitive Interviews for Questionnaire Testing: Preparing to Field the US Faculty Survey,” Ithaka S+R, June 1, 2018, https://sr.ithaka.org/blog/employing-cognitive-interviews-for-questionnaire-testing/. ↑
- This is a general rule of thumb used in social science research to represent the minimum sample size needed to produce valid results. ↑
- For example, respondents who chose more than one gender were coded into man or woman if they selected one of those options. ↑
- Because the samples of respondents across time are confidential and not independent, it is not possible to run independent samples nor paired samples t-tests or ANOVA comparing responses over time. ↑
- Datasets from the Ithaka S+R series of surveys may be found at “Ithaka S R Surveys of Higher Education Series,” ICPSR, http://www.icpsr.umich.edu/icpsrweb/ICPSR/series/226/studies. ↑
- We combined the items “Campus engagement on behalf of the library” and “College/university responsibilities outside of the library” and added items on scholarship and direct service provision / library programming. We also edited the item on professional development which previously included professional association activities. ↑
- Compared to directors at baccalaureate colleges and both other institution types respectively. ↑
- In comparison with directors at master’s institutions (lack of financial resources), both institution types (differences of opinion with their direct supervisor), and baccalaureate colleges (lack of employee skills in key areas). ↑
- Two items were changed since the 2016 cycle. We changed “labor flexibility and/or restrictions” to “labor regulation and/or restrictions” and “differences of opinion with the provost or chief academic officer” to “differences of opinion with your immediate supervisor (e.g. the provost or chief academic officer)”. The 2013 survey also contained a few additional differences: “lack of staff in key areas” now reads “lack of employee skills in key areas” and “general resistance to change among library staff” now reads “general resistance to change among library employees.” ↑
- For most of these skills, doctoral university respondents differ significantly from directors at both other institution types, but they are only significantly different from master’s institution respondents for management skills. ↑
- We added “or databases” in the 2019 survey and therefore limit our interpretation of over-time findings for this item. ↑
- Due to the discrepancies in the items asked in 2010 compared to the other three cycles, we did not include the 2010 percentages in this graph. As noted in a previous footnote, the item “Online or digital journals and databases” did not include “and databases” prior to 2019, and therefore the ability to compare against previous cycles is limited. The following items also have changed since 2010: e-books (previously electronic versions of scholarly manuscripts), tools for discovery (previously didn’t include the example discovery services), rare materials and special collections (previously specified non-digital special collections), print preservation and collections management (previously did not include collections management), new employees or redefined positions (previously read staff instead of employees), and employee salary increases (previously read staff instead of employees). ↑
- IDEAL ’19: Advancing Inclusion, Diversity, Equity, and Accessibility in Libraries & Archives, The Ohio State University: University Libraries, August 6-7, 2019, https://library.osu.edu/ideal-19. ↑
- See La Loria Konata, “Looking Through a Colored Lens: A Black Librarian’s Narrative,” in A.M. Deitering, R. Stoddart, and R. Schroeder (Eds.), The Self as Subject: Autoethnographic Research into Identity, Culture, and Academic Librarianship (Chicago, IL: Association of College and Research Libraries, 2017), 115-128, https://scholarworks.gsu.edu/cgi/viewcontent.cgi?article=1127&context=univ_lib_facpub, and Amanda L. Folk and Tracey Overbey, “Narratives of (Dis)Engagement: Exploring Black/African-American Undergraduate Students’ Experiences with Libraries,” Recasting the Narrative: The Proceedings of the ACRL 2019 Conference, April 10-13, 2019, http://www.ala.org/acrl/sites/ala.org.acrl/files/content/conferences/confsandpreconfs/2019/NarrativesofDisEngagement.pdf for examples. ↑
- Roger C. Schonfeld and Liam Sweeney, “Inclusion, Diversity, and Equity: Members of the Association of Research Libraries: Employee Demographics and Director Perspectives, Ithaka S+R, August 30, 2017, https://doi.org/10.18665/sr.304524. ↑
- There is one exception. Women directors more strongly agree that their library’s and institution’s strategies are aligned. ↑
- Compared to master’s (strategy alignment and institution’s strategies) or both master’s and baccalaureate directors (library’s strategies). ↑
- We gathered the list of items to be included through desk research utilizing the ALA website’s section on equity, diversity, and inclusion, http://www.ala.org/advocacy/diversity, the Black Caucus of the ALA’s website, http://www.ala.org/aboutala/affiliates/affiliates/bcala, and REFORMA’s website: https://www.reforma.org/. We also received feedback from advisors and during testing. ↑
- Again these practices were selected based on desk research (Tara Sophia Mohr, “Why Women Don’t Apply for Jobs Unless They’re 100% Qualified,” Harvard Business Review, August 25, 2014, https://hbr.org/2014/08/why-women-dont-apply-for-jobs-unless-theyre-100-qualified; DeEtta Jones, “The Inclusive Manager’s Hiring Checklist, https://deettajones.com/wp-content/uploads/2019/07/DeEtta-Jones-Inclusive-Managers-Hiring-Checklist.pdf ), feedback from advisors, as well as issues that the first author engaged with while conducting research at the University of Michigan. See “Stride,” The University of Michigan’s Advance Program, https://advance.umich.edu/stride/ for more resources and suggestions of best practices. ↑
- Fifty-nine percent to be exact, vs. 24 percent of private institution directors. ↑
- There is one exception. There is no significant difference in importance ratings for support for graduate students at baccalaureate colleges. This is unsurprising given the small number of graduate students present at these institutions. ↑
- Most of these questions were asked in previous cycles, but we updated our item on technology systems for clarification purposes. Thus, we do not have over time data for that item. ↑
- From 35-44 percent. ↑
- There is no significant difference between doctoral university directors and baccalaureate directors on priority of providing advice or guidance on copyright and intellectual property issues. ↑
- In previous survey cycles, the items “providing advice or guidance to researchers on copyright and intellectual property issues” and “hosting special research centers such as a social science data center or a digital humanities center specifically referenced faculty rather than researchers in general. ↑
- Master’s institution respondents also more highly prioritize distributing and preserving digital versions of faculty research outputs and publishing scholarly publications than do baccalaureate college respondents. ↑
- In the 2010 cycle, the item “helping faculty manage and preserve datasets or other research outputs” did not include “and preserve” and the item “providing an institutional repository” read “creating and maintaining an institutional repository.” ↑
- Since we used different scales, we first transformed the library survey 6-point scale to a 7-point scale to be consistent with the faculty survey. ↑
- These items were combined in the faculty survey and separate in the library survey. We calculated averages between the items in the library survey to compare across the two surveys. ↑
- Compared to doctoral, baccalaureate, and doctoral respondents respectively. ↑
- Compared to both baccalaureate and master’s institution respondents (open educational resources) and baccalaureate college respondents (reference instruction). ↑
- Baccalaureate directors are significantly different from all other directors for each case except for providing instructional design assistance. There is no significant difference between baccalaureate and master’s institution respondents for this item. ↑
- Compared to baccalaureate college directors. ↑
- There is also a small difference between directors at doctoral universities (five percent) and directors at masters (seven percent) and baccalaureate institutions (eight percent) in proportion spent on print journals. ↑
- Katherine Daniel, Joseph J. Esposito, and Roger C. Schonfeld, “Library Acquisition Patterns,” Ithaka S+R, January 29, 2019, https://doi.org/10.18665/sr.310937. ↑
- In the 2010 cycle, “online journals and databases” included the specification of “journal databases,” and “e-books” read “electronic versions of scholarly manuscripts.” ↑
- Again, in 2010, the item “online/digital journals and databases” included the specification of “journal databases,” and “e-books” read “electronic versions of scholarly manuscripts.” ↑
- In the 2010 cycle, the item “licensing electronic journals” read “purchasing/licensing digital resources” and the item “building and maintaining unique special collections of research materials” read “building and maintaining special collections of rare or unique materials” ↑
- In 2010, this item referred to “print collections” rather than “print materials.” ↑
- See Lindsay McKenzie, “UC Drops Elsevier,” Inside Higher Ed, March 1, 2019, https://www.insidehighered.com/news/2019/03/01/university-california-cancels-deal-elsevier-after-months-negotiations, and Lindsay McKenzie, “‘Big Deal’ Cancellations Gain Momentum,” Inside Higher Ed, May 8, 2018, https://www.insidehighered.com/news/2018/05/08/more-institutions-consider-ending-their-big-deals-publishers. ↑
- Lisa Janicke Hinchliffe, “Transformative Agreements: A Primer,” The Scholarly Kitchen, April 23, 2019, https://scholarlykitchen.sspnet.org/2019/04/23/transformative-agreements/. ↑
- Respondents entered their job title in an open-ended format. Percentages exceed 100 percent because some directors reported titles that fit into multiple categories. ↑