Measuring a Liberal Education and its Relationship with Labor Market Outcomes
An Exploratory Analysis
-
Table of Contents
- Executive Summary
- Introduction
- Liberal Education’s Fraught Public Perception
- The Economic Value of a Liberal Education
- Our Approach
- LASEO Framework
- LASEO Index Scores
- LASEO Index Scores and Institution-Level Student Outcomes
- Limitations
- Conclusion & Recommendations
- Appendix A: LASEO Framework Attributes and Metrics
- Appendix B: Results Tables – Full Sample
- Appendix C: Descriptive Data – Subsample
- Appendix D: Results Tables – Subsample
- Endnotes
Executive Summary
The liberal arts and sciences has been a prominent feature of the United States higher education system for centuries, yet it has faced waves of public skepticism since the 1930s. Today, the value of a liberal education is constantly disputed, and colleges and universities face increasing pressure to justify their use of its practices on their campuses. To better understand the value and benefits of the liberal arts and sciences, The Andrew W. Mellon Foundation has funded a series of studies investigating the long-term effects of a liberal education on various outcomes such as health, civic engagement, and cognitive development. The present paper adds to this series by studying the economic value of a liberal education, as this particular focus is most commonly used to argue for and against its relevance and utility.
Previous research examining the value and limitations of a liberal education cite mixed results, relying on liberal arts colleges and liberal arts and sciences majors (or fields of studies) as proxies for a liberal education. But a liberal arts and sciences education is more than a set of academic disciplines, and students receive it across diverse sectors of postsecondary education. As such, we contend that past studies fail to completely capture the experience of a liberal education and thus provide an incomplete picture of its value. In response, we present a new and nuanced framework, the Liberal Arts and Sciences Educational Offering (LASEO) Framework, to identify and describe the core features of an undergraduate liberal arts and sciences educational experience and subsequently measure them. Broadly speaking, our framework describes a liberal arts and sciences education as a tradition of learning that exposes learners to academic curricula across the humanities, social sciences, and hard sciences. It employs engaging teaching practices within intimate settings that foster community and expose students to diverse perspectives, with the goal of developing a foundation for self-directed lifelong learning.
Using this framework, we produce a set of LASEO Index Scores capturing the degree to which a subset of 454 four-year institutions in the United States offered their students a liberal arts and sciences educational experience in the early 2000s. We then examine whether differences in LASEO scores are associated with one short-term academic and four long-term labor market outcomes for their students, at the institutional level. We also conduct the same set of analyses on a restricted subsample of 340 institutions in our dataset that are not classified as liberal arts institutions.
We do not find any associations between those offerings, as captured by our LASEO scores, and the four primary labor market outcomes of interest. As such, our findings suggest that the degree to which institutions do or do not offer their students a liberal arts and sciences educational experience is neither positively nor negatively associated with their students’ labor market outcomes, as measured in this study. These findings do not support, and may even run counter, to the claim that a liberal arts and sciences education does not prepare students for the twenty-first-century job market or for economically-viable careers.
Further countering that argument are the positive associations we observe on a secondary outcome and in our restricted sample. In both the full and restricted sample, we observe a positive relationship between an institution’s LASEO score and a secondary labor market outcome—the likelihood that a student whose parents are at the bottom 40 percent of the income distribution moves to the top 40 percent of the income distribution by their early 30s. This suggests that liberal arts and sciences educational experiences may provide value-added for low-income students in particular. We also observe a positive association in the restricted sample of non-liberal arts institutions between an institution’s LASEO score and its graduation rate.
In light of these findings, we believe there is much value in continuing to pursue research and practice that furthers our knowledge in this area, and support such educational offerings in the meantime. Follow-up research would benefit from additional and expanded applications of our framework and approach, including studying other types of institutions and conducting similar analyses using student-level data. It would also benefit from qualitative research that examines the potential mechanisms by which liberal arts and sciences educational experiences may provide low-income students with beneficial knowledge or skills. Researchers should also explore and analyze the institutional conditions and practices that influence those educational offerings and their take-up by students, how they can be made more widely available to students who may stand to benefit the most, and how they can be translated to virtual contexts.
Introduction
The death knell for the liberal arts and sciences has been sounded continuously—and erroneously—over the last century.[1] In the 1930s, the liberal arts and sciences were prophesied to fade away at the hands of state universities’ shift to “practical,” vocational curricula.[2] Decades later, academic studies in the 1980s traced decreasing student interest in the liberal arts and sciences, questioned whether it was an “endangered species,” and decried its future to be “problematic.”[3] And more recently, calls for “remaking,” “liberating,” or outright “abolishing” the liberal arts and sciences have made national headlines amid arguments against its relevance to the twenty-first century’s tech-driven labor market.[4] Today, the institutional budgetary blows struck by the global COVID-19 pandemic are predicted to “kill” hundreds of American liberal arts colleges.[5] Yet the liberal arts and sciences has remained a strong tradition in our country’s higher educational system, even during waves of public skepticism, periods of economic recession, and cycles of declining enrollment. In fact, every fatal pronouncement made upon this distinctly American form of higher education is countered by its enduring survival.
To put it plainly, the perceived value of the liberal arts and sciences is constantly disputed and continually upheld. Nevertheless, colleges and universities are under increasing pressure to justify their use of such practices on their campuses.[6] How, then, can we begin to measure the benefits of a liberal education? To answer this question, a series of studies funded by The Andrew W. Mellon Foundation is investigating the long-term effects of a liberal education on various outcomes—such as health, civic engagement, and cognitive development—using novel research strategies.[7] As part of this series, this paper adds to this burgeoning literature, building upon previous Ithaka S+R research,[8] by studying the economic value of a liberal education, as this particular focus is most commonly used to argue for and against its relevance and utility.
In the next sections, we argue that the lack of clear definition around this resilient and at-times controversial tradition has contributed to the narratives about its imminent failure. We then provide a broad landscape review of previous research examining the value and limitations of a liberal education, and find that these traditional analyses, citing mixed results, fail to completely capture the experience of a liberal education and thus fail to adequately study its value. In response, we present a new and nuanced framework, the Liberal Arts and Sciences Educational Offering (LASEO) Framework, to identify, describe, and then measure the core features of an undergraduate liberal arts and sciences educational experience. Using this framework, we produce a set of LASEO Index Scores that aim to capture the degree to which institutions offer their students such an experience. Both the LASEO Framework and LASEO Index Scores are available for download on our website at https://sr.ithaka.org/our-work/measuring-a-liberal-education/. Next, we use the scores to analyze how differences in such educational offerings are associated with student outcomes at the institutional level. To complement the quantitative analyses, we profile several institutions that offer a liberal arts and sciences educational experience in less-than-typical circumstances. We conclude the report with recommendations for future research and the potential implications of the COVID-19 pandemic on liberal education.
Liberal Education’s Fraught Public Perception
Narratives against the liberal arts and sciences reveal a lack of clear definition; the term means different things to different audiences.[9] Many leave the “sciences” out of the equation altogether. Others exclusively use it for a particular set of residential private colleges, which are often associated with elite admission and high prices. But a liberal arts and sciences education is more than a set of academic disciplines, and students receive it across diverse sectors of postsecondary education—from traditional liberal arts colleges to large state research universities to open enrollment community colleges. We will define our framework for what comprises a liberal arts and sciences educational experience in a later section of this report. But broadly speaking, we contend that a liberal arts and sciences education describes a tradition of learning—once unique to the United States, but now a global export—that exposes learners to academic curricula across the humanities, social sciences, and hard sciences. It employs engaging teaching practices within intimate settings that foster community and expose students to diverse perspectives, with the goal of developing a foundation for self-directed lifelong learning. Sometimes shorthanded to “liberal education,” this model of postsecondary education is often contrasted to other forms that focus on vocational training (e.g. engineering, acting, nursing, or welding). Proponents of the liberal arts and sciences argue that such an education prepares students to think critically, communicate effectively, and adapt flexibly to the changing demands of our labor market and democratic society—thus better preparing learners for work, life, and citizenship.[10]
Opinions about the liberal arts and sciences’ waning utility often cite declining enrollment within its traditional academic disciplines as evidence for its outdated approach. Though it is true that majors such as English, history, and philosophy have seen a significant drop in enrollment over the past decade,[11] these departments are only a slice of the liberal arts and sciences pie. While the share of humanities bachelor’s degrees has declined, that of social sciences has remained flat and that of hard sciences has increased. As Barnard College Professor of History Robert A. McCaughey describes, these changes in discipline popularity are “less suggestive of a sinking ship than a rearranging of deck chairs.”[12] The numbers support this argument: While the share of students earning bachelor’s degrees in the liberal arts and sciences has declined since its peak in the mid-1990s (at 39 percent), it dropped less than four percentage points through 2018, reaching the same share of that from the 1980s.[13] During this same period, the share of degrees in the liberal arts and sciences conferred by the two-year sector—currently in the midst of a humanities renaissance[14]—increased 19 percent.[15] Pursuing a liberal arts and sciences education is now the most popular path for community college graduates, representing 55 percent of all associate degrees conferred.[16]
Arguments against the perceived worth of a liberal arts and sciences education also focus on the declension narrative surrounding private liberal arts colleges.[17] One study even quips that “No segment of American higher education has had more epitaphs written about it.”[18] This hinges upon claims that “true liberal arts colleges” have either shuttered their doors or shifted toward vocationalism, with studies showing that the number of liberal arts colleges that award at least 40 percent of their degrees in liberal arts and sciences disciplines has shrunk from 540 in 1972 to 130 in 2012.[19] However, this recent analysis comes at the heels of the 2008 recession, which dealt severe blows to all higher education institutions. Small private colleges—the composition of many liberal arts colleges, though these are not interchangeable terms—were especially hard hit.[20]
Further, these arguments often suggest that liberal arts colleges are the only sector providing a traditional liberal education. The recent up swell in community college students graduating with degrees in the liberal arts and sciences directly contradicts this assumption, as does the growth of honors programs at public university systems. Modeled after private liberal arts colleges, public honors programming includes seminar-style classes, tailored faculty advising, residential living communities, and other co-curricular elements that enable learning inside and outside of the classroom.[21] State-funded institutions use these programs to attract high-ability students, promising them a liberal arts and sciences experience at lower costs than those of private colleges—often through well-funded scholarships. Today, 81 percent of bachelor’s degree-issuing public universities offer such programming.[22] As funding cuts force schools to weigh the merits of each budget item, these more expensive honors programs are enthusiastically supported by state administrators,[23] showing the public sector’s commitment to liberal education.
The liberal arts and sciences’ fiercest critics claim that such an education is not a sound investment for students and their families. They argue that without the technical or “hard” skills privileged in our increasingly technology-driven economy, college graduates will struggle to find well-paying jobs commensurate with their level of education—only to be saddled with high levels of college debt as a result. But this argument, too, has been called into question. A recent analysis identified “human” skills such as critical thinking, communication, and creativity—skills historically associated with a liberal arts and sciences education—as the most in-demand by employers.[24] Similarly, strong arguments have been made that as the fourth industrial revolution progresses, creating an unpredictable labor market that will continue to be disrupted by automation and artificial intelligence, US students are best served by learning soft skills that can be adapted and applied in a variety of environments and contexts.[25] In the next section, we take an even closer look at studies on the economic value of a liberal education.
The Economic Value of a Liberal Education
The question of whether or not a liberal arts and sciences education holds economic value for students is one that has yet to be conclusively answered. Over the past decade, numerous studies have examined the relationship between a liberal education and students’ subsequent labor market outcomes. Due to the inherent complexity involved in quantifying the extent to which institutions offer such an education or students receive one, studies have relied on liberal arts colleges and liberal arts and sciences majors (or fields of studies) as proxies for a liberal education. Despite the limitations of these approaches, these studies collectively shed light on the nature of this complex relationship, as we detail below.
On average, students who major in the liberal arts and sciences do not earn as much as their peers in more career-oriented fields and are somewhat more likely to be unemployed or underemployed. Following the 2008 recession, graduates in the liberal arts and sciences were more likely to be underemployed, including in jobs that did not require a bachelor’s degree, compared to graduates in areas such as health care and engineering.[26] Liberal arts and sciences graduates also earn less than their peers even under better market conditions. Although their earnings do increase over time, by the later stages of their career liberal arts and sciences majors still earn around $5,000 less than the average college graduate, and their earnings never catch up to those of their peers with more technical majors.[27]
While liberal arts and sciences majors may not earn as much as their peers, their earnings and employment outcomes do improve significantly over time. The previously mentioned post-recession underemployment was likely a temporary phase for many liberal arts and sciences graduates who eventually transitioned into better jobs.[28] In fact, between their first and third job many liberal arts and science majors change careers into high-skill, high-demand fields such as marketing and management.[29] These career shifts can also lead to a rapid growth in earnings that closes the gap between those who graduate in the liberal arts and sciences and their more technical counterparts. In fact, the earnings gap between these two groups is much smaller by the time students reach peak earnings age (56-60),[30] supporting the conclusion that those with liberal arts and sciences majors are not significantly disadvantaged.
Although these findings suggest that majoring in the liberal arts is not as economically advantageous as some alternatives, the relationship between one’s major and future earnings is not straightforward. Several factors such as gender and self-selection into majors can affect future earnings and may make one’s choice of major less relevant. One such factor is variance in career path within majors, which accounts for much of the difference in earnings between graduates.[31] One’s occupation plays a particularly significant role in earnings in the hard sciences and in multidisciplinary fields, making it difficult to draw earnings conclusions solely based on major. There is also significant variation in earnings both between and within majors in the liberal arts and sciences.[32] Comparing the average liberal arts and sciences major to the average technical major masks much of this variation and can mislead audiences into assuming that majoring in the liberal arts is detrimental to future success.
Examining other economic indicators presents a different picture and suggests that liberal arts and sciences majors do just as well as their more career-oriented counterparts. For the humanities specifically, there is negligible difference in student debt between humanities majors and non-humanities majors, and humanities majors were able to recover from the Great Recession just as well as their peers.[33] Graduates of the humanities also had very similar perceptions of their financial situation compared to non-humanities majors. As mentioned previously, liberal arts and sciences graduates typically experience rapid wage growth in their 30s and 40s, the fastest among all major groups.[34] While their earnings may not match up, there is evidence that liberal arts and sciences majors are able to find economic success.
Using a student’s institution as a proxy for a liberal arts and sciences education rather than a student’s major also supports the conclusion that liberal arts and sciences graduates fare just as well as their peers. Students who graduate from a liberal arts institution do just as well as students who graduate from equally selective private or public institutions in terms of both earnings and economic mobility.[35] In terms of return on investment (ROI), liberal arts graduates may even have the upper hand—the long-term ROI for liberal arts institutions is higher than that of the average small, private institution.[36] However, factors such as selectivity often have a greater impact on earnings than whether one attended a liberal arts institution.[37] Students who attend more selective institutions likely come from wealthier families and will likely have better earnings in the long run regardless of institution type. An institution’s major offerings, average parental income, and regional characteristics can also affect ROI and preclude direct conclusions regarding the effect of the liberal arts on future outcomes.
In short, the evidence on the economic value of a liberal arts degree is inconclusive. On one hand, those who major in the liberal arts likely fare worse than their counterparts in more technical fields. Factors such as within-major variation and occupation complicate this relationship and raise questions as to whether major should be used as a proxy for a liberal arts education. Using institution type as a proxy suggests a positive relationship between liberal arts and economic outcomes, but this relationship is complicated by factors such as selectivity. Other methods must be utilized to establish a causal relationship between students receiving a liberal arts education and their economic success.
Our Approach
We explore the value of offering students a liberal arts and sciences educational experience, whether delivered by a traditional “liberal arts college” or not, by aiming to answer two questions:
What are the features that define a liberal arts and sciences educational experience, and in what combinations are they offered by a broader set of two- and four-year institutions of higher education in the United States?
How are the particular features of a liberal arts and sciences educational experience and the overall degree to which they are offered by institutions associated with their students’ academic and long-term labor market outcomes?[38]
LASEO Framework
Rather than assume that only private “liberal arts colleges” can provide students with a liberal arts and sciences educational experience, we implemented the Association of American Colleges and Universities’ (AAC&U) updated definition of liberal education in the twenty-first century to consider a wide range of institution types—including community colleges and technical degree programs—that embody some of the core features of such an education.[39] In doing so, we took the stance that the “liberal arts college” binary fails to accurately capture what institutions offer their students. In its place, we developed a framework that identifies and describes the core features of a liberal arts and sciences educational experience (framework foundation), and then measures the degree to which institutions offered their students such an experience (framework application).
Framework Foundation
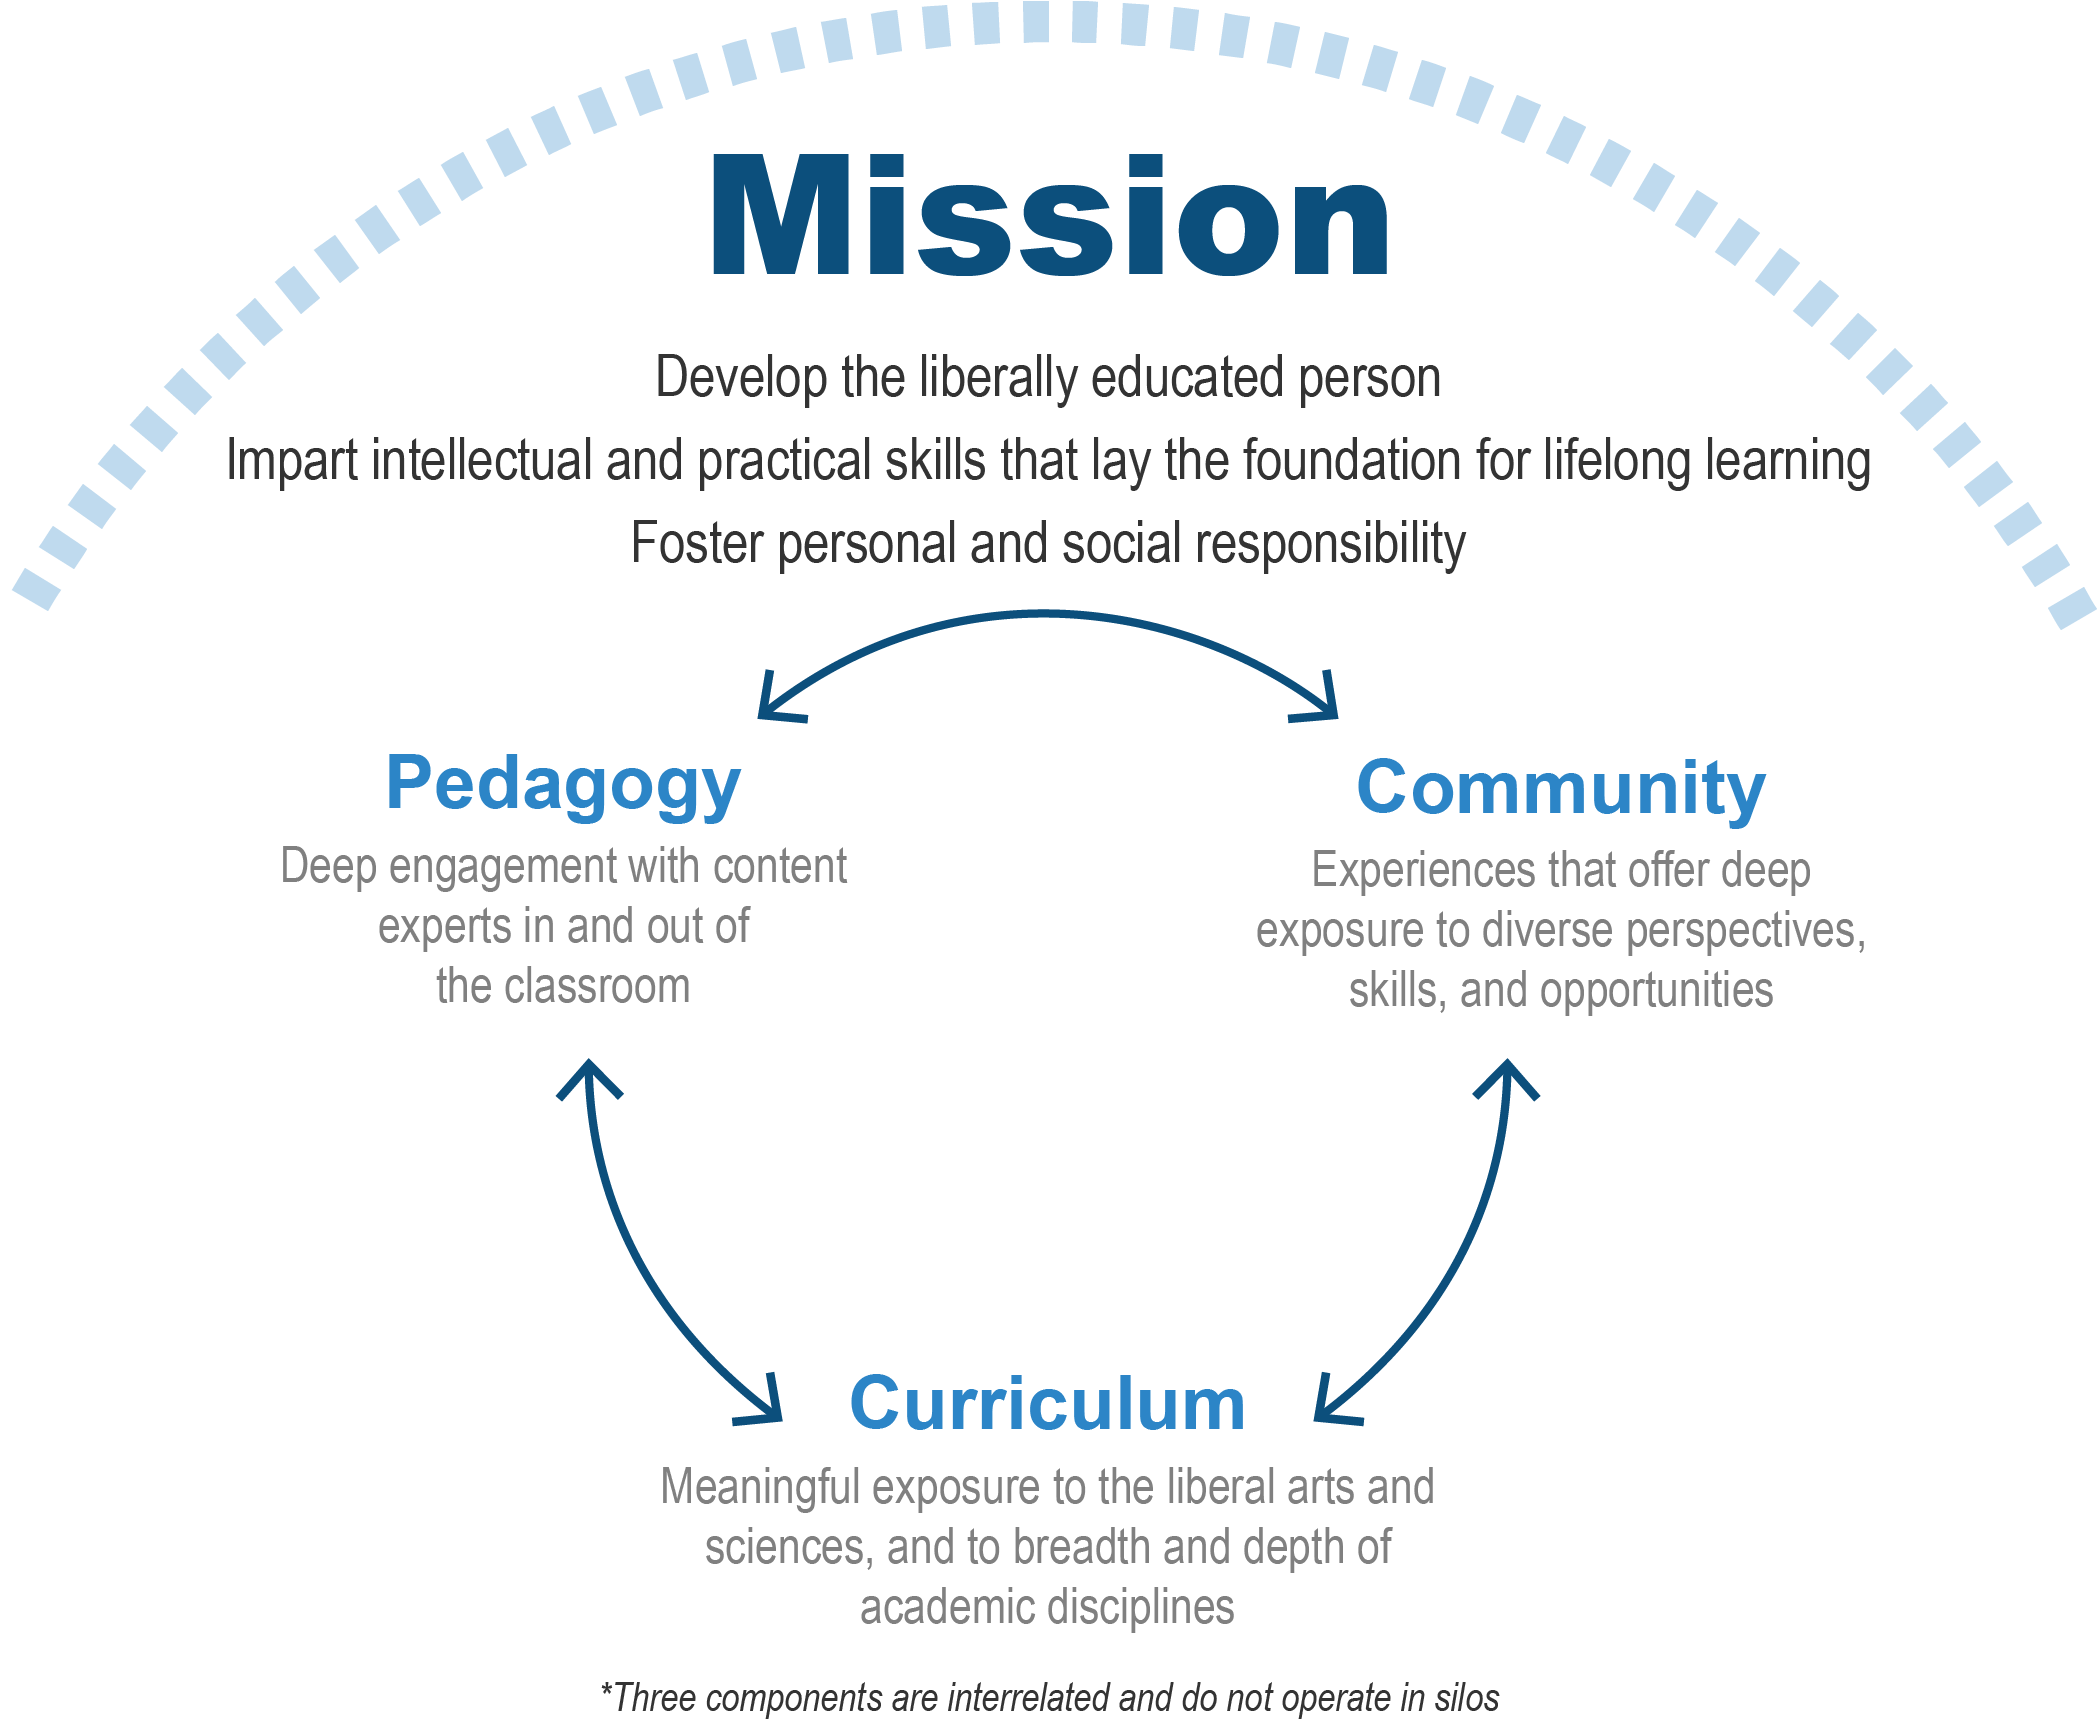
The LASEO framework foundation is grounded in the existing literature on the purpose of a liberal education and what defines the liberal arts and sciences educational experience. It lays out and describes the core components and features of such an educational experience, to ground subsequent applications of the framework in a theoretical and standard conceptualization of the topic at hand that is agnostic to the type of institution, student body, or data being studied. To develop this foundation for our framework, we first identified a common narrative surrounding the mission of a liberal education: to impart a set of intellectual and practical skills and experiences that lay the foundation for lifelong learning, as well as foster personal and social responsibility for participation in a global society.[40] Based on this definition, we identified three key components that most accurately encompass the liberal arts: pedagogy, curriculum, and community (see Figure 1). Within each component, we developed a set of attributes that best embody and describe the features of a liberal arts and sciences educational experience. The three components of the Liberal Arts and Sciences Educational Offering (LASEO) Framework, and attributes that comprise each component, are described below.[41]
Before sharing the details of the framework, it is important to note that it was developed prior to the COVID-19 pandemic, which forced many schools and systems to move completely online for the second half of the Spring 2020 term and for the entire Summer 2020 term. A number of schools started the Fall 2020 term virtually as well, with most students not on campus. Some of the key features of a liberal arts and sciences educational experience we’ve identified, particularly those in the community component, depend on in-person interaction amongst peers. As such, the current environment makes it significantly more difficult, if not impossible, for institutions to offer a liberal arts and sciences educational experience as outlined in our framework. However, this is not to say that the purpose of liberal education couldn’t be achieved through a different set of models and practices, designed for the world in which we now find ourselves.
Figure 1. LASEO Framework Foundation: Mission and Components
Pedagogy
Pedagogy, in our framework, refers to a teaching approach that cultivates meaningful interactions between students and faculty, and promotes students’ critical thinking. This component of the framework, capturing attributes such as instruction by committed and invested faculty with content expertise, is meant to measure the extent to which institutions provide classroom environments where “students and faculty come together to explore and extend the foundations of knowledge.”[42] A focus on undergraduate education and small classroom settings have long been considered requirements for an institution to be classified as liberal arts since it is these settings that traditionally have been seen as fostering the kind of active learning that distinguishes a liberal arts and sciences educational experience from other types of educational experiences.[43]
Curriculum
Curriculum refers to substantial and broad educational offerings in the fields that constitute the liberal arts and sciences. A liberal arts and sciences education includes “instruction in a broad curriculum of the arts and sciences” as well as considerable depth in a limited number of areas.[44] The requirement that students explore multiple disciplines and are exposed to depth in one area of the arts and sciences is unique to a liberal education and is part of what provides the appreciation of “knowing for the sake of knowing” that defines the liberal arts experience.[45] Many courses and programs in the liberal arts culminate in a capstone project that requires sustained and deep engagement in the particular discipline.
Community
Community refers to an institution’s offerings outside the classroom that facilitate deep engagement among students and expose them to diverse opinions and opportunities. This component emphasizes the importance of experiences beyond students’ direct course of study, and captures “the ideal of learning as an act of community.”[46] Peer interaction is central to a student’s development of critical thinking skills and personal and social responsibility that characterizes those receiving a true liberal arts and sciences education.[47] Attributes such as diversity in peer groups and availability of extracurricular organizations are part of what make up the community framework component.
Framework Application
As described above, the framework foundation was designed to lay the ground for practical applications that further our knowledge of the liberal arts and sciences educational experience. In the present study, we apply this framework to measure the degree to which a set of higher education institutions in the United States offered their students such an educational experience —i.e. institutions’ level of liberal arts and sciences educational offerings—with the ultimate goal of exploring potential associations between those offerings and students’ outcomes. To that end, we developed metrics and a scoring strategy to measure each of the ten attributes in our framework foundation that measure the three core components of pedagogy, curriculum, and community through which the mission of a liberal education is meant to be achieved. We describe our process for developing these metrics, along with our scoring strategy and resultant LASEO Index Scores in the next section.
LASEO Index Scores
We drew on the LASEO Framework to develop an index to capture the degree to which a subset of two- and four-year institutions in the United States offered their students such an experience. The goal of the index was to understand the prevalence of a liberal education and its features in American higher education institutions, which could then be used to explore the relationship between such educational offerings and students’ outcomes. The result is a set of scores measuring how institutions fare relative to each other on the specific set of liberal-arts attributes identified in the framework. It is important to note that LASEO scores do not in any way measure the overall quality of education that these institutions offer, nor do they measure the quality of the different attributes offered. Moreover, the scores are based on an analysis of 2001-04 data, as further detailed below, and therefore do not represent how institutions fare on these attributes at the present time. See the limitations section for a more comprehensive and detailed discussion of what the scores do and do not represent.
Institution-Level Data
Through extensive research, we identified four key data sources to use collectively to measure institutions’ liberal arts-ness. The four sources, described below, collect information on undergraduate institutions’ characteristics, offerings, requirements, and faculty pedagogical practices between 2001 and 2004 to align with the longer-term labor market outcomes of their students. Earnings estimates are not reliable until individuals are in their mid-30s, which is why we look at institutions in the early- to mid-2000s. This was also done to align with labor market data from Opportunity Insights, which examined outcomes in 2014 of children born between 1980 and 1982 and who attended college in the early 2000s.
- Higher Education Research Institute (HERI) Faculty Survey: A national survey conducted and administered on a triennial basis to two- and four-year college and university faculty in the United States by the Higher Education Research Institute at the University of California, Los Angeles (UCLA), home to the Cooperative Institutional Research Program (CIRP). The survey asks faculty questions related to how they interact with their students and their methods of instruction and evaluation, among other things. HERI provided fully de-identified faculty responses to their 2001-02 and 2004-05 surveys.[48]
- Annual Survey of Colleges (ASC)[49]: A web-based annual survey administered by The College Board to nearly 4,000 two- and four-year accredited undergraduate colleges and universities in the United States. The survey collects information on the characteristics of colleges and universities that is perceived to be of use to high school students, parents, and school counselors, among others. Many of the questions used in the ASC are taken from the Common Data Set (CDS), a set of standardized questions used by major publishers of college guidebooks. The College Board provided institutional responses to their 2004-05 survey, which asked questions regarding the Fall 2003 term.
- Thomson Peterson’s Undergraduate Licensed Database[50]: A database of more than 4,000 two- and four-year accredited undergraduate colleges and universities in North America that includes responses to survey questions developed and administered by Peterson’s. Most of the survey data are on institutions’ application and admission requirements, and program and facility offerings. Peterson’s is another key partner of the CDS initiative. Peterson’s provided institutional responses to their 2004 survey, which describes institutional characteristics in the 2003-04 academic year.
- Integrated Postsecondary Education Data System (IPEDS): The most comprehensive public source of information on higher education institutions and the outcomes of their students. Institutions that participate in federal student aid programs are required to complete and submit IPEDS surveys on an annual basis. We collected IPEDS surveys on institutional characteristics, educational offerings, student enrollment, student financial aid, and awards by CIP code in the 2003-04 academic year.
Institution-Level Proxy Metrics, Scoring, and Weights
Using the four data sources described above, we constructed thirteen institution-level proxy metrics to capture the extent to which institutions with available data across these data sources offered the ten features of a liberal arts and sciences educational experience that make-up our framework, with each feature measured by one to three metrics. For example, as a proxy for the attribute of “instruction by committed and invested faculty with content expertise,” we calculated the share of full-time undergraduate faculty (denominator) who were teaching-focused and had a doctoral degree in the same general discipline as the department of their current faculty appointment (numerator). For a complete list of the attributes and institution-level proxy metrics, see Appendix A; for additional details on how each metric was calculated, see the Liberal Arts and Sciences Educational Offering (LASEO) Framework Excel file, available at https://sr.ithaka.org/liberal-arts-and-sciences-educational-offering-laseo-framework/.
Constructing metrics using HERI data required an additional step of adjusting for faculty response bias within institutions and aggregating faculty responses to the institutional level. We adjusted for response bias by assigning weights to respondents from a given institution based on the extent to which their gender and faculty rank were represented in the set of survey responses from that institution.[51] Faculty who were well-represented in terms of their gender and faculty rank were assigned a relatively small weight compared to poorly represented faculty. Institutions where fewer than 20 percent of their full-time undergraduate faculty participated were excluded, as were institutions where fewer than ten total full-time undergraduate faculty participated.[52]
Due to the nature of the collected data, some metrics were scored in absolute terms while others were scored in relative terms. Metrics based on categorical data, like whether or not an institution offers particular programs or has core curriculum requirements, were scored in absolute terms. For example, as a proxy for the attribute of “student-guided and signature approaches to the curriculum,” institutions were assigned three points if they offered student-designed majors (and 0 points if they did not) and two points if they offered independent study (and 0 points if they did not) for a total of five possible points. For the metrics based on continuous data, institutions were scored on their position relative to other institutions in the dataset.[53]
Drawing on how the literature characterizes a liberal arts and sciences education and its strongest components, we assigned more weight to the pedagogy component (40 percent), followed by the curriculum (35 percent) and community (25 percent) components. Each attribute within each component was also weighted based on our understanding of its relative theoretical contribution to that component, relying on insights gleaned from the literature. For example, the curriculum component consists of four different attributes, with different weights each. For instance, we assigned relatively large weight to the metrics measuring breadth and depth of curriculum (30 percent of the curriculum component score in total), and relatively small weight to the metric measuring student-guided/signature approaches to the curriculum (five percent of the curriculum component score). While the weighting of each metric and attribute was well-informed and grounded in the literature, our final decisions were subjective and should therefore be understood as approximate and dependent on a set of assumptions. See the checks for validity section below for additional information on how we tested some of these assumptions. The assigned weights for each component in the framework can be found in the Liberal Arts and Sciences Educational Offering (LASEO) Framework Excel file, available at https://sr.ithaka.org/liberal-arts-and-sciences-educational-offering-laseo-framework/.
Checks for Validity
We refined and finalized the index scores through an iterative process, conducting several rounds of revisions to our metric definitions, and scoring and weight procedures, and reviewing the resulting set of LASEO index scores to see how they were impacted and to explore whether they had face validity. In other words, were traditionally labelled liberal arts institutions receiving relatively high scores? And conversely, were technical or vocational schools receiving relatively low scores, while understanding that there would be some reshuffling given that we were employing a new approach to defining a liberal education? For the most part, the overall set of scores met our expectations, but often a few institutions appeared to be outliers. Subsequent investigation into unexpectedly high-scoring institutions revealed that their missions were more aligned with the mission of a liberal education than initially perceived, and that they offered many of the features identified in our framework. In fact, this exercise helped us identify a few institutions that serve as examples for offering a liberal arts and sciences educational experience in atypical circumstances (described in the Conclusion section).
We also analyzed the relationship between individual metrics and the overall score across iterations to ensure that no individual metrics were over-determining the overall index score and that there was variability in metric results. Further, we explored associations between select attributes to ensure they were aligned with the literature on a liberal education. For instance, we found a negative association between an institution’s score on the engaged practices metric and class size. In other words, institutions where faculty use a relatively high number of engaged learning practices in their courses had lower average class sizes, which is expected given the difficulty of using such practices in larger classroom settings or lecture-based courses.
Eligible Institutions and Final Sample
The initial sample of institutions consisted of the 3,864 accredited, degree-granting, and undergraduate-enrolling institutions operating in the United States in the early 2000s, according to IPEDS.[54] The sample was then limited based on the amount of available data on each institution across the four data sources used for this study. We excluded from our sample institutions missing more than ten percent, or ten possible points, of the LASEO index score due to unavailable data. Data on institutions’ pedagogical practices and environments was the most challenging to identify and acquire, especially for two-year institutions, as they rely heavily on faculty surveys that address those particular topics. A total of 1,862 institutions had sufficient data outside of faculty-level information on pedagogy to be included in the final sample, including 421 two-year institutions, but only 488 institutions had sufficient data across all sources, including only 34 two-year institutions. Because two-year institutions were severely underrepresented in our data, we excluded them from our analyses. For the remaining institutions with missing data (between one and ten percent of the LASEO index score), we replaced those data with a number proportionate to the rate at which non-missing points were scored.[55] Our final analytic sample consisted of 454 four-year institutions.
Final Sample’s LASEO Index Scores
Final index scores for our sample of 454 four-year institutions were tabulated by summing up institutions’ scores across the attributes within each component, and then summing up institutions’ scores across the three components in our LASEO Framework. Possible index scores range from 0 to 100, where a higher index score indicates that an institution offered its students more of a liberal arts educational experience relative to lower-scoring institutions. Table 1 provides descriptive data on the index scores for our sample.
In our analytic sample, institutions’ LASEO index scores, calculated based on data from the early 2000s, ranged between 20.79 and 91.16, with an average score of 61.22. Scores on the pedagogy component were the primary driver separating top-scoring institutions from other institutions because of the relatively low scores institutions received on that component, and the relatively high levels of variation in scores. The average score on the pedagogy component was 19.94, representing half of the 40 total points that the component was worth. In comparison, the average scores of the curriculum and community components were 24.61 and 16.67, representing 70 percent of 35 possible points and 67 percent of 25 possible points, respectively. In addition, variation in pedagogy scores was greater than that in curriculum and community scores, resulting in the largest gaps in scores between institutions.
Table 1. Descriptive Data on LASEO Index Scores – Full Sample
| n | Mean | SD | Min | Max | |
|---|---|---|---|---|---|
| LASEO index score | 454 | 61.22 | 12.63 | 20.79 | 91.16 |
| Pedagogy score (out of 40 points) | 454 | 19.94 | 7.02 | 2.17 | 36.49 |
| Curriculum score (out of 35 points) | 454 | 24.61 | 4.94 | 4.44 | 34.89 |
| Community score (out of 25 points) | 454 | 16.67 | 3.05 | 6.74 | 22.98 |
Looking at scores across institutional sectors, we find, unsurprisingly, that the average scores of institutions traditionally classified as liberal arts institutions[56] (75.24) are greater than those of non-liberal arts institutions (56.52), and the average scores of private institutions (64.82) are greater than those of public institutions (52.79)—by 19 and 12 points respectively (see Table 2 for additional descriptive data). For a complete list of the institutions and their scores, see the Liberal Arts and Sciences Educational Offering (LASEO) Index Scores Excel file, available at https://sr.ithaka.org/liberal-arts-and-sciences-educational-offering-laseo-index-scores/.
Table 2. Descriptive Data on LASEO Index Scores, by Institutional Type – Full Sample
| n | Mean | SD | Min | Max | |
|---|---|---|---|---|---|
| Full sample | 454 | 61.22 | 12.63 | 20.79 | 91.16 |
| Liberal arts institutions | 114 | 75.24 | 8.66 | 55.32 | 91.16 |
| Non-liberal arts institutions | 340 | 56.52 | 9.99 | 20.79 | 86.07 |
| Private institutions | 318 | 64.82 | 12.04 | 29.05 | 91.16 |
| Public institutions | 136 | 52.79 | 9.62 | 20.79 | 86.07 |
Drilling down further and looking at the relationship between specific attributes across the three components and overall index scores, all attributes with the exception of institutional diversity were positively correlated with the overall index score. Institutions with a relatively high LASEO score had a student body that is less diverse when it comes to race, income, gender, and age than institutions with lower LASEO scores, while overall LASEO scores were most strongly correlated with institutions’ share of majors that are in the liberal arts and sciences.
LASEO Index Scores and Institution-Level Student Outcomes
Once LASEO scores were finalized, we examined whether differences in LASEO scores of the 454 four-year institutions in our non-representative sample, based on their educational offerings in the early 2000s, are associated with both short-term academic and long-term labor market outcomes for their students (at the institutional level).
Key Outcome and Control Variables
For our analyses, we capture one academic achievement and four labor market outcome variables, and include seven control variables, described below. All outcome and control variables are at the institutional level, and are reported as such by the data sources they were derived from. Unless noted otherwise, the outcome and control variables in our analyses were drawn from IPEDS. We also draw on data from Opportunity Insights, the U.S. Department of Education’s College Scorecard, and the American Survey of Colleges (ASC). There are slight differences in how the first three data sources report institutional data which impacted sample sizes; see the section describing analytic samples for additional details.
Outcome Variables
Six-year graduation rate: Percent of full-time, first-time degree/certificate-seeking undergraduates in the 2001 incoming cohort who graduated from their home institution within six years (academic achievement outcome).
Mid-career earnings: Median individual earnings, in 2014, of individuals born between 1980 and 1982 who were enrolled in college between the ages of 19 and 22. Data are from Opportunity Insights.
Net price-to-earnings ratio: Ratio of the average net price from 2006-07 to 2008-09[57] paid across four years, representing the entire price for a typical student to attend a four-year institution, to median individual mid-career earnings (i.e. the second outcome variable noted above). This measure estimates the number of years it would take a student to repay the price of attending college. Earnings data are from Opportunity Insights.[58]
Intergenerational income mobility rate: Joint probability of students: a) having parents in the bottom 40 percent of the income distribution (i.e. an institution’s access rate), and b) moving to the top 40 percent of the income distribution by their early 30s (i.e. an institution’s success rate). Data are from Opportunity Insights.[59]
Seven-year loan repayment rate: Percent of student borrowers who left school and entered repayment in either FY 2006 or 2007 and paid at least $1 in principal within seven years (either FY 2013 or FY 2014). Data are from the U.S. Department of Education’s College Scorecard.
Control Variables
Public: Binary indicating whether an institution is public, as opposed to a private not-for-profit institution.
SAT score: SAT score in Math and Verbal at the 25th percentile of first-time, degree/certificate-seeking undergraduate students in the 2001-05 incoming cohorts. Data are also from ASC in cases where institutions did not report SAT scores in the relevant year to IPEDS but did report scores to ASC.[60]
Parental median income: Median parental household income of students between the ages of 15 and 19. Data are from Opportunity Insights.
Education and related (E&R) spending per FTE: Amount of institutional spending on student-related educational activities per full-time equivalent (FTE) student in the 2003-04 academic year.[61]
Share of undergraduates who are female: Percent of undergraduate students in the 2001 incoming cohort who are female.
Share of undergraduates who are underrepresented minority: Percent of undergraduate students in the 2001 incoming cohort who are Black (non-Hispanic), Hispanic, or American Indian or Alaskan Native.[62]
Share of degrees in engineering: Percent of associate and bachelor’s degrees awarded in the 2004-05 academic year in engineering based on CIP codes.[63]
Analytic Samples
Table 3 presents descriptive data on the five outcome variables for the full sample. A total of 28 institutions are not in the Opportunity Insights dataset, so they are missing mid-career earnings, net-price-to-earnings ratio, and intergenerational income mobility rate data. Three institutions are missing loan repayment data in the College Scorecard data. Lastly, some data points were dropped for 22 institutions as a result of slight differences in how IPEDS, Opportunity Insights, and the College Scorecard report data.[64]
Table 3. Descriptive Data on Outcome Variables – Full Sample
| Outcome Variable | n | Mean | SD | Min | Max |
|---|---|---|---|---|---|
| Six-year graduation rate | 454 | 58.99% | 16.90% | 8.33% | 95.48% |
| Mid-career earnings | 404 | $45,451 | $10,422 | $22,600 | $102,700 |
| Net-price-to-earnings ratio | 404 | 1.62 | 0.52 | 0.18 | 4.02 |
| Intergenerational income mobility rate | 404 | 9.48% | 3.89% | 2.16% | 29.10% |
| Seven-year loan repayment rate | 429 | 83.51% | 8.68% | 39.15% | 97.16% |
Table 4 presents descriptive data on six control variables (excluding institutional control level) for the full sample. The table includes an additional column presenting the correlation with index scores (all p-values are <0.01). A total of 33 institutions are missing SAT data and 28 institutions are missing parental median income, another variable from Opportunity Insights. Among those not missing relevant data, institutions with relatively high LASEO scores tended to enroll students with higher SAT scores and from wealthier families than institutions with relatively low LASEO scores, and spent more on education and related activities. They also had larger shares of female undergraduate students, smaller shares of students from an underrepresented minority group, and smaller shares of students who graduated with a degree in engineering.
Table 4. Descriptive Data on Control Variables and Correlations with LASEO Index Scores – Full Sample
| Control Variable | n | Mean | SD | Min | Max | r* |
|---|---|---|---|---|---|---|
| SAT score | 421 | 983.94 | 125.74 | 610 | 1400 | 0.49 |
| Parental median income | 404 | $99,393 | $27,729 | $37,500 | $226,700 | 0.47 |
| Education and related spending | 453 | $15,963 | $9,101 | $5,094 | $80,793 | 0.54 |
| Share female | 454 | 60.07% | 12.06% | 0.19% | 100% | 0.13 |
| Share URM | 454 | 13.01% | 13.11% | 0.36% | 93.28% | -0.15 |
| Share of degrees in engineering | 454 | 2.23% | 6.42% | 0% | 68.49% | -0.19 |
| * All p-values are < 0.01. |
Analytic Approach
We employed a series of bivariate and multivariate regressions, examining the relationship between the LASEO index scores of the 454 four-year institutions in our dataset—both total scores and the three components—and students’ academic and long-term labor market outcomes at the institutional level as described above. We also examine how the inclusion of control variables affect those relationships. We present two regression models for each analysis. Model 1 does not include control variables, and model 2 includes the seven control variables listed above. We use listwise deletion to handle missing data, meaning an institution missing a single value in the relevant model is excluded from that analysis.
We then conducted the same set of analyses on a restricted subsample of 340 institutions in our dataset that are not classified as liberal arts institutions, to investigate whether there is a stronger association between LASEO scores and student outcomes at institutions where liberal arts and sciences educational offerings may be a value-added feature or experience that drives better student outcomes.
Findings: Full Sample
While we observe numerous significant associations between LASEO scores and institutional-level student outcomes across all four-year institutions in model 1, the associations are no longer statistically significant after the inclusion of controls in model 2. This means that the statistically significant associations are primarily driven by the different control variables.
For instance, the positive relationship between LASEO scores and institutional graduation rates is largely explained by students’ prior academic achievement. Similarly, the positive relationship between LASEO scores and mid-career earnings of students is explained by parental income. On the other hand, institutional rather than student characteristics account for the positive relationship between LASEO scores and net-price-to earnings ratio. Students who attended private institutions had higher ratios than students who attended public institutions—i.e. they took longer to repay the price of attending college—because of the higher average net price of private institutions.
We also find a negative relationship between LASEO scores and intergenerational income mobility, which is mostly accounted for by two control variables: the share of students who are from an underrepresented minority group and parental income. Separating intergenerational mobility into its two components—access rate and success rate—reveals that the negative relationship between LASEO scores and income mobility is driven by the negative relationship between LASEO scores and access. That is to say, institutions with relatively high LASEO scores tend to enroll relatively low shares of low-income students. On the other hand, we find a significant positive relationship between LASEO scores and an institution’s success rate—i.e. the likelihood that a student whose parents are at the bottom 40 percent of the income distribution moves to the top 40 percent of the income distribution by their early 30s—even after accounting for other relevant factors. In other words, the relatively small shares of low-income students who do attend institutions with relatively high LASEO scores have a greater chance of becoming higher-income adults than their counterparts who attend institutions with relatively low scores. More specifically, with each additional LASEO score point, an institution’s success rate increases, on average, by 0.12 percentage points. This finding suggests that although low-income students tend not to attend institutions with high liberal arts and sciences offerings,[65] those that do tend to have better economic outcomes than low-income students who attend institutions with less liberal educational offerings. It is important to note that our analyses do not allow for causal inferences, and that higher success rates for low-income students at high-scoring institutions could be explained by other factors not captured in our models, such as selection bias (i.e. higher-scoring institutions admit low-income students with the highest chances of economic success).
Lastly, the positive relationship between LASEO scores and loan repayment rates is mostly explained by the institutional shares of students who are from an underrepresented minority group. The negative relationship between loan repayment rates and institutional shares of students who are from an underrepresented minority group is consistent with the findings of several recent studies using student-level data, which found large gaps in loan default rates by race. Specifically, underrepresented minority students, particularly Black students, are significantly more likely to default on their loans than white students, even after controlling for other relevant factors.[66]
Findings: Subsample
Next, we conducted our analyses on the subset of 340 non-liberal arts institutions in our dataset to explore whether liberal arts and sciences educational offerings are a value-added feature or experience at these institutions. Because LASEO index scores are relative, and thus depend on the institutions included in the score calculations, the subsample of 340 institutions received a new set of scores; for a complete list of the institutions and their scores, see the Liberal Arts and Sciences Educational Offering (LASEO) Index Scores Excel file, available at https://sr.ithaka.org/liberal-arts-and-sciences-educational-offering-laseo-index-scores/. Overall, the LASEO index scores for the subsample show similar patterns as in the full sample, both in terms of average total scores and component scores, and private institutions having higher scores than publics. The difference between private institutions and publics, however, is smaller than in the full sample due to the exclusion of institutions with a liberal arts designation, which are predominantly private (93 percent). See Appendix C for detailed descriptive data on the subsample.
Findings from our analyses exploring the relationship between LASEO scores and institution-level student outcomes are largely similar to those of the full sample, whereby the numerous significant associations we observe in the first set of models are no longer statistically significant after the inclusion of controls. We observe one exception, however. Even after accounting for other factors that likely contribute to an institution’s graduation rate, there is a positive association between the LASEO score of an institution not traditionally classified as a liberal arts institution and its graduation rate. Specifically, with each additional LASEO index score point, an institution’s graduation rate increases, on average, by 0.14 percentage points. Interestingly, the positive relationship between LASEO scores and graduation rates of non-liberal arts institutions is strongest among scores for the community component in specific. Each additional point on the community component is associated with a 0.55 percentage point increase in an institution’s graduation rate. One possible explanation is the strong positive relationship between an institution’s community score and educational spending and institutional endowments,[67] which are strongly associated with better student outcomes.[68] An alternative explanation is that institutions with relatively high community scores are able to foster a sense of belonging among a greater share of its students, which contributes to greater rates of persistence and completion.
Similar to findings from the full sample, there is a positive association between an institution’s LASEO score and its success rate—a component of the measure of intergenerational mobility outcome—even after controlling for relevant factors. Specifically, with each additional LASEO index score point, an institution’s success rate increases, on average, by 0.20 percentage points. This finding is 0.08 percentage points greater than the expected increase across all four-year institutions in our sample.
Limitations
There are a number of limitations to this study that are important to note. While the set of LASEO index scores aims to capture how institutions fare relative to each other on a specific set of liberal-arts attributes developed in the context of this project, we cannot say with any certainty that each additional point on the scale represents a meaningful increase in the liberal arts and sciences educational experience offered. Further, scores are based on institution-wide statistics, and do not account for programmatic and curriculum differences by department and college. This limitation is most significant at large public universities that enroll thousands of undergraduates across colleges within the institution that likely offer wide-ranging educational experiences, some more aligned with a liberal arts and sciences education than others. As a result, students who attend the same institution may have vastly different educational experiences. In addition, because the framework is focused on measuring institutional offerings, it does not capture student take-up or participation, thereby potentially diluting the impact of a liberal education on student outcomes.
Finally, the institutions in our sample are not representative of institutions nationally, with private institutions and liberal arts institutions, as defined by their 2000 Carnegie Classification,[69] overrepresented in our sample. In fact, of the 3,864 institutions eligible for the analysis, nearly 57 percent were private institutions and six percent were liberal arts institutions, compared to 70 percent and 25 percent in our sample, respectively. As noted previously, the relatively small sample of institutions with adequate data to measure the pedagogy component was most responsible for the overrepresentation of liberal arts institutions and the removal of two-year institutions from the scores and analysis.
There are several other key differences between the institutions included in our sample of scores and eligible institutions that were not assigned a score. Four-year institutions in our index enroll students with higher SAT scores and from families with higher incomes than eligible four-year institutions, and a larger share of their undergraduate student body is female while a smaller share is from an underrepresented minority group and a smaller share graduate with a degree in engineering. As a result, findings specific to the set of institutions in our sample are not necessarily generalizable to the broader set of four-year institutions in the United States since they don’t share the same average institutional characteristics.
With that said, there may be some benefits to conducting this analysis at the institutional rather than the student level. While a student-level analysis may not suffer from some of the same limitations, selection bias may be more difficult to untangle at the individual student level. Students are not assigned an educational experience; rather, they heavily shape and form their own experience by what they choose to major in, what courses they enroll in, who they interact with, and what activities they participate in and organizations they join. The factors that drive student choice likely also influence their outcomes, making it especially difficult to isolate the relationship between differences in the educational experience of students and their outcomes. An additional benefit of conducting the analysis at the institutional level is that positive findings between institutional offerings and outcomes can more easily inform institutional practices.
Conclusion & Recommendations
In this paper, we presented a novel approach to conceptualizing and measuring a liberal education that is not, a priori, defined by or limited to particular institutions and their members that have come to be synonymous with the liberal arts and sciences. The framework we provide, and its attributes—though difficult to measure—stand to offer valuable and nuanced information on different institutional offerings and students’ experiences with those offerings that could be studied independently to provide additional insights into how the different features of undergraduate education relate to students’ outcomes. For instance, limitations in data availability precluded us from applying our framework to measure the degree to which individual colleges, programs, or departments within institutions, as well as individual students within institutions, offer or experience the different features of a liberal arts and sciences education.
Limitations in data availability also precluded us from applying our approach to a larger set of institutions to better test its value. For example, many of the nation’s large public institutions were missing from our sample, though that is where most students are likely to experience features of a liberal arts education. Community colleges were also missing, though our findings that liberal education offerings may benefit low-income students and students attending institutions that are not formally espoused to the liberal arts make this sector a very important subject of such inquiry. Although many associate community colleges with features that are the antithesis to a liberal education, such as vocational training and a nonresidential student body, the New York City College of Technology (City Tech) offers a compelling example of a community college with strong liberal arts and sciences educational offerings.[70] Founded initially as an institute of Applied Arts & Sciences, it has continued to expand its technological and professional offerings while infusing them with the liberal arts.[71] For example, every City Tech program requires its students to complete its General Education Common Core, which consists of at least one to two courses in English composition, one course in math, and one course in science.[72] It is worth noting that City Tech has a lower-than-typical net price, and one of the highest levels of intergenerational mobility in the country.[73] Future research that improves on and extends our approach can advance both our knowledge of the value of a liberal education as well as that of the educational features students experience and how they may relate to outcomes.
In the initial application of our approach, we measured the degree to which a subset of undergraduate institutions offered their students a liberal arts and sciences educational experience in the early 2000s. We did not find any associations between those offerings, as measured by our LASEO scores, and four primary labor market outcomes of interest. As such, our findings suggest that the degree to which institutions do or do not offer their students a liberal arts and sciences educational experience is neither positively nor negatively associated with their students’ labor market outcomes, as measured in this study. These findings do not support, and may even run counter, to the claim that a liberal arts and sciences education does not prepare students for the twenty-first-century job market, and as a result, its recipients earn less, on average, than those who receive a technology-focused and/or vocational education.
Further countering that argument are the positive associations we observe on a secondary outcome and in our restricted sample. In both the full and restricted sample, we observe a positive relationship between an institution’s LASEO score and a secondary labor market outcome—an institution’s success rate (i.e. the likelihood that a student whose parents are at the bottom 40 percent of the income distribution moves to the top 40 percent of the income distribution by their early 30s). This suggests that liberal arts and sciences educational experiences may provide value-added for low-income students, particularly for those attending colleges that do not automatically offer those experiences by virtue of a liberal arts designation. We also observe a positive association in the restricted sample of non-liberal arts institutions between an institution’s LASEO score and its graduation rate. One hypothesis for these positive findings is the social capital and sense of belonging that students stand to gain from the close and sustained relationships with diverse groups of peers and content-experts that are baked into most aspects of a liberal education. Such relationships may provide significant access to academic and professional opportunities, particularly for underserved students who may not typically experience such capital prior to attending college.[74] They may also foster a sense of belonging among students that contributes to greater rates of persistence and completion. In fact, the community component of our framework, which addresses social relationships and experiences most directly, is most strongly associated with these positive outcomes. This finding, and its potential implications for practice, deserves further investigation.
In the absence of negative associations between a liberal education and long-term labor market outcome, and in light of the potential benefits of a liberal arts and sciences experience for subsets of students or for other non-employment outcomes, based on our findings and those of other colleagues,[75] there is value in continuing to pursue research and practice that furthers our knowledge in this area and supports such educational offerings in the meantime. Follow-up research to this study would benefit from an expanded application of our approach, including to other sectors and more fine-grained data as described above. It would also benefit from qualitative research that delves both into mechanisms for impact, and institutional conditions and practices. More specifically, researchers should examine the potential mechanisms by which liberal arts and sciences educational experiences may provide low-income students with beneficial information or skills, including the potential value-added of the community component and its specific attributes.
Researchers should also explore and analyze the institutional conditions and practices that influence those educational offerings and their take-up by students, and how they can be made more widely available to students who may stand to benefit the most. Among institutions with strong liberal arts and sciences offerings, some standout in their characteristics and practices. For example, Wesleyan College, a private liberal arts women’s college located in Georgia, received one of the 20 highest LASEO index scores in our study while being racially diverse and having one of the lowest average net prices of any private institution in the sample. It also offers several programs and initiatives aimed at helping students combine the skills they learn through a liberal education and prepare for a career, including a partnership between the college and the business community.[76] The University of Minnesota, Morris demonstrates that a liberal education is not exclusive to the private, elite non-profit schools with which such an education is usually associated. With one of the 35 highest index scores in our dataset, and second highest among public institutions, what began as an agricultural school in the Minnesotan prairie evolved into an affordable, residential, public liberal arts college with an emphasis on student-faculty collaboration and service to one’s community.[77] Morris is also unique in that American Indian students compose over ten percent of the student body, representing more than 57 federally recognized American Indian tribes and Canadian First Nations.[78]
Lastly, qualitative and mixed methods research can shed light on how institutions may offer some of the key attributes of a liberal arts and sciences educational experience, especially those in the community component, in a virtual context following the shift to online learning in the wake of the COVID-19 pandemic. While fully-online learning may not remain the modus operandi in the long-term, such research is highly relevant for partially-online learning as well as nonresidential students, who often have competing demands and may stand to benefit the most from the potential value-added of a liberal arts and sciences educational experience.
Appendix A: LASEO Framework Attributes and Metrics
Under each component of the LASEO Framework is a list of the attributes that describe its features. The corresponding institution-level proxy metrics used to capture the extent to which institutions offered the attributes are sub-bulleted. For additional details on how each metric was scored and weighted, and other calculation details, see the Liberal Arts and Sciences Educational Offering (LASEO) Framework Excel file, available at https://sr.ithaka.org/liberal-arts-and-sciences-educational-offering-laseo-framework/.
Pedagogy
Attribute: Instruction by committed and invested faculty with content expertise
- Share of full-time undergraduate faculty who are teaching-focused and have a doctoral degree in the same general discipline as the department of their current faculty appointment
Attribute: Instruction using teaching practices that foster active learning, in classroom settings that facilitate such learning
- Share of undergraduate class sections with fewer than 20 students
- Average class section size
- Average share of points earned by teaching-focused full-time undergraduate faculty based on engaged learning practices used in their classes
Attribute: Deep engagement with instructors outside the classroom
- Average number of hours per week that teaching-focused full-time undergraduate faculty spend advising and counseling students
Curriculum
Attribute: Exposure to multiple disciplines (breadth)
- A score based on whether an institution has a 1) core curriculum or university-wide distribution requirements that must be satisfied in order to graduate; 2) foreign language requirement for all students; and 3) math/science requirement for all students[79]
Attribute: Learning experiences in the curriculum that require deep and sustained engagement in particular disciplines (depth)
- A score based on whether an institution requires a 1) senior project for all students; and 2) senior project for students in some majors[80]
Attribute: Exposure to coursework and programs of study in the liberal arts and sciences (breadth and depth in the liberal arts and sciences)
- Share of majors that are in the liberal arts and sciences[81]
Attribute: Student-guided/signature approaches to the curriculum
- A score based on whether an institution offers 1) student-designed majors; and 2) independent study
Community
Attribute: Sustained social interactions amongst diverse sets of peers
- Share of undergraduates that undergraduate housing is designed to accommodate
- A diversity index that accounts for institutional diversity in race, income, gender, and age based on students’ demographic characteristics
Attribute: Experiences that offer knowledge and skills beyond direct course of study
- A score based on whether an institution offers 1) its own study abroad program; 2) cooperative (work-study) program or internships; 3) off-campus study (i.e. consortia, exchange programs); and 4) Army, Navy, or Air Force ROTC branch unit to join
Attribute: Diverse array of extracurricular activities
- Number of student organizations and groups with open membership per 100 students
Appendix B: Results Tables – Full Sample
Table 5: Regression Results of Six-Year Graduation Rates on LASEO Index Scores – Full Sample
| VARIABLES | Model 1 | Model 2 |
|---|---|---|
| LASEO index score | 0.71*** (0.05) | 0.06 (0.04) |
| Public | -6.83*** (1.11) |
|
| SAT score | 0.07*** (0.01) |
|
| Parental median income | 0.00*** (0.00) |
|
| Education and related expenses per FTE | -0.00 (0.00) |
|
| Share of undergrads who are female | 0.10*** (0.03) |
|
| Share of undergrads who are URM | -0.12*** (0.04) |
|
| Share of degrees in engineering | 0.13** (0.06) |
|
| Constant | 15.29*** (0.05) | -28.45*** (5.48) |
| Observations | 454 | 377 |
| Note: Robust standard errors in parentheses. *** p<0.01, ** p<0.05, * p<0.10 | ||
Table 6: Regression Results of Mid-Career Earnings on LASEO Index Scores – Full Sample
| VARIABLES | Model 1 | Model 2 |
|---|---|---|
| LASEO index score | 240.03*** (37.83) | 2.33 (58.35) |
| Public | -1576.87* (853.10) |
|
| SAT score | 3.12 (6.03) |
|
| Parental median income | 0.21*** (0.03) |
|
| Education and related expenses per FTE | 0.07 (0.10) |
|
| Share of undergrads who are female | -76.99** (32.45) |
|
| Share of undergrads who are URM | 88.48*** (30.36) |
|
| Share of degrees in engineering | 459.42*** (93.60) |
|
| Constant | 30598.74*** (2447.32) | 23587.16*** (5695.31) |
| Observations | 404 | 377 |
| R-squared | 0.08 | 0.49 |
| Note: Robust standard errors in parentheses. *** p<0.01, ** p<0.05, * p<0.10 | ||
Table 7: Regression Results of Net-Price-to-Earnings Ratio on LASEO Index Scores – Full Sample
| VARIABLES | Model 1 | Model 2 |
|---|---|---|
| LASEO index score | 0.01*** (0.00) | -0.00 (0.00) |
| Public | -0.75*** (0.04) |
|
| SAT score | -0.00 (0.00) |
|
| Parental median income | -0.00 (0.00) |
|
| Education and related expenses per FTE | 0.00 (0.00) |
|
| Share of undergrads who are female | 0.00** (0.00) |
|
| Share of undergrads who are URM | -0.01*** (0.00) |
|
| Share of degrees in engineering | -0.01* (0.00) |
|
| Constant | 0.96*** (0.15) | 2.00*** (0.34) |
| Observations | 404 | 377 |
| R-squared | 0.06 | 0.44 |
| Note: Robust standard errors in parentheses. *** p<0.01, ** p<0.05, * p<0.10 | ||
Table 8: Regression Results of Intergenerational Income Mobility Rates on LASEO Index Scores – Full Sample
| VARIABLES | Model 1 | Model 2 |
|---|---|---|
| LASEO index score | -0.09*** (14.90) | 0.01 (0.01) |
| Public | 0.51 (0.34) |
|
| SAT score | -0.00* (0.00) |
|
| Parental median income | -0.00*** (0.00) |
|
| Education and related expenses per FTE | 0.00*** (0.00) |
|
| Share of undergrads who are female | -0.01 (0.01) |
|
| Share of undergrads who are URM | 0.16*** (0.02) |
|
| Share of degrees in engineering | 0.02 (0.02) |
|
| Constant | 14.90*** (0.83) | 16.97*** (1.68) |
| Observations | 404 | 377 |
| R-squared | 0.08 | 0.69 |
| Note: Robust standard errors in parentheses. *** p<0.01, ** p<0.05, * p<0.10 | ||
Table 9: Regression Results of Seven-Year Loan Repayment Rates on LASEO Index Scores – Full Sample
Table 10: Regression Results of Access Rates on LASEO Index Scores – Full Sample
| VARIABLES | Model 1 | Model 2 |
|---|---|---|
| LASEO index score | -0.25*** (0.03) | -0.02 (0.02) |
| Public | 0.77 (0.49) |
|
| SAT score | -0.01** (0.00) |
|
| Parental median income | -0.00*** (0.00) |
|
| Education and related expenses per FTE | 0.00*** (0.00) |
|
| Share of undergrads who are female | -0.04** (0.01) |
|
| Share of undergrads who are URM | 0.29*** (0.03) |
|
| Share of degrees in engineering | -0.06** (0.02) |
|
| Constant | 33.30*** (1.69) | 41.01*** (2.79) |
| Observations | 404 | 377 |
| R-squared | 0.14 | 0.82 |
| Note: Robust standard errors in parentheses. *** p<0.01, ** p<0.05, * p<0.10 | ||
Table 11: Regression Results of Success Rates on LASEO Index Scores – Full Sample
| VARIABLES | Model 1 | Model 2 |
|---|---|---|
| LASEO index score | 0.29*** (0.04) | 0.12** (0.05) |
| Public | -0.12 (1.10) |
|
| SAT score | 0.01 (0.01) |
|
| Parental median income | 0.00*** (0.00) |
|
| Education and related expenses per FTE | -0.00 (0.00) |
|
| Share of undergrads who are female | -0.04 (0.05) |
|
| Share of undergrads who are URM | 0.08** (0.04) |
|
| Share of degrees in engineering | 0.33*** (0.09) |
|
| Constant | 37.75*** (2.38) | 28.56*** (6.89) |
| Observations | 404 | 377 |
| R-squared | 0.12 | 0.33 |
| Note: Robust standard errors in parentheses. *** p<0.01, ** p<0.05, * p<0.10 | ||
Appendix C: Descriptive Data – Subsample
Below are descriptive data for the subsample of non-liberal arts and sciences institutions, as defined by their 2000 Carnegie Classification.
Table 12. Descriptive Data on LASEO Index Scores – Subsample
| n | Mean | SD | Min | Max | |
|---|---|---|---|---|---|
| LASEO index score | 340 | 60.69 | 10.81 | 22.84 | 88.78 |
| Pedagogy score (out of 40 points) | 340 | 19.96 | 6.19 | 2.56 | 36.21 |
| Curriculum score (out of 35 points) | 340 | 24.10 | 4.51 | 4.85 | 34.44 |
| Community score (out of 25 points) | 340 | 16.64 | 3.06 | 6.88 | 23.14 |
Table 13. Descriptive Data on LASEO Index Scores, by Institutional Type – Subsample
| n | Mean | SD | Min | Max | |
|---|---|---|---|---|---|
| Subsample | 340 | 60.69 | 10.81 | 22.84 | 88.78 |
| Private institutions | 212 | 63.52 | 10.34 | 29.63 | 87.89 |
| Public institutions | 128 | 56.01 | 9.93 | 22.84 | 88.78 |
Table 14. Descriptive Data on Outcome Variables – Subsample
| Outcome Variable | n | Mean | SD | Min | Max |
|---|---|---|---|---|---|
| Six-year graduation rate | 340 | 54.90% | 15.40% | 8.33% | 95.48% |
| Mid-career earnings | 297 | $44,527 | $10,604 | $22,600 | $102,700 |
| Net-price-to-earnings ratio | 297 | 1.54 | 0.52 | 0.18 | 4.02 |
| Intergenerational income mobility rate | 297 | 10.19% | 4.02% | 3.34% | 29.10% |
| Seven-year loan repayment rate | 320 | 81.83% | 8.23% | 39.15% | 97.16% |
Table 15. Descriptive Data on Control Variables and Correlations with LASEO Index Scores – Subsample
| Control Variable | n | Mean | SD | Min | Max | r* |
|---|---|---|---|---|---|---|
| SAT score | 308 | 948.72 | 103.91 | 610 | 1400 | 0.26 |
| Parental median income | 297 | $92,551 | $22,576 | $37,500 | $191,500 | 0.30 |
| Education and related spending | 339 | $13,381 | $6,844 | $5,094 | $80,496 | 0.31 |
| Share female | 340 | 59.90% | 10.75% | 15.08% | 99.87% | 0.16 |
| Share URM | 340 | 14.15% | 13.79% | 0.36% | 92.84% | -0.09 |
| Share of degrees in engineering | 340 | 2.74% | 7.15% | 0% | 68.49% | -0.13 |
| * All p-values are < 0.01, except for the correlation between LASEO scores and share URM, which has a p-value of 0.09, and the correlation between LASEO scores and share of degrees in engineering, which has a p-value of 0.01. | ||||||
Appendix D: Results Tables – Subsample
Table 16: Regression Results of Six-Year Graduation Rates on LASEO Index Scores – Subsample
| VARIABLES | Model 1 | Model 2 |
|---|---|---|
| LASEO index score | 0.59*** (0.07) | 0.14** (0.06) |
| Public | -6.05*** (1.16) |
|
| SAT score | 0.07*** (0.01) |
|
| Parental median income | 0.00*** (0.00) |
|
| Education and related expenses per FTE | -0.00 (0.00) |
|
| Share of undergrads who are female | 0.12** (0.05) |
|
| Share of undergrads who are URM | -0.07* (0.04) |
|
| Share of degrees in engineering | 0.10 (0.07) |
|
| Constant | 19.10*** (4.65) | -40.19*** (7.83) |
| Observations | 340 | 271 |
| R-squared | 0.17 | 0.74 |
| Note: Robust standard errors in parentheses. *** p<0.01, ** p<0.05, * p<0.10 | ||
Table 17: Regression Results of Mid-Career Earnings on LASEO Index Scores – Subsample
| VARIABLES | Model 1 | Model 2 |
|---|---|---|
| LASEO index score | 281.06*** (51.76) | 90.23 (61.50) |
| Public | 25.79 (1050.28) |
|
| SAT score | 14.25** (7.19) |
|
| Parental median income | 0.21*** (0.04) |
|
| Education and related expenses per FTE | 0.27 (0.20) |
|
| Share of undergrads who are female | -52.03 (65.95) |
|
| Share of undergrads who are URM | 115.13*** (33.92) |
|
| Share of degrees in engineering | 344.14*** (86.70) |
|
| Constant | 27299.94*** (3244.85) | 3170.05 (6726.50) |
| Observations | 297 | 271 |
| R-squared | 0.08 | 0.54 |
| Note: Robust standard errors in parentheses. *** p<0.01, ** p<0.05, * p<0.10 | ||
Table 18: Regression Results of Net-Price-to-Earnings Ratio on LASEO Index Scores – Subsample
| VARIABLES | Model 1 | Model 2 |
|---|---|---|
| LASEO index score | 0.01* (0.00) | -0.01 (0.00) |
| Public | -0.76*** (0.05) |
|
| SAT score | -0.00 (0.00) |
|
| Parental median income | 0.00 (0.00) |
|
| Education and related expenses per FTE | 0.00 (0.00) |
|
| Share of undergrads who are female | 0.00 (0.00) |
|
| Share of undergrads who are URM | -0.01*** (0.00) |
|
| Share of degrees in engineering | -0.01* (0.00) |
|
| Constant | 1.12*** (0.23) | 2.65*** (0.47) |
| Observations | 297 | 271 |
| R-squared | 0.02 | 0.49 |
| Note: Robust standard errors in parentheses. *** p<0.01, ** p<0.05, * p<0.10 | ||
Table 19: Regression Results of Intergenerational Income Mobility Rates on LASEO Index Scores – Subsample
| VARIABLES | Model 1 | Model 2 |
|---|---|---|
| LASEO index score | -0.04* (0.02) | 0.02 (0.02) |
| Public | 0.74** (0.37) |
|
| SAT score | 0.00 (0.00) |
|
| Parental median income | -0.00*** (0.00) |
|
| Education and related expenses per FTE | 0.00*** (0.00) |
|
| Share of undergrads who are female | 0.00 (0.02) |
|
| Share of undergrads who are URM | 0.15*** (0.02) |
|
| Share of degrees in engineering | 0.02 (0.02) |
|
| Constant | 12.66*** (1.26) | 14.05*** (2.51) |
| Observations | 297 | 271 |
| R-squared | 0.01 | 0.68 |
| Note: Robust standard errors in parentheses. *** p<0.01, ** p<0.05, * p<0.10 | ||
Table 20: Regression Results of Seven-Year Loan Repayment Rates on LASEO Index Scores – Subsample
| VARIABLES | Model 1 | Model 2 |
|---|---|---|
| LASEO index score | 0.26*** (0.04) | 0.06* (0.04) |
| Public | -1.96*** (0.76) |
|
| SAT score | 0.02*** (0.00) |
|
| Parental median income | 0.00*** (0.00) |
|
| Education and related expenses per FTE | 0.00 (0.00) |
|
| Share of undergrads who are female | 0.03 (0.03) |
|
| Share of undergrads who are URM | -0.26*** (0.04) |
|
| Share of degrees in engineering | 0.03 (0.04) |
|
| Constant | 65.84*** (2.77) | 52.74*** (5.80) |
| Observations | 320 | 255 |
| R-squared | 0.12 | 0.64 |
| Note: Robust standard errors in parentheses. *** p<0.01, ** p<0.05, * p<0.10 | ||
Table 21: Regression Results of Access Rates on LASEO Index Scores – Subsample
| VARIABLES | Model 1 | Model 2 |
|---|---|---|
| LASEO index score | -0.19*** (0.04) | -0.03 (0.02) |
| Public | 0.71 (0.49) |
|
| SAT score | -0.00 (0.00) |
|
| Parental median income | -0.00*** (0.00) |
|
| Education and related expenses per FTE | 0.00*** (0.00) |
|
| Share of undergrads who are female | -0.03 (0.02) |
|
| Share of undergrads who are URM | 0.27*** (0.03) |
|
| Share of degrees in engineering | -0.05** (0.02) |
|
| Constant | 31.22*** (2.53) | 43.01*** (3.58) |
| Observations | 297 | 271 |
| R-squared | 0.06 | 0.84 |
| Note: Robust standard errors in parentheses. *** p<0.01, ** p<0.05, * p<0.10 | ||
Table 22: Regression Results of Success Rates on LASEO Index Scores – Subsample
| VARIABLES | Model 1 | Model 2 |
|---|---|---|
| LASEO index score | 0.36*** (0.05) | 0.20*** (0.06) |
| Public | 1.60 (1.20) |
|
| SAT score | 0.01 (0.01) |
|
| Parental median income | 0.00*** (0.00) |
|
| Education and related expenses per FTE | 0.00 (0.00) |
|
| Share of undergrads who are female | -0.00 (0.08) |
|
| Share of undergrads who are URM | 0.13*** (0.04) |
|
| Share of degrees in engineering | 0.26*** (0.09) |
|
| Constant | 32.75*** (3.27) | 7.74 (8.87) |
| Observations | 297 | 271 |
| R-squared | 0.13 | 0.42 |
| Note: Robust standard errors in parentheses. *** p<0.01, ** p<0.05, * p<0.10 | ||
Endnotes
- Norman Jones, “The Continuous Death and Resurrection of the Liberal Arts,” Liberal Education 101.4 (2016), AAC&U, aacu.org/liberaleducation/2015-2016/fall-winter/jones. ↑
- Raymond J Gray, “The Passing of the Liberal College,” The North American Review 229.5 (1930): 614-18, JSTOR, jstor.org/stable/25113552; George Barton Cutten, “The Future of the American Liberal-Arts College,” The Journal of Higher Education 10.2 (1939): 59-67, JSTOR, jstor.org/stable/1974718. ↑
- Raymond F. Zammuto, “Are the Liberal Arts an Endangered Species?” The Journal of Higher Education 55.2 (1984): 184-211, JSTOR, jstor.org/stable/1981185; M. Garrett Bauman, “Liberal Arts for the Twenty-First Century,” The Journal of Higher Education 58. 1 (1987): 38-45, JSTOR, jstor.org/stable/1981389. ↑
- Ian Wilhelm, “Remaking the Liberal Arts,” The Chronicle of Higher Education, Nov. 22, 2016, chronicle.com/article/Remaking-the-Liberal-Arts-/238306; Andrew J. Coulson, “Liberating the Liberal Arts—and Making Higher Education Affordable,” Aug. 31, 2012, Cato Institute, cato.org/blog/liberating-liberal-arts-making-higher-education-affordable; Tim Worstall, “Should We Abolish Liberal Arts Degrees? Quite Possibly, Yes,” Forbes, Sep 1, 2012, forbes.com/sites/timworstall/2012/09/01/should-we-abolish-liberal-arts-degrees-quite-possibly-yes/ – 4d492c926086; Adam Harris, “The Liberal Arts May Not Survive the 21st Century,” The Atlantic, Dec.13, 2018, theatlantic.com/education/archive/2018/12/the-liberal-arts-may-not-survive-the-21st-century/577876/. ↑
- Richard Vedder, “Why The Coronavirus Will Kill 500-1,000 Colleges,” Forbes, Apr. 7, 2020, forbes.com/sites/richardvedder/2020/04/07/500-1000-colleges-to-disappear-survival-of-the-fittest. ↑
- Hechinger Report, “Making the Case for Liberal Arts,” US News & World Report, May 17, 2018, usnews.com/news/education-news/articles/2018-05-17/liberal-arts-programs-struggle-to-make-a-case-for-themselves; Elisabeth Zinser, “Making the Case for Liberal Education,” Liberal Education 90.1 (2004), AAC&U, aacu.org/publications-research/periodicals/making-case-liberal-education. ↑
- Michael McPherson and Mariët Westermann, “The Outcomes of a Liberal Arts Education: State of Research,” The Andrew W. Mellon Foundation, 2019, mellon.org/research/outcomes-liberal-arts-education/. ↑
- Catharine B. Hill and Elizabeth Davidson Pisacreta, “The Economic Benefits and Costs of a Liberal Arts Education,” The Andrew W. Mellon Foundation, Jan. 2019, mellon.org/news-blog/articles/economic-benefits-and-costs-liberal-arts-education/. ↑
- Victor E. Ferrall, “Liberal Arts Colleges and Why We Should Care about Them,” Liberal Arts at the Brink, Cambridge: Harvard UP, 2011: 7-22, JSTOR, jstor.org/stable/j.ctt24hhk8.5. ↑
- “What Liberal Education Looks Like: What It Is, Who It’s For, and Where It Happens,” AAC&U, 2020, portal.criticalimpact.com/user/25043/image/whatlibedlookslike.pdf. ↑
- Benjamin Schmidt, “The Humanities Are in Crisis,” Aug. 23, 2018, The Atlantic, theatlantic.com/ideas/archive/2018/08/the-humanities-face-a-crisisof-confidence/567565/. ↑
- Robert A. McCaughey, “Still Here: Change and Persistence in the Place of the Liberal Arts in American Higher Education,” Jan. 2019, The Andrew W. Mellon Foundation, mellon.org/news-blog/articles/still-here-change-and-persistence-place-liberal-arts-american-higher-education/. ↑
- This calculation was made using IPEDS data tracking bachelor’s degrees conferred between 1985 and 2018. Though the fields of study reported do not perfectly align to the CIP codes used in our analysis, they do map to the disciplines we are defining as liberal arts and sciences. Institute of Education Sciences, “Table 322.10,” Digest of Education Statistics, 2019, nces.ed.gov/programs/digest/d19/tables/dt19_322.10.asp?current=yes. ↑
- Theo Pippins et al., “Humanities and Liberal Arts Education Across America’s Colleges,” CCRC, Jun. 20, 2019, ccrc.tc.columbia.edu/media/k2/attachments/humanities-liberal-arts-education-how-much.pdf. ↑
- This calculation was made using IPEDS data tracking associate degrees conferred between 1980 to 2017. Institute of Education Sciences, “Table 252,”Digest of Education Statistics, 2001, nces.ed.gov/programs/digest/d01/dt252.asp; Institute of Education Sciences, “Table 294,”Digest of Education Statistics, 2010, nces.ed.gov/programs/digest/d10/tables/dt10_294.asp; Institute of Education Sciences, “Table 321.30,”Digest of Education Statistics, 2019, nces.ed.gov/programs/digest/d19/tables/dt19_321.30.asp. ↑
- According to the most recent IPEDS figures (2016-2017). https://nces.ed.gov/programs/digest/d19/tables/dt19_321.30.asp. ↑
- Bruce A. Kimball, “Revising the Declension Narrative: Liberal Arts Colleges, Universities, and Honors Programs, 1870s-2010s,” Harvard Educational Review 84.2 (2014): 243-64. ↑
- Eugene M. Tobin, “The Future of Liberal Arts Colleges Begins with Collaboration,” Remaking College: Innovation and the Liberal Arts, Ed. Rebecca Chopp et al., Baltimore: Johns Hopkins UP, 2013: 125-34. ↑
- David W. Breneman, Liberal Arts Colleges: Thriving, Surviving, or Endangered? Washington: Brookings Institution Press, 1994; Vicki L. Baker et al., “Where Are They Now? Revisiting Breneman’s Study of Liberal Arts Colleges,” Liberal Education 98.3 (2012), AAC&U, aacu.org/publications-research/periodicals/where-are-they-now-revisiting-brenemans-study-liberal-arts. ↑
- Bruce A. Kimball, “Revising the Declension Narrative: Liberal Arts Colleges, Universities, and Honors Programs, 1870s-2010s,” Harvard Educational Review 84.2 (2014): 243-64. ↑
- Ibid. ↑
- Richard I. Scott and Patricia J. Smith, “Demography of Honors: The National Landscape of Honors Education,” Journal of the National Collegiate Honors Council, 17.1 (2016): 73-91, ERIC, eric.ed.gov/?id=EJ1104389. ↑
- The Demonstrable Value of Honors Education: New Research Evidence, Ed. Andrew J. Cognard-Black et al., Lincoln: National Collegiate Honors Council, 2019, University of Nebraska—Lincoln, digitalcommons.unl.edu/nchcmono/34/. ↑
- Michelle R. Weise et al., “Robot-Ready: Human + Skills For the Future of Work,” Strada Education Network, Jan. 16, 2019, https://www.stradaeducation.org/report/robot-ready/. ↑
- “Joint Statement on the Value of Liberal Education by AAC&U and AAUP,” AAC&U, May 31, 2018, aacu.org/about/statements/2018/joint-statement-value-liberal-education-aacu-and-aaup. ↑
- Jaison R. Abel, Richard Deitz, and Yaqin Su, “Are Recent College Graduates Finding Good Jobs?,” Federal Reserve Bank of New York, 2014, https://www.newyorkfed.org/medialibrary/media/research/current_issues/ci20-1.pdf. ↑
- Michelle R. Weise et al., “Robot-Ready: Human + Skills For the Future of Work,” Strada Education Network, Jan. 16, 2019, https://www.stradaeducation.org/report/robot-ready/. ↑
- Jaison R. Abel, Richard Deitz, “Underemployment in the Early Careers of College Graduates Following the Great Recession,” National Bureau of Economic Research, September 2016, https://www.nber.org/papers/w22654.pdf. ↑
- Michelle R. Weise et al., “Robot-Ready: Human + Skills For the Future of Work,” Strada Education Network, Jan. 16, 2019, https://www.stradaeducation.org/report/robot-ready/. ↑
- Debra Humphreys, Patrick Kelly, “How Liberal Arts and Sciences Majors Fare in Employment,” Association of American Colleges and Universities, 2014, https://www.mass.edu/foradmin/trustees/documents/HowLiberalArtsandSciencesMajorFareinEmployment.pdf. ↑
- Diane Whitmore Schanzenbach, Ryan Nunn, and Greg Nantz, “Putting your major to work: Career paths after college,” Brookings, May 11, 2017, https://www.brookings.edu/research/putting-your-major-to-work-career-paths-after-college/. ↑
- Brad Hershbein, Melissa S. Kearney, “Major Decisions: What Graduates Earn over Their Lifetimes,” The Hamilton Project, Sep. 29, 2014, https://www.hamiltonproject.org/papers/major_decisions_what_graduates_earn_over_their_lifetimes. ↑
- “The State of Humanities 2018: Graduates in the Workforce & Beyond,” American Academy of Arts & Sciences, 2018, https://www.amacad.org/sites/default/files/publication/downloads/HI_Workforce-2018.pdf. ↑
- Michelle R. Weise et al., “Robot-Ready: Human + Skills For the Future of Work,” Strada Education Network, Jan. 16, 2019, https://www.stradaeducation.org/report/robot-ready/. ↑
- Catharine B. Hill and Elizabeth Davidson Pisacreta, “The Economic Benefits and Costs of a Liberal Arts Education,” The Andrew W. Mellon Foundation, Jan. 2019, mellon.org/news-blog/articles/economic-benefits-and-costs-liberal-arts-education/. ↑
- Anthony P. Carnevale, “ROI of Liberal Arts Colleges,” Georgetown University Center on Education and the Workforce, Jan. 2020, 1gyhoq479ufd3yna29x7ubjn-wpengine.netdna-ssl.com/wp-content/uploads/Liberal-Arts-ROI.pdf. ↑
- Catharine B. Hill and Elizabeth Davidson Pisacreta, “The Economic Benefits and Costs of a Liberal Arts Education,” The Andrew W. Mellon Foundation, Jan. 2019, mellon.org/news-blog/articles/economic-benefits-and-costs-liberal-arts-education/. ↑
- At the outset of the project, we also aimed to apply our present framework and approach to study individual students’ exposure to the particular features of a liberal arts and sciences educational experience, and its association with their long-term economic outcomes. Unfortunately, we were unable to complete this phase due to significant challenges in identifying and securing a dataset that provides both adequate information on students’ educational experiences to measure the degree to which they experienced a liberal arts and sciences education as outlined in our framework, as well as longitudinal labor market outcomes of those students. Additionally, the COVID-19 pandemic disrupted our plans to overcome those challenges. The pandemic shifted institutions’ priorities and made it even more challenging to acquire data through new partnerships. Additionally, we were unable to conduct an abridged version of the planned analysis using restricted-use student-level data from the 2004 Beginning Postsecondary Students (BPS) Longitudinal Study, as it became physically inaccessible once “safer at home” requirements were in place. ↑
- “Advocacy for Liberal Education,” Association of American Colleges and Universities, https://www.aacu.org/advocacy-liberal-education-0. ↑
- See for example the following resources (as well as those cited in the “Liberal Education’s Fraught Public Perception” section of this report): Harry Brighouse, “How Can We Understand ‘Liberal Arts Education?’” The Andrew W. Mellon Foundation, Jan. 2019, mellon.org/news-blog/articles/how-can-we-understand-liberal-arts-education/; Liberal Arts Colleges in American Higher Education: Challenges and Opportunities, ACLS Occasional Paper 59 (2005), American Council of Learned Societies, acls.org/uploadedfiles/publications/op/59_liberal_arts_colleges.pdf; and Michael S. Roth, Beyond the University: Why Liberal Education Matters, New Haven: Yale UP, 2014. ↑
- We want to thank the following four individuals for providing valuable feedback on a complete draft of the LASEO Framework in September 2019 (the first three are engaged in similar projects on the value of the liberal arts also funded by the Mellon Foundation): Peter Bearman, Director of the Interdisciplinary Center for Innovative Theory and Empirics (INCITE) and Jonathan R. Cole Professor of Sociology, Columbia University; Benjamin Koester, Learning Analytics Research Specialist Senior, University of Michigan; Timothy McKay, Arthur F. Thurnau Professor of Physics, Astronomy, Education, and Associate Dean for Undergraduate Education, University of Michigan; and Carol Geary Schneider, president emerita of the Association of American Colleges and Universities (AAC&U). ↑
- Victor E Ferrall, “Liberal Arts at the Brink.” Harvard University Press (2011). ↑
- Ibid. ↑
- Ibid. ↑
- Ibid. ↑
- “Higher Education Roundtable of liberal arts college presidents,” Pew Charitable Trusts, Policy Perspectives 5, no. 4 (January 1995): 2A. ↑
- Harry Brighouse, “How Can We Understand ‘Liberal Arts Education’?,” Jan. 8, 2019, https://mellon.org/resources/news/articles/how-can-we-understand-liberal-arts-education/. ↑
- In cases in which the same institution responded to both surveys, we used responses from the 2004-05 survey. ↑
- Annual Survey of Colleges 2004. Copyright © 2004 The College Board. ↑
- Peterson’s Undergraduate Database copyright 2004 Peterson’s. All rights reserved. ↑
- Using IPEDS full-time faculty surveys from the early 2000s, we tallied the number of full-time faculty at each institution that shared the following gender and faculty rank characteristics: male professor; female professor; male associate professor; female associate professor; male assistant professor; female assistant professor; male instructor, lecturer, or other; female instructor, lecturer, or other. All faculty with the same gender and faculty rank were assigned a weight equal to the ratio of the total number of full-time faculty of that gender and rank at a given institution to the number of full-time undergraduate faculty of that gender and rank who responded to the HERI survey. For example, if institution A, according to IPEDS, had ten male full professors, and five male full professors responded to the survey, then all 5 male full professors were assigned a faculty weight of two (10/5). ↑
- For a small number of institutions, the faculty participation rate was greater than 100 percent, meaning that the number of full-time undergraduate faculty surveyed by HERI in a given year was greater than the number of full-time faculty according to IPEDS. Minor discrepancies between the two sources are possible given that the surveys were administered at different times. However, we excluded institutions where 150 percent or more of their full-time undergraduate faculty participated because of concerns about data accuracy. ↑
- Metric values were ordered, ranked, and assigned a point total that reflects the fraction of values at or below their value by using the following formula, referred to as Hazen’s rule: (rank of metric value – 0.5) / (# of institutions with non-missing value for metric). The result was then multiplied by the weight of the metric to calculate an institution’s score on that metric. ↑
- Institutions that ceased to exist by 2005 were also excluded. ↑
- For example, an institution missing ten points that received a score of 81 out of the 90 non-missing points (90 percent) was assigned 9 out of a possible ten additional points, making their total index score 90. ↑
- As defined by their 2000 Carnegie Classification. ↑
- The first three years that net price data were collected by IPEDS. ↑
- Parts of the methodology used to calculate this metric were inspired by a Third Way report on a new approach to estimating the return on investment of attending college. See Michael Itzkowitz, “Price-to-Earnings Premium: A New Way of Measuring Return on Investment in Higher Ed,” Third Way, April 1, 2020, www.thirdway.org/report/price-to-earnings-premium-a-new-way-of-measuring-return-on-investment-in-higher-ed. This metric is not adjusted for inflation. ↑
- The original research conducted by Opportunity Insights defined low-income as the bottom quintile (bottom 20 percent) of the income distribution and high-income as the top quintile (top 20 percent). See Raj Chetty et. al., “Mobility Report Cards: The Role of Colleges in Intergenerational Mobility,” Opportunity Insights, December 2017, https://opportunityinsights.org/paper/mobilityreportcards/. ↑
- We collected multiple years of data on incoming students’ SAT scores because a large number of institutions were missing data in a single year. ↑
- For more information on how this metric is calculated, see “Issue Brief #2: Metrics for Improving Cost Accountability,” Delta Project, February 2009, https://deltacostproject.org/sites/default/files/products/issuebrief_02.pdf. ↑
- Students identified in IPEDS as being nonresident aliens or having an unknown race/ethnicity were included in the denominator. ↑
- We excluded degrees awarded for a student’s second major and included only degrees awarded for a student’s first major. ↑
- Specifically, IPEDS data are reported at the UnitID, which is the unit of analysis we used to construct index scores for institutions. Opportunity Insights data, on the other hand, are reported at the super-OPEID level based on how institutions appear on tax records, which are aggregated beyond UnitIDs for a subset of institutions. As such, a single super-OPEID may include multiple UnitIDs. The 22 institutions that received an index score and share a super-OPEID with institutions that did not receive a score were dropped from models involving Opportunity Insights variables because that data are based partly on the outcomes of students who attended institutions that were not assessed for their liberal arts-ness. Because the College Scorecard reports data at the OPEID level, 22 institutions that received an index score and share an OPEID were excluded from analyses of loan repayment rates. For more information, see Robert Kelchen, “Beware OPEIDs and Super OPEIDs,” August 21, 2017, https://robertkelchen.com/2017/08/21/beware-opeids-and-super-opeids/. ↑
- There is a moderately strong negative relationship between an institution’s LASEO score and access rate (r=-0.38, n=404, p<0.0001). ↑
- See Judith Scott-Clayton, “What accounts for gaps in student loan default, and what happens after,” Brookings, June 21, 2018, https://www.brookings.edu/research/what-accounts-for-gaps-in-student-loan-default-and-what-happens-after/; Ben Miller, “New Federal Data Show a Student Loan Crisis for African American Borrowers, Center for American Progress, Oct. 16, 2017, https://www.americanprogress.org/issues/education-postsecondary/news/2017/10/16/440711/new-federal-data-show-student-loan-crisis-african-american-borrowers/; Robert Kelchen, “Examining Long-Term Student Loan Default Rates by Race and Ethnicity,” Feb. 13, 2018, https://robertkelchen.com/2018/02/13/examining-long-term-student-loan-default-rates-by-race-and-ethnicity/. ↑
- The moderately positive relationship between an institution’s LASEO score and educational spending (as noted in Table 4) is strongest among scores for the community component. ↑
- For example, research conducted by Opportunity Insights on intergenerational income mobility found a strong positive association between an institution’s success rate and institutional expenditure and large endowments. ↑
- The 2000 Carnegie Classification is the last edition to use liberal arts baccalaureate colleges as an institutional categorization. ↑
- Due to data limitations, City Tech was not in our final sample for this study. ↑
- “About City Tech | Our History,” New York City College of Technology, http://www.citytech.cuny.edu/about-us/history.aspx. ↑
- “Academic Advising,” New York City College of Technology, http://www.citytech.cuny.edu/advisement/gen-ed.aspx. ↑
- Raj Chetty et. al., “Mobility Report Cards: The Role of Colleges in Intergenerational Mobility,” Opportunity Insights, December 2017, https://opportunityinsights.org/paper/mobilityreportcards/. ↑
- Mahnaz Charania and Julia Freeland Fisher, “The Missing Metric: Emerging Practices for Measuring Students’ Relationships and Networks,” Christensen Institute, July 2020, https://staging.whoyouknow.org/wp-content/uploads/2020/07/THE-MISSING-METRICS.pdf. ↑
- See Carol D. Ryff, “Linking Education in the Arts and Humanities to Life-Long Well-Being and Health,” Andrew W. Mellon Foundation, January 2019, https://mellon.org/news-blog/articles/linking-education-arts-and-humanities-life-long-well-being-and-health/; George Anders, “The Unexpected Value of the Liberal Arts,” The Atlantic, August 1, 2017, https://www.theatlantic.com/education/archive/2017/08/the-unexpected-value-of-the-liberal-arts/535482/?gclid=EAIaIQobChMIv86os4yb6wIVE4TICh2vPAlSEAMYASAAEgIT3_D_BwE. ↑
- “Wesleyan College Mission Statement and History,” Wesleyan College, https://www.wesleyancollege.edu/registrar/catalog/mission_history.cfm. ↑
- “A Unique Campus History,” University of Minnesota Morris, https://morris.umn.edu/about/unique-campus-history. ↑
- “Native American Student Life,” University of Minnesota Morris, https://morris.umn.edu/native-american-students-morris/native-american-student-life. ↑
- Ideally, we would have used a question from the Common Data Set that asked institutions to provide the subject areas in which all or most students were required to complete some coursework prior to graduation but the dataset was not readily available for the institutions in our sample. ↑
- As an alternative, we considered collecting academic course catalogs of institutions in the early 2000s for mentions of key words and phrases related to high-effort practices. If we could get the number of terms found in each catalog to estimate the number of high-effort practice requirements, we could simply divide the number of times the terms appeared in the catalog by the number of majors offered to standardize the number across institutions with very different enrollment sizes. However, that approach proved to be very time-consuming and we did not find course catalogs for all institutions in our sample, so we decided to stop pursuing it. ↑
- At most institutions, especially four-year institutions, a significant portion of the credits students need to fulfill in order to earn a degree must be in their primary discipline. By measuring the share of majors in the liberal arts and sciences, we could estimate the likelihood that students were receiving depth in a liberal arts and sciences subject area. A more straightforward measure may have been to calculate the share of degrees earned by students in the liberal arts and sciences, but because our framework is designed to measure what institutions offer, rather than what students experience, we calculated the share of majors offered by institutions in the liberal arts and sciences. ↑