Measuring the Economic Value of a Liberal Education
-
Table of Contents
- Introduction
- Economic value of a liberal education
- LASEO Framework
- Our current approach: LASEE Framework
- Creating LASEE index scores
- LASEE index scores
- LASEE index scores and student-level outcomes
- Regression analysis
- Findings: max sample (without System E)
- Findings: max variables sample (without System E)
- Limitations
- Conclusion
- Appendix A: technical details on creating LASEE index scores
- Appendix B: LASEE Framework attributes and metrics
- Appendix C: two-digit CIP codes and corresponding areas of study
- Appendix D: LASEE index scores by concentration
- Appendix E: GPA by area of study and concentration
- Appendix F: analytic models
- Appendix G: results tables
- Endnotes
Introduction
In recent years, public confidence in the value of higher education has declined, with a growing number of Americans questioning whether a college degree—particularly one rooted in the liberal arts—is worth the investment. Rising tuition costs, persistent economic inequality, and evolving labor market demands have intensified these concerns. Simultaneously, students increasingly cite career advancement as their primary motivation for pursuing a degree, placing pressure on colleges to demonstrate clear economic returns.[1] In response, several states have begun tying public funding for higher education to performance metrics, often rewarding institutions for producing more “credentials of value”—typically defined by wage thresholds or employment outcomes.[2]
These pressures have been further intensified by recent actions from the Trump administration, including proposed cuts to federal funding, policy shifts related to diversity initiatives and academic freedom, and an increased tax on some university endowments.[3] Such measures not only strain institutional finances but also risk reinforcing public skepticism about the value of higher education—especially for liberal arts colleges, which are frequently portrayed as outdated or disconnected from workforce needs. In this context, the need to clearly define, measure, and communicate the value of a liberal education has become more urgent than ever.
Proponents argue that a liberal education cultivates essential skills—critical thinking, communication, and adaptability—that are valuable across a wide range of careers and increasingly important in a rapidly changing economy. Yet the empirical evidence on its labor market value remains mixed, partly because researchers lack a consistent way to measure what constitutes a liberal arts experience. Most studies rely on proxies such as a student’s major or the type of institution attended. These approaches often show that liberal arts majors earn less and are more vulnerable to underemployment, especially during economic downturns. However, such findings obscure significant variation in earnings within majors, across career trajectories, and between individual students—even at the same institution. Institution-level studies, including previous work by Ithaka S+R supported by the Mellon Foundation, suggest that liberal arts colleges can deliver strong long-term returns.[4] However, across many types of institutions, these outcomes often reflect factors like selectivity and occupational sorting more than students’ educational experiences.
This paper aims to address these gaps. Building on our prior work and with support from the Mellon Foundation, we introduce a new methodological approach—the Liberal Arts and Sciences Educational Experience (LASEE) Framework—and shift the focus of analysis from institutions to individual students.[5] Using longitudinal data from the College and Beyond II (CBII) dataset, we measure students’ exposure to key liberal arts features—such as curricular breadth, small classes, and engagement with diverse perspectives—and examine how these experiences relate to academic, labor market, and civic outcomes. The use of student-level data allows us to capture meaningful variation within institutions, revealing that students at the same college or university can have significantly different educational experiences. Importantly, the CBII dataset includes only students from public colleges and universities, underscoring the relevance of liberal education beyond elite or private settings and within the broad-access institutions that serve a diverse cross-section of the American population.
Greater exposure to a number of liberal educational features is positively associated with academic performance, including higher GPAs and six-year graduation rates.
By moving beyond traditional proxies, this study offers a more nuanced and scalable approach to understanding the economic and civic impact of liberal education. Through this research we find that greater exposure to a number of liberal educational features is positively associated with academic performance, including higher GPAs and six-year graduation rates. Among students for whom employment data are available, liberal arts experiences are linked to a higher likelihood of pursuing graduate education and greater self-reported career adaptability, civic and political engagement, and openness to diversity and pluralism. While we find no relationship between liberal arts exposure and post-graduation earnings, this suggests that these students were neither economically advantaged nor disadvantaged in the labor market. Our findings reinforce existing research on the liberal arts that emphasizes the civic engagement benefits and public goods afforded by liberal education, suggesting that such benefits do not come at the expense of individual economic returns. These insights are especially timely as policymakers and institutions navigate a more skeptical and outcomes-driven higher education landscape. This report includes: 1) a review of existing literature on the economic value of a liberal education; 2) a summary of the Liberal Arts and Sciences Educational Offering (LASEO) Framework we developed in our prior study; 3) an overview of the new LASEE Framework developed in this study, including the development of LASEE index scores; 4) findings from analyses examining the relationship between scores and outcomes; 5) a discussion of the findings’ limitations and implications; and 6) appendices containing technical details.
Economic value of a liberal education
Empirical research consistently shows that earning a bachelor’s degree is associated with higher lifetime earnings and other positive outcomes.[6] Additionally, a growing body of literature on different types of postsecondary investments has found that four-year degrees, more selective institutions, and technical fields yield the highest returns, though there are questions about whether these studies adequately control for other factors that influence earnings.[7]
Within this research, studies on the economic value of a liberal education are far less conclusive. Most scholarship advocating for a liberal education highlights its non-pecuniary benefits.[8] Nonetheless, liberal education and liberal arts colleges—particularly those associated with the humanities—have faced significant criticism for their perceived lack of economic value. Critics of a liberal education argue that it fails to equip students with the technical or “hard” skills sought in our increasingly technology-driven economy. Proponents, however, contend that exposure to a liberal education fosters critical thinking, effective communication, and adaptability—skills essential for navigating the changing demands of the labor market.
Due to the complexity involved in capturing the extent to which institutions offer, and students experience, a liberal education, studies investigating its utility have relied on liberal arts majors and liberal arts colleges as proxies. Looking across studies that use liberal arts majors, students who major in the liberal arts and sciences, on average, do not earn as much as their peers in more career-oriented fields and face a higher likelihood of being unemployed or underemployed. Following the 2008 recession, for example, recent graduates in the liberal arts and sciences were more likely to be underemployed than graduates in areas such as health care and engineering.[9] However, the relationship between a student’s major and earnings is complex and shaped by many factors, including demographics and self-selection. Many professions are open to graduates from various academic backgrounds and majors, including the humanities. As a result, students with similar majors can and do pursue different career paths, which accounts for much of the difference in earnings between graduates.[10] There is also significant variation in earnings within majors.[11] Comparing average earnings across broad fields can obscure these nuances and create misleading perceptions about their economic value.
If liberal arts colleges provide a distinct educational experience aligned with the characteristics of a liberal education, then studying their graduates’ outcomes can help assess the economic returns to a liberal education.
Examining students’ institutions rather than their majors provides additional insights but also raises new questions. If liberal arts colleges provide a distinct educational experience aligned with the characteristics of a liberal education, then studying their graduates’ outcomes can help assess the economic returns to a liberal education. In Ithaka S+R’s first study on the economic value of a liberal education, we examined the economic benefits of attending a liberal arts college compared to alternatives in various ways.[12] Using institution-level data on students’ earnings at age 34, we found that differences in earnings across school types had more to do with institutional selectivity and students’ major and occupation, rather than the type of education they experienced. Additionally, other studies of return on investment (ROI) indicate that liberal arts graduates may even have the upper hand—the long-term ROI for liberal arts institutions often exceeds that of the average small, private institution.[13]
While these findings shed some light on the utility of a liberal education, as described in greater detail in our previous report, significant challenges remain in identifying students who received a liberal education and isolating the causal impact on economic outcomes. To establish a stronger link, alternative approaches are needed.
LASEO Framework
Recognizing the limitations of prior studies that defined a liberal education based on liberal arts majors or liberal arts colleges, our previous study aimed to answer two key research questions:
- What features define a liberal arts and sciences educational experience, and how are they offered in various combinations across higher education institutions in the United States?
- How do these features and the extent to which institutions offer them relate to students’ academic success and long-term labor market outcomes?[14]
Developing the LASEO Framework
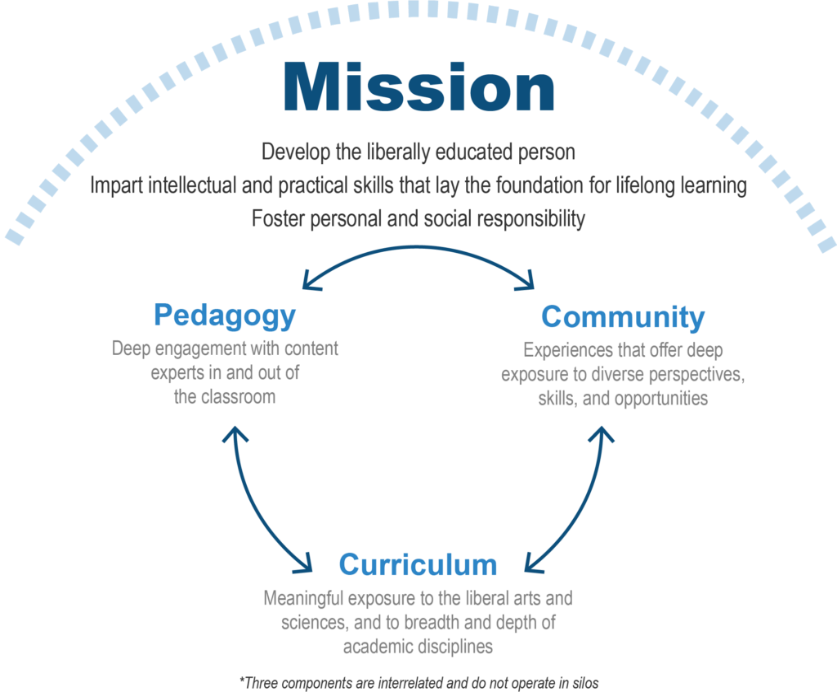
To answer the first question, we first defined the mission and purpose of a liberal education, using the existing literature as a foundation. A liberal eduation emphasizes imparting intellectual and practical skills and experiences that support lifelong learning and foster personal and social responsibility for participation in a global society.[15] From this definition, we identified three core components that best capture the essence of a liberal education (see Figure 1 for a visual representation):
- Pedagogy: Deep engagement with content experts in and out of the classroom
- Curriculum: Meaningful exposure to the liberal arts and sciences, emphasizing both breadth and depth of academic disciplines
- Community: Experiences that offer diverse perspectives, skill development, and opportunities for growth
Figure 1. LASEO Framework: Mission and Components
Within each component, we identified a set of attributes that best capture the defining features of a liberal arts and sciences educational experience. These include, for example, “exposure to multiple disciplines (breadth)” and “sustained social interactions amongst a diverse set of peers.” Together, the three components and the attributes within them make up the Liberal Arts and Sciences Educational Offering (LASEO) Framework.
LASEO index scores
To quantify how extensively US higher education institutions offer such an educational experience, we applied the LASEO Framework to institutional data. Using four data sources, we constructed 13 institution-level proxy metrics to measure the extent to which institutions offered the 10 features of a liberal arts and sciences educational experience that made up our LASEO Framework.[16] For example, to approximate “instruction by committed and invested faculty with content expertise,” we calculated the share of full-time undergraduate faculty (denominator) who were teaching-focused and held a doctoral degree in the same general discipline as their department (numerator). We then developed and implemented a scoring and weighting strategy to convert metric results to scores. Institutions with sufficient data received a final index score by summing up their scores across the attributes within each component and then summing up the three component scores. The LASEO index ranged from 0 to 100, with higher scores indicating stronger liberal arts offerings relative to lower-scoring institutions.
LASEO findings and limitations
To explore the relationship between liberal education and student outcomes, we conducted bivariate and multivariate regressions. We explored both total LASEO scores and the scores of its three components in relation to students’ academic performance and long-term labor market outcomes at the institutional level. Our analysis found no significant associations between LASEO scores and four primary labor market outcomes. This suggests that the extent to which an institution offers a liberal education is neither positively nor negatively associated with students’ outcomes, countering claims that graduates of such an education are ill-prepared for the workforce. However, we did find a positive association with a secondary outcome: the likelihood that students from the bottom 40 percent of the income distribution move to the top 40 percent by their early 30s. This suggests that a liberal education may provide unique advantages for low-income students, particularly at institutions that do not traditionally identify as liberal arts colleges. That said, our analysis has limitations. Most notable is that assigning a single LASEO score to each institution obscures variation in individual students’ educational experiences and outcomes within the same institution.
For a detailed discussion of the LASEO Framework, index scores, and findings, see our previous report available at https://sr.ithaka.org/publications/measuring-liberal-education-relationship-labor-market-outcomes/.
Our current approach: LASEE Framework
This study builds on the LASEO Framework and attempts to address many of the limitations of our previous study by incorporating student-level data to create a new framework—the Liberal Arts and Sciences Educational Experience (LASEE) Framework—to help answer the following research questions:
- What features define a liberal arts and sciences educational experience for students in US institutions?
- How can we measure the degree to which individual students experience such an education and how prevalent are these experiences across a subset of US institutions?
- What relationships exist between students’ exposure to particular liberal arts and sciences educational features and their academic, labor market, and civic outcomes?
Student-level data source
To answer these questions, we identified the College and Beyond II (CBII) student-record longitudinal dataset from the Inter-university Consortium for Political and Social Research’s (ICPSR) as an ideal data source. In addition to providing a rich set of student record and transcript data on more than 1.3 million students from across 19 institutions and seven university systems, CBII includes measures created by researchers that are relevant to the measurement of a liberal education, including curricular breadth and depth and course-level peer diversity. Additionally, CBII incorporates survey data on employment and wages, allowing us to link a subset of students’ educational experiences in the 2000s to their recent job outcomes. Access to this restricted dataset was granted through an application process and a virtual data enclave.
LASEE Max Sample and LASEE Max Variables Frameworks
To assess students’ individual exposure to a liberal education, we adapted the LASEO Framework from measuring institutional offerings to capturing student experiences, using data from CBII. This included removing any attributes that could not be measured by CBII data. For example, since CBII does not contain faculty-related information, we removed “instruction by committed and invested faculty with content expertise.” Another key insight from our data review was that the CBII survey data provided valuable details on students’ educational experiences—such as participation in extracurricular activities—that were not captured elsewhere in the dataset. However, this data is limited to approximately 2,800 students of 1.3 million in the full dataset, as the survey was only administered to those who earned a bachelor’s degree in the 2011-12 academic year at a subset of participating institutions. As a result, relying on survey responses would significantly reduce our sample size.
To balance sample size and comprehensiveness, we developed two versions of the LASEE Framework:
- LASEE Max Sample Framework: Maximizes the number of students included by excluding survey-based responses, at the cost of fewer variables.
- LASEE Max Variables Framework: Incorporates survey-based responses, providing a more comprehensive assessment of educational experiences but applying only to survey respondents.
Creating LASEE index scores
To prepare CBII data for analysis, we cleaned each underlying dataset, retained relevant variables, generated new ones as needed, and merged the data into one single master dataset of 1,312,280 students. We then reduced the initial sample by excluding those with educational records prior to 2000, those who began their studies in 2018-19 or later, those who enrolled in fewer than five or more than 24 terms, and those who transferred institutions (for whom we could not observe full educational transcripts). After these exclusions, the final sample consisted of 732,327 students. Similarly, the alumni survey sample started with 2,801 students who graduated during the 2009-2010 academic year and, after dropping observations that met the above criteria, was reduced to 2,219 graduates. Since we constructed the full sample for the LASEE Max Sample Framework and the alumni survey sample for the LASEE Max Variables Framework, we refer to the full sample as the “max sample” and the alumni survey sample as the “max variables sample” throughout the remainder of the paper. Appendix A includes additional details on dropped observations.
Both frameworks are comprised of individual-level metrics that measure students’ exposure to key features of a liberal arts education. Throughout, we use “feature” and “metric” interchangeably. These metrics roll-up to describe a set of attributes, with each attribute having between one and five metrics. Attributes are aligned with the three primary components that research suggests define a liberal education: pedagogy, curriculum, and community. Using the dataset described above, we constructed two sets of metrics to assess individual students’ experiences: one set of metrics aligned with the five attributes of a liberal arts and sciences education outlined in the LASEE Max Sample Framework, and one set aligned with those five attributes plus an additional three attributes included in the LASEE Max Variables Framework. These metrics capture a broad spectrum of educational experiences. The pedagogy component includes metrics that emphasize small class sizes and active learning environments and developing meaningful relationships with faculty. The curriculum component reflects both the breadth of exposure to multiple disciplines and the depth of sustained engagement within specific disciplines. The community component comprises metrics related to the demographic, academic, and ethnic and racial diversity of classmates, as well as participation in extracurricular activities and other experiences beyond the classroom.
We derived some metrics from student-level data (e.g., lived for at least a year on campus) and others from course-by-student level data (e.g., average class size of undergraduate courses taken). After assigning a value to each metric, we scored and applied weights to them to determine a metric score. Unlike our previous study, which measured institutions relative to one another, we assigned metric points based on individual students’ experiences in absolute terms. In other words, we did not assign points based on a student’s position in the distribution of experiences. Instead, we created thresholds based on possible values for each metric irrespective of the distribution and assigned students points according to their position relative to those thresholds. This approach ensures that the frameworks remain applicable beyond the students included in the CBII dataset. Additional details on the steps we used to create LASEE index scores can be found in Appendix A and a complete list of framework attributes and corresponding metrics can be found in Appendix B as well as in a separate Excel file available to download at https://sr.ithaka.org/liberal-arts-and-sciences-educational-experience-lasee-framework/.
LASEE index scores
We calculated LASEE index scores for both the max sample, which we refer to as “LASEE max sample index scores,” and the max variables sample, referred to as “LASEE max variables index scores,” by summing students’ metric scores across each attribute, attribute scores across each component, and then summing students’ component scores. Because the LASEE Max Variables Framework includes more information on educational experiences and incorporates additional metrics, possible scores range from zero to 100, whereas possible scores for the LASEE Max Sample Framework, which is composed of a subset of information included in the LASEE Max Variables Framework, range from zero to 60. For both, a higher index score indicates greater exposure to liberal arts and sciences features.
Table 1 presents descriptive data on these index scores. Looking at the LASEE max sample index scores, scores range from 11.5 to 51.9. The median score, 34.9, indicates that the typical student experienced a liberal education slightly above the midpoint of the scale. For the pedagogy component, the average score of 9.4 accounts for nearly 50 percent of the total available points (20). For the curriculum component, the average score of 16.3 represents 59 percent of total available points (27.5), while for the community component the average score of 8.2 represents 66 percent of the available points (12.5). In other words, students were more likely to be exposed to the community aspects of a liberal education and least likely to be exposed to the pedagogical aspects of a liberal education.
The distribution of LASEE max variables index scores is similar to that of the LASEE max sample index scores, though there are notable differences worth highlighting. While LASEE max variables index scores ranged from 25.5 to 85.3, the median score, 58.9, indicates that the typical alumni survey participant experienced a liberal education above the midpoint of the scale. The average score for the pedagogy component, 19.5, represents 56 percent of the total available points, compared to 50 percent for the max sample. For the curriculum component, the average score of 21.2 represents 61 percent of total available points, while for the community component the average score of 16.7 represents 56 percent of the available points, compared to 59 percent and 66 percent for the max sample. In other words, graduates in the max variables sample were more likely to be exposed to the pedagogical aspects of a liberal education and less likely to be exposed to the community aspects than students in the max sample.
| Table 1. Descriptive data on LASEE index scores | |||||||
| n[17] | Mean | SD | Min | Med | Max | ||
| LASEE Max Sample Index Score | 732,327 | 35.0 | 4.3 | 11.5 | 34.9 | 51.9 | |
| Pedagogy Score (out of 20 points) | 732,327 | 9.4 | 3.4 | 0.0 | 8.9 | 20.0 | |
| Curriculum Score (out of 27.5 points) | 732,327 | 16.3 | 2.7 | 0.0 | 16.0 | 27.5 | |
| Community Score (out of 12.5 points) | 732,327 | 8.2 | 1.9 | 0.0 | 8.5 | 11.5 | |
| LASEE Max Variables Index Score | 2,219 | 58.7 | 10.6 | 25.5 | 58.9 | 85.3 | |
| Pedagogy Score (out of 35 points) | 2,219 | 19.5 | 6.4 | 0.7 | 19.6 | 34.7 | |
| Curriculum Score (out of 35 points) | 2,219 | 21.2 | 4.9 | 7.0 | 21.5 | 33.5 | |
| Community Score (out of 30 points) | 2,219 | 16.7 | 3.5 | 4.0 | 17.0 | 28.0 | |
Figure 2 presents histograms displaying the distribution of LASEE index scores for both samples. In each case, the scores were approximately normally distributed, indicating that the majority of students experienced between 50 and 70 percent of the liberal education features outlined in our frameworks and relatively few experienced very few or nearly all liberal arts features.
Figure 2. Distribution of LASEE index scores
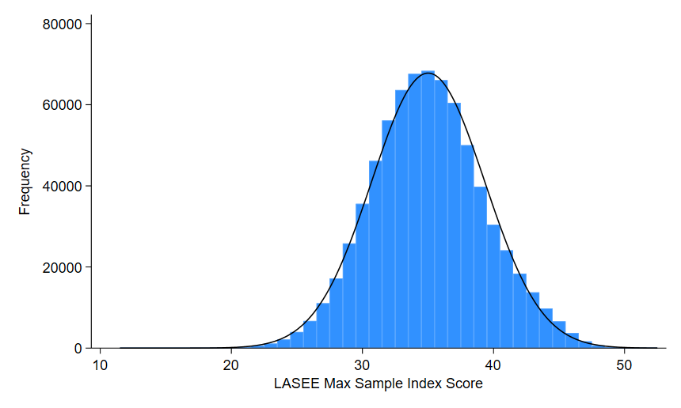
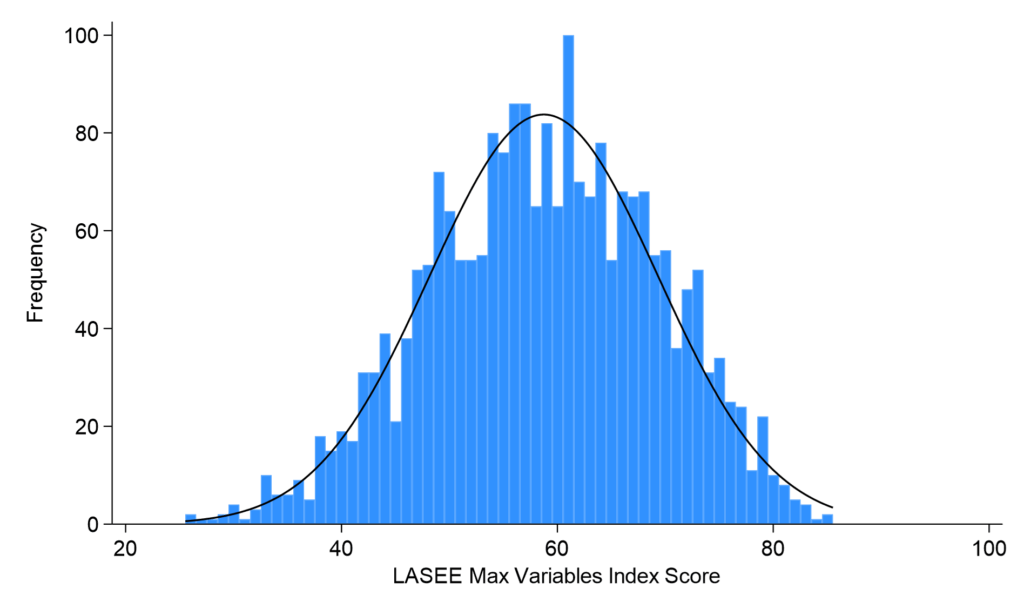
Figure 3 presents box plots of the distribution of LASEE index scores by component. The box plot of LASEE max sample index scores indicates that students earned the highest scores in the curriculum component, largely because it accounted for nearly half of the total available points. In contrast, the box plot of LASEE max variables index scores shows a more balanced distribution of scores across components, which is expected given the more even weighting of components in this index version.
However, differences in weighting do not account for all the variation between the two frameworks. The most pronounced differences arise in the community component, largely due to the richness of the alumni survey data.[18] The added detail on experiences beyond course of study, participation in extracurricular activities, and on-campus residency in the alumni survey adds important details on student experiences that are not captured in the LASEE Max Sample Framework. This suggests that community scores offer different insights depending on whether they are based solely on administrative data or supplemented with survey data. In contrast, administrative data, at least as represented in the CBII dataset, appears to be sufficient to capture pedagogy and curriculum experiences.
Figure 3. Distribution of LASEE Index Scores by Component
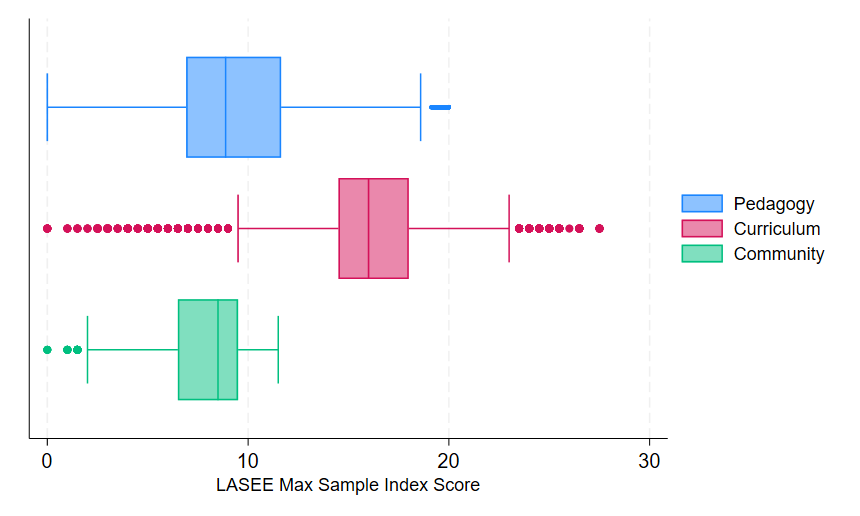
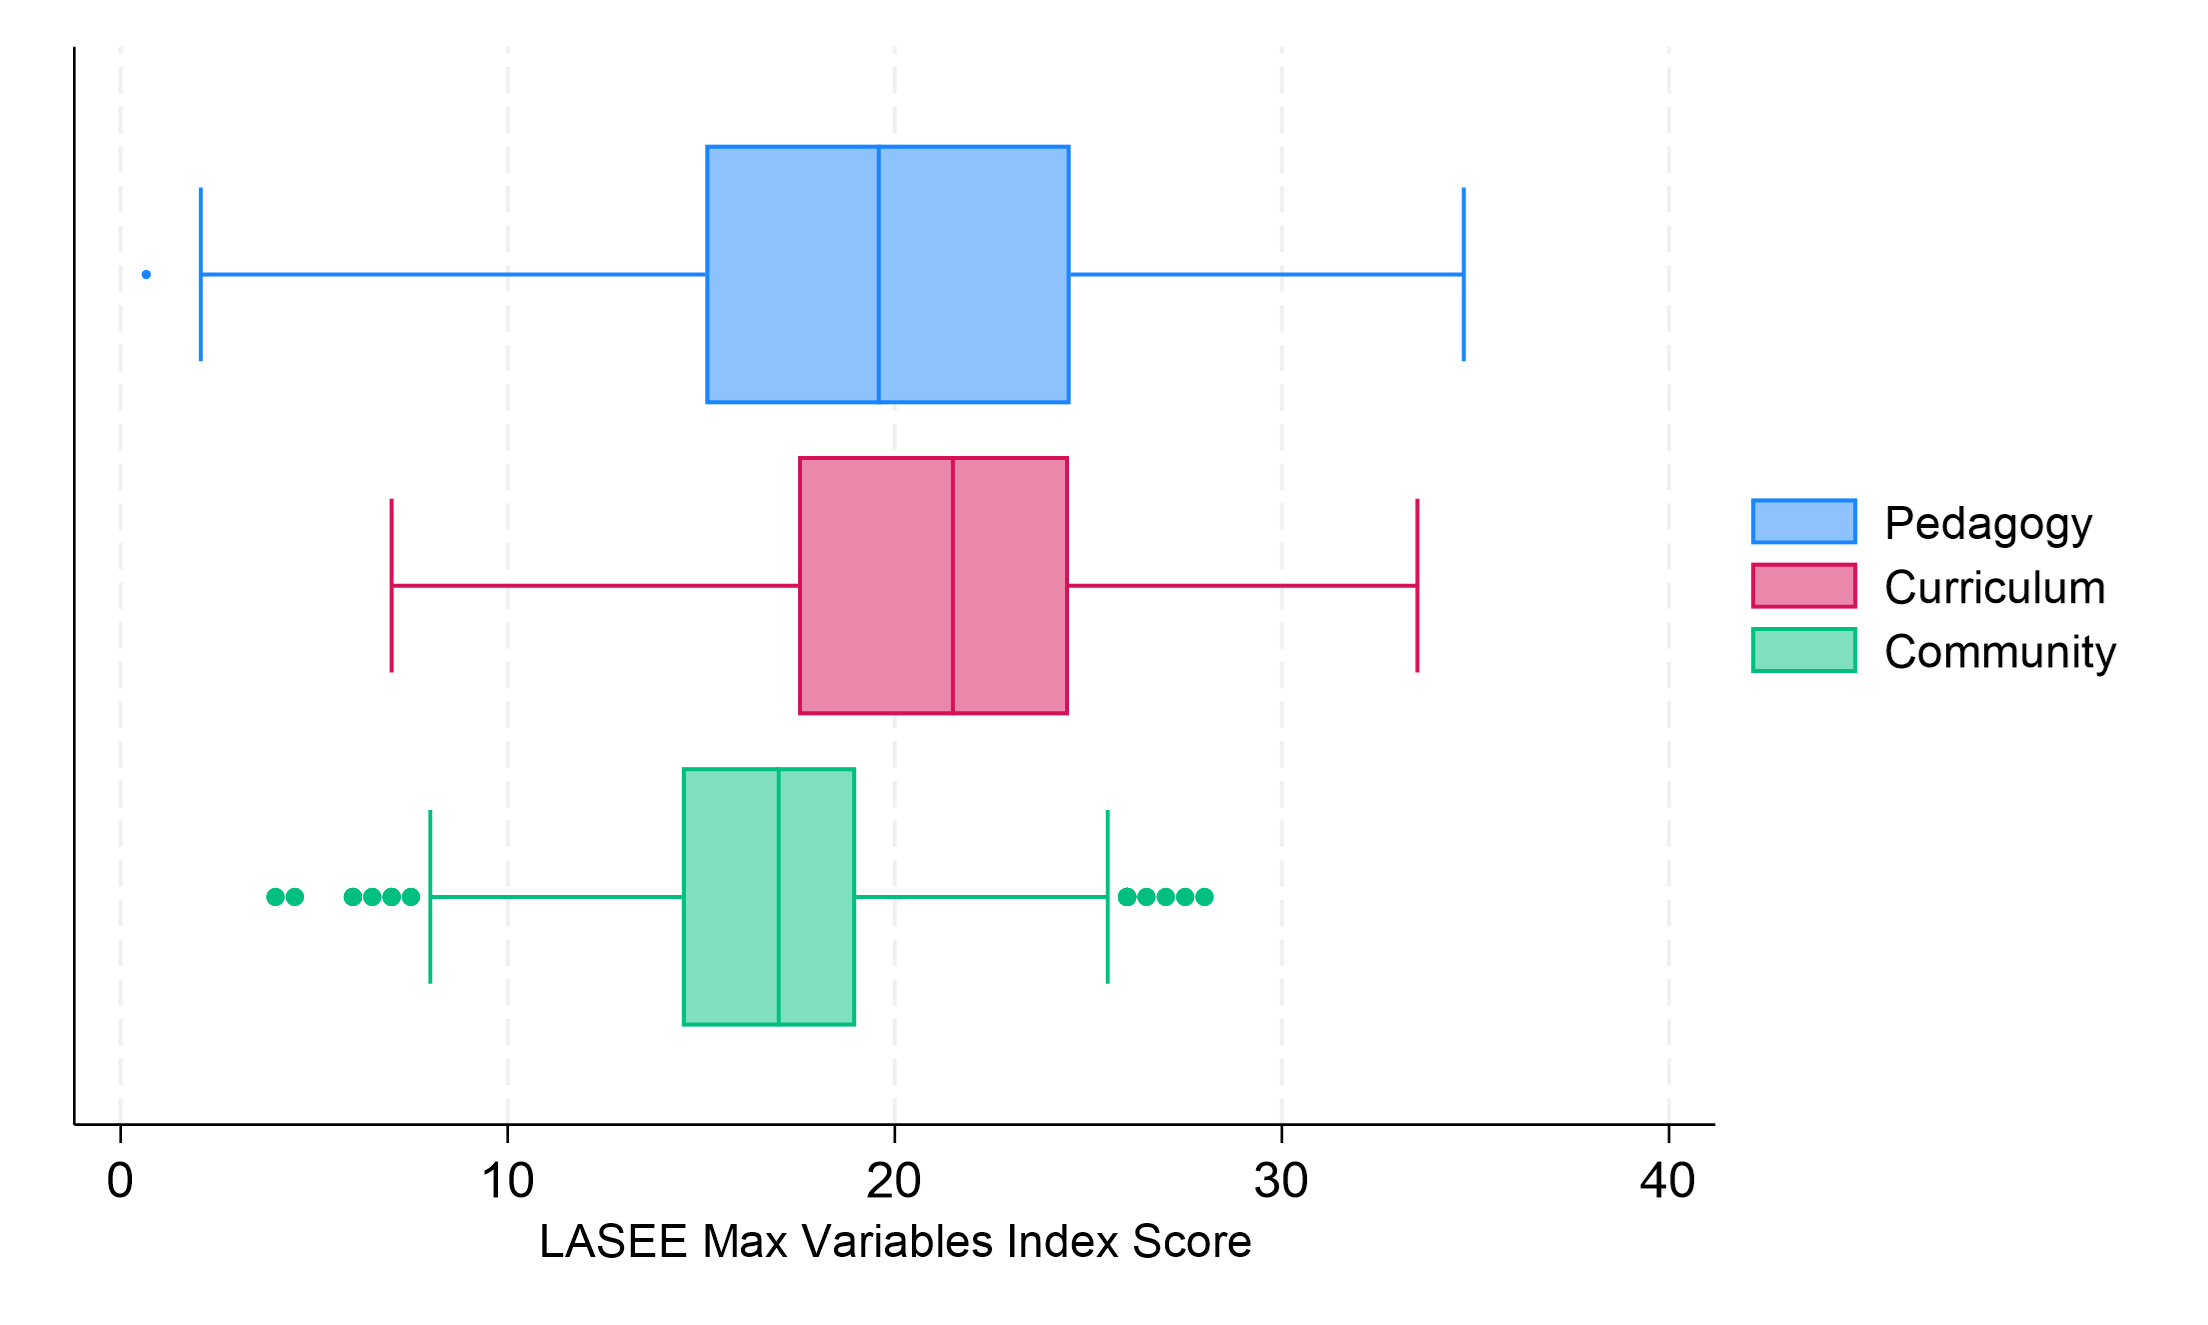
Table 2 presents descriptive statistics of LASEE index scores by the seven university systems included in the dataset (named Systems A through G), uncovering significant differences. With a mean LASEE max sample index score of 40.4, or 67 percent of available points, System A had the highest average score among the seven systems. Average scores for Systems B to G, on the other hand, closely ranged from 32.8 to 34.5, slightly above the index midpoint. Looking at LASEE max variables index scores, System A again had the highest average score (64.3) but there was more variation among the remaining six systems, ranging from 51.1 (System G) to 61.3 (System D).
| Table 2. Descriptive data on LASEE index scores by system | ||||||||
| n | Mean | SD | Min | Med | Max | |||
| LASEE Max Sample Index Score | ||||||||
| System A | 104,083 | 40.4 | 3.3 | 21.0 | 40.7 | 51.3 | ||
| System B | 16,549 | 32.9 | 4.0 | 12.5 | 32.7 | 48.3 | ||
| System C | 50,863 | 33.9 | 4.1 | 14.0 | 34.1 | 51.9 | ||
| System D | 16,506 | 32.9 | 3.3 | 20.4 | 32.6 | 46.7 | ||
| System E | 364,502 | 34.5 | 3.5 | 13.0 | 34.7 | 50.2 | ||
| System F | 103,970 | 34.1 | 4.0 | 11.5 | 33.9 | 50.2 | ||
| System G | 75,854 | 32.8 | 3.9 | 16.0 | 33.0 | 49.5 | ||
| LASEE Max Variables Index Score | ||||||||
| System A | 593 | 64.3 | 8.9 | 38.3 | 64.4 | 85.3 | ||
| System B | 125 | 60.6 | 9.3 | 38.1 | 62.0 | 79.4 | ||
| System C | 279 | 52.6 | 10.0 | 26.4 | 52.3 | 79.9 | ||
| System D | 290 | 61.3 | 7.9 | 37.9 | 61.2 | 77.0 | ||
| System E | 135 | 55.7 | 9.0 | 35.2 | 54.9 | 76.0 | ||
| System F | 415 | 60.6 | 9.9 | 32.0 | 59.9 | 83.6 | ||
| System G | 382 | 51.1 | 9.8 | 25.5 | 50.4 | 80.1 | ||
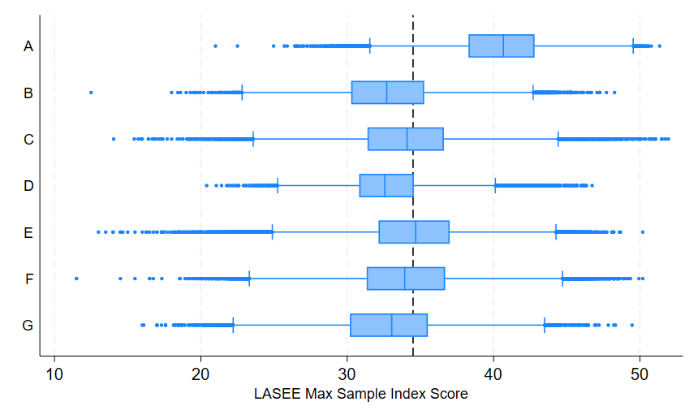
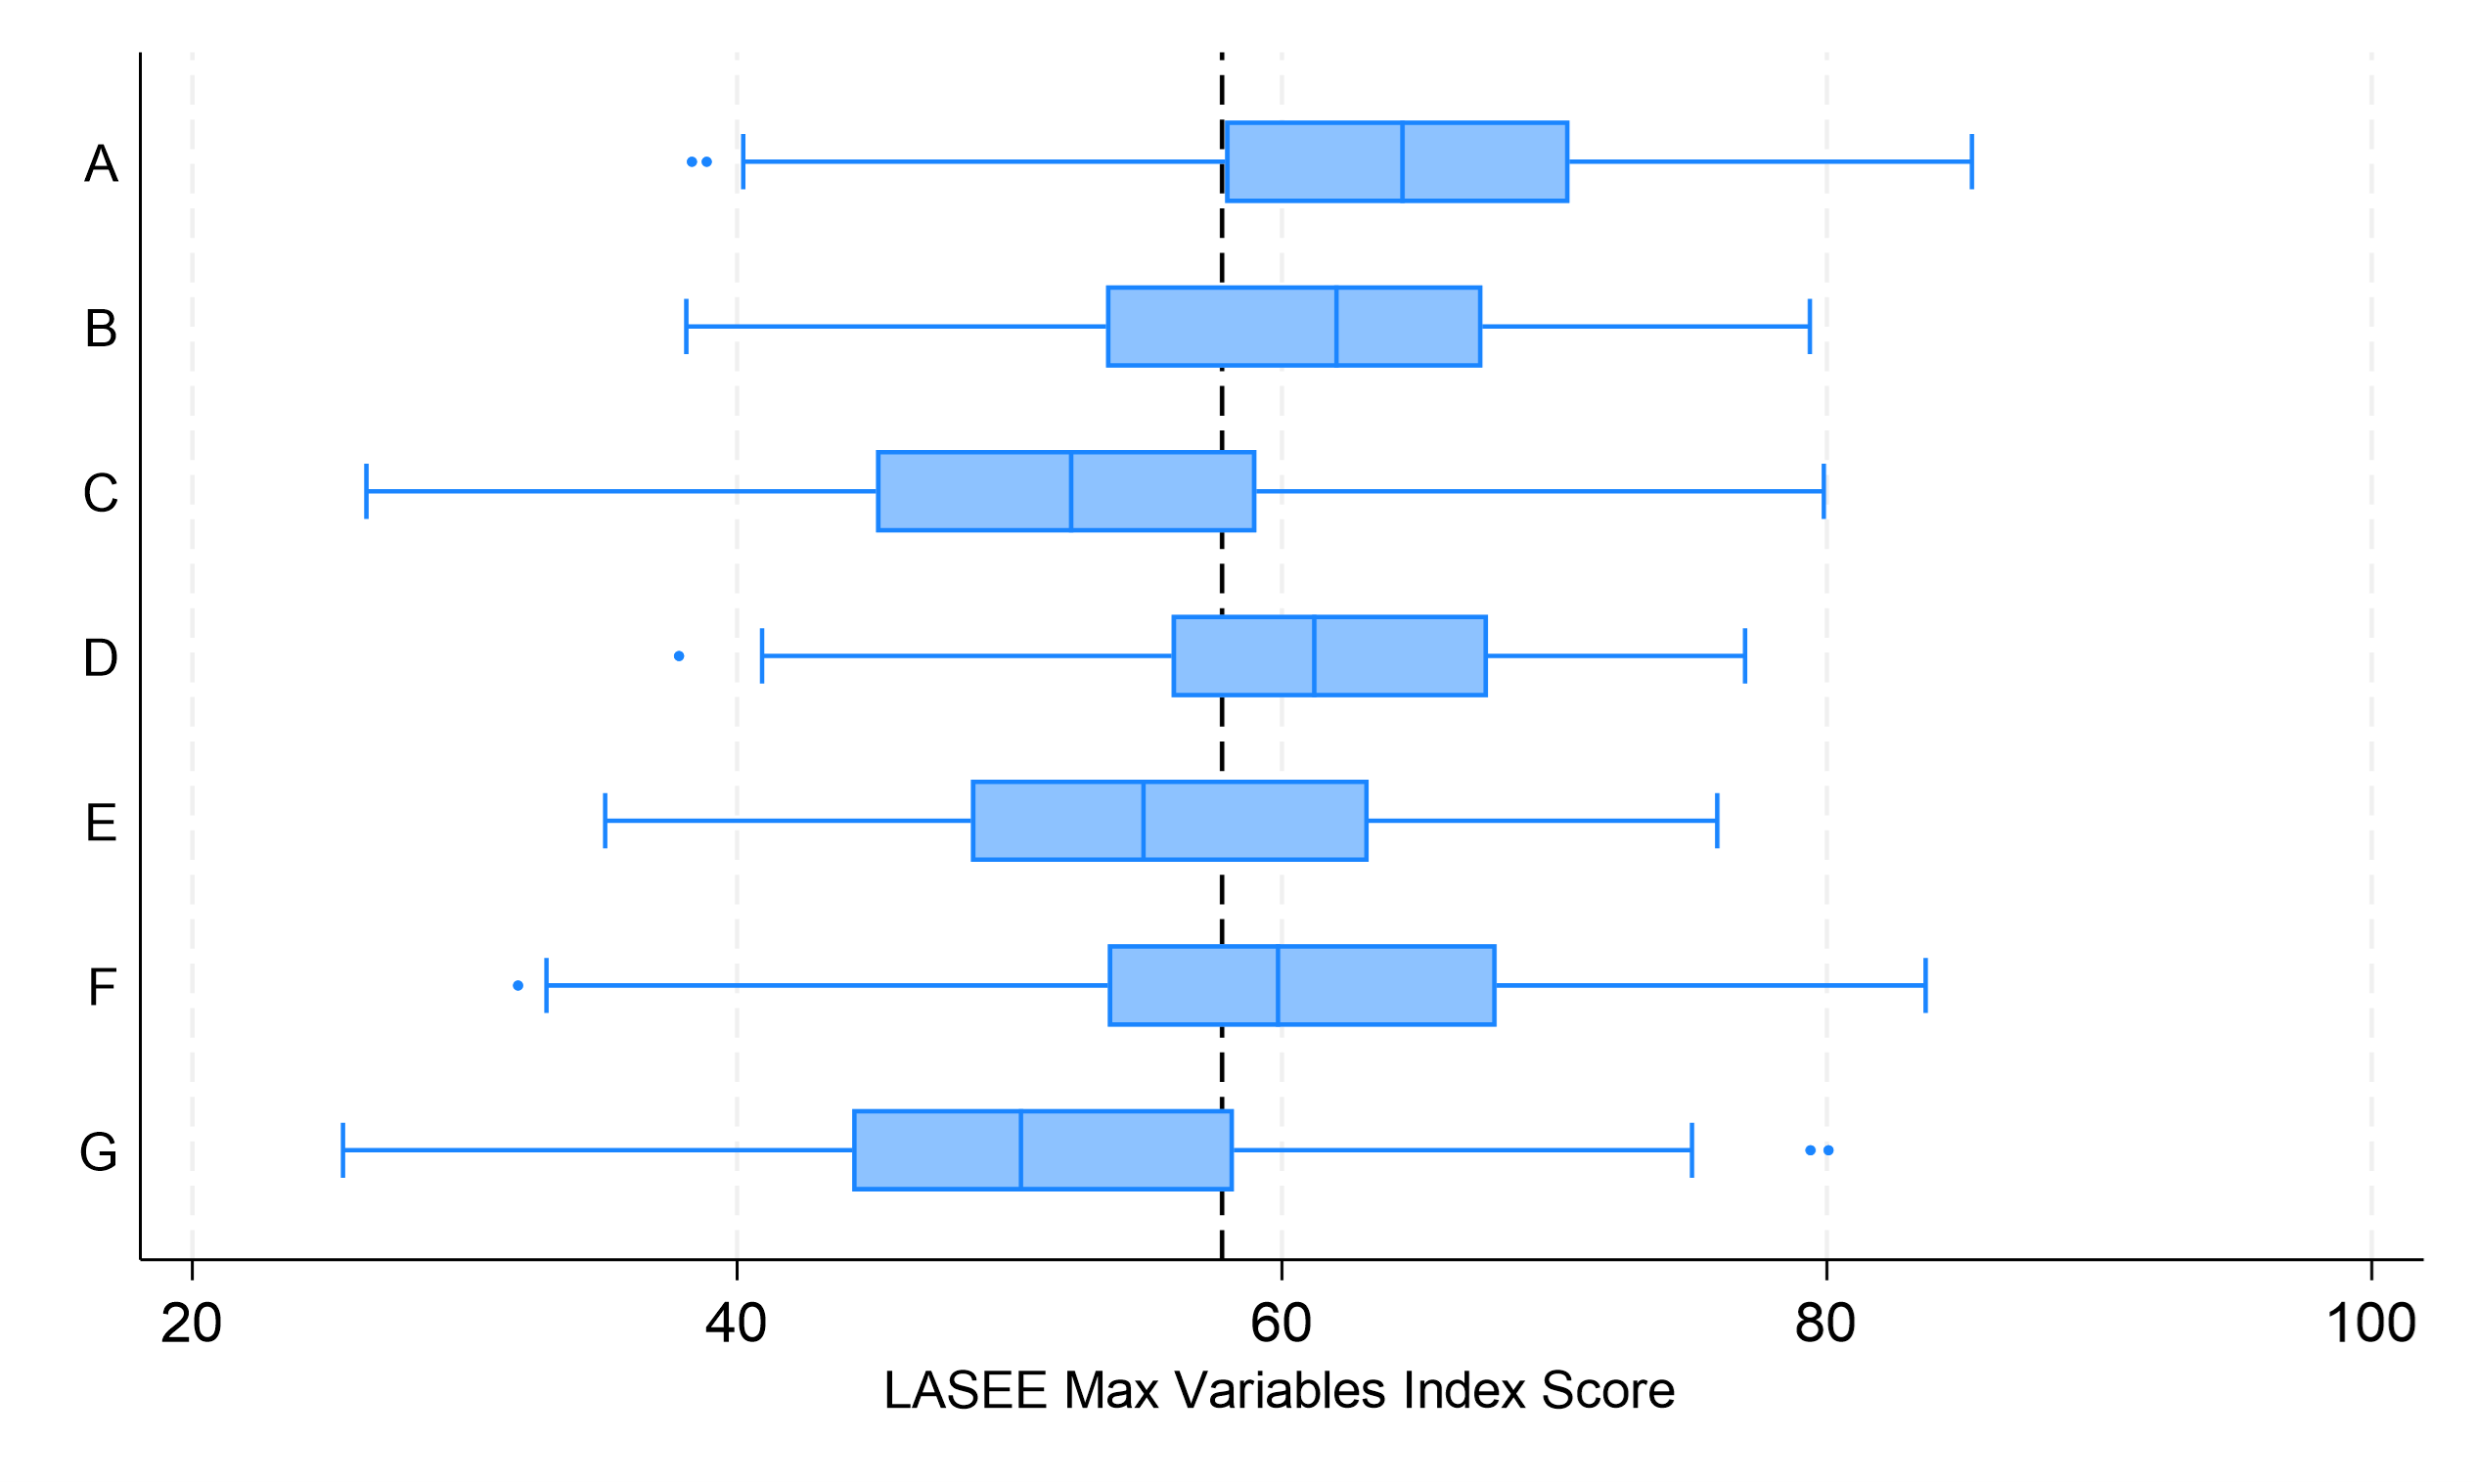
Figure 4 presents box plots of the distribution of LASEE index scores at each system, clearly showing that the majority of LASEE max sample index scores at System A were much higher than those at the other six systems. In contrast, differences in LASEE max variables index scores between System A and all other systems were less pronounced.
Figure 4. Distribution of LASEE Index Scores by System
Additionally, we analyzed LASEE index scores by students’ “concentration” to determine whether certain disciplines align more closely with a liberal education. We assigned each student a concentration based on the most frequently occurring (i.e., modal) two-digit CIP code across their coursework. We used this method over relying on declared majors in the dataset to more accurately reflect the academic focus of a subset of students with double majors or substantial coursework outside their declared field. For most students in the dataset, the assigned concentration matches their declared major. In addition, we mapped each student’s concentration to one of the following groups: math or sciences; social sciences; humanities; foreign language; arts; and not associated with the liberal arts and sciences (not LAS). Throughout the paper, we refer to these six groupings as “areas of study.” The full list of two-digit CIP codes in each area of study is included in Appendix C.
Table 3 presents LASEE index scores by area of study. Surprisingly, there was relatively low variation in scores across areas of study, and students studying in disciplines not associated with the liberal arts and sciences received similar scores to those studying in a traditional liberal arts and sciences discipline. This suggests that students who are not studying in a traditional liberal arts and sciences discipline (as defined by our LASEE Frameworks) can receive a liberal education that is comparable to those who are, supporting our claim that a liberal arts and sciences major is an inadequate proxy for a liberal education. It also suggests that differences in liberal arts and sciences experiences, as measured by LASEE index scores, were not driven by differences in the experiences offered by academic disciplines.
| Table 3. Descriptive data on LASEE index scores by area of study | ||||||||
| n | Mean | SD | Min | Med | Max | |||
| LASEE Max Sample Index Score | ||||||||
| Foreign Language | 12,192 | 37.5 | 5.0 | 18.2 | 37.3 | 50.8 | ||
| Arts | 38,565 | 37.2 | 4.8 | 16.3 | 37.0 | 51.9 | ||
| Social Sciences | 187,534 | 35.0 | 4.5 | 13.5 | 34.6 | 51.3 | ||
| Humanities | 83,631 | 34.9 | 4.3 | 14.0 | 34.7 | 50.4 | ||
| Not LAS | 270,557 | 34.9 | 3.8 | 11.5 | 35.0 | 50.3 | ||
| Math or Sciences | 139,848 | 34.5 | 4.5 | 14.5 | 34.4 | 49.9 | ||
| LASEE Max Variables Index Score | ||||||||
| Foreign Language | 64 | 66.8 | 10.1 | 35.9 | 68.2 | 83.5 | ||
| Arts | 152 | 62.8 | 10.1 | 40.7 | 62.3 | 79.5 | ||
| Humanities | 209 | 60.1 | 9.0 | 32.8 | 61.2 | 80.6 | ||
| Math or Sciences | 381 | 59.0 | 11.1 | 25.5 | 59.6 | 82.4 | ||
| Social Sciences | 623 | 58.1 | 11.3 | 27.1 | 58.3 | 84.9 | ||
| Not LAS | 790 | 57.4 | 9.7 | 26.4 | 57.1 | 85.3 | ||
Descriptive analyses of LASEE index scores by concentration based on two-digit CIP codes are included in Appendix D; analyses of GPA by two-digit CIP code and area of study are included in Appendix E.
We did not find significant variation in LASEE index scores by demographics, including gender, race/ethnicity, and international status.
LASEE index scores and student-level outcomes
After understanding how LASEE max sample and max variables index scores were distributed, we examined whether differences in LASEE scores were associated with students’ academic, labor market, and civic outcomes. All outcome and control variables below were derived at the student level from the CBII dataset.
Key outcome variables
Grade point average (GPA): Student’s cumulative GPA, as provided by the institution, corresponding to the last term the student appears in the term file.
Four-year graduation: Binary indicating whether student graduated with a bachelor’s degree within four years.
Six-year graduation: Binary indicating whether student graduated with a bachelor’s degree within six years.
Time to degree: Number of academic years it took student to graduate with a bachelor’s degree (calculated for graduates only).
Educational attainment: Binary variable indicating whether student earned a master’s degree, Doctor of Philosophy (PhD), professional doctorate (e.g., EdD), or professional degree (e.g., MD, JD) within 10 years of earning a bachelor’s degree. Students who obtained a post-bachelor’s certificate are considered to have remained at a bachelor’s degree level. Derived from alumni survey.
Income: Student’s reported earnings in US dollars in 2020. Derived from alumni survey.
Employment: Binary variable indicating whether student was employed either full or part time in 2020. Derived from alumni survey.
Career adaptabilities scale: Student’s mean score on 12-item survey scale measuring career-related competencies, including ability to think about and prepare for the future and become aware of the educational and career choice that must be made. Possible scores range from zero to five continuously. Provided in alumni survey.
Civic and political engagement scale: Student’s mean score on six-item survey scale measuring career-civic and political engagement, including discussing politics with friends and family, and deciding to take action involving a political or social issue. Possible scores range from zero to five continuously. Provided in alumni survey.[19]
Openness to diversity scale: Student’s mean score on five-item survey scale measuring openness to diversity, including enjoying experiences and discussions with people of different values and backgrounds. Possible scores range from zero to five continuously. Provided in alumni survey.
Openness to pluralism scale: Student’s mean score on five-item survey scale measuring pluralistic worldview, including tolerance of others with different beliefs and ability to see multiple perspectives on an issue. Possible scores range from zero to five continuously. Provided in alumni survey.
Political voice scale: Student’s score on a six-item scale measuring political actions, including taking part in a protest, march, or demonstration and giving money to a candidate, party, or organization. Possible scores range from zero to 22. Derived from alumni survey.[20]
Key control variables
Number of terms enrolled: Number of academic terms student was enrolled in, standardized at four possible terms per academic year.
System: System student was enrolled in.
Institution: Institution student was enrolled in.
Cohort: Student’s first academic year.
Female: Binary indicating whether student is female.
Underrepresented minority (URM): Binary indicating whether student is from an underrepresented racial or ethnic group (i.e., Asian, Hispanic, Black or African American, American Indian or Alaskan Native, Native Hawaiian or Other Pacific Islander, Two or More Races).
International: Binary indicating whether student is classified as an international student (i.e., “nonresident alien”).
Area of study: Categorical variable classifying which liberal arts and sciences grouping a student’s primary academic concentration corresponds to, as defined by the two-digit modal CIP code. The full mapping of two-digit CIP codes to areas of study is in Appendix C.
High school GPA: Student’s standardized high school GPA. These data are not available for System E or survey respondents from System G.
Descriptive analysis of outcome and control variables
Tables 4 and 5 present descriptive data on the outcome and control variables, organized by continuous and categorical variables. Among the max sample, the mean GPA is 3.03 and the average time to degree of graduates is 4.7 academic years. Thirty-nine percent of the max sample graduated in four years and 65 percent graduated in six years.
Among the max variables sample, the mean GPA is slightly higher, at 3.25, and the average time to degree is lower, at 4.1 academic years. These differences between samples are not surprising given that the max variables sample includes only graduates, whereas the max sample includes all enrolled students. Ten years post-graduation, 93 percent of the max variables survey participants were employed either full or part time. A majority (55 percent) earned a master’s or more advanced postgraduate degree by that time.
| Table 4. Descriptive data on continuous outcome variables | |||||||
| n | Mean | SD | Min | Med | Max | ||
| Max Sample | |||||||
| GPA | 652,170 | 3.03 | 0.65 | 0.00 | 3.15 | 4.35 | |
| Time to Degree (in academic years) | 519,995 | 4.7 | 1.8 | 0.5 | 4.0 | 20.8 | |
| Max Variables Sample | |||||||
| GPA | 2,214 | 3.25 | 0.44 | 1.03 | 3.29 | 4.00 | |
| Time to Degree (in academic years) | 2,219 | 4.1 | 1.1 | 1.3 | 3.8 | 9.8 | |
| 2020 Income ($) | 2,106 | 136,116 | 117,024 | 1 | 108,500 | 2,500,000 | |
| Career Adaptabilities Scale | 2,167 | 4.1 | 0.6 | 1.0 | 4.1 | 5.0 | |
| Civic and Political Engagement Scale | 2,178 | 3.3 | 0.6 | 1.2 | 3.3 | 5.0 | |
| Openness to Diversity Scale | 2,209 | 4.3 | 0.6 | 1.0 | 4.4 | 5.0 | |
| Openness to Pluralism Scale | 2,205 | 4.1 | 0.5 | 1.8 | 4.2 | 5.0 | |
| Political Voice Scale | 2,185 | 2.9 | 3.2 | 0.0 | 2.0 | 12.0 | |
| Table 5. Descriptive data on categorical outcome variables | ||
| Freq. | % | |
| Max Sample | ||
| Four-Year Graduation | 272,630 | 39.4 |
| Six-Year Graduation | 413,845 | 64.5 |
| Max Variables Sample | ||
| Employed Full or Part Time | 2,036 | 92.6 |
| Master’s or Higher | 1,201 | 54.8 |
Table 6 presents the number of terms enrolled—the only continuous control variable—for the max sample and max variables sample. Although the max variables sample consists of graduates who must have completed a minimum number of terms, the max sample averaged nearly one additional enrolled term.
| Table 6. Descriptive data on continuous control variables | |||||||||
| n | Mean | SD | Min | Med | Max | ||||
| Max Sample | |||||||||
| Number of Terms Enrolled | 732,320 | 10.4 | 3.2 | 5.0 | 10.0 | 24.0 | |||
| Max Variables Sample | |||||||||
| Number of Terms Enrolled | 2,219 | 9.6 | 2.2 | 5.0 | 9.0 | 20.0 | |||
Table 7 compares enrollment by system and area of study as well as demographic characteristics between the two samples. Alumni survey participants that make up the max variables sample were less likely to be from an underrepresented minority background, more likely to be from System A, and much less likely to be from System E. The proportion of students pursuing each area of study was similar across samples.
| Table 7. Descriptive data on categorical control variables | ||||
| Max Sample | Max Variables Sample | |||
| Freq. | % | Freq. | % | |
| System | ||||
| System A | 104,083 | 14.2 | 593 | 26.7 |
| System B | 16,549 | 2.3 | 125 | 5.6 |
| System C | 50,863 | 7.0 | 279 | 12.6 |
| System D | 16,506 | 2.3 | 290 | 13.1 |
| System E | 364,502 | 49.8 | 135 | 6.1 |
| System F | 103,970 | 14.2 | 415 | 18.7 |
| System G | 75,854 | 10.4 | 382 | 17.2 |
| Demographics | ||||
| URM | 387,964 | 53.8 | 971 | 44.6 |
| International | 40,672 | 5.6 | 0 | 0.0 |
| Female | 409,211 | 55.9 | 1,252 | 56.5 |
| Area of Study | ||||
| Not LAS | 270,557 | 36.9 | 790 | 35.6 |
| Social Sciences | 187,534 | 25.6 | 623 | 28.1 |
| Math or Sciences | 139,848 | 19.1 | 381 | 17.2 |
| Humanities | 83,631 | 11.4 | 209 | 9.4 |
| Arts | 38,565 | 5.8 | 152 | 6.9 |
| Foreign Language | 12,192 | 1.7 | 64 | 2.9 |
Regression analysis
We employed a series of ordinary least squares and logistic regression models to examine the relationship between LASEE index scores and academic, labor market, and civic outcomes. We also explored how the inclusion of various control variables influenced these relationships. We present two regression models for each analysis. The “naïve model” does not include any control variables and the “full controls model” includes the control variables listed above, unless otherwise noted. We used listwise deletion to handle missing data, meaning that students missing a single value in the model were excluded from the analysis. Additional information about the analytic models is in Appendix F and full regression tables are in Appendix G.
System E
System E is unique from the other six systems for a number of reasons. First, with 364,502 student observations, it accounts for 50 percent of the max sample, significantly more than any other system. Part of the reason it accounts for so many students is because it consists of 12 institutions, whereas the other six systems each consist of one institution. At the same time, System E is the only system that lacks high school GPA or other variables for measuring prior academic achievement, which is a consequential omission given the strong association between prior academic achievement and postsecondary student success. We also uncovered significant academic and demographic differences between System E and the other systems. Table 8 highlights these differences, most notably the significantly higher enrollment of underrepresented minority students in System E.
| Table 8. Descriptive data on differences between System E and all other systems | ||||
| System E | All Other Systems | |||
| Freq. | % | Freq. | % | |
| Max Sample | ||||
| Demographics | ||||
| Underrepresented Minority | 252,525 | 69.3 | 135,439 | 37.9 |
| International | 18,873 | 5.2 | 21,799 | 6.1 |
| Female | 227,854 | 58.3 | 195,088 | 53.1 |
| Area of Study | ||||
| Not LAS | 124,536 | 34.2 | 146,021 | 39.7 |
| Social Sciences | 102,738 | 28.2 | 84,796 | 23.1 |
| Math or Sciences | 59,546 | 16.3 | 80,302 | 21.8 |
| Humanities | 57,650 | 15.8 | 25,981 | 7.1 |
| Arts | 15,270 | 4.2 | 23,295 | 6.3 |
| Foreign Language | 4,762 | 1.3 | 7,430 | 2.0 |
| Max Variables Sample | ||||
| Demographics | ||||
| Underrepresented Minority | 109 | 80.7 | 862 | 42.2 |
| Female | 71 | 52.6 | 1,181 | 56.7 |
| Area of Study | ||||
| Social Sciences | 46 | 34.1 | 577 | 27.7 |
| Not LAS | 32 | 23.7 | 758 | 36.4 |
| Math or Sciences | 27 | 20.0 | 354 | 17.0 |
| Humanities | 17 | 12.6 | 192 | 9.2 |
| Arts and Foreign Language[21] | 13 | 9.6 | 203 | 9.7 |
For these reasons, we conducted regression analyses for System E and all other systems separately. For System E regressions, the full controls model includes the same controls as above, with three key differences. First, instead of system effects, the model analyzing LASEE max sample index scores includes institutional effects. Second, because alumni from only one institution in System E were surveyed, the model analyzing LASEE max variable index scores excludes institutional effects. Third, the full controls model does not include a control for prior academic achievement since those data are not available on System E.
Table 9 below presents descriptive data on LASEE max sample index scores for System E institutions. There is low variability in scores across System E institutions, suggesting that the average student at each institution received similar exposure to a liberal education.
| Table 9. Descriptive data on LASEE max sample index scores by institution for System E | ||||||
| n | Mean | SD | Min | Med | Max | |
| Institution | ||||||
| 4000 | 42,274 | 33.5 | 3.0 | 13.5 | 33.7 | 47.2 |
| 4003 | 10,362 | 33.4 | 3.1 | 20.3 | 33.2 | 45.3 |
| 4004 | 40,956 | 34.2 | 3.2 | 18.2 | 34.4 | 47.0 |
| 4007 | 28,673 | 34.2 | 3.2 | 17.5 | 34.4 | 46.1 |
| 4010 | 47,715 | 37.6 | 3.1 | 14.5 | 37.9 | 50.2 |
| 4014 | 1,479 | 32.9 | 4.0 | 18.4 | 33.4 | 41.9 |
| 4019 | 43,614 | 33.2 | 3.0 | 14.0 | 33.3 | 45.1 |
| 4020 | 22,436 | 35.1 | 3.5 | 15.5 | 35.6 | 45.4 |
| 4021 | 28,214 | 32.0 | 2.9 | 14.0 | 31.9 | 44.4 |
| 4023 | 22,290 | 33.6 | 3.5 | 13.0 | 33.9 | 45.8 |
| 4026 | 40,844 | 36.2 | 2.7 | 18.5 | 36.5 | 46.4 |
| 4029 | 35,645 | 34.7 | 3.3 | 16.0 | 34.8 | 47.6 |
Findings: max sample (without System E)
Looking at the max sample without System E, we observe significant positive associations between LASEE max sample index scores and GPA and six-year graduation rates, even after including control variables. Each one-point increase in the index score is associated with a 0.02 increase in GPA, at 99.9 percent confidence. While this incremental change seems small, it adds up across the range of scores. From the minimum to maximum of max sample index scores, this model suggests a 0.81-point increase in GPA and, from the 25th to 75th percentiles, a 0.14-point increase. In other words, a student with a LASEE max sample index score of 32 (25th percentile) has, on average, a GPA 0.14 points lower than a student with a score of 39.1 (75th percentile).
Fitting logistic regression models to assess binary graduation outcomes, we observe an 8 percent increase in a given student’s odds of graduating within six years for each one-point increase in a student’s LASEE score, at 99.9 percent confidence. This means that each additional one-point increase in index score leads to a compounding percentage increase in odds, resulting in a substantial overall effect. For example, a student with the maximum LASEE max sample index score of 51.9 has 22.4 times higher odds of graduating within six years compared to a student with the minimum score of 11.5—an increase of 2,140.4 percent in the odds of graduating. Similarly, a student with a LASEE max sample index score in the 75th percentile has 1.73 times higher odds of graduating within six years compared to a student with the score in the 25th percentile, representing an increase of 72.7 percent in the odds of graduating. That said, this result should be interpreted with caution. Because our analytic approach is not causal, other endogenous factors, or unobserved differences between students, may be influencing the observed relationship that we have not accounted for.
We do not observe significant associations between LASEE scores and either time to degree or four-year graduation rates. Taken together, these findings suggest that experiencing a liberal education does not accelerate students’ progress through college, a result which is unsurprising given that engaging with the myriad features of such an education can require more time enrolled, not less.
Additional analysis: max sample (without System E)
We conducted additional analyses to further explore the relationship between liberal education features and positive outcomes on GPA and six-year graduation by testing whether the overall impact was driven by subgroups of students. To do this, we first ordered LASEE index scores from smallest to largest and placed them into the following categories: 0-25th percentile (Bottom Quartile); 26th-50th percentile (Second Quartile); 51st-75th percentile (Third Quartile); and 76th to 100th percentile (Top Quartile).
Table 10 presents descriptive data on LASEE index scores by quartile. Looking at the LASEE max sample index scores, students in the top quartile scored an average of 40.6 points out of 60, or 68 percent of total available points. On the other end of the spectrum, students in the bottom quartile scored 29.6 points, on average, amounting to 49 percent of total available points.
| Table 10. Descriptive data on LASEE index scores by quartile | ||||||
| n | Mean | SD | Min | Med | Max | |
| LASEE Max Sample Index Score | ||||||
| Bottom Quartile | 183,107 | 29.6 | 2.0 | 11.5 | 30.1 | 32.1 |
| Second Quartile | 183,065 | 33.5 | 0.8 | 32.1 | 33.6 | 34.9 |
| Third Quartile | 183,079 | 36.3 | 0.8 | 34.9 | 36.3 | 37.8 |
| Top Quartile | 183,076 | 40.6 | 2.2 | 37.8 | 40.0 | 51.9 |
We then ran the same set of regressions looking at the relationship between LASEE max sample index scores and GPA and six-year graduation rates separately for each quartile. We observe that effect sizes on GPA and six-year graduation rates are largest for students in the lowest quartiles. Looking at GPA, the coefficient estimate is 0.12 GPA points for students in the bottom quartile, 0.03 for students in the second and third quartiles, and 0.02 for students in the top quartile. All are statistically significant at 99.9 percent confidence. This pattern is repeated with six-year graduation. The full model predicts a 95 percent increase in the odds of a student in the bottom quartile graduating in six years with each one-point increase in LASEE score, at 99.9 percent confidence. For students in the second and third quartiles, the model predicts 21 percent and 28 percent increases in a given student’s odds of graduating within six years with each one-point increase in LASEE score, also at 99.9 percent confidence. For students in the top quartile, the pattern is reversed: the odds of graduating in six years decrease by 5 percent for each one-point increase in LASEE score, at 99 percent confidence.
Students with lower initial LASEE scores appear to benefit more from marginal increases in exposure to a liberal education than their higher-scoring peers. In other words, the larger effect sizes observed among students in the bottom quartiles suggest diminishing returns to additional liberal arts experiences—an effect not evident in the primary analyses.
Findings: max variables sample (without System E)
Looking at the max variables sample for systems other than System E, we observe significant positive associations between LASEE max variables index scores and GPA, similar to what we found looking at the max sample. [22] For GPA, each one-point increase in LASEE score is associated with a 0.01 increase in GPA at the 99.9 percent confidence level. This corresponds to an increase in GPA of 0.59 points across the range of scores and 0.15 points between the 25th and 75th percentiles. We did not investigate the relationship between scores and four- or six-year graduation rates because the sample consists solely of graduates.
We were also able to explore the relationship between scores and other outcomes found only in the alumni survey. We observe significant positive associations between LASEE max variables index scores and level of degree attainment and students’ self-reported ability to adapt in their careers. Using fitted logistic regression models to assess binary educational attainment outcomes, we observe a 3.0 percent increase in a given student’s odds of earning an advanced degree within ten years for each one-point increase in a student’s LASEE max variables index score, at the 99.9 percent confidence level. This means that a student with the maximum LASEE max variables index score of 84.3 has 5.7 times higher odds of obtaining an advanced degree compared to a student with the minimum score of 25.5—an increase of 468.6 percent in the odds. Looking across a smaller spread, a student with a LASEE max variables index score in the 75th percentile has 1.55 times higher odds of obtaining an advanced degree compared to a student with a score in the 25th percentile, representing an increase of 54.9 percent in the odds.
We also observe a small but positive association between LASEE scores and students’ self-reported ability to adapt in their careers.[23] The full model predicts a 0.01-point increase for each one-point increase in LASEE score, at the 99.9 percent confidence level. Across the range of scores, this corresponds to a 0.59-point increase, and between the 25th and 75th percentiles, it corresponds to a 0.15-point increase. Since the survey scale ranged from zero to five, these shifts correspond to increases of 12 percent and 3 percent of the total scale range, respectively.
In addition to academic and labor market outcomes, we also examined a set of measures designed to capture the civic returns of experiencing liberal education features, a focus of much prior research on the liberal arts, particularly in arguments positioning education as a public good. These findings situate academic and labor market outcomes within the broader context of benefits traditionally associated with the liberal arts and sciences.
Using pre-existing scales included in the alumni survey, we observe positive associations between LASEE max variables index scores and civic and political engagement, openness to diversity, openness to pluralism, and political voice. We also observe a positive association between LASEE max variables index scores and a scale measuring political participation that we created from similar survey items.[24] Of the four significant positive associations, the relationship between LASEE index scores and civic and political engagement was the largest. The full model predicts a 0.02-point increase for each one-point increase in LASEE index score at 99.9 percent confidence. Movement from minimum to maximum LASEE max variables index scores correspond to a 1.18-point increase on this five-point scale. From the 25th to 75th percentile, the full model suggests a 0.30-point increase on the survey scale. Regression results for all four scales are in Appendix G.
Similar to the LASEE max sample index scores, we do not observe any significant associations between LASEE max variables index scores and time to degree. We also do not observe significant associations between LASEE index scores and income or employment status, suggesting that a liberal arts education does not limit the future earnings or job prospects of students.
Additional analysis: max variables sample
(without System E)
One potential limitation of the alumni survey is the possibility that it suffers from two types of biases. First, because responses are self-reported, alumni may tend to present their educational experiences more favorably. Second, the survey may suffer from self-selection bias, as alumni with more favorable experiences in college might be more likely to respond. To examine this, we ran a series of regressions using the max sample index scores of the 2,219 graduates in the max variables sample to predict max variables outcomes. The results closely mirrored those from regressions that used the max variables index scores to predict the same outcomes. This suggests that the positive associations between index scores and outcomes are not driven by variation among educational experiences, including biased reporting, in the survey data.[25]
Findings: System E only
When looking at System E only, we do not observe significant associations between LASEE scores and any outcome measure, with or without control variables. This finding suggests that differences in academic and labor market outcomes among System E students, including alumni survey respondents, are not driven by differences in the extent to which these students experienced liberal education features. Without reporting sensitive details on the characteristics of System E as a whole and its institutions, especially in relation to other systems in the data, it is difficult to hypothesize why this is the case.
Limitations
These findings should be considered alongside a number of limitations. First, while the CBII data provide valuable insights into the pedagogical, curricular, and community factors that shape undergraduate experiences, the data are exclusively from large public institutions that may not be representative of a broader array of institutional types. The educational experiences of students at these institutions may vary widely from student experiences at smaller public colleges or private institutions, including liberal arts colleges. Additionally, System E comprised half of the max sample, thus accounting for a significant portion of the characteristics of the sample. Given the large differences in characteristics and outcomes between System E and the other systems, System E institutions are likely not representative of institutions across the country.
Second, while the alumni survey offers rich data that enhances our understanding of student experiences and career and economic outcomes, those data are only available for a small sliver of the graduates in the max sample. If this granularity was available for all graduates in the max sample, it might have provided different insights into the experiences of students and the associations between a liberal arts and sciences experience and outcomes. Similarly, the lack of prior academic achievement data in System E, which accounts for about half of the observations in the max sample, limits our ability to account for important academic differences between students in that system. Further, the absence of faculty data in the CBII dataset led us to exclude this dimension, a notable departure from the LASEO Framework, which incorporated institutional metrics on faculty.
Third, the LASEE index development process presented some limitations. In establishing scoring criteria, we set thresholds for the awarding of points that, while grounded in literature, remain subjective. In addition, rigid category cutoffs sometimes resulted in disproportionately large score differences for minor variations in metrics. For example, students with an average class size of 25 received five points while those with an average class size of 24 received 7.5 points. As a result, students with relatively similar educational experiences may have received significantly different LASEE index scores.
Fourth, our analysis does not fully control for self-selection bias. Students are not randomly assigned an educational experience. Instead, they choose to pursue their own set of experiences when deciding what to major in, what courses to enroll in, who to interact with, and what extracurriculars to participate in and organizations to join. These decisions influence the extent to which they experience a liberal arts and sciences education. Further, the factors that drive student choice, many of which are unobservable, also influence outcomes, making it especially difficult to disentangle the relationship between educational experiences and students’ outcomes. For this reason, we cannot say with certainty that the positive relationships between LASEE index scores and GPA, six-year graduation, educational attainment, career adaptability, and civic engagement are not being driven by other factors.
Avenues for future research
Given the study’s limitations, we have identified several areas for future research that are important for deepening our understanding of the value of a liberal education and its relationship to students’ academic, labor market, and civic outcomes.
- Test generalizability by applying the LASEE Frameworks to other datasets that include different institutional types and student populations.
- Examine individual metrics and attributes within the frameworks to determine which are most strongly associated with outcomes, thereby informing institutional practices and policies on institutional offerings.
- Analyze interaction effects across student subgroups to identify those who benefit most from exposure to a liberal education.
- Investigate System E more closely to understand why liberal education exposure in that context does not appear to be associated with student outcomes.
Conclusion
This research offers a nuanced, student-centered perspective on the economic and educational value of a liberal education. Using the Liberal Arts and Sciences Educational Experience (LASEE) Framework and rich, longitudinal student-level data from public colleges and universities, we examined how exposure to core liberal arts features—such as curricular breadth, active-learning pedagogy, and engagement with diverse perspectives—relates to student outcomes.
Our findings show that greater exposure to these features is positively associated with academic performance, including higher GPAs and six-year graduation rates. Among students for whom employment data were available, liberal arts experiences were also linked to a higher likelihood of pursuing graduate education and greater self-reported career adaptability. However, we found no consistent relationship between liberal arts exposure and post-graduation earnings, suggesting that these students are neither economically advantaged nor disadvantaged in the labor market. At the same time, higher six-year graduation rates among students with greater exposure to the liberal arts and sciences may indicate lower opportunity costs, allowing them to enter the workforce sooner and increasing their return on investment.
Narrowing the curriculum may hinder students’ academic outcomes, while a broader liberal arts experience does not limit their future earnings.
These results contribute to ongoing debates about the role and value of liberal education, particularly for public institutions. They suggest that narrowing the curriculum may hinder students’ academic outcomes, while a broader liberal arts experience does not limit their future earnings. In fact, students with more extensive liberal arts exposure are more likely to pursue graduate education—an outcome that may lead to higher lifetime earnings, which falls outside the scope of this study. Consistent with other research, we also found that these students demonstrate stronger civic engagement, the most robust effect observed in our analysis.
Together, these findings underscore the importance of evaluating the value of higher education using a broad set of metrics—not just early-career wages, but also civic engagement, lifetime earnings potential, and long-term career adaptability. They also affirm the value of using a student-level framework, as individual experiences within the same institution can vary widely and meaningfully shape outcomes.
While this study does not establish causality, it provides evidence that can support more balanced, data-informed discussions about how liberal education contributes to student success, economic productivity, and social cohesion. Further research is needed to explore long-term labor market outcomes and to apply this framework across a more diverse set of institutions, including private colleges and universities. Doing so would refine the LASEE Framework, enhance statistical power, and enable more nuanced comparisons across student demographics, disciplines, and institutional types.
Ultimately, continued research can deepen our understanding of the full range of outcomes associated with liberal education and inform more inclusive, evidence-based evaluations of postsecondary value. Even so, the present findings reaffirm the ongoing relevance of liberal education within public higher education and highlight the importance of considering both economic and non-economic outcomes when assessing the impact of college on individuals and society.
Appendix A: technical details on creating LASEE index scores
Below are additional details on how we adapted and applied CBII data to the LASEE Frameworks to create LASEE index scores that measured the extent to which individual students experienced the attributes of a liberal education.
Data cleaning, key data decisions, and final samples
Due to its size, CBII data are divided into eight student- or course-level studies, each further split into multiple files by university system. To prepare these data for analysis, we first cleaned each dataset, retaining relevant variables and generating new ones as needed. For course-level data, we aggregated records to the student level. After cleaning each dataset individually, we merged them into one single master dataset. We then reduced the initial sample of 1,312,280 students by excluding those with educational records prior to 2000, which were unavailable because they fell outside the dataset’s coverage; those who began their studies in 2018-19 or later, as they did not have enough time to graduate before data collection ended; those enrolled in fewer than five or more than 24 terms, to exclude students without enough time for treatment or outliers likely engaged in lifelong learning rather than a specific degree program; and those who transferred institutions, due to the inability to verify their pre-transfer records. After these exclusions, the final sample consisted of 732,327 students. Similarly, the max variables sample started with 2,801 graduates and, after dropping observations that met the above criteria, was reduced to 2,219 graduates. Table 11 provides more information on the number of students dropped for not meeting each criterion.
Table 11. Dropped observations
Student-level proxy metrics, scores, and weights
Using the dataset described above, we constructed two sets of metrics to assess individual student experiences: one set of metrics aligned with the five attributes of a liberal arts and sciences education outlined in the LASEE Max Sample Framework, and one set aligned with those five plus an additional three attributes included in the LASEE Max Variables Framework.
Some metrics we derived from student-level data and others from course-by-student level data. For example, in the LASEE Max Variables Framework, we used the student-level metric, on-campus residency for at least one year, as an indicator of “sustained social interactions amongst a diverse set of peers.” For metrics based on course-by-student level data, we performed certain calculations prior to assigning a final value to the student. For example, to measure “instruction using teaching practices that foster active learning, in classroom settings that facilitate such learning,” we used course-by-student level data to count the number of undergraduate courses each student took that we deemed conducive to active learning (i.e., discussion, field, research/independent study, internship, lab, lecture-lab combined, practicum, recitation, seminar, studio, or thesis courses). We also counted the total number of undergraduate courses each student took. We then used these numbers to calculate the share of active learning courses for each student, which we used as a metric value for the attribute, “instruction using teaching practices that foster active learning, in classroom settings that facilitate such learning.”
After assigning a value to each metric, we scored and applied weights to them to determine a score. Metric types are binary, ordinal, and continuous. Binary metrics, which indicate whether a student did or did not experience a particular feature of a liberal education, required no conversion. Students who experienced the feature received points, weighted according to our understanding of its relative theoretical contribution to that component and an overall educational experience, while those who did not experience this feature received zero points. For ordinal metrics, students received points depending on the extent of their exposure to that feature. For example, in the LASEE Max Variables Framework, students who formed three or more meaningful relationships with faculty received 10 points while students who formed one to two received five points and those who formed zero received zero points. Continuous metrics required an additional step of converting raw values into weighted scores based on the extent to which each experience aligned with a liberal education. In the rare cases where students were missing underlying data needed to calculate a metric, they were assigned a score of zero for that metric. However, this had no impact on the overall results due to its infrequency.
Unlike our previous study, which measured institutions relative to one another, we assigned points based on individual students’ experiences in absolute terms. This approach ensures that the frameworks remain applicable beyond the students included in the CBII dataset. For example, to measure “learning experiences in the curriculum that require deep and sustained engagement in particular disciplines (depth)” in both frameworks, we calculated the share of each student’s undergraduate courses that were at the upper level. Students then received a score based on this share. For instance, those whose coursework was at least 70 percent upper-level received the maximum score of four points while those whose coursework was at least 50 percent but less than 70 percent upper-level received three points. Similarly, for both frameworks, to measure the “share of undergraduate courses taken with fewer than 25 students,” we awarded full points for students who took 80 to 100 percent small courses, even though only a small portion of the sample reached this threshold. In other words, we did not assign points based on a student’s position in the distribution of experiences, but rather created thresholds based on possible values for each metric irrespective of the distribution and assigned students points according to their position relative to those thresholds.
We also adapted variables calculated by ICPSR researchers that were relevant to the measurement of the frameworks, including a score measuring the breadth of courses on students’ transcripts and three indices measuring the demographic and ethnic and racial diversity of students’ classmates, as well as the variety of their majors.
Checks for validity
Both frameworks underwent multiple rounds of iterative refinement to improve metric definitions and evaluate how scoring and weighting decisions influenced overall index scores. Since we could not assess face or external validity given that we did not know the identity of the students or the institutions or systems they were enrolled in, we focused on understanding how components, attributes, and measures drove index scores and correlated with outcomes. We examined whether specific measures disproportionately accounted for overall scores and whether the distribution of student scores were sufficiently varied, including at the low and high ends of the distribution. We then revised metric calculations or scoring and weighting procedures to address issues that we discovered in our rounds of checks. For example, we initially measured average class size using a continuous average but found it could be skewed by an unusually large class. To address this, we shifted to using discrete categories. We agreed that whether a student was enrolled in a class of 200 or 500, both scenarios reflect a departure from the characteristics of a liberal education; therefore, such classes were assigned a value of 0. This analysis deepened our understanding of the measures included and resulted in a more balanced framework.
Appendix B: LASEE Framework attributes and metrics
This appendix presents the attributes and metrics underlying each component of the LASEE Max Sample and LASEE Max Variables Frameworks. For additional details on the scoring and weighting of each metric, see the corresponding sheets in the Excel file available for download at https://sr.ithaka.org/liberal-arts-and-sciences-educational-experience-lasee-framework/. For descriptive data on each metric, see the Excel file available for download at https://sr.ithaka.org/liberal-arts-and-sciences-educational-experience-lasee-metric-statistics/.
LASEE Max Sample Framework
Pedagogy
Attribute: Instruction using teaching practices that foster active learning, in classroom settings that facilitate such learning
- Share of undergraduate courses taken with fewer than 25 students
- Average class size of undergraduate courses taken
- Share of undergraduate courses taken that facilitate active learning
Curriculum
Attribute: Exposure to multiple disciplines (breadth)
- Transcript breadth score
- Participation in undergraduate courses in the traditional disciplines of the liberal arts and sciences
Attribute: Learning experiences in the curriculum that require deep and sustained engagement in particular disciplines (depth)
- Share of undergraduate courses taken that are upper level
- Participation in upper- and lower-level undergraduate courses that are part of concentration
Attribute: Student-guided/signature approaches to the curriculum
- Participation in research/independent study course
Community
Attribute: Sustained social interactions amongst a diverse set of peers
- Average demographic diversity of classmates index score
- Average major diversity of classmates index score
- Average ethnic/racial diversity index score
LASEE Max Variables Framework
Pedagogy
Attribute: Instruction using teaching practices that foster active learning, in classroom settings that facilitate such learning
- Share of undergraduate courses taken with fewer than 25 students
- Average class size of undergraduate courses taken
- Share of undergraduate courses taken that facilitate active learning
- Participation in classes that required a lot of writing
Attribute: Deep engagement with instructors outside the classroom
- Number of meaningful relationships formed with faculty members as an undergraduate
Curriculum
Attribute: Exposure to multiple disciplines (breadth)
- Transcript breadth score
- Participation in undergraduate courses in the traditional disciplines of the liberal arts and sciences
Attribute: Learning experiences in the curriculum that require deep and sustained engagement in particular disciplines (depth)
- Share of undergraduate courses taken that are upper level
- Participation in upper- and lower-level undergraduate courses that are part of concentration
- Participation in capstone course or project
Attribute: Student-guided/signature approaches to the curriculum
- Participation in research/independent study course or working with a faculty member on research
Community
Attribute: Sustained social interactions amongst a diverse set of peers
- Average demographic diversity of classmates index score
- Average major diversity of classmates index score
- Average ethnic and racial diversity index score
- Lived for at least a year on campus
- Participation in a course or extracurricular activity with a diversity focus
Attribute: Experiences that offer knowledge and skills beyond direct course of study
- Participation in serving as a resident assistant/advisor in campus housing; residential program where students take at least one class together and attend common educational or social activities (often called a living-learning community); study abroad (taking a course outside of the U.S.); service learning or community-based learning experience; internship, practicum, co-op, or field experience; on-campus employment; or off-campus employment
Attribute: Diverse array of extracurricular activities
- Participation in clubs or honor societies related to major or other academic interest; multicultural, international, or other identity-based student group; student publication or other media; service organizations (on or off campus); performing arts or music; student government or political organizations; sorority or fraternity; intercollegiate athletics; intramural or club sports; or spiritual or religious groups
Appendix C: two-digit CIP codes and corresponding areas of study
After assigning each student a concentration based on the most frequently occurring two-digit CIP code across their coursework, we categorized them into the following areas of study: arts; foreign language; humanities; math or sciences; not associated with the liberal arts and sciences (not LAS); and social sciences. Table 12 presents the two-digit CIP codes that are part of each area of study.
| Table 12: Two-digit CIP codes by area of study | ||||
| Area of Study | Two-Digit CIP | CIP Title | ||
| Arts | 50 | Visual and Performing Arts | ||
| Foreign Language | 16 | Foreign Languages, Literatures, and Linguistics | ||
| Humanities | 9 | Communication, Journalism, and Related Programs | ||
| Humanities | 23 | English Language and Literature/Letters | ||
| Humanities | 24 | Liberal Arts and sciences, General Studies and Humanities | ||
| Humanities | 38 | Philosophy and Religious Studies | ||
| Math or Sciences | 11 | Computer and Information Sciences and Support Services | ||
| Math or Sciences | 26 | Biological and Biomedical Sciences | ||
| Math or Sciences | 27 | Mathematics and Statistics | ||
| Math or Sciences | 40 | Physical Sciences | ||
| Social Sciences | 5 | Area, Ethnic, Cultural, and Gender Studies | ||
| Social Sciences | 30 | Multi/interdisciplinary studies | ||
| Social Sciences | 42 | Psychology | ||
| Social Sciences | 45 | Social Sciences | ||
| Social Sciences | 54 | History | ||
| Not LAS | 12 | Personal and culinary services | ||
| Not LAS | 13 | Education | ||
| Not LAS | 14 | Engineering | ||
| Not LAS | 15 | Engineering Technologies/Technicians | ||
| Not LAS | 19 | Family and Consumer Sciences/Human Sciences | ||
| Not LAS | 22 | Legal professions and studies | ||
| Not LAS | 28 | ROTC | ||
| Not LAS | 29 | Military technologies | ||
| Not LAS | 31 | Parks, Recreation, Leisure, and Fitness Studies | ||
| Not LAS | 32 | Basic Skills | ||
| Not LAS | 33 | Citizenship activities | ||
| Not LAS | 34 | Health related Knowledge and Skills | ||
| Not LAS | 35 | Interpersonal and Social Skills | ||
| Not LAS | 36 | Leisure and Recreational Activities | ||
| Not LAS | 37 | Personal Awareness and Self-Improvement | ||
| Not LAS | 39 | Theology and Religious Vocations | ||
| Not LAS | 41 | Science Technologies/Technicians | ||
| Not LAS | 43 | Security and Protective Services | ||
| Not LAS | 44 | Public Administration and Social Service Professions | ||
| Not LAS | 46 | Construction Trades | ||
| Not LAS | 47 | Mechanic and Repair Technologies/Technicians | ||
| Not LAS | 48 | Precision Production | ||
| Not LAS | 49 | Transportation and Materials Moving | ||
| Not LAS | 51 | Health Professions and Related Clinical Sciences | ||
| Not LAS | 52 | Business, Management, Marketing, and Related Support Services | ||
| Not LAS | 53 | High School/Secondary Diplomas and Certificates | ||
| Not LAS | 60 | Residency Programs | ||
Appendix D: LASEE index scores by concentration
In addition to exploring LASEE max sample index scores by area of study, Table 13 presents LASEE max sample index scores by students’ concentration, based on the most frequently occurring two-digit CIP code across their coursework. Descriptive data on LASEE max variables index scores by concentration are not available due to low sample size. With the exception of a few outliers at the extremes of the index score distribution, the majority of concentrations exhibited similar scores.
| Table 13: Descriptive data on LASEE max sample index scores by concentration | ||||||||||
| Two-Digit CIP | CIP Title | n | Mean | SD | Min | Med | Max | |||
| 3 | Natural Resources and Conservation | 1,143 | 41.3 | 3.6 | 21.8 | 42.0 | 48.8 | |||
| 28 | ROTC | 138 | 37.8 | 5.1 | 26.7 | 37.9 | 50.3 | |||
| 5 | Area, Ethnic, Cultural, and Gender Studies | 4,680 | 37.8 | 5.5 | 20.0 | 37.8 | 51.3 | |||
| 16 | Foreign Languages, Literatures, and Linguistics | 12,192 | 37.5 | 5.0 | 18.2 | 37.3 | 50.8 | |||
| 50 | Visual and Performing Arts | 38,565 | 37.2 | 4.8 | 16.3 | 37.0 | 51.9 | |||
| 4 | Architecture & Related Services | 4,488 | 36.8 | 4.5 | 15.5 | 37.4 | 48.1 | |||
| 38 | Philosophy and Religious Studies | 3,005 | 36.5 | 4.6 | 21.4 | 36.3 | 48.5 | |||
| 14 | Engineering | 40,097 | 36.3 | 3.6 | 16.3 | 36.4 | 49.1 | |||
| 36 | Leisure and Recreational Activities | 3,215 | 36.1 | 3.9 | 24.0 | 36.3 | 46.7 | |||
| 9 | Communication, Journalism, and Related Programs | 26,907 | 36.0 | 4.0 | 14.0 | 36.0 | 48.6 | |||
| 54 | History | 9,689 | 36.0 | 4.6 | 17.5 | 35.9 | 48.5 | |||
| 13 | Education | 17,051 | 35.9 | 3.7 | 18.5 | 36.0 | 48.6 | |||
| 40 | Physical Sciences | 45,127 | 35.4 | 4.7 | 14.5 | 35.9 | 48.9 | |||
| 26 | Biological and Biomedical Sciences | 43,368 | 34.9 | 4.6 | 16.5 | 34.7 | 49.7 | |||
| 45 | Social Sciences | 103,443 | 34.9 | 4.5 | 13.5 | 34.6 | 50.6 | |||
| 42 | Psychology | 64,732 | 34.8 | 4.3 | 14.7 | 34.6 | 49.2 | |||
| 52 | Business, Management, Marketing, and Related Support Services | 115,742 | 34.8 | 3.7 | 14.0 | 34.9 | 50.1 | |||
| 19 | Family and Consumer Sciences/Human Sciences | 5,577 | 34.6 | 3.0 | 19.7 | 34.8 | 43.8 | |||
| 15 | Engineering Technologies/Technicians | 8,311 | 34.6 | 3.5 | 13.0 | 35.1 | 45.4 | |||
| 23 | English Language and Literature/Letters | 48,646 | 34.5 | 4.2 | 14.5 | 34.2 | 49.0 | |||
| 10 | Communications Technologies/Technicians and Support Services | 253 | 34.5 | 2.8 | 25.0 | 35.2 | 39.9 | |||
| 51 | Health Professions and Related Clinical Sciences | 30,487 | 34.2 | 3.8 | 16.5 | 34.3 | 48.4 | |||
| 22 | Legal professions and studies | 1,602 | 34.0 | 3.1 | 21.8 | 34.4 | 44.9 | |||
| 31 | Parks, Recreation, Leisure, and Fitness Studies | 16,185 | 33.9 | 3.9 | 19.1 | 33.7 | 47.9 | |||
| 43 | Security and Protective Services | 7,143 | 33.9 | 2.9 | 14.0 | 34.0 | 42.9 | |||
| 44 | Public Administration and Social Service Professions | 15,532 | 33.8 | 3.5 | 20.5 | 33.9 | 47.7 | |||
| 11 | Computer and Information Sciences and Support Services | 23,717 | 33.5 | 3.8 | 17.5 | 33.5 | 48.5 | |||
| 27 | Mathematics and Statistics | 27,636 | 33.2 | 4.1 | 15.7 | 32.9 | 49.9 | |||
| 30 | Multi/Interdisciplinary Studies | 4,990 | 32.8 | 4.1 | 18.4 | 32.6 | 48.8 | |||
| 60 | Residency Programs | 145 | 32.6 | 4.4 | 23.5 | 31.9 | 45.0 | |||
| 24 | Liberal Arts and Sciences, General Studies and Humanities | 5,073 | 32.4 | 4.4 | 18.3 | 31.7 | 50.4 | |||
| 1 | Agriculture, Agriculture Operations, and Related Sciences | 337 | 32.3 | 2.1 | 23.1 | 32.5 | 39.1 | |||
| 12 | Personal and Culinary Services | 71 | 31.5 | 2.3 | 23.5 | 31.7 | 39.4 | |||
| 32 | Basic Skills | 407 | 29.9 | 3.2 | 17.3 | 30.0 | 38.6 | |||
| 49 | Transportation and Materials Moving | 44 | 29.7 | 2.4 | 24.3 | 29.6 | 37.7 | |||
| 47 | Mechanic and Repair Technologies/Technicians | 45 | 29.3 | 2.4 | 24.9 | 29.4 | 36.3 | |||
Appendix E: GPA by area of study and concentration
A common narrative about liberal arts and sciences disciplines is that they are “easier” than STEM fields, with students in these areas often earning higher average GPAs. Because of this perception, we include controls for area of study to account for differences in GPA. However, data from table 14, which presents GPA by area of study for the max sample, does not support this claim, as the GPA of the typical student studying in the social sciences or humanities is lower than the GPA of the typical student studying outside of the liberal arts and sciences. Descriptive data on GPA by area of study for the max variables sample are not available due to low sample size.
| Table 14. Descriptive data on GPA by area of study | |||||||
| n | Mean | SD | Min | Med | Max | ||
| Foreign Language | 10,965 | 3.18 | 0.67 | 0.00 | 3.33 | 4.04 | |
| Arts | 35,184 | 3.16 | 0.62 | 0.00 | 3.29 | 4.00 | |
| Not LAS | 243,216 | 3.12 | 0.58 | 0.00 | 3.21 | 4.35 | |
| Math or Sciences | 122,992 | 3.00 | 0.69 | 0.00 | 3.12 | 4.25 | |
| Social Sciences | 167,092 | 2.98 | 0.63 | 0.00 | 3.06 | 4.24 | |
| Humanities | 72,721 | 2.84 | 0.81 | 0.00 | 3.01 | 4.05 | |
Not surprisingly, Table 15 shows that GPA variation is substantially greater at the two-digit CIP code level, with average grades ranging from as low as 2.10 in basic skills to as high as 3.32 in natural resources and conservation. It remains unclear whether these differences reflect variation in the types of students who choose these disciplines, distinct program characteristics, or a combination of both.
| Table 15. Descriptive data on GPA by concentration | |||||||
| Two-Digit CIP | CIP Title | n | Mean | SD | Min | Med | Max |
| 3 | Natural Resources and Conservation | 1,099 | 3.32 | 0.50 | 0.00 | 3.43 | 4.00 |
| 13 | Education | 15,299 | 3.25 | 0.57 | 0.00 | 3.35 | 4.00 |
| 51 | Health Professions and Related Clinical Sciences | 27,440 | 3.24 | 0.54 | 0.00 | 3.33 | 4.00 |
| 14 | Engineering | 38,512 | 3.20 | 0.48 | 0.00 | 3.25 | 4.21 |
| 16 | Foreign Languages, Literatures, and Linguistics | 10,965 | 3.18 | 0.67 | 0.00 | 3.33 | 4.04 |
| 1 | Agriculture, Agriculture Operations, and Related Sciences | 332 | 3.17 | 0.49 | 1.92 | 3.20 | 4.00 |
| 50 | Visual and Performing Arts | 35,184 | 3.16 | 0.62 | 0.00 | 3.29 | 4.00 |
| 30 | Multi/Interdisciplinary Studies | 4,228 | 3.14 | 0.66 | 0.00 | 3.28 | 4.00 |
| 26 | Biological and Biomedical Sciences | 39,552 | 3.13 | 0.59 | 0.00 | 3.22 | 4.00 |
| 28 | ROTC | 134 | 3.10 | 0.46 | 1.76 | 3.18 | 3.89 |
| 52 | Business, Management, Marketing, and Related Support Services | 103,554 | 3.10 | 0.60 | 0.00 | 3.19 | 4.35 |
| 38 | Philosophy and Religious Studies | 2,714 | 3.09 | 0.64 | 0.00 | 3.21 | 4.00 |
| 44 | Public Administration and Social Service Professions | 14,172 | 3.09 | 0.51 | 0.00 | 3.14 | 4.00 |
| 40 | Physical Sciences | 41,456 | 3.09 | 0.62 | 0.00 | 3.19 | 4.25 |
| 54 | History | 8,952 | 3.08 | 0.61 | 0.00 | 3.18 | 4.00 |
| 31 | Parks, Recreation, Leisure, and Fitness Studies | 15,375 | 3.08 | 0.54 | 0.00 | 3.17 | 4.00 |
| 36 | Leisure and Recreational Activities | 2,772 | 3.06 | 0.71 | 0.00 | 3.19 | 4.00 |
| 9 | Communication, Journalism, and Related Programs | 24,401 | 3.06 | 0.54 | 0.00 | 3.13 | 4.00 |
| 4 | Architecture & Related Services | 3,962 | 3.05 | 0.55 | 0.00 | 3.13 | 4.00 |
| 42 | Psychology | 56,619 | 3.04 | 0.60 | 0.00 | 3.11 | 4.00 |
| 19 | Family and Consumer Sciences/Human Sciences | 4,872 | 3.03 | 0.56 | 0.00 | 3.08 | 4.00 |
| 11 | Computer and Information Sciences and Support Services | 20,416 | 3.02 | 0.61 | 0.00 | 3.11 | 4.09 |
| 24 | Liberal Arts and Sciences, General Studies and Humanities | 4,876 | 2.95 | 0.71 | 0.00 | 3.07 | 4.00 |
| 45 | Social Sciences | 92,977 | 2.93 | 0.63 | 0.00 | 3.01 | 4.24 |
| 43 | Security and Protective Services | 5,548 | 2.93 | 0.65 | 0.00 | 3.03 | 4.00 |
| 60 | Residency Programs | 108 | 2.92 | 1.00 | 0.00 | 3.18 | 4.00 |
| 5 | Area, Ethnic, Cultural, and Gender Studies | 4,316 | 2.91 | 0.68 | 0.00 | 2.99 | 4.00 |
| 22 | Legal professions and studies | 1,400 | 2.83 | 0.66 | 0.00 | 2.89 | 4.00 |
| 15 | Engineering Technologies/Technicians | 6,304 | 2.81 | 0.63 | 0.00 | 2.87 | 4.00 |
| 10 | Communications Technologies/Technicians and Support Services | 166 | 2.80 | 0.50 | 0.81 | 2.79 | 3.91 |
| 23 | English Language and Literature/Letters | 40,730 | 2.68 | 0.92 | 0.00 | 2.87 | 4.05 |
| 49 | Transportation and Materials Moving | 38 | 2.61 | 0.94 | 0.70 | 2.87 | 4.00 |
| 27 | Mathematics and Statistics | 21,568 | 2.56 | 0.87 | 0.00 | 2.65 | 4.10 |
| 47 | Mechanic and Repair Technologies/Technicians | 35 | 2.41 | 1.03 | 0.00 | 2.58 | 3.92 |
| 12 | Personal and Culinary Services | 48 | 2.22 | 1.35 | 0.00 | 2.72 | 4.00 |
| 32 | Basic Skills | 308 | 2.10 | 0.87 | 0.00 | 2.16 | 4.00 |
Appendix F: analytic models
Below are the regression models examining the relationship between LASEE max sample index scores and various outcomes without System E.
- Model 1 (Naïve Model): LASEE max sample index score on outcome, without the inclusion of any controls
- Model 2: Introduces categorical system identifier
- Model 3: Introduces interaction effect between system identifier and LASEE index score
- Model 4: Introduces gender, underrepresented minority status, and international student status
- Model 5: Introduces a linear variable capturing the first academic year a student enrolled
- Model 6: Introduces a linear variable capturing the total terms a student has course data for
- Model 7: Introduces interaction effect between area of study identifier and LASEE index score
- Model 8 (Full Controls Model): Introduces standardized high school GPA
Below are the regression models examining the relationship between LASEE max variables index scores and various outcomes without System E.
- Model 1 (Naïve Model): LASEE max variables index score on outcome, without the inclusion of any controls
- Model 2: Introduces categorical system identifier
- Model 3: Introduces interaction effect between system identifier and LASEE index score
- Model 4: Introduces gender, underrepresented minority status, and international student status
- Model 5: Introduces a linear variable capturing the first academic year a student enrolled
- Model 6: Introduces a linear variable capturing the total terms a student has course data for
- Model 7: Introduces interaction effect between area of study identifier and LASEE index score
- Model 8 (Full Controls Model): Introduces standardized high school GPA
Below are the regression models examining the relationship between LASEE max sample index scores and various outcomes at System E only.
- Model 1 (Naïve Model): LASEE max sample index score on outcome, without the inclusion of any controls
- Model 2: Introduces categorical institution identifier
- Model 3: Introduces interaction effect between institution identifier and LASEE index score
- Model 4: Introduces gender, underrepresented minority status, and international student status
- Model 5: Introduces a linear variable capturing the first academic year a student enrolled
- Model 6: Introduces a linear variable capturing the total terms a student has course data for
- Model 7 (Full Controls Model): Introduces interaction effect between area of study identifier and LASEE index score
Below are the regression models examining the relationship between LASEE max variables index scores and various outcomes at System E only.
- Model 1 (Naïve Model): LASEE max variables index score on outcome, without the inclusion of any controls
- Model 2: Introduces gender, underrepresented minority status, and international student status
- Model 3: Introduces a linear variable capturing the first academic year a student enrolled
- Model 4: Introduces a linear variable capturing the total terms a student has course data for
- Model 5 (Full Controls Model): Introduces interaction effect between area of study identifier and LASEE index score
Below are the regression models examining the relationship between LASEE max sample index scores and various outcomes for LASEE index score quartiles without System E.
- Model 1 (Naïve Model): LASEE max sample index score on outcome, without the inclusion of any controls
- Model 2: Introduces categorical system identifier
- Model 3: Introduces interaction effect between system identifier and LASEE index score
- Model 4: Introduces gender, underrepresented minority status, and international student status
- Model 5: Introduces a linear variable capturing the first academic year a student enrolled
- Model 6: Introduces a linear variable capturing the total terms a student has course data for
- Model 7: Introduces interaction effect between area of study identifier and LASEE index score
- Model 8 (Full Controls Model): Introduces standardized high school GPA
Appendix G: results tables
The tables in this appendix present the results of the regression analyses, organized by sample (max sample or max variables sample) and the main independent variable (LASEE max sample index score or LASEE max variables index score). The analyses without System E are presented first; the analyses with System E follow. We present two models for each analysis. The naïve model does not include any controls and the full controls model includes all control variables available, as specified in Appendix F. For readability, coefficients are only presented for the demographic and prior academic achievement controls, where applicable. Tables for GPA, time to degree, 2020 income, and all civic scales present ordinary least squares regression beta coefficients; tables for four- and six-year graduation, employment status, and educational attainment present logistic regression log-odds ratios. The full set of tables is presented below.
- Table 16. Regression results of GPA on LASEE max sample index Score: without System E
- Table 17. Regression results of time to degree on LASEE max sample index score: without System E
- Table 18. Regression results of four-year graduation on LASEE max sample index score: without System E
- Table 19. Regression results of six-year graduation on LASEE max sample index score: without System E
- Table 20. Regression results of GPA on LASEE max variables index score: without System E
- Table 21. Regression results of time to degree on LASEE max variables index score: without System E
- Table 22. Regression results of 2020 income on LASEE max variables index score: without System E
- Table 23. Regression results of employment status on LASEE max variables index score: without system E
- Table 24. Regression results of educational attainment on LASEE max variables index score: without System E
- Table 25. Regression results of career adaptabilities on LASEE max variables index score: without System E
- Table 26. Regression results of civic and political engagement on LASEE max variables index score: without System E
- Table 27. Regression results of openness to diversity on LASEE max variables index score: without System E
- Table 28. Regression results of openness to pluralism on LASEE max variables index score: without System E
- Table 29. Regression results of political voice on LASEE max variables index score: without System E
- Table 30. Regression results of GPA on LASEE max sample index score: System E only
- Table 31. Regression results of time to degree on LASEE max sample index score: System E only
- Table 32. Regression results of four-year graduation on LASEE max sample index score: System E only
- Table 33. Regression results of six-year graduation on LASEE max sample index score: System E only
- Table 34. Regression results of GPA on LASEE max variables index score: System E only
- Table 35. Regression results of time to degree on LASEE max variables index score: System E only
- Table 36. Regression results of 2020 income on LASEE max variables index score: System E only
- Table 37. Regression results of employment status on LASEE max variables index score: System E only
- Table 38. Regression results of educational attainment on LASEE max variables index score: System E only
- Table 39. Regression results of career adaptabilities on LASEE max variables index score: System E only
- Table 40. Regression results of civic and political engagement on LASEE max variables index score: System E only
- Table 41. Regression results of openness to diversity on LASEE max variables index score: System E only
- Table 42. Regression results of openness to pluralism on LASEE max variables index score: System E only
- Table 43. Regression results of political voice on LASEE max variables index score: System E only
- Table 44. Regression results of GPA on LASEE max sample index score: bottom quartile, without System E
- Table 45. Regression results of GPA on LASEE max sample index score: second quartile, without System E
- Table 46. Regression results of GPA on LASEE max sample index score: third quartile, without System E
- Table 47. Regression results of GPA on LASEE max sample index score: top quartile, without System E
- Table 48. Regression results of six-year graduation on LASEE max sample index score: bottom quartile, without System E
- Table 49. Regression results of six-year graduation on LASEE max sample index score: second quartile, without System E
- Table 50. Regression results of six-year graduation on LASEE max sample index score: third quartile, without System E
- Table 51. Regression results of six-year graduation on LASEE max sample index score: top quartile, without System E
| Table 16. Regression results of GPA on LASEE max sample index score: without System E | |||
| (1) | (2) | ||
| VARIABLES | Naïve Model | Full Controls Model | |
| LASEE Max Sample Index Score | 0.03*** | 0.02*** | |
| (0.004) | (0.004) | ||
| Underrepresented Minority | -0.12*** | ||
| (0.006) | |||
| International | -0.09 | ||
| (0.057) | |||
| Female | 0.08*** | ||
| (0.007) | |||
| Number of Terms Enrolled | -0.02* | ||
| (0.011) | |||
| High School GPA Standardized | 0.51*** | ||
| (0.092) | |||
| Observations | 363,832 | 288,617 | |
| R-squared | 0.076 | 0.309 | |
Robust standard errors in parenthesis
*** p<0.01, ** p<0.05, * p<0.1
| Table 17. Regression results of time to degree on LASEE max sample index score: without System E |
|||
| (1) | (2) | ||
| VARIABLES | Naïve Model | Full Controls Model | |
| LASEE Max Sample Index Score | 0.02 | 0.00 | |
| (0.016) | (0.003) | ||
| Underrepresented Minority | 0.00 | ||
| (0.017) | |||
| International | 0.03** | ||
| (0.010) | |||
| Female | -0.08*** | ||
| (0.009) | |||
| Number of Terms Enrolled | 0.26*** | ||
| (0.029) | |||
| High School GPA Standardized | -0.23*** | ||
| (0.028) | |||
| Observations | 315,749 | 248,010 | |
| R-squared | 0.007 | 0.389 | |
Robust standard errors in parenthesis
*** p<0.01, ** p<0.05, * p<0.1
| Table 18. Regression results of four-year graduation on LASEE max sample index score: without System E | |||
| (1) | (2) | ||
| VARIABLES | Naïve Model | Full Controls Model | |
| LASEE Max Sample Index Score | 1.05 | 0.99 | |
| (0.033) | (0.017) | ||
| Underrepresented Minority | 0.73*** | ||
| (0.034) | |||
| International | 0.68*** | ||
| (0.049) | |||
| Female | 1.57*** | ||
| (0.106) | |||
| Number of Terms Enrolled | 0.70*** | ||
| (0.086) | |||
| High School GPA Standardized | 2.97*** | ||
| (0.508) | |||
| Observations | 342,276 | 265,984 | |
Robust standard errors in parenthesis
*** p<0.01, ** p<0.05, * p<0.1
| Table 19. Regression results of six-year graduation on LASEE max sample index score: without System E | |||
| (1) | (2) | ||
| VARIABLES | Naïve Model | Full Controls Model | |
| LASEE Max Sample Index Score | 1.14*** | 1.08*** | |
| (0.033) | (0.029) | ||
| Underrepresented Minority | 0.63*** | ||
| (0.080) | |||
| International | 0.69** | ||
| (0.104) | |||
| Female | 1.37*** | ||
| (0.133) | |||
| Number of Terms Enrolled | 1.17 | ||
| (0.140) | |||
| High School GPA Standardized | 3.32*** | ||
| (1.177) | |||
| Observations | 316,753 | 242,735 | |
Robust standard errors in parenthesis
*** p<0.01, ** p<0.05, * p<0.1
| Table 20. Regression results of GPA on LASEE max variables index score: without System E | ||||
| (1) | (2) | |||
| VARIABLES | Naïve Model | Full Controls Model | ||
| LASEE Max Variables Index Score | 0.01*** | 0.01** | ||
| (0.001) | (0.002) | |||
| Underrepresented Minority | -0.11*** | |||
| (0.024) | ||||
| Female | 0.02 | |||
| (0.012) | ||||
| Number of Terms Enrolled | -0.03** | |||
| (0.009) | ||||
| High School GPA Standardized | 0.39*** | |||
| (0.040) | ||||
| Observations | 2,079 | 1,537 | ||
| R-squared | 0.092 | 0.486 | ||
Robust standard errors in parenthesis
*** p<0.01, ** p<0.05, * p<0.1
| Table 21. Regression results of time to degree on LASEE max variables index score: without System E | ||||
| (1) | (2) | |||
| VARIABLES | Naïve Model | Full Controls Model | ||
| LASEE Max Variables Index Score | 0.00 | -0.00 | ||
| (0.011) | (0.000) | |||
| Underrepresented Minority | -0.03 | |||
| (0.022) | ||||
| Female | -0.04** | |||
| (0.009) | ||||
| Number of Terms Enrolled | 0.03** | |||
| (0.008) | ||||
| High School GPA Standardized | 0.01 | |||
| (0.041) | ||||
| Observations | 2,084 | 1,539 | ||
| R-squared | 0.003 | 0.936 | ||
Robust standard errors in parenthesis
*** p<0.01, ** p<0.05, * p<0.1
| Table 22. Regression results of 2020 income on LASEE max variables index score: without System E | ||||
| (1) | (2) | |||
| VARIABLES | Naïve Model | Full Controls Model | ||
| LASEE Max Variables Index Score | 502.79 | 535.48 | ||
| (282.927) | (681.386) | |||
| Underrepresented Minority | -25,708.25* | |||
| (11,475.240) | ||||
| Female | -9,803.38 | |||
| (7,748.243) | ||||
| Number of Terms Enrolled | -6,815.91* | |||
| (2,796.928) | ||||
| High School GPA Standardized | 4,132.81 | |||
| (9,699.317) | ||||
| Observations | 1,988 | 1,477 | ||
| R-squared | 0.002 | 0.077 | ||
Robust standard errors in parentheses
*** p<0.01, ** p<0.05, * p<0.1
| Table 23. Regression results of employment status on LASEE max variables index score: without System E | ||||
| (1) | (2) | |||
| VARIABLES | Naïve Model | Full Controls Model | ||
| LASEE Max Variables Index Score | 1.02** | 1.03 | ||
| (0.009) | (0.023) | |||
| Underrepresented Minority | 1.67*** | |||
| (0.160) | ||||
| Female | 0.56*** | |||
| (0.076) | ||||
| Number of Terms Enrolled | 0.94 | |||
| (0.065) | ||||
| High School GPA Standardized | 1.22 | |||
| (0.299) | ||||
| Observations | 2,067 | 1,528 | ||
Robust standard errors in parentheses
*** p<0.01, ** p<0.05, * p<0.1
| Table 24. Regression results of educational attainment on LASEE max variables index score: without System E | |||||
| (1) | (2) | ||||
| VARIABLES | Naïve Model | Full Controls Model | |||
| LASEE Max Variables Index Score | 1.05*** | 1.03*** | |||
| (0.006) | (0.007) | ||||
| Underrepresented Minority | 1.21 | ||||
| (0.162) | |||||
| Female | 1.19 | ||||
| (0.156) | |||||
| Number of Terms Enrolled | 0.98 | ||||
| (0.036) | |||||
| High School GPA Standardized | 1.86*** | ||||
| (0.169) | |||||
| Observations | 2,058 | 1,519 | |||
Robust standard errors in parentheses
*** p<0.01, ** p<0.05, * p<0.1
| Table 25. Regression results of career adaptabilities on LASEE max variables index score: without System E | |||
| (1) | (2) | ||
| VARIABLES | Naïve Model | Full Controls Model | |
| LASEE Max Variables Index Score | 0.00*** | 0.01*** | |
| (0.001) | (0.001) | ||
| Underrepresented Minority | 0.03 | ||
| (0.029) | |||
| Female | 0.07** | ||
| (0.023) | |||
| Number of Terms Enrolled | 0.01 | ||
| (0.006) | |||
| High School GPA Standardized | -0.07 | ||
| (0.042) | |||
| Observations | 2,037 | 1,509 | |
| R-squared | 0.006 | 0.047 | |
Robust standard errors in parentheses
*** p<0.01, ** p<0.05, * p<0.1
| Table 26. Regression results of civic and political engagement on LASEE max variables index score: without System E | |||
| (1) | (2) | ||
| VARIABLES | Naïve Model | Full Controls Model | |
| LASEE Max Variables Index Score | 0.01*** | 0.02*** | |
| (0.001) | (0.002) | ||
| Underrepresented Minority | -0.08** | ||
| (0.018) | |||
| Female | -0.03 | ||
| (0.020) | |||
| Number of Terms Enrolled | -0.01 | ||
| (0.013) | |||
| High School GPA Standardized | -0.16** | ||
| (0.037) | |||
| Observations | 2,047 | 1,516 | |
| R-squared | 0.047 | 0.103 | |
Robust standard errors in parentheses
*** p<0.01, ** p<0.05, * p<0.1
| Table 27. Regression results of openness to diversity on LASEE max variables index score: without System E | |||
| (1) | (2) | ||
| VARIABLES | Naïve Model | Full Controls Model | |
| LASEE Max Variables Index Score | 0.01*** | 0.01*** | |
| (0.002) | (0.001) | ||
| Underrepresented Minority | 0.02 | ||
| (0.034) | |||
| Female | 0.02 | ||
| (0.030) | |||
| Number of Terms Enrolled | 0.00 | ||
| (0.012) | |||
| High School GPA Standardized | -0.06 | ||
| (0.060) | |||
| Observations | 2,074 | 1,532 | |
| R-squared | 0.027 | 0.061 | |
Robust standard errors in parentheses
*** p<0.01, ** p<0.05, * p<0.1
| Table 28. Regression results of openness to pluralism on LASEE max variables index score: without System E | |||
| (1) | (2) | ||
| VARIABLES | Naïve Model | Full Controls Model | |
| LASEE Max Variables Index Score | 0.00*** | 0.01*** | |
| (0.001) | (0.002) | ||
| Underrepresented Minority | 0.11*** | ||
| (0.003) | |||
| Female | -0.06** | ||
| (0.019) | |||
| Number of Terms Enrolled | 0.02 | ||
| (0.010) | |||
| High School GPA Standardized | -0.05** | ||
| (0.017) | |||
| Observations | 2,071 | 1,532 | |
| R-squared | 0.009 | 0.076 | |
Robust standard errors in parentheses
*** p<0.01, ** p<0.05, * p<0.1
| Table 29. Regression results of political voice on LASEE max variables index score: without System E | |||
| (1) | (2) | ||
| VARIABLES | Naïve Model | Full Controls Model | |
| LASEE Max Variables Index Score | 0.09*** | 0.10*** | |
| (0.012) | (0.004) | ||
| Underrepresented Minority | -0.50** | ||
| (0.178) | |||
| Female | 0.39* | ||
| (0.174) | |||
| Number of Terms Enrolled | -0.18** | ||
| (0.055) | |||
| High School GPA Standardized | -0.30 | ||
| (0.397) | |||
| Observations | 2,054 | 1,520 | |
| R-squared | 0.086 | 0.161 | |
Robust standard errors in parentheses
*** p<0.01, ** p<0.05, * p<0.1
| Table 30. Regression results of GPA on LASEE max sample index score: System E only | |||||
| (1) | (2) | ||||
| VARIABLES | Naïve Model | Full Controls Model | |||
| LASEE Max Sample Index Score | 0.05 | 0.04 | |||
| (0.000) | (0.000) | ||||
| Underrepresented Minority | -0.25 | ||||
| (0.000) | |||||
| International | -0.12 | ||||
| (0.000) | |||||
| Female | 0.15 | ||||
| (0.000) | |||||
| Number of Terms Enrolled | -0.00 | ||||
| (0.000) | |||||
| Observations | 288,338 | 288,338 | |||
| R-squared | 0.056 | 0.127 | |||
Robust standard errors in parentheses
*** p<0.01, ** p<0.05, * p<0.1
| Table 31. Regression results of time to degree on LASEE max sample index score: System E only | |||||||
| (1) | (2) | ||||||
| VARIABLES | Naïve Model | Full Controls Model | |||||
| LASEE Max Sample Index Score | 0.07 | -0.01 | |||||
| (0.000) | (0.000) | ||||||
| Underrepresented Minority | 0.21 | ||||||
| (0.000) | |||||||
| International | 0.12 | ||||||
| (0.000) | |||||||
| Female | -0.09 | ||||||
| (0.000) | |||||||
| Number of Terms Enrolled | 0.44 | ||||||
| (0.000) | |||||||
| Observations | 204,246 | 204,246 | |||||
| R-squared | 0.010 | 0.506 | |||||
Robust standard errors in parentheses
*** p<0.01, ** p<0.05, * p<0.1
| Table 32. Regression results of four-year graduation on LASEE max sample index score: System E only | |||||||
| (1) | (2) | ||||||
| VARIABLES | Naïve Model | Full Controls Model | |||||
| LASEE Max Sample Index Score | 1.05 | 1.08 | |||||
| (0.000) | (0.000) | ||||||
| Underrepresented Minority | 0.48 | ||||||
| (0.000) | |||||||
| International | 0.68 | ||||||
| (0.000) | |||||||
| Female | 1.49 | ||||||
| (0.000) | |||||||
| Number of Terms Enrolled | 0.72 | ||||||
| (0.000) | |||||||
| Observations | 349,840 | 349,840 | |||||
Robust standard errors in parentheses
*** p<0.01, ** p<0.05, * p<0.1
| Table 33. Regression results of six-year graduation on LASEE max sample index score: System E only | ||||
| (1) | (2) | |||
| VARIABLES | Naïve Model | Full Controls Model | ||
| LASEE Max Sample Index Score | 1.12 | 1.14 | ||
| (0.000) | (0.000) | |||
| Underrepresented Minority | 0.62 | |||
| (0.000) | ||||
| International | 0.68 | |||
| (0.000) | ||||
| Female | 1.38 | |||
| (0.000) | ||||
| Number of Terms Enrolled | 0.85 | |||
| (0.000) | ||||
| Observations | 325,200 | 325,200 | ||
Robust standard errors in parentheses
*** p<0.01, ** p<0.05, * p<0.1
| Table 34. Regression results of GPA on LASEE max variables index score: system E only | ||||
| (1) | (2) | |||
| VARIABLES | Naïve Model | Full Controls Model | ||
| LASEE Max Variables Index Score | 0.02 | 0.01 | ||
| (0.000) | (0.000) | |||
| Underrepresented Minority | -0.16 | |||
| (0.000) | ||||
| Female | -0.00 | |||
| (0.000) | ||||
| Number of Terms Enrolled | -0.02 | |||
| (0.000) | ||||
| Observations | 135 | 135 | ||
| R-squared | 0.112 | 0.230 | ||
Robust standard errors in parentheses
*** p<0.01, ** p<0.05, * p<0.1
| Table 35. Regression results of time to degree on LASEE max variables index score: System E only | ||||
| (1) | (2) | |||
| VARIABLES | Naïve Model | Full Controls Model | ||
| LASEE Max Variables Index Score | -0.00 | -0.01 | ||
| (0.000) | (0.000) | |||
| Underrepresented Minority | 0.05 | |||
| (0.000) | ||||
| Female | 0.18 | |||
| (0.000) | ||||
| Number of Terms Enrolled | 0.37 | |||
| (0.000) | ||||
| Observations | 135 | 135 | ||
| R-squared | 0.000 | 0.612 | ||
Robust standard errors in parentheses
*** p<0.01, ** p<0.05, * p<0.1
| Table 36. Regression results of 2020 income on LASEE max variables index score: System E only | ||||
| (1) | (2) | |||
| VARIABLES | Naïve Model | Full Controls Model | ||
| LASEE Max Variables Index Score | 348.45 | -767.63 | ||
| (0.000) | (0.000) | |||
| Underrepresented Minority | -33,756.08 | |||
| (0.000) | ||||
| Female | 9,643.22 | |||
| (0.000) | ||||
| Number of Terms Enrolled | -6,611.67 | |||
| (0.000) | ||||
| Observations | 118 | 118 | ||
| R-squared | 0.001 | 0.255 | ||
Robust standard errors in parentheses
*** p<0.01, ** p<0.05, * p<0.1
| Table 37. Regression results of employment status on LASEE max variables index score: System E only | ||||
| (1) | (2) | |||
| VARIABLES | Naïve Model | Full Controls Model | ||
| LASEE Max Variables Index Score | 1.04 | 1.05 | ||
| (0.000) | (0.000) | |||
| Underrepresented Minority | 0.31 | |||
| (0.000) | ||||
| Female | 1.02 | |||
| (0.000) | ||||
| Number of Terms Enrolled | 0.80 | |||
| (0.000) | ||||
| Observations | 131 | 130 | ||
Robust standard errors in parentheses
*** p<0.01, ** p<0.05, * p<0.1
| Table 38. Regression results of educational attainment on LASEE max variables index score: System E only | |||
| (1) | (2) | ||
| VARIABLES | Naïve Model | Full Controls Model | |
| LASEE Max Variables Index Score | 1.05 | 1.04 | |
| (0.000) | (0.000) | ||
| Underrepresented Minority | 1.32 | ||
| (0.000) | |||
| Female | 2.67 | ||
| (0.000) | |||
| Number of Terms Enrolled | 0.77 | ||
| (0.000) | |||
| Observations | 132 | 131 | |
Robust standard errors in parentheses
*** p<0.01, ** p<0.05, * p<0.1
| Table 39. Regression results of career adaptabilities on LASEE max variables index score: System E only | ||||
| (1) | (2) | |||
| VARIABLES | Naïve Model | Full Controls Model | ||
| LASEE Max Variables Index Score | 0.00 | 0.00 | ||
| (0.000) | (0.000) | |||
| Underrepresented Minority | 0.31 | |||
| (0.000) | ||||
| Female | 0.30 | |||
| (0.000) | ||||
| Number of Terms Enrolled | -0.02 | |||
| (0.000) | ||||
| Observations | 130 | 130 | ||
| R-squared | 0.003 | 0.100 | ||
Robust standard errors in parentheses
*** p<0.01, ** p<0.05, * p<0.1
| Table 40. Regression results of civic and political engagement on LASEE max variables index score: System E only | ||||
| (1) | (2) | |||
| VARIABLES | Naïve Model | Full Controls Model | ||
| LASEE Max Variables Index Score | 0.02 | 0.01 | ||
| (0.000) | (0.000) | |||
| Underrepresented Minority | -0.16 | |||
| (0.000) | ||||
| Female | -0.07 | |||
| (0.000) | ||||
| Number of Terms Enrolled | -0.03 | |||
| (0.000) | ||||
| Observations | 131 | 131 | ||
| R-squared | 0.037 | 0.186 | ||
Robust standard errors in parentheses
*** p<0.01, ** p<0.05, * p<0.1
| Table 41. Regression results of openness to diversity on LASEE max variables index score: System E only | ||||
| (1) | (2) | |||
| VARIABLES | Naïve Model | Full Controls Model | ||
| LASEE Max Variables Index Score | 0.01 | 0.03 | ||
| (0.000) | (0.000) | |||
| Underrepresented Minority | -0.24 | |||
| (0.000) | ||||
| Female | 0.10 | |||
| (0.000) | ||||
| Number of Terms Enrolled | -0.02 | |||
| (0.000) | ||||
| Observations | 135 | 135 | ||
| R-squared | 0.045 | 0.130 | ||
Robust standard errors in parentheses
*** p<0.01, ** p<0.05, * p<0.1
| Table 42. Regression results of openness to pluralism on LASEE max variables index score: System E only | ||||
| (1) | (2) | |||
| VARIABLES | Naïve Model | Full Controls Model | ||
| LASEE Max Variables Index Score | 0.01 | 0.02 | ||
| (0.000) | (0.000) | |||
| Underrepresented Minority | -0.04 | |||
| (0.000) | ||||
| Female | -0.03 | |||
| (0.000) | ||||
| Number of Terms Enrolled | -0.02 | |||
| (0.000) | ||||
| Observations | 134 | 134 | ||
| R-squared | 0.029 | 0.103 | ||
Robust standard errors in parentheses
*** p<0.01, ** p<0.05, * p<0.1
| Table 43. Regression results of political voice on LASEE max variables index score: System E only | ||||
| (1) | (2) | |||
| VARIABLES | Naïve Model | Full Controls Model | ||
| LASEE Max Variables Index Score | 0.06 | 0.05 | ||
| (0.000) | (0.000) | |||
| Underrepresented Minority | -0.85 | |||
| (0.000) | ||||
| Female | 0.18 | |||
| (0.000) | ||||
| Number of Terms Enrolled | -0.09 | |||
| (0.000) | ||||
| Observations | 131 | 131 | ||
| R-squared | 0.032 | 0.131 | ||
Robust standard errors in parentheses
*** p<0.01, ** p<0.05, * p<0.1
| Table 44. Regression results of GPA on LASEE max sample index: bottom quartile, without System E | |||
| (1) | (2) | ||
| VARIABLES | Naïve Model | Full Controls Model | |
| LASEE Max Sample Index Score | 0.05** | 0.12*** | |
| (0.014) | (0.006) | ||
| Underrepresented Minority | -0.13*** | ||
| (0.017) | |||
| International | -0.09** | ||
| (0.031) | |||
| Female | 0.11*** | ||
| (0.013) | |||
| Number of Terms Enrolled | 0.03** | ||
| (0.010) | |||
| High School GPA Standardized | 0.56*** | ||
| (0.121) | |||
| Observations | 91,290 | 58,913 | |
| R-squared | 0.030 | 0.342 | |
Robust standard errors in parentheses
*** p<0.01, ** p<0.05, * p<0.1
| Table 45. Regression results of GPA on LASEE max sample index score: second quartile, without System E | ||||
| (1) | (2) | |||
| VARIABLES | Naïve Model | Full Controls Model | ||
| LASEE Max Sample Index Score | 0.02* | 0.03*** | ||
| (0.008) | (0.002) | |||
| Underrepresented Minority | -0.10*** | |||
| (0.009) | ||||
| International | -0.09 | |||
| (0.071) | ||||
| Female | 0.09*** | |||
| (0.010) | ||||
| Number of Terms Enrolled | -0.02*** | |||
| (0.004) | ||||
| High School GPA Standardized | 0.48*** | |||
| (0.101) | ||||
| Observations | 80,193 | 62,222 | ||
| R-squared | 0.001 | 0.252 | ||
Robust standard errors in parentheses
*** p<0.01, ** p<0.05, * p<0.1
| Table 46. Regression results of GPA on LASEE max sample index score: third quartile, without System E | |||
| (1) | (2) | ||
| VARIABLES | Naïve Model | Full Controls Model | |
| LASEE Max Sample Index Score | 0.04*** | 0.03*** | |
| (0.009) | (0.003) | ||
| Underrepresented Minority | -0.10*** | ||
| (0.006) | |||
| International | -0.11 | ||
| (0.066) | |||
| Female | 0.08*** | ||
| (0.007) | |||
| Number of Terms Enrolled | -0.04*** | ||
| (0.005) | |||
| High School GPA Standardized | 0.47*** | ||
| (0.101) | |||
| Observations | 74,284 | 61,393 | |
| R-squared | 0.004 | 0.265 | |
Robust standard errors in parentheses
*** p<0.01, ** p<0.05, * p<0.1
| Table 47. Regression results of GPA on LASEE max sample index score: top quartile, without System E | ||||
| (1) | (2) | |||
| VARIABLES | Naïve Model | Full Controls Model | ||
| LASEE Max Sample Index Score | 0.02** | 0.02*** | ||
| (0.007) | (0.002) | |||
| Underrepresented Minority | -0.12*** | |||
| (0.004) | ||||
| International | -0.07 | |||
| (0.050) | ||||
| Female | 0.06*** | |||
| (0.005) | ||||
| Number of Terms Enrolled | -0.06*** | |||
| (0.010) | ||||
| High School GPA Standardized | 0.49*** | |||
| (0.066) | ||||
| Observations | 118,065 | 106,089 | ||
| R-squared | 0.012 | 0.290 | ||
Robust standard errors in parentheses
*** p<0.01, ** p<0.05, * p<0.1
| Table 48. Regression results of six-year graduation on LASEE max sample index score: bottom quartile, without System E | ||||
| (1) | (2) | |||
| VARIABLES | Naïve Model | Full Controls Model | ||
| LASEE Max Sample Index Score | 1.22*** | 1.95*** | ||
| (0.075) | (0.046) | |||
| Underrepresented Minority | 0.61*** | |||
| (0.104) | ||||
| International | 0.59*** | |||
| (0.058) | ||||
| Female | 1.44*** | |||
| (0.173) | ||||
| Number of Terms Enrolled | 1.89*** | |||
| (0.225) | ||||
| High School GPA Standardized | 3.90*** | |||
| (1.749) | ||||
| Observations | 78,876 | 45,593 | ||
Robust standard errors in parentheses
*** p<0.01, ** p<0.05, * p<0.1
| Table 49. Regression results of six-year graduation on LASEE max sample index score: second quartile, without System E | ||||
| (1) | (2) | |||
| VARIABLES | Naïve Model | Full Controls Model | ||
| LASEE Max Sample Index Score | 1.10*** | 1.21*** | ||
| (0.033) | (0.035) | |||
| Underrepresented Minority | 0.69** | |||
| (0.125) | ||||
| International | 0.84** | |||
| (0.071) | ||||
| Female | 1.36*** | |||
| (0.157) | ||||
| Number of Terms Enrolled | 1.15 | |||
| (0.152) | ||||
| High School GPA Standardized | 3.12*** | |||
| (1.224) | ||||
| Observations | 70,172 | 52,578 | ||
Robust standard errors in parentheses
*** p<0.01, ** p<0.05, * p<0.1
| Table 50. Regression results of six-year graduation on LASEE max sample index score: third quartile, without System E | ||||
| (1) | (2) | |||
| VARIABLES | Naïve Model | Full Controls Model | ||
| LASEE Max Sample Index Score | 1.07 | 1.28*** | ||
| (0.071) | (0.011) | |||
| Underrepresented Minority | 0.68*** | |||
| (0.084) | ||||
| International | 0.83 | |||
| (0.169) | ||||
| Female | 1.32*** | |||
| (0.139) | ||||
| Number of Terms Enrolled | 0.96 | |||
| (0.090) | ||||
| High School GPA Standardized | 2.77*** | |||
| (0.984) | ||||
| Observations | 64,261 | 51,947 | ||
Robust standard errors in parentheses
*** p<0.01, ** p<0.05, * p<0.1
| Table 51. Regression results of six-year graduation on LASEE max sample index score: top quartile, without System E | ||||
| (1) | (2) | |||
| VARIABLES | Naïve Model | Full Controls Model | ||
| LASEE Max Sample Index Score | 1.07* | 0.95** | ||
| (0.041) | (0.018) | |||
| Underrepresented Minority | 0.63*** | |||
| (0.023) | ||||
| International | 0.60** | |||
| (0.154) | ||||
| Female | 1.44*** | |||
| (0.093) | ||||
| Number of Terms Enrolled | 0.77*** | |||
| (0.025) | ||||
| High School GPA Standardized | 2.88*** | |||
| (0.690) | ||||
| Observations | 103,444 | 92,617 | ||
Robust standard errors in parentheses
*** p<0.01, ** p<0.05, * p<0.1
Endnotes
- “Why Higher Ed?” Strada Education Foundation, February 13, 2018, Strada-Gallup Education Survey, https://www.strada.org/reports/why-higher-ed. ↑
- “Credentials of Value,” NCSL Foundation for State Legislatures, February 23, 2023, https://www.ncsl.org/education/credentials-of-value. ↑
- See “Tracking Trump’s Higher-Ed Agenda,” The Chronicle of Higher Education, May 13, 2025, https://www.chronicle.com/article/tracking-trumps-higher-ed-agenda, and Vimal Patel, “What the Republicans’ New Policy Bill Means for Higher Education,” The New York Times, July 3, 2025, https://www.nytimes.com/2025/07/03/us/trump-bill-education-college-student-loans.html. ↑
- Catharine B. Hill and Elizabeth Davidson Pisacreta, “The Economic Benefits and Costs of a Liberal Arts Education,” The Andrew W. Mellon Foundation, January 2019, https://sr.ithaka.org/wp-content/uploads/2024/07/Mellon-Report-Economic-Benefits-and-Costs-of-a-Liberal-Arts-Education.pdf. ↑
- Daniel Rossman, Meagan Wilson, Rayane Alamuddin, Julia Karon, Jenna Joo, and Catharine Bond Hill, “Measuring a Liberal Education and its Relationship with Labor Market Outcomes: An Exploratory Analysis,” Ithaka S+R, September 2020, https://doi.org/10.18665/sr.313872. ↑
- Education Pays 2023, College Board, Trends in Higher Education Series, education-pays-2023.pdf. ↑
- Michael F. Lovenheim and Jonathan Smith, “Returns to Different Postsecondary Investments: Institution Type, Academic Programs, and Credentials,” NBER Working Paper Series, 2022, https://www.nber.org/system/files/working_papers/w29933/w29933.pdf. ↑
- See Steven Kobik and Stephen R. Graubard, eds. Distinctly American: The Residential Liberal Arts College (New Brunswick, NJ: Rutgers University Press, 2000), Fareed Zakaria, In Defense of a Liberal Arts Education (W.W. Norton & Company, 2016); Michael S. Roth, Beyond the University: Why Liberal Education Matters (New Haven, CT: Yale University Press, 2014); Gordon Hutner and Feisal G. Mohammed, A New Deal for The Humanities: Liberal Arts and the Future of Public Higher Education (New Brunswick, New Jersey: Rutgers University Press, 2016). ↑
- Jaison R. Abel, Richard Deitz, and Yaqin Su, “Are Recent College Graduates Finding Good Jobs?,” Federal Reserve Bank of New York, 2014, https://www.newyorkfed.org/medialibrary/media/research/current_issues/ci20-1.pdf. ↑
- Diane Whitmore Schanzenbach, Ryan Nunn, and Greg Nantz, “Putting Your Major to Work: Career Paths After College,” Brookings, May 11, 2017, https://www.brookings.edu/research/putting-your-major-to-work-career-paths-after-college/. ↑
- Brad Hershbein, Melissa S. Kearney, “Major Decisions: What Graduates Earn over Their Lifetimes,” The Hamilton Project, 2020, https://www.hamiltonproject.org/papers/major_decisions_what_graduates_earn_over_their_lifetimes. ↑
- Catharine B. Hill and Elizabeth Davidson Pisacreta, “The Economic Benefits and Costs of a Liberal Arts Education,” The Andrew W. Mellon Foundation, January 2019, https://sr.ithaka.org/wp-content/uploads/2024/07/Mellon-Report-Economic-Benefits-and-Costs-of-a-Liberal-Arts-Education.pdf. ↑
- Anthony P. Carnevale, “ROI of Liberal Arts Colleges,” Georgetown University Center on Education and the Workforce, January 2020, https://cew.georgetown.edu/wp-content/uploads/Liberal-Arts-ROI.pdf. ↑
- Daniel Rossman, Meagan Wilson, Rayane Alamuddin, Julia Karon, Jenna Joo, and Catharine Bond Hill, “Measuring a Liberal Education and its Relationship with Labor Market Outcomes: An Exploratory Analysis,” Ithaka S+R, September 2020, https://doi.org/10.18665/sr.313872. ↑
- See for example the following resources (as well as those cited in the “Liberal Education’s Fraught Public Perception” section of this report): Harry Brighouse, “How Can We Understand ‘Liberal Arts Education?’” The Andrew W. Mellon Foundation, January 2019, https://uwmadison.app.box.com/s/9tkfd2uped5kr2j4dwxcgkeznpaoebgg; Liberal Arts Colleges in American Higher Education: Challenges and Opportunities, ACLS Occasional Paper 59 (2005), American Council of Learned Societies, https://www.acls.org/wp-content/uploads/2021/11/Occasional_Paper_059_2005.pdf; and Michael S. Roth, Beyond the University: Why Liberal Education Matters, New Haven: Yale UP, 2014. ↑
- We used the following faculty-level and institution-level data sources: Higher Education Research Institute (HERI) Faculty Survey; Annual Survey of Colleges (ASC), Thomson Peterson’s Undergraduate Licensed Database; and Integrated Postsecondary Education Data System (IPEDS). ↑
- For this table and all subsequent tables and analyses, we present unweighted sample sizes (n). ↑
- To investigate these differences, we ran a series of correlations between the LASEE max sample and max variables index scores by component. We found strong positive associations between the pedagogy components (r = .75) and curriculum components (r = .73) across the two frameworks. In contrast, the correlation between the community components was only moderately correlated (r = .29). ↑
- “Provided in alumni survey” indicates that the scale was already included in the CBII data that we received and did not require additional calculations on our part. ↑
- “Derived from alumni survey” indicates that we constructed the scale using survey items from the CBII data. ↑
- We combined arts and foreign language due to small sample sizes. ↑
- All System G survey respondents are missing data on high school GPA—the measure we used to control for prior academic achievement—resulting in the exclusion of about 500 students from the full controls model. To assess whether the exclusion of these students or the inclusion of high school GPA as a control affected the results, we ran an additional model on the reduced sample without high school GPA as a control. The results from all three analyses (i.e., with System G and no high school GPA, without System G and high school GPA, and without System G and no high school GPA) were very similar, providing evidence that the removal of System G was not responsible for the significant positive associations. ↑
- We assessed each scale’s internal reliability and consistency, or how closely related the items within the scale were, by calculating Cronbach’s alpha. The career adaptabilities alpha, on a scale from zero to one, was 0.86, indicating high reliability and internal consistency. ↑
- Cronbach’s alpha for the four scales ranged from 0.72 to 0.86, indicating high reliability and internal consistency. ↑
- Regression tables for these analyses are not included in the report but are available upon request. ↑