Technology in Higher Education in Prison Programs
A Report on Survey Findings
-
Table of Contents
- Executive Summary
- Key Findings
- Introduction
- Methodology
- Survey Findings
- Discussion
- Conclusion: What is Access? What is Equity?
- Recommendations
- Acknowledgements
- Appendix 1: Number of Programs Responding by State
- Appendix 2: Responding Programs with Desktop Computer Access by State
- Appendix 3: Responding Programs with Laptop Access by State
- Appendix 4: Responding Programs with Tablet Access by State
- Appendix 5: LAN/WAN Connection by State
- Appendix 6: Internet Connection by State
- Appendix 7: Additional Write-in Responses, LMS
- Appendix 8: Additional Write-In Responses, Software
- Endnotes
Executive Summary
The landscape of higher education in prison programming is in the midst of a sea change. After eight years of the Second Chance Pell experiment, federal Pell grant funding for students who are incarcerated was fully reinstated on July 1, 2023.[1] While Pell reinstatement will likely increase educational access for students who are incarcerated, it has also raised concerns about the role of educational equity, digital fluency, and surveillance in higher education in prison programming.
While Pell reinstatement will likely increase educational access for students who are incarcerated, it has also raised concerns about the role of educational equity, digital fluency, and surveillance in higher education in prison programming.
In an effort to make visible the national landscape of access to educational technology in prison education programs, Ithaka S+R launched a first-of-its-kind national survey in the fall of 2022, with grant funding support from Ascendium Education Group. The survey asked respondents about student access to technology in their higher education in prison program, collecting demographic information before focusing on four thematic areas: technological devices, learning management systems and software, network connection and internet access, and future technology plans. In the wake of this survey, we also conducted follow-up interviews to gather more qualitative data about major thematic issues that surfaced in the survey analysis. Below, we present our findings and a discussion that highlights areas where tension is likely to develop in the partnership between correctional and higher education institutions, as well as areas for future research.
Key Findings
- The majority of programming is still provided fully in-person.
- Twenty-four percent of respondents noted that their students do not have access to any technological device.
- Across regions, desktop computers are more commonly available for educational purposes than tablets.
- Programs whose students use laptops express greater satisfaction with student technology access and use.
- Most students cannot use technological devices to access library resources.
- Respondents were optimistic that they will be able to increase student access to technology within two years; however, responses were considerably more mixed regarding internet access.
Introduction
The reinstatement of federal Pell grant funding for students who are incarcerated has made it all the more imperative to understand the landscape of technological access in higher education in prison programs. The field is experiencing increased visibility–undergoing a sea-change in technology implementation in the wake of the COVID-19 pandemic—and becoming a growing market for information technology companies.[2] As part of Ithaka S+R’s ongoing study of the relationship between technology and self-censorship in higher education in prison, in the fall of 2022 we conducted the Technology in Higher Education in Prison Programs Survey. This project was made possible with grant funding provided by Ascendium Education Group. The results of this survey, and our analysis of their implications for the field, are presented in this report.
Our goal in surveying programs across the United States was to make visible the uneven landscape of technological implementation, access, and use in higher education in prison programs. Despite the relatively modest number of programs, information about what models for technological adoption, access, and use already exist is virtually inaccessible. This has led to a situation where administrators, educators, and department of corrections (DOC) and facility staff must make decisions that directly impact educational quality and equity without a comprehensive view of available options and existing frameworks. This survey is a first step in making such information transparent and available.
The Technology in Higher Education in Prison Programs Survey is the first national survey to inquire in depth about technology access among individual programs. Ninety-three individual program staff or administrators completed the survey and provided insight into what technologies are available to their students, how program instruction is provided, how students complete coursework, and what the program’s future plans regarding technology look like. Additionally, we contacted six individual programs for follow-up interviews to gather more qualitative data and to better understand the lived experience working within the survey’s data. It is important to note that not all existing programs responded to the survey, so while this report provides a valuable national snapshot of the field, it does not reflect the whole picture.
We hope these survey findings will be of value to myriad stakeholders—including students who are incarcerated, higher education in prison programs, higher education institutions, individual correctional facilities, and state departments of correction. We also believe that accreditation agencies, policy makers, and those researching the field will find value in the report. The data provides evidence that can assist with program development, expansion, and course and degree offerings; raises important questions about best instructional practices; and provides a first glimpse at different possible paths for programs to integrate technological devices, software, and networked information. While serious logistical and security concerns remain for both program administrators and departments of corrections, qualitative responses and quantitative evidence of the existence of programs with robust technological access suggest that access can be provided safely for educational purposes without putting security or safety at risk or compromising the availability of in-person instruction. However, to do so requires coordination, collaboration, and alignment across stakeholders, and there are likely to be sites of tension.
Methodology
Survey Instrument Development
The survey was designed from the ground up based on the guidance of both project advisors and data gathered from exploratory informational interviews with higher education in prison program administrators.
The survey was divided into five sections. The first, Facility and Program Information, gathered demographic information about how and where the program operates, who it serves, and whether it is credit bearing. The second section, Technological Devices and Access, was designed to gather information on what hardware students have access to, as well as when and where they are able to use that hardware. The third section of the survey, Learning Management Systems and Software, asked what programs and course management software students are able to access. The fourth section, Network Connection and Internet, focused on gathering information about how information is distributed to or accessed by students. In the final section, Future Plans, we asked respondents to reflect on their plans for implementing or expanding access to technology in their program.
The survey was programmed in Qualtrics. We tested the survey instrument internally and also conducted cognitive interviews with program administrators to ensure that the survey was sensible, comprehensible, and comprehensive. The complete draft of the survey contained 78 questions; however, the survey logic ensured that respondents were only asked questions relevant to their own program.
Population and Distribution
The survey population included higher education in prison program administrators, coordinators, and faculty, responding on behalf of their programs. We used a closed contact list for distribution to ensure that no program was polled more than once. Creating a contact list for distribution, however, posed several challenges.
Our original plan was to survey education directors in state departments of correction. This approach offered the dual benefits of providing a comparable dataset and limiting selection and response biases. Such an approach would have gathered only high-level information and might have obscured differences at the program or facility level. Moreover, preliminary interviews with education administrators and practitioners demonstrated that discrepancies between policies and their practical application sometimes reduced student access to technology or information in meaningful ways. These preliminary interviews also revealed that some facilities had access to technologies that postsecondary students could not reliably or regularly utilize. For example, computer labs and printing privileges might be primarily utilized by students enrolled in state provided programming (high school or GED programming, Career and Technical Education, etc.), and only marginally available to postsecondary students, if at all. Given these concerns, to capture the most granular and accurate picture of technology access for higher education programs, we opted to direct the survey to individual programs.
While this allowed us to gather more nuanced data, it raised additional complications to establishing a contact list and distributing the survey. To create our contact list, we drew from two separate databases: the Alliance for Higher Education in Prisons (AHEP) directory and the contact list for the Department of Education’s Second Chance Pell sites. At the time of the survey launch, the AHEP database had last been updated in 2021 requiring us to manually update our contact list.
Participation
Of the 441 people who received survey invitations through direct email, 93 completed the survey. An additional six partial responses were recorded, but they contained only demographic information and were removed prior to analysis.
Responses were received from programs operating in 36 states as well as the District of Columbia and the Federal Bureau of Prisons (see Figure 1). Distribution across states was largely comparable, with four outliers that either have more higher education programming than others or were overrepresented. To protect the privacy and confidentiality of respondents, we will only disclose response numbers per state when providing broad, state-level information about what technological devices respondents indicated students can access in their programs.
Qualitative Data Gathering
In addition to the quantitative data referenced above, we also solicited qualitative data in three ways. First, we provided the “Other (please specify)” option where appropriate in the survey and connected it to an open-text response, allowing respondents to optionally provide qualitative information about their selections. Second, periodically throughout the survey respondents were provided with additional opportunities to provide more nuanced information via optional prompts for open-text responses. Finally, after performing an initial analysis of survey data, we conducted follow-up interviews with six respondents whose survey responses were particularly notable. Interviewees were selected from geographically and programmatically diverse programs, and we ensured that two respondents were drawn from each of the following categories: programs where students have access to multiple technological devices; programs where students have access to a single type of technological device, and programs where students have no access to technological devices.
While the quantitative inventory provides a snapshot of technological access in higher education in prison programs, the qualitative data collected provides additional clarity in understanding the uniqueness and complexity that each individual program faces, and the thematic issues that cut across programs.
Figure 1: Program Responses by State
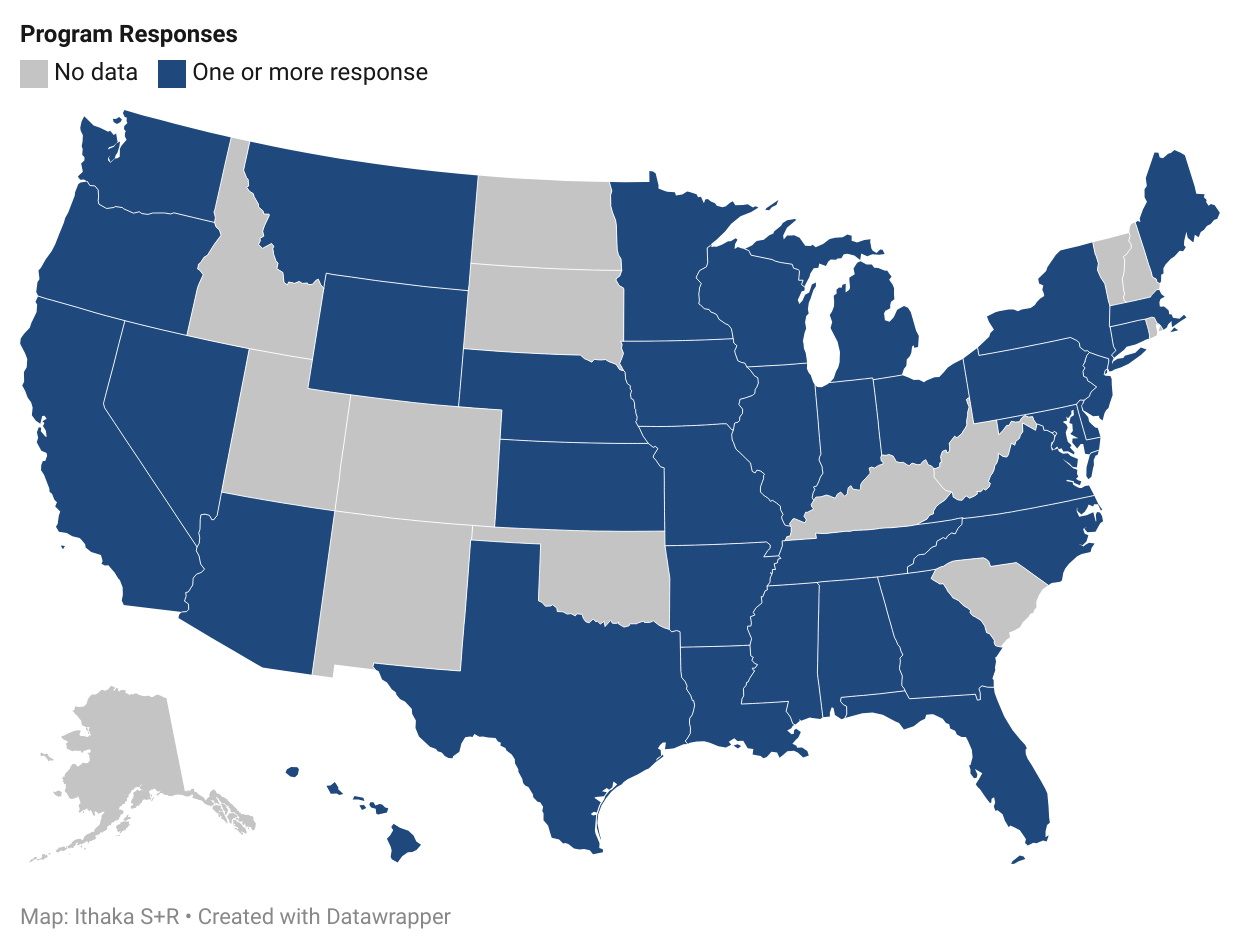
This map shows the states from which survey responses were received. We did not receive responses from programs in 14 states: Alaska, Colorado, Idaho, Kentucky, New Hampshire, New Mexico, North Dakota, Oklahoma, Rhode Island, South Carolina, South Dakota, Utah, Vermont, and West Virginia. It is important to note that the absence of data is not necessarily reflective of an absence of programs or access, but simply that no programs operating in those states provided complete answer sets to the survey. For a breakdown of the number of responses received per state, please see Appendix 1.
Data Analysis and Reporting
This report contains aggregate and stratified survey findings. We analyzed quantitative data using frequency analysis. Percentages are rounded to the nearest whole number throughout the report; therefore, percentages may not add up to 100 percent, and answer options with very low selection rates may round down to 0 percent. Some figures are based on multiple selection data and, for this reason, may add up to more responses than there were participants; this is not an error.
To protect the anonymity of survey participants, program information is only reported in aggregate, and we have limited stratifications by state or region. We have also de-identified all quotes from follow-up interviews to ensure that interviewees may not be identified through their responses.
Survey Findings
Program Characteristics
Data gathered on program characteristics suggested that while most instruction is delivered fully in-person, there is an increasing prevalence in the field of alternate hybrid and remote delivery models, which respectively utilize digital tools such as video conferencing for partial or full instructional delivery. The COVID-19 pandemic also had a role in accelerating uptake, as the Vera Institute of Justice’s June 2023 report on the impacts of Second Chance Pell described.[3]
Eighty-eight percent of respondents indicated that their programs offer credit bearing courses.[4] While this is encouraging, more research is needed on major and degree offerings and the transferability of credits, and this was out-of-scope of our survey.
The majority of respondents (53 percent) indicated that programs provided instruction fully in-person, and 20 percent noted that instruction was provided in a hybrid format (noted as “some in-person, some remote”). Only 15 percent indicated that instruction was provided through distance or virtual instruction.
Qualitative responses described how the pandemic impacted instructional approaches, but that its effects varied across programs. Four programs noted that their instructional method was or is affected by COVID-19. For example, one program began fully remote instruction in response to the pandemic and maintained remote instruction in its wake. Three others noted that while quarantine procedures led to virtual or correspondence instruction at the height of the pandemic, they have since returned to in-person instruction.
Technological Devices
This part of the survey prioritized gathering data about student access to desktop computers, laptops, and tablets for program-related purposes, with the aim of making a transparent inventory of what types of technological devices are already available to students in higher education in prison programs. We understood this as a first step toward understanding dimensions of the quality of access—i.e. how and when technology might be used, and for what purposes. In addition to providing a snapshot of how existing programs make use of desktop computers, laptops, and tablets, the data collected here suggests that there is no single way to provide access to students. Indeed, in some cases, programs already deploy multiple types of technological devices for different purposes or across different educational settings. When considered together, however, responses show that students with laptops are more likely to have broader access and more time with the device than their peers with desktop or tablet access.
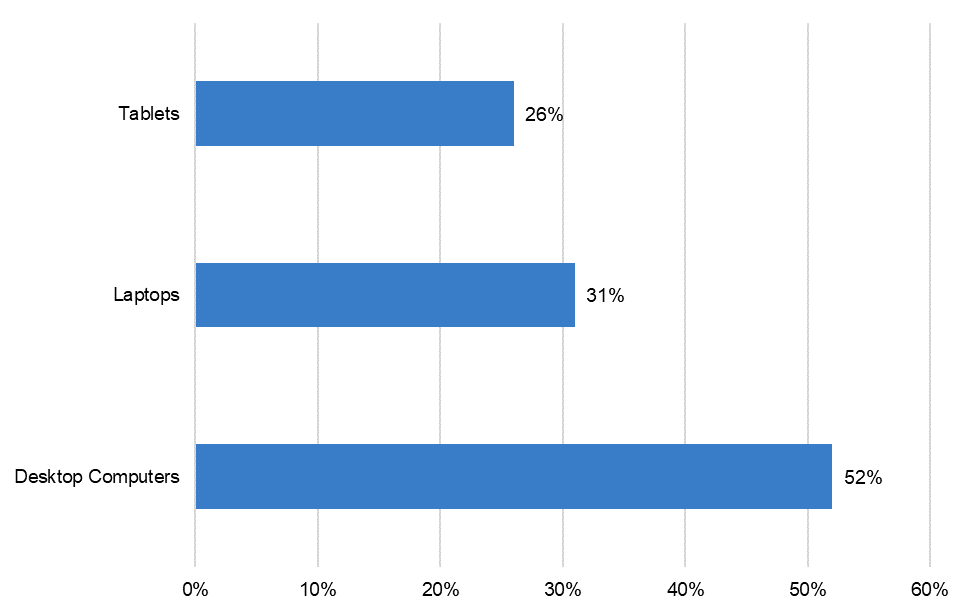
Roughly one quarter of respondents (24 percent) indicated that their students do not have access to desktop computers, laptops, or tablets for educational purposes. Nearly half (47 percent) noted that students in their program had access to one of these types of technological devices, and a quarter (26 percent) indicated that students in their program had access to two of these types. Only three percent of respondents (3 responses) indicated that students in their program had access to all three types for educational purposes.
Desktop computers are the most common device students can access for educational purposes according to respondents (52 percent), with laptops (31 percent) and tablets (26 percent) trailing behind (see Figure 2).
Figure 2: Technological Device and Percentage of Programs with Student Access
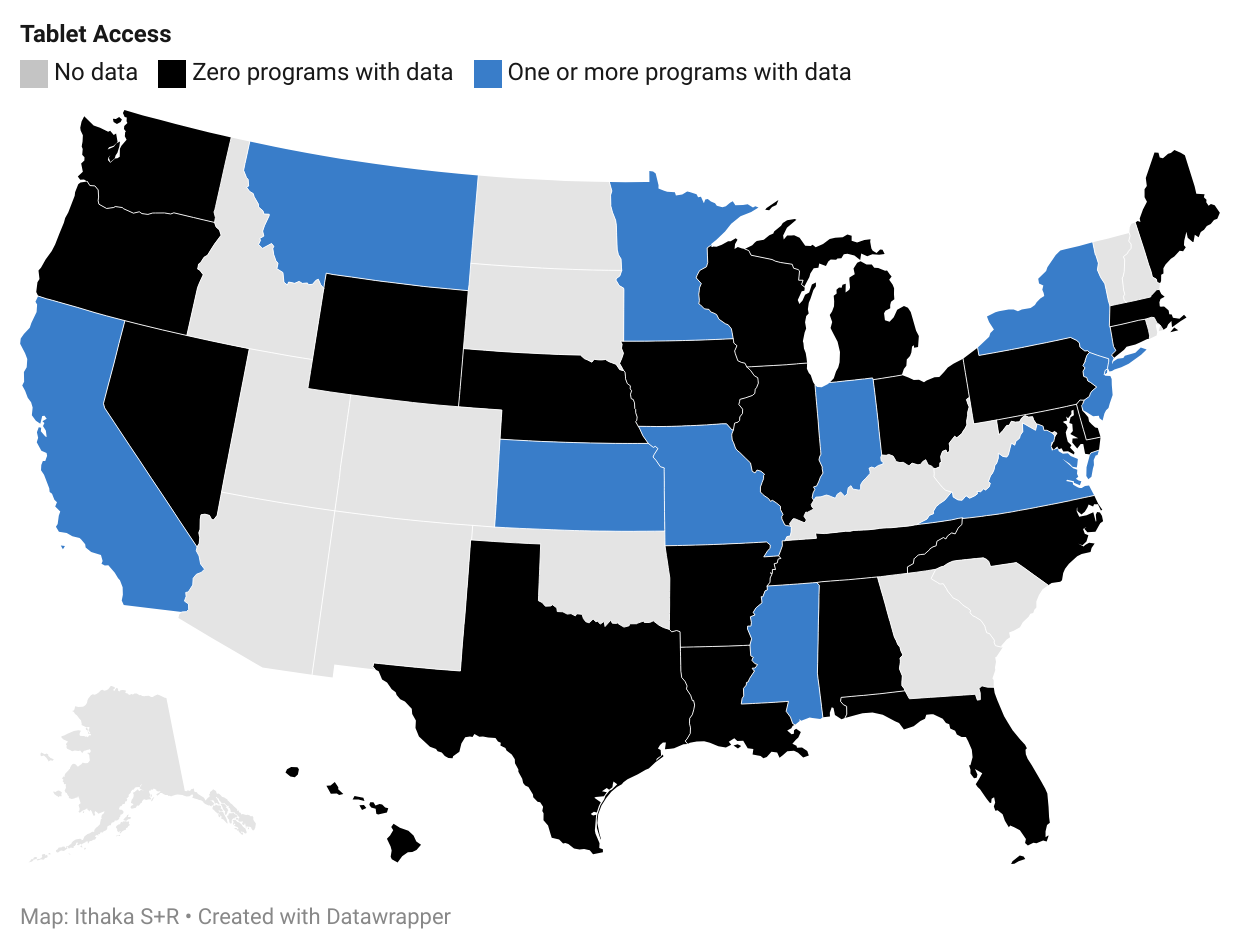
We stratified device access by state to understand how access breaks down along regional lines.[5] The results are largely mixed, with technological access varying by program or facility (see Figures 3, 4, 5).[6]
- Respondents whose students did not have access to desktop computers, laptops, or tablets came from the Federal Bureau of Prisons and the following states: Arkansas,* Connecticut, Delaware, Illinois, Massachusetts, Michigan, Nevada, New Jersey,* New York, North Carolina, Oregon, Tennessee,* and Texas.[7]
- In every case where multiple programs from the same state responded, device access differed across programs.
- There were several cases where respondents were not sure if students had access to technological devices: programs in California, New Jersey, and Tennessee noted uncertainty at the accessibility of desktop computers; programs in Montana and Pennsylvania noted uncertainty at the accessibility of laptops; and programs from Alabama, Arkansas, Pennsylvania, and Tennessee noted uncertainty at the accessibility of tablets.
- Desktop computers are the most available technological device across regions and tablets are the least available technological device, for educational purposes, across regions.
- Laptop access is more regionally concentrated than other devices. Programs where students had access to laptops were primarily concentrated in the Northeast, the West Coast, and the Gulf Coast. Programs in Nebraska, North Carolina, and Virginia also have laptop access.
Note: The following maps show where one or more program in a state indicated the students have access to a device, where all respondents within a state indicated that students have no access to devices, and where no data was collected.
Figure 3: Responding Programs with Desktop Computer Access by State
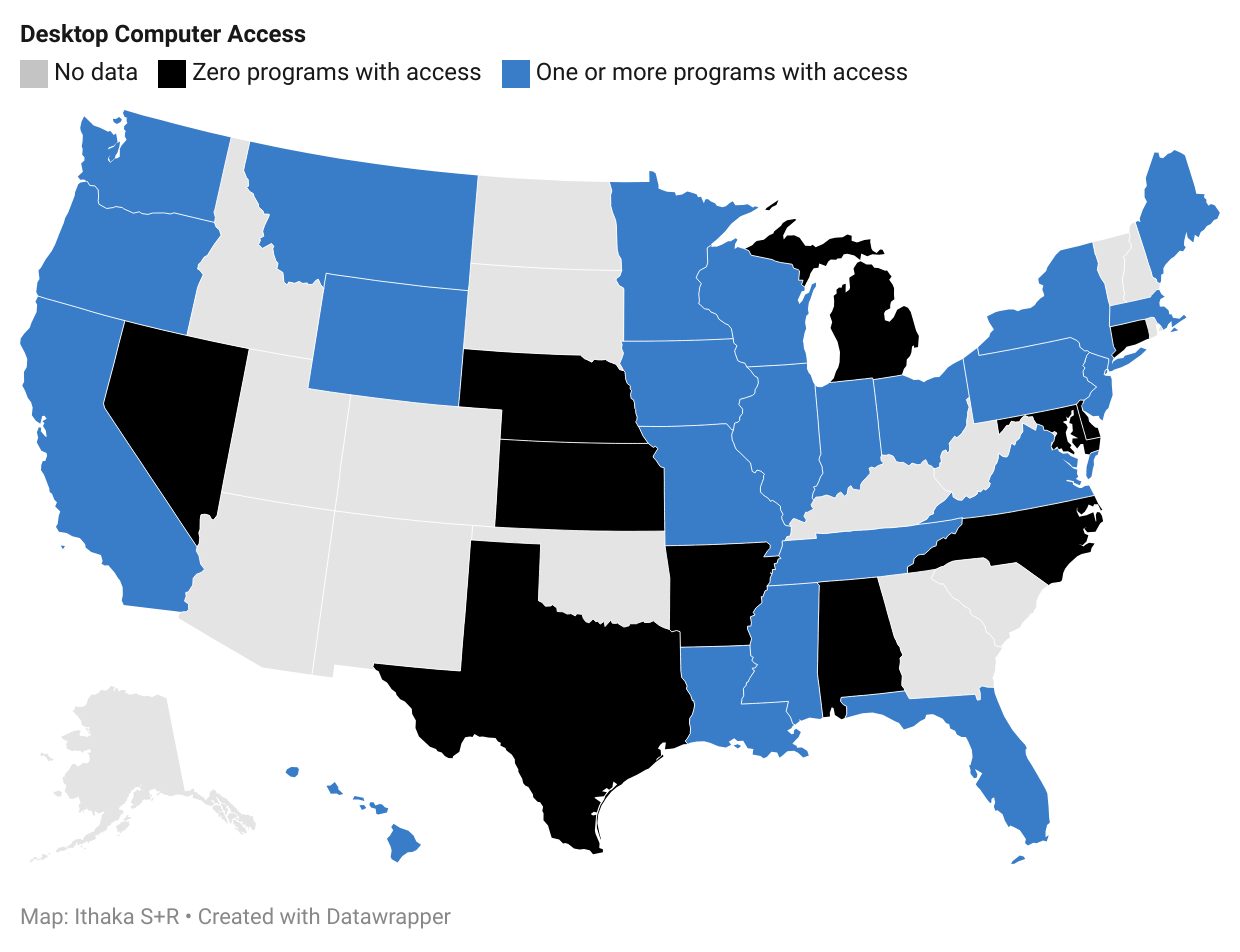
Figure 4: Responding Programs with Laptop Access by State
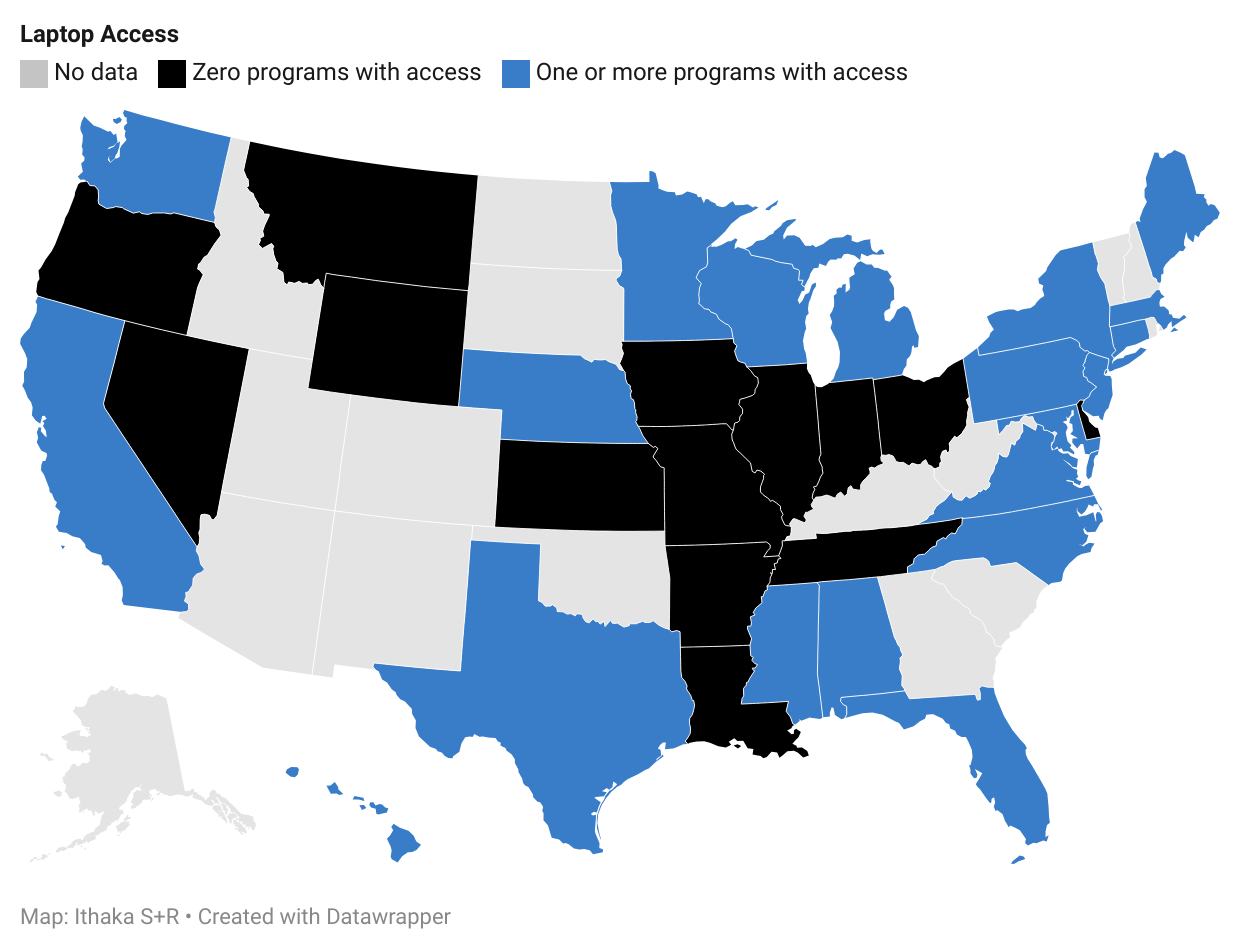
Figure 5: Responding Programs with Tablet Access by State
Laptop and Tablet Providers
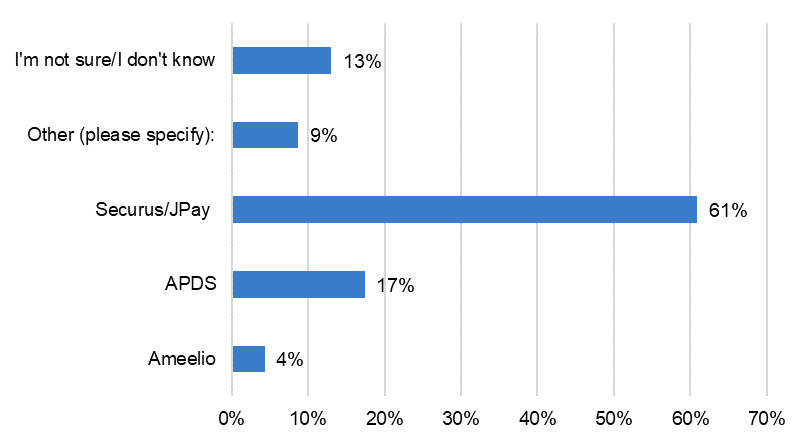
Respondents who confirmed that students in their program can use laptops or tablets for educational purposes were asked which kind were available. More than two-thirds (69 percent) of programs with laptops use a PC brand (see Figure 6). Ten percent of respondents were unsure which laptop brands their students can access and 14 percent selected more than one brand. Of responding programs whose students use tablets, over half (61 percent) are provided by Securus/JPay, while APDS is the second most utilized service provider at 17 percent (see Figured 7).[8]
The data collected suggests that, despite their increasing ubiquity inside prisons, tablets are seldom accessible for higher educational program-related purposes (see Figure 2 above). Furthermore, less than one-third of programs with tablet access (29 percent) use these to deliver instruction. Forty-two percent of responding programs noted that tablets are used to distribute reading materials, assignments, or other course related material.
Figure 6: Types of Laptops Available
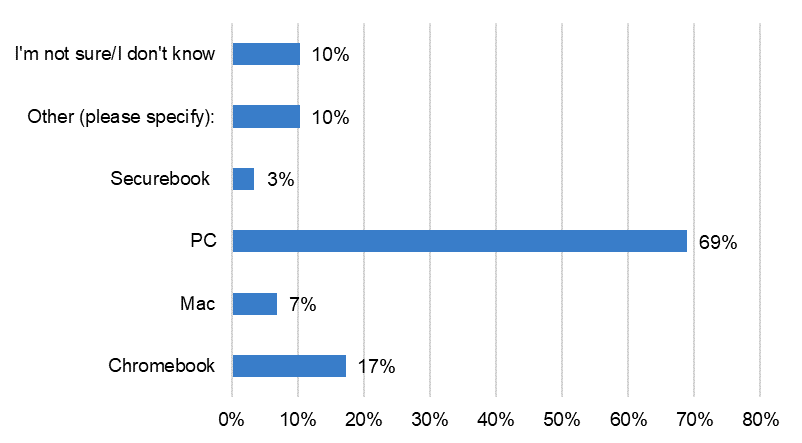
Figure 7: Tablet Providers
Purchasing and Maintaining Devices
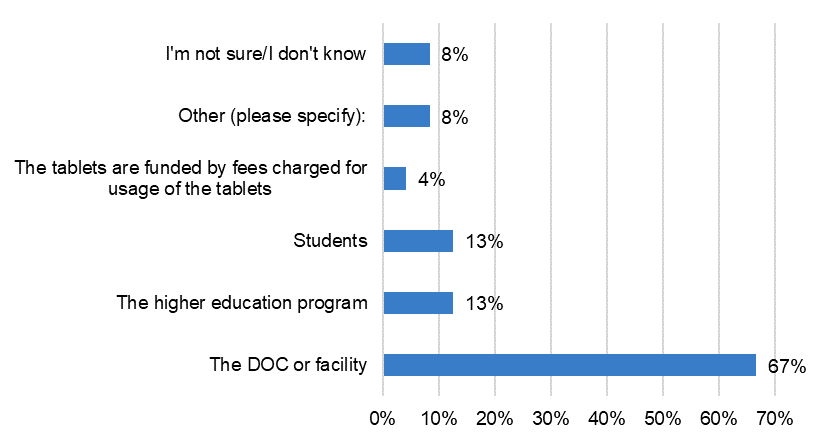
The data illustrates that technological devices are purchased and maintained with funding drawn from a variety of sources and that the balance for how devices are purchased or funded varies across platforms and programs. Among responding programs, the DOC or facility is more than twice as likely (60 percent) to be responsible for purchasing and/or maintaining desktop computer hardware than the program (29 percent) or “Other” organizations or funds (21 percent). The financial burden is shared more equally in the case of laptops: 55 percent of respondents indicated that higher education in prison programs provide them and 45 percent indicated that they are provided by the facility or the DOC.[9] In the case of tablets, the DOC or facility is primarily responsible for device purchase or maintenance (67 percent), but the picture is more complex due to the variety of tablet service models on the market (see Figure 8).
Figure 8: Party Responsible for Purchasing/Maintaining Tablets
Device Availability
During survey research and testing, we were made aware that having access to a technological device meant very different things from program to program and facility to facility. To account for this and get a clearer picture of how students are using these devices, we asked respondents a series of questions focusing on where and when students have access to technology. The results, alongside qualitative responses in the survey and in follow-up interviews, emphasize the importance of creating sustained and robust access in conditions favorable to learning.
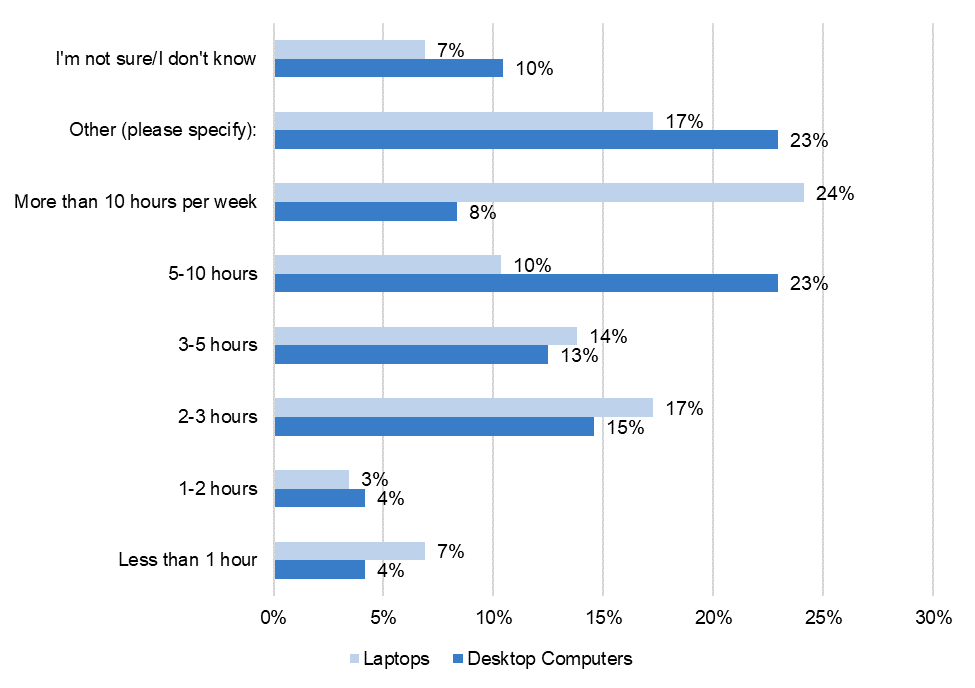
We asked respondents whose students had access to desktop or laptop computers, “Approximately how much time per week can students spend using a [desktop computer, laptop]?” The survey provided eight possible responses (see Figure 9). The variations in how long students have access also suggest that there are a variety of different programmatic approaches to using technology. At the same time, the results suggest that time of access is largely comparable across desktop computers and laptops. However, there is a large discrepancy between the peak access in each group: desktop computer access peaks at about five-10 hours per week (23 percent), while 24 percent of students using laptops could use them for more than 10 hours per week. It is noteworthy that “Other (please specify)” was among the top two selected responses for both devices, and the optional write-in specifications provided suggest that access varies depending on other factors, such as: “security level,” “student and program,” “course,” and “staff coverage and student schedules.”
Figure 9: Approximate Time Per Week Students Can Use Desktop Computers, Laptops
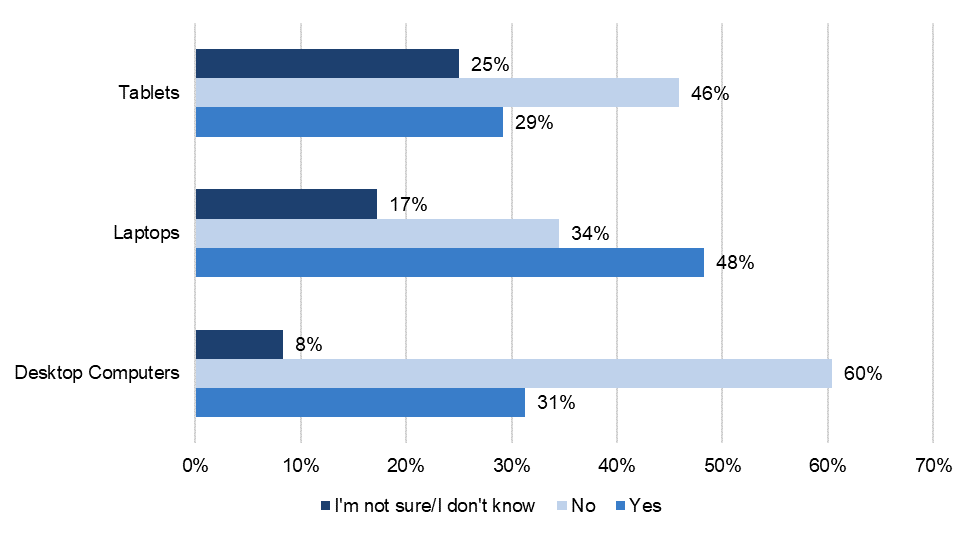
While questions about access measured in hours afford a certain level of quantitative comparability, we understand that course topics, design, delivery, and assignments can vary greatly. Asking whether students had sufficient time with the devices revealed a major discrepancy by device: only programs with laptops indicated that their students had sufficient access to the device to adequately complete coursework and assignments (Figure 10).
Figure 10: Do students have sufficient access to [desktop computers, laptops, tablets] to adequately complete coursework and assignments?
Where and When Devices Are Accessible
Respondents who indicated that their students had access to desktops, laptops, or tablets were also asked a set of platform-specific follow-up questions to ascertain when and where devices are available to students. Questions focusing on laptops and tablets were framed slightly differently to account for their mobility.
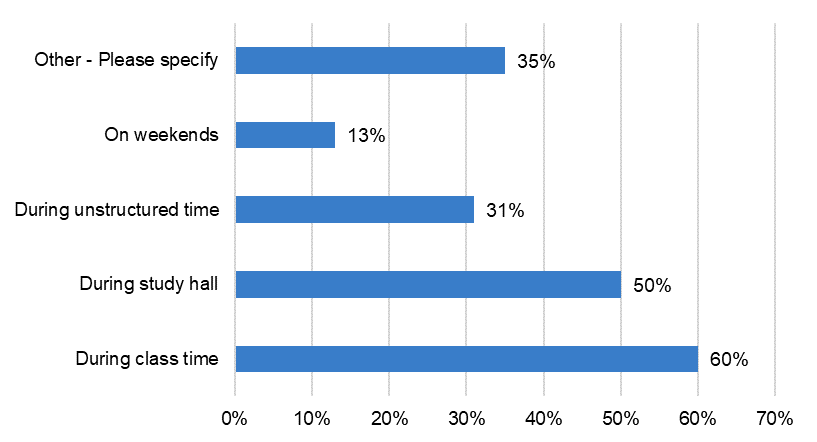
Desktop computers are most available to students during class time (60 percent) and during study hall periods (50 percent, see Figure 11). Thirty-one percent of respondents indicated that students have access to desktop computers during unstructured time.[10] Only 13 percent of respondents indicated that students have access to desktop computers on weekends. More than a third of respondents (35 percent) chose “Other – Please specify” and 14 of these respondents provided additional information about desktop computer access.[11] Two of these respondents shared that access varies with security level, and two noted that while students are technically granted access, this access is very limited in practice.
Figure 11: When desktop computers are available to students
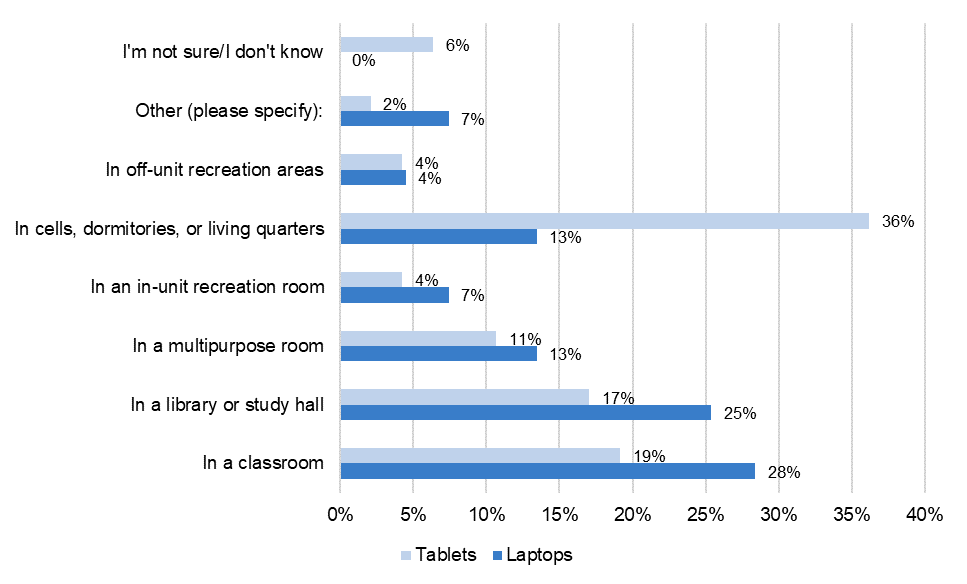
Laptops were most frequently accessible in a classroom (28 percent) or in a library or study hall (25 percent, see Figure 12). Despite their portability, only 13 percent of respondents indicated that laptops were available in a multipurpose room and 13 percent indicated they are available in cells, dormitories, or living quarters. Tablets, on the other hand, were more likely to be available in cells, dormitories, or living quarters (36 percent), with availability in a classroom (19 percent) or in a library or study hall (17 percent) trailing behind that.
Figure 12: Where students have access to laptops, tablets
Resources, Services, and Peripherals Available via Device
In addition to gathering data about general device access, the survey also asked how students were able or allowed to utilize devices, focusing on library resource access, printing abilities, and peripherals available. These questions gather data that may provide important secondary information about digital and information literacy practice and learning environments.
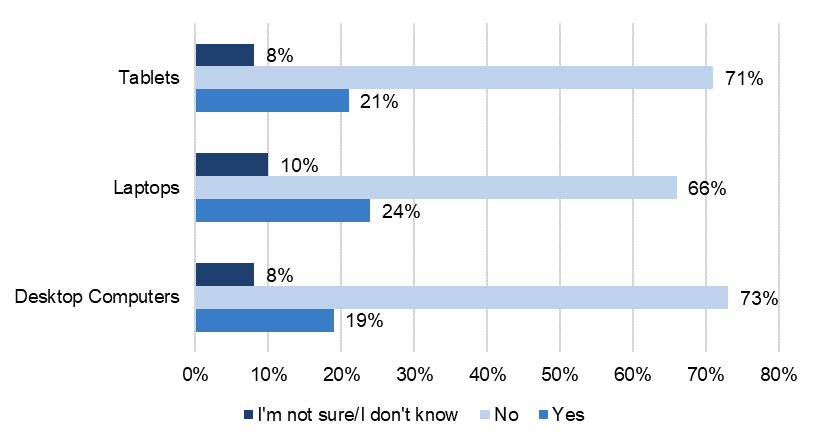
The majority of respondents (70 percent) indicated that their students cannot access library resources using technological devices. Only 21 percent of respondents indicated that students had this access, and 9 percent were unsure. The percentages did not vary greatly by specific device: 73 percent of students using desktops, 71 percent using laptops, and 66 percent using tablets are unable to access library resources. (see Figure 13).
Figure 13: Library Resource Access by Device
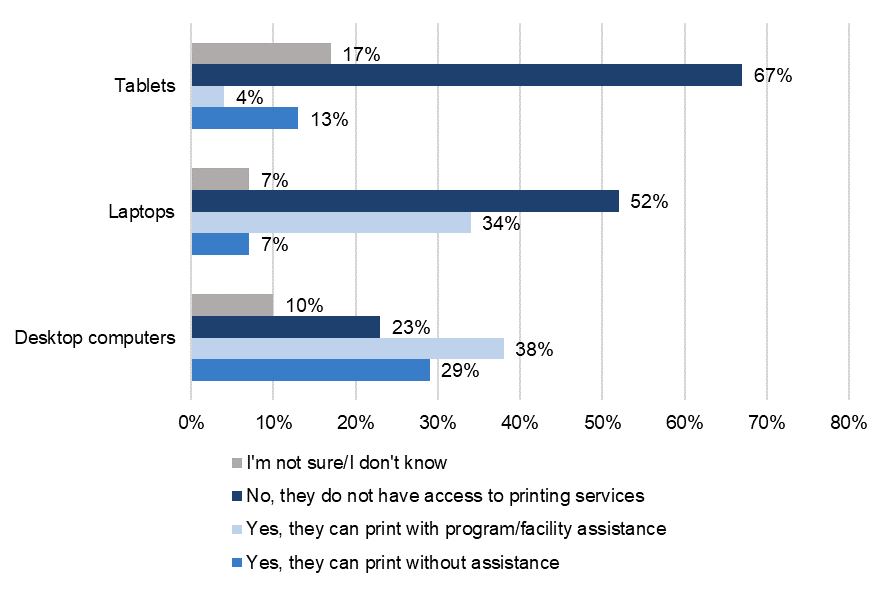
The ability to print from electronic devices might allow students to bring readings or assignments to other areas of the facility, or to print assignments to hand in. Students with access to desktop computers were by far the most likely to be able to print (29 percent without assistance, 39 percent with assistance from program or facility staff), compared to students with laptops (7 percent without assistance, 34 percent with assistance) and students with tablets (13 percent without assistance, 4 percent with assistance, see Figure 14).
Figure 14: Printing Access by Device
Devices such as headphones, mice, and external keyboards are crucial for digital learning, with headphones allowing students to better hear lectures, discussions, or course videos and with computer mice being integral navigating and using even simple programs effectively on computers. Headphones may also have additional utility for students who are neurodiverse, partially deaf, or experiencing hearing loss. Despite their utility, just over half (54 percent) of respondents whose students access desktop computers said that students can use headphones, compared to 38 percent of students with access to laptops or tablets. Seventeen percent of those responding about laptops and four percent of those responding about tablets noted that students could use computer mice. Twenty-nine percent of tablet respondents indicated their students can use external keyboards, meaning the majority of students using tablets must type using the on-screen digital keyboard.
Using Technological Devices to Communicate
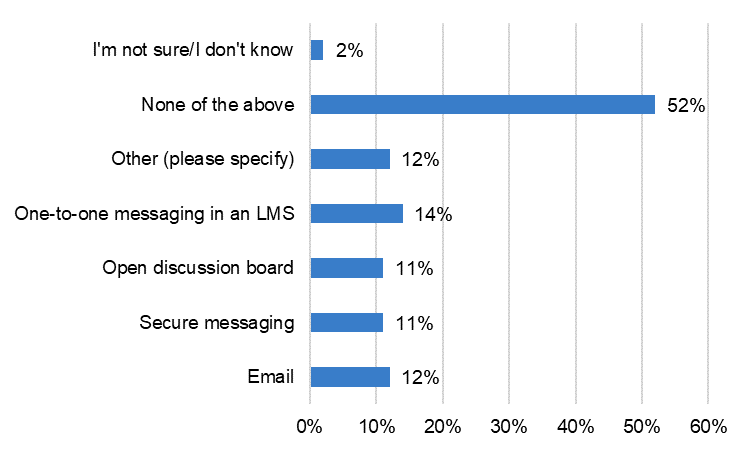
Outside of carceral contexts, professors and students regularly communicate and coordinate via email or direct message. These methods allow students to ask questions, get additional information, request accommodations, and address attendance, performance, or personal issues. We asked respondents whose students use desktop computers, laptops, or tablets whether students were able to communicate with their instructor through the device (see Figure 15). More than half of those responding about desktop computers (56 percent) and laptops (55 percent) indicated that none of these communication methods were available to their students. Students with tablets have more access to email (21 percent) than those using desktop computers (10 percent) or laptops (7 percent). Access to secure messaging services was similarly limited (21 percent had access via tablets, 8 percent desktop computers, 7 percent laptops). Zero percent of students using tablets can access open discussion boards, compared to 13 percent on desktop computers and 17 percent on laptops.
Figure 15: How students can communicate with instructors on technological devices
Syncing and Updating Data on Laptops and Tablets
Portable devices such as laptops and tablets may in some cases be carried and kept by students, theoretically allowing students to continue coursework and to remain in contact with program staff, administrators, or instructors outside of dedicated class or lab time. Optimizing setups such as this, though, requires regular networked access so that students can download course materials and communications and upload completed assignments and send correspondence to faculty, staff, and advisers.
The greatest share of respondents (38 percent) indicated that laptops upload and download information via Wi-Fi. Thirty-one percent indicated that information is uploaded and downloaded through other means, 17 percent were unsure how information is uploaded or downloaded, and 14 percent indicated that a wired connection is needed.
Tablets may sync either wirelessly (33 percent) or through a shared docking station (50 percent). Seventeen percent of respondents were unsure how tablets synced.
We asked respondents whose students had access to laptops or tablets, “How often can students sync [laptops, tablets] to upload and download information?” (see Figure 16 for full response rates). Nearly half of those responding about laptops (45 percent) were unsure and just over one quarter (28 percent) indicated that “time varies or is inconsistent.” The rates for these were nearly flipped for tablets: just over one quarter of respondents (29 percent) indicated “I’m not sure/I don’t know” and just under half (46 percent) indicated that “time varies or is inconsistent.” This means that roughly three quarters of those responding (73 percent for laptops) and (75 percent for tablets) do not have a clear and consistent idea of how often their students can upload and download information on these devices.
Figure 16: Frequency with which students can sync [laptops, tablets] to upload and download information
| Answer | Laptops | Tablets |
| As frequently as students would like | 3% | 17% |
| More than once per day | 3% | 0% |
| Once per day | 7% | 4% |
| More than once per week | 7% | 4% |
| Once per week | 3% | 0% |
| Less than once per week | 0% | 0% |
| Time varies or is inconsistent | 28% | 46% |
| I’m not sure/I don’t know | 45% | 29% |
Additional Classroom and Educational Devices
The final set of questions on technological devices focused on the instructional technology available for higher education in prison programs. To understand what types of instructional technology are and are not regularly available, we asked all respondents to provide information about additional educational technology. Respondents were given ten choices (see Figure 17).[12] Four of the respondents that selected “Other (please specify)” noted that faculty had access in classrooms to desktop computers, laptops, or tablets for instructional purposes, three others noted that technology was available for web conferencing or distance instruction.
Figure 17: Additional Classroom and Educational Devices
| Device type | Percent of Responses |
| DVD players | 56% |
| Blu Ray players | 1% |
| Streaming media | 11% |
| Projectors | 45% |
| Smartboards | 24% |
| Televisions | 52% |
| Typewriters | 10% |
| Other (please specify) | 17% |
| None of the above | 9% |
| I’m not sure/I don’t know | 0% |
In terms of funding classroom and other educational devices, 56 percent indicated that the higher education program was responsible for purchasing additional classroom and educational materials, with 31 percent answering that the DOC was responsible. Just under one quarter of respondents (22 percent) selected “Other (please specify),” indicating that a different agency or funder was responsible, and nine percent of respondents indicated that they did not know or were unsure who was responsible.
Conclusion: Technological Devices
Based on the responses to this section of the survey, it appears that the majority of students in higher education in prison programs likely do not have enough time or robust enough access to the programs and databases necessary for digital coursework or to develop crucial digital literacy, informational literacy, and research skills. Some data here also suggests there are additional inequities that may hinder students as they transition from education in prison to education on the outside, namely the lack of in-classroom technology and the inability for most students to communicate directly with faculty or to access collegiate services such as advising and counseling.
Learning Management Systems and Software
The survey asked respondents a series of questions about the availability of, and student access to, learning management systems and software. We aimed to gather data about the availability, functionality, and use of a broad array of software programs, tools, or platforms for online learning, training, and course management. This section will be of particular interest to those considering establishing new digital course management services or providing alternative software programs for composition, video conference, or distance instruction. In short, we found that students and faculty in less than a third of the programs surveyed have access to learning management systems and that when an LMS is available, its functionality is often reduced. Moreover, data on software suggests that students in these programs have both fewer options and less access to software to complete coursework than their counterparts on the outside.
For the sake of consistency, we chose to use only the term “learning management system” in this section of the survey as opposed to “customer relationship management,” “virtual learning environment,” or “digital learning environment.” We encouraged respondents whose program utilizes one of these products, programs, or suite of digital tools known as to answer the questions in this section with that system or product in mind.
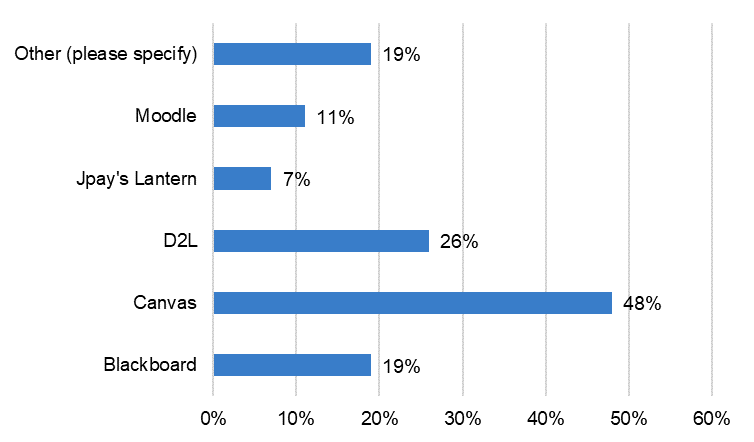
Twenty-nine percent of all respondents indicated that their faculty and students have access to a learning management system. Forty-eight percent of these respondents’ programs use Canvas (see Figure 18).[13] D2L was the second most selected option at 26 percent. Blackboard and Moodle accounted for roughly one-fifth and one-tenth of responses, respectively.
Figure 18: LMS Accessible to Faculty and Students
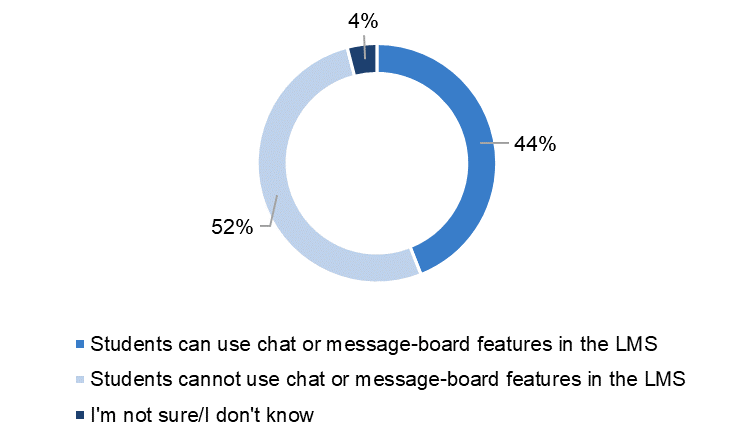
Sixty-seven percent of respondents indicated that the LMS students use for their coursework is the same as that used by the main campus (see Figure 19). Fifty-two percent of respondents noted that students cannot use the chat or message-board features of the LMS, while 44 percent indicated they can (see Figure 20).
Figure 19: Main Campus and HEP LMS Parity
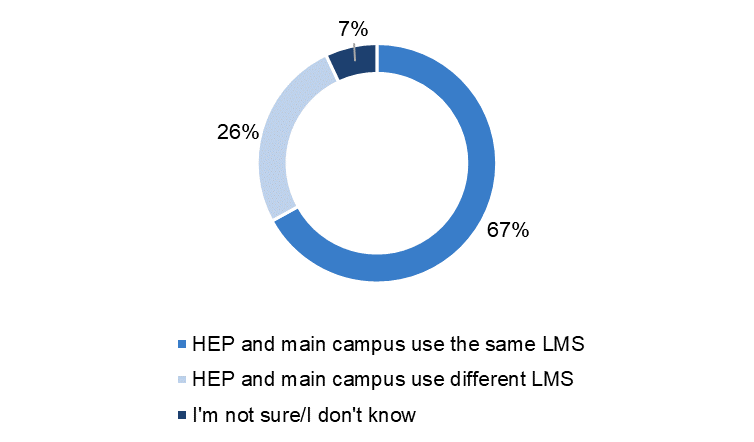
Figure 20: Access to LMS Chat or Message-Board Features
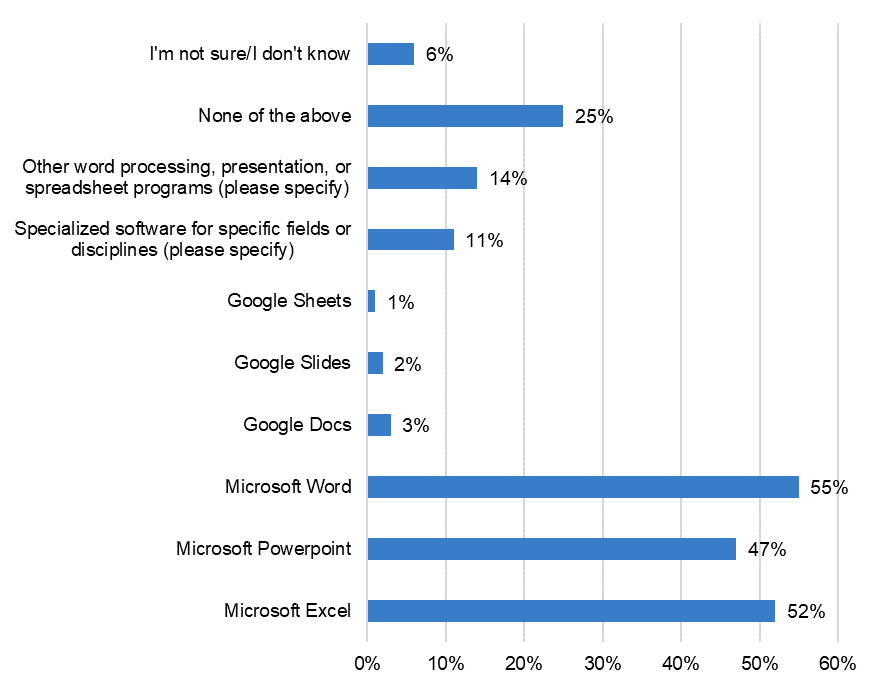
We also asked all respondents to select which software programs their students can access. Microsoft products were by far the most available, with Microsoft Excel (52 percent), Word (55 percent), and PowerPoint (47 percent) usable in roughly half of programs (see Figure 21). Fourteen percent noted that their students use “other word processing, presentation, or spreadsheet programs,” and 11 percent indicated that students have access to “specialized software for specific fields or disciplines.”
Figure 21: Which of the following software programs do students have access to?
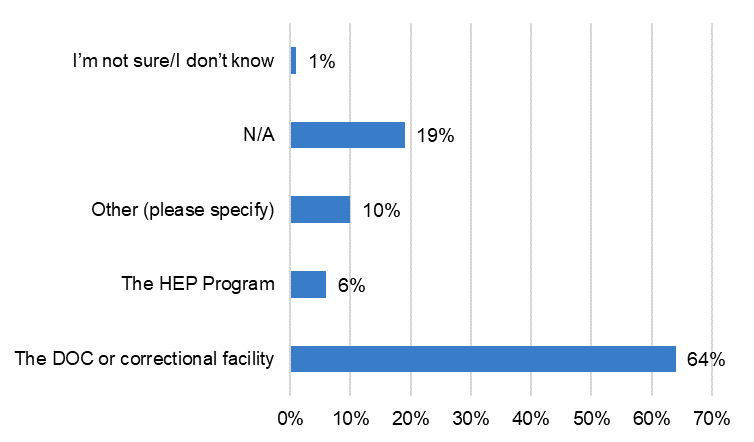
Thirty-two percent of respondents answered that “HEP program faculty and staff do not have access to video conferencing programs,” which is the same share of respondents that indicated that faculty and staff could use Zoom to communicate with students (see Figure 22). The next most available video conferencing programs were WebEx (17 percent) and Microsoft Teams (12 percent).[14] When asked who decides what video conferencing programs faculty or staff can use, 64 percent of respondents said the DOC or correctional facility is responsible (see Figure 23). Ten percent of respondents selected “Other” and noted that the DOC and program collaborated on such decisions. Only six percent indicated that the higher education in prison program makes that decision.
Figure 22: Video Conferencing Program Access for Communication or Instruction
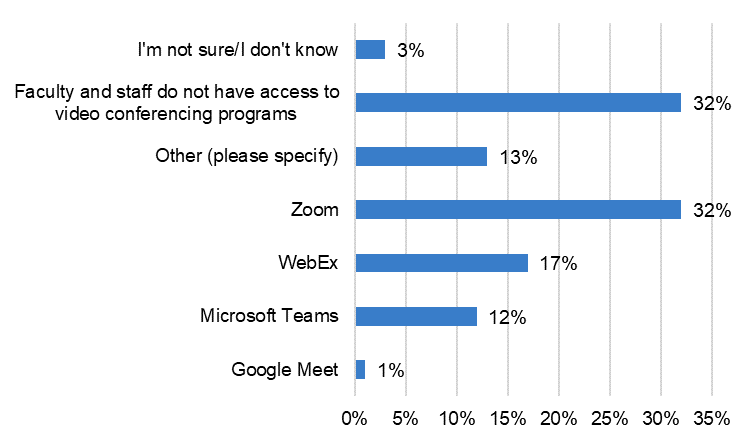
Figure 23: Party Responsible for Selecting Video Conferencing Programs
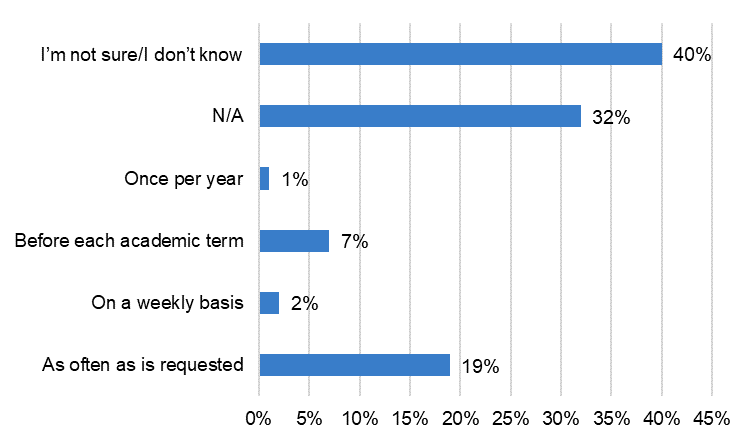
More than half of respondents (58 percent) believe that students do not “have sufficient access to software programs to adequately complete coursework and assignments” (see Figure 24).[15] When asked how frequently software programs can be added or updated on the devices students use in their programs (see Figure 25), 40 percent of respondents selected, “I’m not sure/I don’t know” and an additional 32 percent selected “N/A.”[16] Nineteen percent of respondents selected “as often as is requested.”
More than half of respondents (58 percent) believe that students do not “have sufficient access to software programs to adequately complete coursework and assignments.”
Figure 24: Sufficiency of Student Access to Software Programs
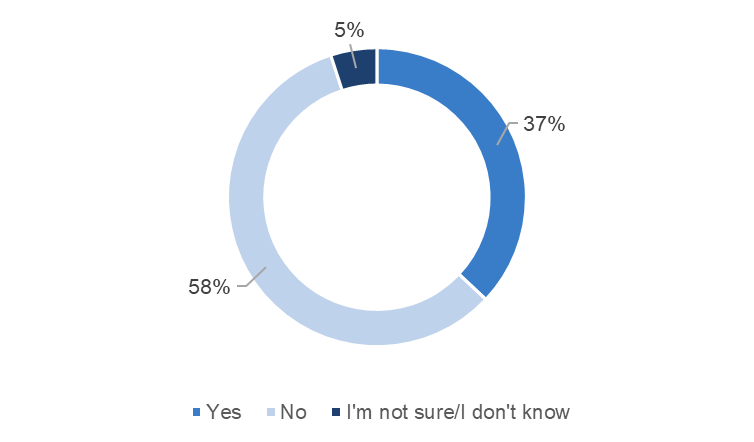
Figure 25: Frequency of Software Additions or Updates
Conclusion: Learning Management Systems and Software
The data on LMS and software demonstrates that while a fair number of students in higher education in prison programs have access to technological devices, how those devices can be used often differs greatly from students on the main campus. Less than a third of all respondents (29 percent) said that their students and faculty have access to an LMS, and when we take into account that the LMS may differ from that used by the main campus and is likely to have several crucial functions used for dialogue and discussion disabled, it is clear that the way students use and experience technology differs greatly. Moreover, the limited access to web conferencing platforms and perceptions that students have inadequate access to software raise questions about instructional equity.
Network Connection and Internet Access
The penultimate section of the survey briefly focused on how students in higher education in prison programs accessed networked information or files. Qualitative responses to the survey as well as our follow-up interviews suggest that program administrators see internet access as critical to student equity and success, but also one of the biggest challenges to implement. This section focused on gathering information about how local area or wide area networks are deployed to give students secure access to digital files, and how different versions of internet access are currently used.[17]
The ability to access networked information, especially to use the internet, is crucial for developing both information and digital literacy, key skills for success in higher education and contemporary life. The data gathered here indicates that the majority of students do not have access to either area networks or the internet.
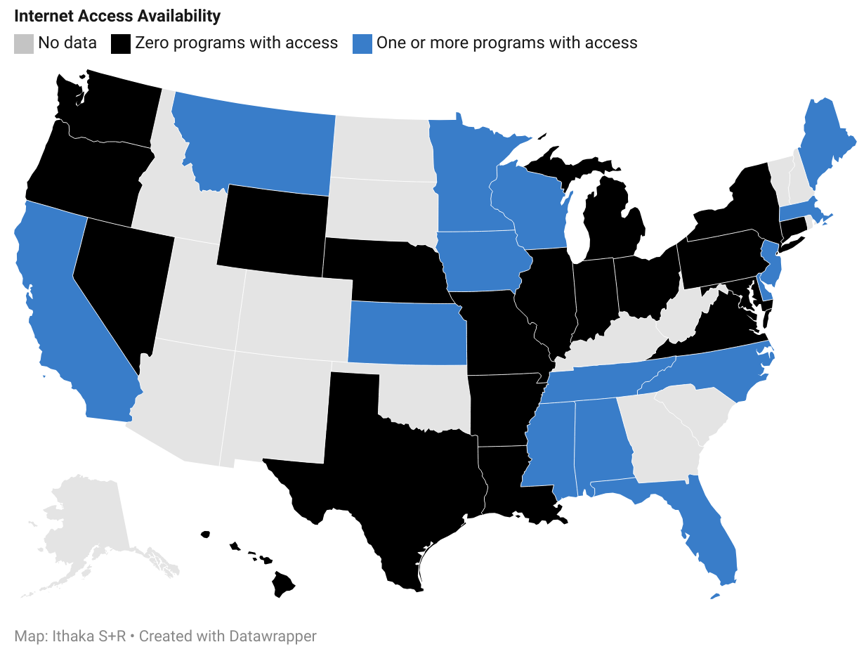
The majority of students do not have any network access (see Figure 26 and 27, Appendices 5 and 6). Survey results suggest that when students can access a closed network, such as a LAN or WAN, it is more commonly through “desktop computers in a computer lab” (20 percent) than via laptops (nine percent) or tablets (nine percent). Only 15 percent of respondents said that their programs could utilize LAN or WAN.[18] And among those 15 percent of respondents, access to LAN and WAN was roughly as likely to occur through wireless connections (43 percent, six respondents) as it was through wired connections (50 percent, seven respondents). Twenty-four percent indicated that their students have internet access to whitelisted websites. Sixty-six percent noted that “no internet access is available” to their students.[19]
Note: The following maps show where one or more programs in a state indicated that students have access, where all respondents within a state indicated that students have no access, and states from which no data was collected.
Figure 26: LAN/WAN Connection by State
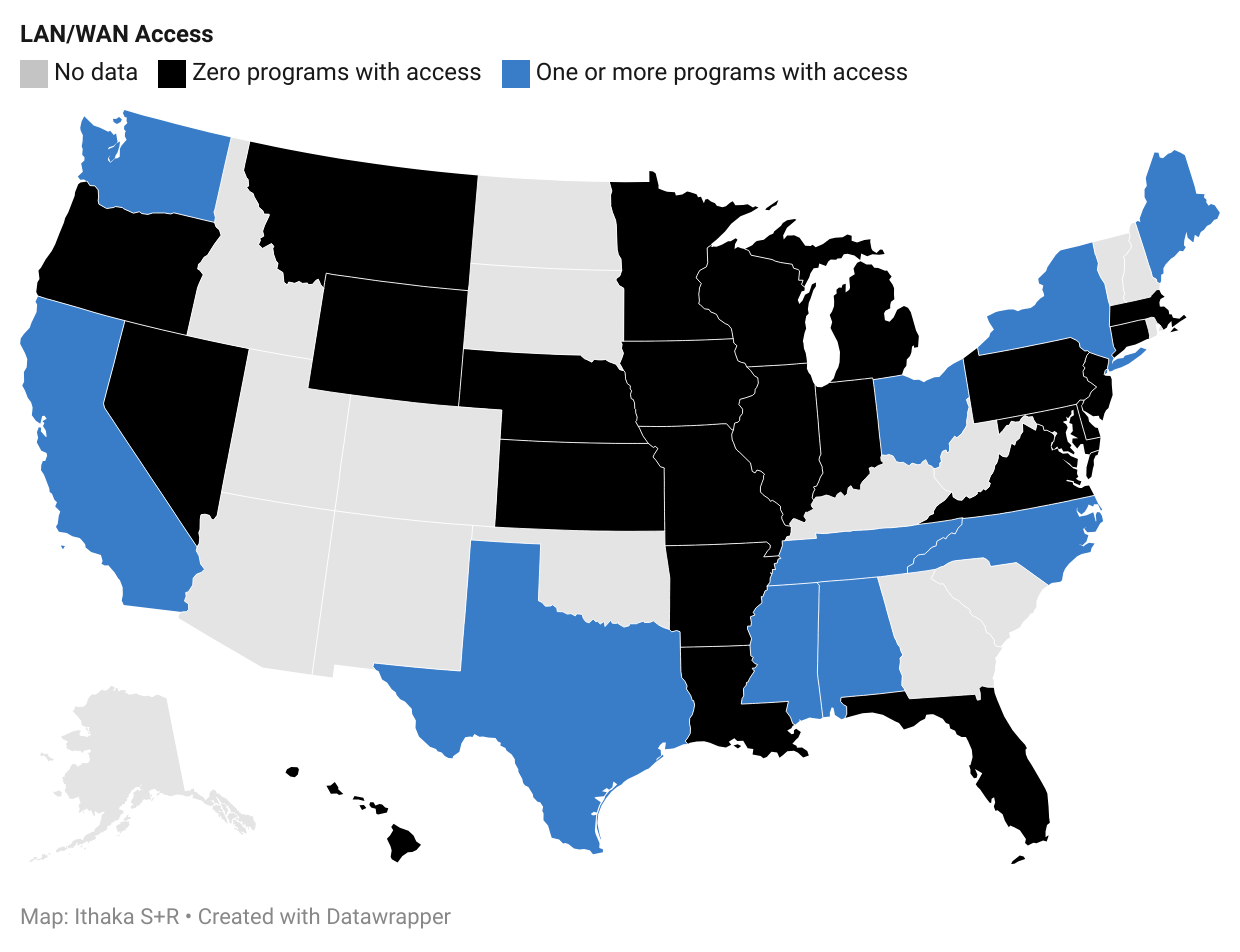
Figure 27: Internet Access by State
Conclusion: Network Connection and Internet
Data gathered in the survey suggests that students have very little, and very limited, network and internet access. While this is perhaps an unsurprising finding, it does confirm that students on the inside seldom have access to tools that are key to reentry and transition to college campuses on the outside. Departments of Correction and higher education institutions should be cognizant of these gaps as they strategically plan reentry and transition.
Future Plans and Priorities
The final section of the survey asked respondents about future plans and priorities for their programs related to technology. Responses indicated that increasing student access to laptops is a high priority. They also suggest that programs are optimistic about implementing or expanding access to technological devices, but considerably less optimistic about expanding internet access. Given the data collected through the rest of the survey, this suggests that questions raised about the quality of access and the development of information literacy and digital literacy skills are likely to persist.
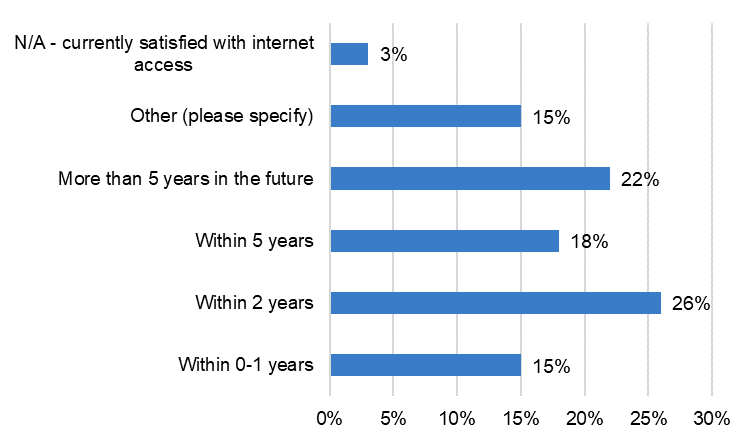
The first question in this section asked which technological device is most important to “implement or expand access to” in the near future. Laptops were the clear priority, selected by 58 percent of respondents. Desktop computers were a distant second (20 percent) and tablets third (13 percent).[20] When asked how soon they thought access to the device selected in the previous question could be implemented or expanded, 40 percent of respondents selected “within 2 years” and 27 percent selected “0-1 years” (see Figure 28).[21] However, responses were more mixed when considering implementing or expanding internet access (see Figure 29). Roughly the same share of respondents think that it will be implemented or expanded in the next two years as believe it will happen “within 5 years” or later.[22] It is important to note, as three respondents did, that some states will require legislative changes to allow people who are incarcerated to access the internet. The complexity of the issue was highlighted by one respondent who wrote that they were concerned internet access might be used to cancel in-person offerings.
Figure 28: Implementing or Increasing Device Access
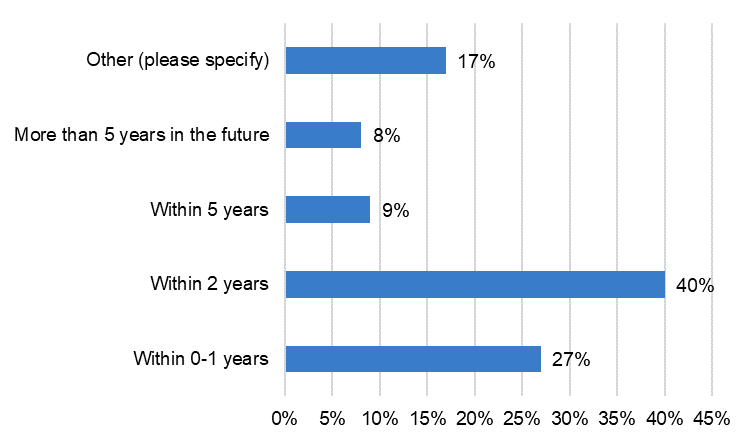
Figure 29: Implementing or Increasing Internet Access
Conclusion: Future Plans and Priorities
Collecting data on future plans and priorities emphasizes just how complex the issue of technology is for higher education in prison programs. While there appears to be some consensus on the potential importance of both laptops and internet access, it is clear from responses in this section that different programs will need to seek different solutions for increasing quality student access to technology. Questions of funding, space allocation, surveillance and self-censorship, and device ownership and maintenance all complicate how technology will be used in higher education in prison programs and the facilities and DOC in which they operate. It is clear, though, that more research is needed on the most effective ways to increase quality access to technology to perform research and complete coursework, and that the best solutions will require strong coordination and collaboration between higher education institutions and DOC and facilities.
Discussion
In this section of the report we outline potential areas of tension in relation to technology that may arise between higher education in prison programs, their higher education institutions, the facilities in which they operate, and Departments of Correction. These revolve around policy decisions, the logistics of providing access, and technology procurement, ownership, and maintenance. We also outline areas where more research is needed to better understand best practices, impacts, and outcomes, including the reliability, quality, time, and type of access, accessibility, training for students, staff, and instructors, and academic freedom and intellectual agency. Qualitative and anecdotal evidence suggests that these factors are likely to have an outsized impact on programmatic and individual outcomes.
Tension Sites
We identify three major areas where respondents or interviewees have explained that they have experienced tensions at an institutional level. Our focus on the institutional and the structural here is no accident, as these represent areas where respondents and interviewees noted that cooperation, collaboration, and alignment is particularly important for programmatic and student success.
Policy
Policies of higher education institutions, Departments of Correction, and facilities all intersect at higher education in prison programs. This means that higher education programs must navigate three overlapping, sometimes conflicting, sets of policies and procedures. This is complicated by both the environmental and logistical limitations that arise in prison settings.
As one interviewee explained, higher education in prison occurs at the “collision of two weird, siloed institutions where you can do anything you want and you can do nothing. [It] took countless meetings until we just found the right person to ask [to help us implement new technology…] Bureaucracies move slowly and it takes many, many meetings to move things.”
Another interviewee offered a concrete example of how such bureaucratic collisions move: On the “front-end: [you think,] yes we’re getting computers, this is going to be great! Then you find out how challenging it is when it comes to logistics. Tiny room. It’s in the library. Increasingly cramped and tiny space. This means that the library also can no longer be open all the time or freely, because now there is tech.”
As one interviewee explained, higher education in prison occurs at the “collision of two weird, siloed institutions where you can do anything you want and you can do nothing.”
Two interviewees also noted that their colleges expressed logistical and security concerns with giving students who are incarcerated access to their institutional information network. Interviewees also expressed frustration with obscure or sudden policy changes at the DOC or facility level, and with inconsistent periods for policy review by both higher education institutions and Departments of Correction. As one interviewee described, working in the field “requires intense persistence and you need to be able to bear whimsical cruelty.”
Logistics
While institutional policies may slow or stall technological adoption, respondents noted that many practical challenges to student technology access arise from logistical issues. At the end of the survey section on technological devices, we asked an optional open-text response question: “What barriers or complications are you aware of that hinder students from sufficiently accessing [desktop computers, laptops, or tablets] to adequately complete coursework and assignments?”
Respondents identified six categories of barriers to access, and there were some marked differences by device. The most frequently noted barriers were inconsistent or inadequate access and limited space or technology. Additional barriers included the inability to use tablets for more than advising or logistics, inadequate staffing, Department of Corrections regulations or security concerns, and the limitation of device use to classes that train students how to use technology for reentry purposes.
These results suggest that barriers to access differ by device and location. Moreover, desktop computers, the device most available to students, are particularly difficult to access. While these results are limited, due to both the optional and qualitative nature of the question, they suggest that quality of access concerns are particularly urgent in relation to desktop computers. They also emphasize that tablets are an underutilized resource already available to students on the inside, but not yet integrated into the technological ecosystem of higher education in prison programs.
These logistical barriers can also become points of tension for programs as they compete for limited resources or make demands on limited, often overburdened, DOC and facility staff to access resources. Although staffing was not raised frequently in the survey responses, it was the focal point for one interviewee, who noted the “major issue facing the program is staffing.” They further relayed that while their program has institutional support from both the prison facility and DOC, and from the higher education institution, staffing and implementation have stalled their program’s attempts to bring in new technologies.
Another interviewee noted that the DOC and facility’s policies on education can seem contradictory. Specific concerns around technology and security limited how their program could operate and ended up becoming a major barrier to instructional access. As they explained, they were briefly allowing students to enroll in online courses at the main campus, which they believed increased access, equity, and engagement; however, the prison system put a stop to the practice due to security concerns around the type of communication and the lack of surveillance and screening of faculty and staff done in advance. The interviewee noted that “[t]he same prison [allows for] Inside-Out instruction [where incarcerated students are brought into dialog with students from outside the prison, often by holding class inside prisons]–[with] less security and control there,” but implementing technology requires additional surveillance and control.
Technology Procurement, Ownership, and Maintenance
Who is responsible for purchasing, owning, and maintaining technology is another major complication to implementing and expanding technological access for postsecondary students in prison. Departments of Correction are responsible for providing high school or high school equivalent education and have dedicated staff and funding to do so. Postsecondary education, on the other hand, is provided through partnerships with institutions of higher education. Our survey, and the conversations with program administrators that followed, made it clear that different programs have very different staffing and funding models, and that the agreements and practices around the selection, acquisition, installation, training, implementation, and maintenance of technological devices for higher education programming differ widely. In some cases, a program might own and maintain technology, in others a program might source and purchase technology and then sign it over to the prison for security, installation, and maintenance. The multiplicity of models makes this a potential point of tension in correctional education partnerships.
Grant funding, in particular, emerged as an important aspect of the technology ecology in higher education in prison. Despite that we did not ask about funding models, roughly eight percent of respondents volunteered information in open-text responses about applying for or receiving grant funding for technology. Conflicts over contracts, device control, funding allocation, and spending use can, however, scuttle or stall a potential implementation. One interviewee explained they received money to procure and install technology, but they were forced to forfeit the grant when the higher education institution and the prison could not agree on how to network the resources.
There are a number of federal, state, and private grants that institutions can tap to fund new technological devices for students who are incarcerated, but while one-time grant funding might help a program to obtain technology, it will not answer questions about who owns, maintains, secures, and updates that technology. This also feeds back into logistical challenges: large acquisitions of technology may be hindered by staffing, and attempts to get grant funding may be limited by faculty and staff capacity. As one interviewee noted, “[w]riting a proposal takes days and I’m already working at 150 percent capacity for 100 percent pay.”
Equitable Instruction and Best Practices
Respondents and interviewees also identified four areas of concern about student equity, access, and success. While the tension sites referenced above highlighted aspects of institutional partnership, the domains below highlight areas where data and research are needed to better understand what practices are most beneficial to student success and what minimum conditions must be met for education to be considered equitable.
Quality of Access
When we set out to study technology access in higher education in prisons, we initially planned to simply take an inventory of the technology landscape; however, as we began developing and testing the survey instrument, it became clear that simply documenting presence and absence would be insufficient. Therefore, we added more granular and more qualitative questions to the section on technological devices in the survey. Those results reinforce the idea that there is a significant difference between the presence of a device in a facility and having reliable, sustained, quality use of it. This became a major theme that cut across follow-up interviews.
One interviewee noted that their program found the “problem is not getting technology, but in making it usable and accessible from an educational perspective.”
One interviewee noted that their program found the “problem is not getting technology, but in making it usable and accessible from an educational perspective.” They described how the highly restricted nature of movement and access inside prison creates a variety of additional barriers to obtaining, completing, and submitting work that many main campus students do not face. For example, they explained, even a program with operating laptops and secure network access creates additional barriers to acquiring assignments and completing and submitting coursework. They noted that one issue was that even when “access is better […] it is all broken up into multiple steps.” They described one scenario where just to access assigned work, a student would have to be allowed to go to the building where their laptop was stored, get the laptop, take it to a location where it can be docked, dock it, and then download the assignment.
Throughout the survey, respondents noted issues in both the quality and reliability of technology access. Several times, respondents were given the optional prompt to “describe any differences across facilities or to clarify or add detail to any of [their] answers,” and they frequently used this space to take issue with the quality of technological access. Eight of the fifteen themes we tracked in responses about learning management systems focused on the limitations or restrictions in the functionality or usability of the LMS (see Appendix 7). Respondents frequently noted how software use required strict oversight or rigid approval (see Appendix 8). In fact, three respondents noted that students were still forced to hand write all assignments, furthermore, even, as was the case in two responses, where students had access to desktop computers or laptops with word processing software. Open text responses also revealed that even when the internet is used or allowed, it may be done so in unexpectedly restrictive ways. One respondent noted that their students are allowed internet use only to search for jobs.
The quality of access is an important, but largely hidden, issue; two of the six interviewees noted that for-profit information technology providers already have the infrastructure in place for students to access course materials, communicate, and do coursework on tablets; however, allowing them the ability to submit assignments requires an additional, costly subscription. In another interview, one individual noted that they were able to bring in desktop computers for a new program, only to learn that there was no internet access and that students “[m]ust schedule limited time in advance … to do self-paced learning modules.”
At its best, technology access can be “a game changer” as one person referred to Zoom in the survey; however, the reality of access reliability and quality is highly variable and context dependent. At its worst, poor technology implementation can create additional barriers to learning and success. As one interviewee put it: “the technology seems weird, redundant, [and] poorly designed. [It] feels like early internet technology and is constantly breaking.”
Accessibility
There is a gap in this survey that we must acknowledge: it does not directly address accessibility for people with disabilities in relation to technology. In light of data collected after the survey closed, it seems likely that the restrictive policies and practices that govern technology use may have an outsized impact on the access and success of students who are neurodiverse or disabled. This is likely to be a major avenue of research as accreditors and scholars begin to examine higher education in prison programs more closely in the wake of Pell reinstatement. Moreover, the need to understand and ameliorate systemic issues in this area have been highlighted by recent court cases.[23]
The survey amassed a large amount of data about the many barriers and challenges to accessing technology for educational purposes. The availability of peripherals on technological devices may be directly relevant to accessibility considerations. The limits on students using headphones, computer mice–and in the case of tablets, keyboards–may prevent their effective use for students with a variety of disabilities.
One interviewee noted that they didn’t realize immediately that the type of housing or residential building that students inhabit can impact their ability to focus, read, or complete coursework. More open, dormitory-style units, for example, make it difficult to find reliably quiet time to focus. That is an issue that might have a larger impact on the success of students who are neurodivergent or who have a variety of physical, intellectual, or developmental disabilities. This interviewee also described how difficult it was to accommodate a student with a disability that required technological assistance. Installing the technological device, providing a quiet point of access for the student, and scheduling access and staff oversight were complicated endeavors. Eventually, despite having the required technological tool, “[b]ecause access was so logistically complicated and inconvenient, technological mediation could not be implemented.”
Training
Even when technology is available, students and faculty may not have adequate training or knowledge to make the best use of it. One interviewee noted that a major challenge with implementing new technology for their program was simply faculty and staff resistance, noting that faculty and staff “unfamiliarity with the technology is a barrier” to both uptake and effective use. A handful of survey respondents also noted concerns about student computer or digital literacy and suggested that students do not have the access or training to become fluent with the technology that they may need to use in coursework and upon reentry. This strikes us as another key area for future research.
Higher education programs will also need to collect data on student outcomes to ensure Pell dollars are being well spent. Research on best practices for training DOC, facility, and higher education staff and instructors on how to implement and utilize different technologies effectively, and how to best prepare students to use it effectively on the inside and after release will also be important.
Academic Freedom and Intellectual Agency
Information literacy, a set of skills that enables people to seek, find, evaluate, effectively use, and create information, stood out as a major area of concern for survey respondents and interviewees in considering student equity and success.[24] As we began to analyze survey responses and conduct follow-up interviews, it became clear that information literacy was seen as an outcome, but what program administrators felt was missing were the intellectual processes that developed information literacy skills. This became especially clear in the follow-up interviews.
One interviewee explained that the current research process for students is “[n]ot like the old days when we had card catalogs and abstracts—we give the students everything so the whole creative inquiry side of the process is not there. They can’t get lost for a day in research. They don’t have a conception of the breadth of research outside or how you narrow it down.” This sentiment was echoed in another interview, where a respondent noted that “[s]tudents really have no sense of how to research something and they are not able to do that function.”
These concerns seem to dovetail with broader, systemic concerns about the amount of academic and intellectual freedom afforded to students. The idea that one “can’t get lost for a day in research,” is as much about intellectual agency and the freedom to use one’s time as one sees fit as it is about developing a skill. This also raises questions about equity across security clearance, as one interviewee noted that students housed in maximum security aren’t allowed “to be in class together. Which means they are missing a whole portion of education that relies on people interacting with each other. [And it] cuts out the student-professor relationship, mentorship, and eliminates peer-mentoring.”
In “Security and Censorship: A Comparative Analysis of State Department of Corrections Media Review Policies,” we detailed a variety of ways that censorship policies restrict the intellectual agency and engagement of students and readers on the inside.[25] The data collected in this survey and its follow-up interviews demonstrate how student agency and access are also limited in ways that fundamentally shape their experience of higher education. The next task researchers will be posed with is finding out how that impacts student equity and success, and what avenues may be available to alleviate it.
Conclusion: What is Access? What is Equity?
As the field of higher education in prison continues to strengthen its commitment to access and equity, and with increased regulations and expectations of quality tied to Pell funding, ensuring access to technology will continue to be a priority issue for the field. However, this raises a crucial question: what do equity and parity look like between a program inside prison and a program operating at the home campus?
On one hand, the data gathered here demonstrates that there are some actionable steps programs with existing technology frameworks can take to increase the quantity and quality of access for students, such as allowing students to communicate with program staff or access support services via tablets, enabling student access to laptops in multiple locations or settings, or allowing device use on weekends for coursework.
On the other hand, qualitative data gathered in the survey and follow-up interviews suggest that major quality gaps exist between higher education in prison programs and their home campus. We noted major discrepancies in, or concerns about, quality of access (reliability, time, and type), accessibility and accommodation, training (for students, staff, and instructors), and academic freedom and intellectual agency. This is not to say that gaps or inequities exist only in these domains, simply that these appear to be recurring areas of concern for practitioners in the field. One survey respondent even noted in an optional, open-text response, that they had concerns about meeting accreditation requirements: “[f]aced with [our regional accreditor’s] accreditation requirements and [United States Department of Education Regular and Substantive Interaction (RSI)] requirements, we are concerned that the lack of technology may negatively impact our program in the future.”
There is a great deal to be excited about in the field of higher education in prisons right now. Pell restoration is poised to increase access, it has already increased awareness and interest, and it is beginning to drive new research, new initiatives, and new interventions in the field. We hope that our inventory of technology access provides programs and facilities with new models and ways of thinking about the problems they face. And we hope that the qualitative information and discussion can help to highlight major issues to address for programs in transition or formation, and directions for future research in the field.
Recommendations
The field of higher education in prison is at a pivotal juncture and there is a growing need to generate a robust, transparent body of research on technological frameworks, accessibility for students with disabilities, and instructional best practices, and student success impacts. Based on our survey findings, we provide recommendations for the field in three key areas: (1) institutional alignment and partnership, (2) technological implementation, (3) areas for future research.
Institutional Alignment and Participation
Postsecondary education in prison programs operate through a unique partnership between correctional and higher education institutions, and how these institutions—and the employees and stakeholders within each of them—navigate the partnership can have profound effects on the structure of education and student experiences. Given this, we recommend that institutional stakeholders proactively discuss values, goals, and needs and strategically align and plan as early as possible.
In particular, institutions should address institutional conflicts at the tension sites identified in this report: policy; logistics; and technology procurement, ownership, and maintenance.
- Ensure that relevant stakeholders are in conversation. Respondents and interviewees noted that implementing new technology required coordination between administrators and IT staff from both the DOC and the college and noted that finding the right person to talk to could be a challenge.
- Develop clear policies that program faculty, staff, and students can access and ensure that policy and practice align. Respondents frequently selected “I’m not sure/I don’t know” on this survey and that reflects a disconnect in communication. Write-in responses and follow-up interviews also noted conflicts between stated policy and actual practice, as well as in finding clear policy.
- Ensure that students have access to the technology and services needed for an equitable and successful educational experience. Technology should allow students to access available program services and to perform and complete coursework and help them build practical digital fluency.
- Create technology ownership policies that meet security concerns without compromising educational best practices. Technology procurement, ownership, and maintenance are contentious and complicated issues for higher education programs. Student equity and success are dependent on a partnership that satisfies correctional security concerns without compromising quality access to well-maintained, regularly updated technology and software that does not unnecessarily surveil students (which may be a potential FERPA violation).
Technological Implementation
Each institutional partnership should build the technological framework that suits the institutions and stakeholders involved, with student equity, access, and success as primary drivers. The radically different systemic structures, policy, architecture, design, and staffing of correctional and higher education institutions mean that each partnership will by necessity be unique. While each partnership will look different, we recommend following four guiding principles in designing and implementing technology frameworks.
- Develop channels for students to access services and to communicate with instructors and advisers. Ameliorating the limited student communication capabilities across technological devices suggests an area of opportunity to increase student digital literacy while also increasing access to mentorship, advising, and campus services. This is particularly ripe in locations that provide tablets for entertainment purposes, which can be further leveraged for educational purposes.
- Provide education and training on how technology works and is operated for all stakeholders. While much research is bound to focus on increasing education and training to develop student digital literacy, survey results make it clear that correctional and educational staff would benefit from training on the limits, functions, and best practices of technology.
- Increase student access to research databases and resources. Quantitative and qualitative results suggest that students are missing out on key aspects of the research process that are part of non-correctional collegiate education and valuable for developing information literacy skills. Allowing students to perform their own academic research—to even “get lost” in the research process—may be a crucial part of increasing information literacy.
- Ensure that students can access technology with the tools they need in environments conducive to learning. Ensuring students can use peripherals such as headphones and have sustained access to devices in quiet spaces is crucial for educational success and equity. Students who are neurodivergent or have disabilities that make them particularly sensitive to environmental changes or distractions need to be properly accommodated, as is their legal right under the Americans with Disabilities Act.
Future Research
This is the beginning of a new era in postsecondary education in prisons: technology access and implementation is expanding, financial aid and funding are becoming increasingly available, and as a result the field itself is projected to expand. At the same time, information about existing program offerings, structures, technology access, and instructional practices are highly provincialized and obscure. Moreover, concerns about disability accommodations and instructional equity and reentry suggest that more research best practices and student outcomes is needed. We outline five areas for further research below:
- Determine how existing correctional and higher education partnerships are structured and maintained. More research is needed to understand how successful programs align, strategically plan, and coordinate when institutional values or needs may come into contrast or conflict. Understanding categorical formulations that already exist can help emerging partnerships to understand how they might best apply their own shared resources and structure their program and offerings.
- Define and measure dimensions of quality access and study their impact on student academic and reentry success. The results of this survey report suggest that there is a large divide between stated access and practical, quality access to technology in prison education contexts. Research that builds on existing studies of the technology gap to better define, measure, and ultimately benchmark the impacts of quality technology access is needed.
- Research disability concerns and accessibility accommodations in higher education in prisons. Evidence in this report and recent court cases have emphasized the need to better understand the landscape of accessibility and disability accommodation in higher education in prison programs. In addition to concerns that ADA regulations are not being met, there is a possibility that structural issues in program delivery and offerings—such as course timings overlapping with mandatory medical or counseling programming—may put higher education increasingly out of reach for people with disabilities.
- Develop frameworks and best practices for providing technology training to different stakeholders. While correctional and higher education institutions should collaborate to develop training as part of the implementation process, there is also a need for researchers to explore the best practices for developing training programs that effectively speak to the needs and concerns of the different stakeholder groups involved.
- Study the relationship between academic agency, intellectual freedom, student outcomes, and security issues. This appears to be the primary area of conflict between the values of correctional and higher education institutions; however, we do not have a clear body of research that helps us to understand how security concerns might limit the critical thinking, information literacy, or intellectual agency skills of students on the inside, or what the long-term impacts of such limits on student success are. Having a better understanding of how facility security and student outcomes may or may not be impacted by increased intellectual agency and freedom is crucial for bridging the missions and values of corrections and higher education.
Acknowledgements
This report is one facet of a larger project made possible with funding from Ascendium Education Group, and we would like to extend our gratitude to them for making this work possible. Thanks also to the guidance and advice from the project’s advisory board: Erin Boyington, Michelle Daniel, Jay Holder, Ben Jones, Rob Scott, and Brian Walsh. We are grateful to all the educators, administrators, and staff that tested the survey, and all of the participants who provided responses. Thanks to Allan Wachendorfer for providing preliminary feedback on the report. Thanks as well to those respondents who participated in follow-up interviews to provide a clearer picture of the nuance and complexity of technology access in higher education in prison programming. Extra thanks to Amber Bell of Lincoln University, Missouri, who walked me through a particularly unique partnership paradigm on the record and highlighted the positive nature of their DOC and program partnership.
That there is a single author on this report belies the massive amount of communal and collaborative labor that made it possible: thanks to Sage Love and Nicole Betancourt for working on the survey design and distribution, and especially to Sage for helping update the distribution list multiple times; thanks to Ioana Hulbert and Melissa Blankstein for lending methodological expertise on survey design; thanks to KM Begian-Lewis for assisting with pulled-quotes from anonymized qualitative interview notes; thanks to Catharine Bond Hill and Roger C. Schonfeld for their feedback and support; thanks to Kimberly Lutz and Juni Ahari for their support with editing, formatting, and communications; and thanks to Kurtis Tanaka for his guidance and support throughout the process.
Appendix 1: Number of Programs Responding by State
| State | Programs Responding |
| Alabama | 2 |
| Alaska | 0 |
| Arizona | 1 |
| Arkansas | 1 |
| California | 6 |
| Colorado | 0 |
| Connecticut | 3 |
| Delaware | 1 |
| District of Columbia | 1 |
| Florida | 2 |
| Georgia | 1 |
| Hawaii | 1 |
| Idaho | 0 |
| Illinois | 3 |
| Indiana | 1 |
| Iowa | 3 |
| Kansas | 1 |
| Kentucky | 0 |
| Louisiana | 1 |
| Maine | 1 |
| Maryland | 2 |
| Massachusetts | 3 |
| Michigan | 3 |
| Minnesota | 2 |
| Mississippi | 1 |
| Missouri | 3 |
| Montana | 1 |
| Nebraska | 1 |
| Nevada | 1 |
| New Hampshire | 0 |
| New Jersey | 7 |
| New Mexico | 0 |
| New York | 19 |
| North Carolina | 2 |
| North Dakota | 0 |
| Ohio | 2 |
| Oklahoma | 0 |
| Oregon | 2 |
| Pennsylvania | 5 |
| Rhode Island | 0 |
| South Carolina | 0 |
| South Dakota | 0 |
| Tennessee | 5 |
| Texas | 3 |
| Utah | 0 |
| Vermont | 0 |
| Virginia | 3 |
| Washington | 2 |
| West Virginia | 0 |
| Wisconsin | 1 |
| Wyoming | 1 |
| Federal Bureau of Prisons | 1 |
Appendix 2: Responding Programs with Desktop Computer Access by State
| State | Programs With Access to Desktop Computers |
| Alabama | 0 |
| Alaska | N/A |
| Arizona | N/A |
| Arkansas | 0 |
| California | 2 |
| Colorado | N/A |
| Connecticut | 0 |
| Delaware | 0 |
| District of Columbia | N/A |
| Florida | 2 |
| Georgia | N/A |
| Hawaii | 1 |
| Idaho | N/A |
| Illinois | 1 |
| Indiana | 1 |
| Iowa | 3 |
| Kansas | 0 |
| Kentucky | N/A |
| Louisiana | 1 |
| Maine | 1 |
| Maryland | 0 |
| Massachusetts | 2 |
| Michigan | 0 |
| Minnesota | 1 |
| Mississippi | 1 |
| Missouri | 1 |
| Montana | 1 |
| Nebraska | 0 |
| Nevada | 0 |
| New Hampshire | N/A |
| New Jersey | 5 |
| New Mexico | N/A |
| New York | 9 |
| North Carolina | 0 |
| North Dakota | N/A |
| Ohio | 1 |
| Oklahoma | N/A |
| Oregon | 1 |
| Pennsylvania | 5 |
| Rhode Island | N/A |
| South Carolina | N/A |
| South Dakota | N/A |
| Tennessee | 4 |
| Texas | 0 |
| Utah | N/A |
| Vermont | N/A |
| Virginia | 1 |
| Washington | 1 |
| West Virginia | N/A |
| Wisconsin | 1 |
| Wyoming | 1 |
Appendix 3: Responding Programs with Laptop Access by State
| State | Programs With Access to Laptops |
| Alabama | 2 |
| Alaska | N/A |
| Arizona | N/A |
| Arkansas | 0 |
| California | 5 |
| Colorado | N/A |
| Connecticut | 2 |
| Delaware | 0 |
| District of Columbia | N/A |
| Florida | 1 |
| Georgia | N/A |
| Hawaii | 1 |
| Idaho | N/A |
| Illinois | 0 |
| Indiana | 0 |
| Iowa | 0 |
| Kansas | 0 |
| Kentucky | N/A |
| Louisiana | 0 |
| Maine | 1 |
| Maryland | 1 |
| Massachusetts | 1 |
| Michigan | 1 |
| Minnesota | 1 |
| Mississippi | 1 |
| Missouri | 0 |
| Montana | 0 |
| Nebraska | 1 |
| Nevada | 0 |
| New Hampshire | N/A |
| New Jersey | 1 |
| New Mexico | N/A |
| New York | 2 |
| North Carolina | 1 |
| North Dakota | N/A |
| Ohio | 0 |
| Oklahoma | N/A |
| Oregon | 0 |
| Pennsylvania | 2 |
| Rhode Island | N/A |
| South Carolina | N/A |
| South Dakota | N/A |
| Tennessee | 0 |
| Texas | 1 |
| Utah | N/A |
| Vermont | N/A |
| Virginia | 2 |
| Washington | 2 |
| West Virginia | N/A |
| Wisconsin | 1 |
| Wyoming | 0 |
Appendix 4: Responding Programs with Tablet Access by State
| State | Programs With Access to Tablets |
| Alabama | 0 |
| Alaska | N/A |
| Arizona | N/A |
| Arkansas | 0 |
| California | 2 |
| Colorado | N/A |
| Connecticut | 0 |
| Delaware | 0 |
| District of Columbia | N/A |
| Florida | 0 |
| Georgia | N/A |
| Hawaii | 0 |
| Idaho | N/A |
| Illinois | 0 |
| Indiana | 1 |
| Iowa | 0 |
| Kansas | 1 |
| Kentucky | N/A |
| Louisiana | 0 |
| Maine | 1 |
| Maryland | 1 |
| Massachusetts | 1 |
| Michigan | 1 |
| Minnesota | 2 |
| Mississippi | 1 |
| Missouri | 3 |
| Montana | 1 |
| Nebraska | 0 |
| Nevada | 0 |
| New Hampshire | N/A |
| New Jersey | 2 |
| New Mexico | N/A |
| New York | 10 |
| North Carolina | 0 |
| North Dakota | N/A |
| Ohio | 0 |
| Oklahoma | N/A |
| Oregon | 0 |
| Pennsylvania | 0 |
| Rhode Island | N/A |
| South Carolina | N/A |
| South Dakota | N/A |
| Tennessee | 0 |
| Texas | 0 |
| Utah | N/A |
| Vermont | N/A |
| Virginia | 1 |
| Washington | 0 |
| West Virginia | N/A |
| Wisconsin | 0 |
| Wyoming | 0 |
Appendix 5: LAN/WAN Connection by State
| State | Number of Programs Indicating LAN/WAN Access |
| Alabama | 1 |
| Alaska | N/A |
| Arizona | N/A |
| Arkansas | 0 |
| California | 1 |
| Colorado | N/A |
| Connecticut | 0 |
| Delaware | 0 |
| District of Columbia | N/A |
| Florida | 0 |
| Georgia | N/A |
| Hawaii | 0 |
| Idaho | N/A |
| Illinois | 0 |
| Indiana | 0 |
| Iowa | 0 |
| Kansas | 0 |
| Kentucky | N/A |
| Louisiana | 0 |
| Maine | 1 |
| Maryland | 0 |
| Massachusetts | 0 |
| Michigan | 0 |
| Minnesota | 0 |
| Mississippi | 1 |
| Missouri | 0 |
| Montana | 0 |
| Nebraska | 0 |
| Nevada | 0 |
| New Hampshire | N/A |
| New Jersey | 0 |
| New Mexico | N/A |
| New York | 4 |
| North Carolina | 1 |
| North Dakota | N/A |
| Ohio | 1 |
| Oklahoma | N/A |
| Oregon | 0 |
| Pennsylvania | 0 |
| Rhode Island | N/A |
| South Carolina | N/A |
| South Dakota | N/A |
| Tennessee | 1 |
| Texas | 1 |
| Utah | N/A |
| Vermont | N/A |
| Virginia | 0 |
| Washington | 2 |
| West Virginia | N/A |
| Wisconsin | 0 |
| Wyoming | 0 |
Appendix 6: Internet Connection by State
| State | Number of Programs Indicating Internet Access |
| Alabama | 1 |
| Alaska | N/A |
| Arizona | N/A |
| Arkansas | 0 |
| California | 2 |
| Colorado | N/A |
| Connecticut | 0 |
| Delaware | 1 |
| District of Columbia | N/A |
| Florida | 1 |
| Georgia | N/A |
| Hawaii | 0 |
| Idaho | N/A |
| Illinois | 0 |
| Indiana | 0 |
| Iowa | 1 |
| Kansas | 1 |
| Kentucky | N/A |
| Louisiana | 0 |
| Maine | 1 |
| Maryland | 0 |
| Massachusetts | 1 |
| Michigan | 0 |
| Minnesota | 1 |
| Mississippi | 1 |
| Missouri | 0 |
| Montana | 1 |
| Nebraska | 0 |
| Nevada | 0 |
| New Hampshire | N/A |
| New Jersey | 2 |
| New Mexico | N/A |
| New York | 0 |
| North Carolina | 1 |
| North Dakota | N/A |
| Ohio | 0 |
| Oklahoma | N/A |
| Oregon | 0 |
| Pennsylvania | 0 |
| Rhode Island | N/A |
| South Carolina | N/A |
| South Dakota | N/A |
| Tennessee | 5 |
| Texas | 0 |
| Utah | N/A |
| Vermont | N/A |
| Virginia | 0 |
| Washington | 0 |
| West Virginia | N/A |
| Wisconsin | 1 |
| Wyoming | 0 |
Appendix 7: Additional Write-in Responses, LMS
| Respondent generated answers | Frequency provided |
| Program- or facility-specific information about LMS or tech management | 7 |
| Chat or peer-to-peer messaging functions are limited or disabled | 4 |
| Course-wide message board is available | 3 |
| The LMS can only be used to enter attendance and grades | 3 |
| Students can only message their instructor directly | 2 |
| Direct communication can only occur through paper feedback functions | 2 |
| Working with or waiting on a decision from DOC to implement | 2 |
| Waiting on legislative action | 2 |
| Faculty access is limited because LMS is controlled by DOC or contractor | 2 |
| Custom HTML-based system is used | 1 |
| Concerned that a lack of LMS access will harm accreditation | 1 |
| Multiple instances and types of LMS used | 1 |
| Securely designed Canvas shell has diminished functionality | 1 |
| Only students taking online classes have access to LMS | 1 |
| We will not incorporate technology until we have LMS access | 1 |
Appendix 8: Additional Write-In Responses, Software
| Respondent Generated Answers | Frequency Provided |
| Tech access was allowed on a limited basis during Covid | 5 |
| Video conferencing available with instructor present | 4 |
| The students have to handwrite assignments. | 3 |
| Software update requires DOC approval and timeline is determined by them. | 3 |
| Specified differences in access by facility, gender, or security level served | 3 |
| Tech and staff availability impact access | 3 |
| Facility arranges rare, special meetings via web conferencing tools. | 2 |
| DOC is supportive of software used for classrooms, but may restrict those that pose a security risk. | 1 |
| Program is unable to even email students via their tablets. | 1 |
| Zoom access would be a game changer. | 1 |
| Faculty do not present technology requests in a timely manner and it creates administrative challenges. | 1 |
| Faculty are not allowed instructional technology in the facility. | 1 |
| Students in a professional program are not allowed access to the software they will use on release. | 1 |
| The program is not allowed to provide live virtual learning. | 1 |
Endnotes
- The US Department of Education released the final rules for the FAFSA Simplification Act on October 27, 2022. Among these rules are the provisions which expand educational access for students who are incarcerated. For a summary of the rules and a link to the full policy, see: US Department of Education, “Education Department Unveils Final Rules to Protect Veterans and Service Members, Improve College Access for Incarcerated Individuals and Improve Oversight When Colleges Change Owners,” 27 October 2022, https://www.ed.gov/news/press-releases/education-department-unveils-final-rules-protect-veterans-and-service-members-improve-college-access-incarcerated-individuals-and-improve-oversight-when-colleges-change-owners. ↑
- In the related domain of carceral information access and library services, this balance between urgency and opportunity was neatly captured in the recent white paper, “Technology in Carceral Facilities: Trends, Limitations, and Opportunities for Libraries,” published by the Expanding Information Access for Incarcerated People Initiative of the San Francisco Public Library, https://drive.google.com/file/d/1GQYcM5iUP-UT20A-qsCTaHu0WtvdK91y/view?usp=sharing. The case may be even more urgent for institutions of higher education, as higher education in prison programs often have individual facility and DOC level partnerships. ↑
-
For more on the impacts of the pandemic on instructional modality, see Niloufer Taber and Asha Muralidharan’s “Second Chance Pell: Six Years of Expanding Education Programs in Prisons,” Vera Institute of Justice, https://www.vera.org/publications/second-chance-pell-six-years-of-expanding-access-to-education-in-prison.
- Eight percent of respondents indicated their programs do not offer credit bearing courses, while four percent indicated “Other (please specify).” ↑
- It is important to keep in mind that we did not receive responses from every state, as Figure 1 demonstrates. Further, we received responses from multiple programs in some states. The remaining maps have been created to show presence or absence in a state, and raw response frequencies can be found in the appendices. The remainder of the data has not been weighted in anyway, to ensure that responding programs cannot be identified. ↑
- For more information about how many programs per state indicated access, see appendices 2, 3, and 4. ↑
- Asterisks indicated that a respondent selected “I’m not sure/I don’t know” in reference to whether students could access at least one of the aforementioned devices. ↑
- Nine percent of responding programs use other tablet options than those listed, and 13 percent of programs are unsure of the service provider for their students’ tablets. The percentages totaling more than 100 percent is not an error. One program selected two options, indicating that their program utilizes two different service providers. Of the two respondents who selected “other,” one program is still in the planning phase and has not yet committed to a service provider, and another noted that the program funded and purchased other tablets for their students. Zero programs selected Edovo, Union Supply, and ViaPath/GTL as their service provider. ↑
- Seven percent of respondents selected “Other (please specify),” and one participant selected all three options, indicating the complexity of laptop funding. ↑
- The original wording of the answer choice read “free time,” but the insensitivity of such phrasing was brought to our attention in conversation about preliminary findings and we’ve adjusted the wording to “unstructured time.” This better aligns with our values on language. ↑
- The fourteen additional responses generated eight different answers: four respondents noted “when approved,” three wrote “during tutoring or study hall,” two noted that it “varies with security level,” two wrote “during scheduled hours, weekday and weekend,” and one individual each noted: “as schedules and staff permit, lab often closed,” “labs exist on unit, but access is very limited,” “during technology class,” and “desktop computer access has been promised but not implemented.” ↑
-
This question asked specifically about tools in the classroom. Information was also gathered about software, video conferencing, and learning management systems, see Learning Management Systems and Software for more information.
- Respondents were given seven answer choices, five named specific learning management systems, the sixth answer choice was “Other (please specify),” and the seventh and final choice was “I’m not sure/I don’t know.” No respondents selected “I’m not sure/I don’t know,” so it has been removed from Figure 17. Of the 19 percent of respondents who selected “Other (please specify),” one respondent noted that their students had access to Brightspace, one explained that different facilities had access to different LMS and provided details. The remaining three respondents all indicated that their programs utilized a modified version of Canvas, which is built on open software. ↑
- Three percent of respondents indicated “I’m not sure/I don’t know,” one percent indicated Google Meet, and zero respondents indicated FaceTime or Skype. Thirteen percent of respondents indicated “Other (please specify),” of those respondents, two noted access to Polycom, one noted access to D2L Bongo, and several provided complicating information about how video conferencing access is currently unavailable. ↑
- Thirty-seven percent of respondents indicated their students did have sufficient access to software programs, while five percent indicated “I’m not sure/I don’t know.” ↑
- Even if we account for and subtract the roughly 25 percent of programs that indicated their students have access to zero technological devices, seven percent of all respondents still selected “N/A.” Two percent of respondents selected “on a weekly basis,” seven percent selected “before each academic term,” and one percent selected “once per year.” ↑
- The section introduction provided working definitions of local area networks (LAN), wide area networks (WAN), and different types of internet access (full or open, and restricted or whitelisted). While LAN and WAN are well-established terms, in our experience, the language used about how internet access is and is not restricted are more colloquially deployed and full and open, and restricted and whitelisted, while not necessarily entirely the same, are often used interchangeably by higher education in prison program administrators. The full language provided in the section introduction is reproduced below for transparency:“The penultimate section of the survey asks questions about how incarcerated students access networked information or files in your program. Some institutions allow students access to special, closed networks, enabling access to remote files or programming controlled internally and stored on a secure server. This is a form of networked access that differs from the internet, but still allows for some networked connectivity: there are two main categories. Local Area Networks (LAN) connect devices in a single facility or a specified, local area. Wide Area Networks (WAN) connect devices in a dedicated, closed system across a greater geographical distance (such as connecting government systems throughout a State). Some institutions allow learners who are incarcerated access to the full internet or a limited version of the internet, where certain websites or domains are “whitelisted” or approved, and the rest of the internet is inaccessible. The next questions deal with access to these different types of networked systems.” ↑
- Sixty-one percent of respondents indicated “no,” their programs could not use LAN or WAN. Given that nearly a quarter of respondents indicated “I’m not sure/I don’t know” in response to this question suggests that more research—perhaps with simplified language—is needed. ↑
- The remaining 10 percent of responses were divided among “Other (please specify)” (six percent) and “I’m not sure/I don’t know” (four percent). No respondents indicated that their students had open or unprotected internet access. ↑
- The remaining nine percent of respondents indicated “Other (please specify),” and six of them provided additional, nuanced write-in responses: two addressed increasing permissions for how and where devices could be used, two addressed increasing access to a LAN, one prioritized smartboards for in-class instruction, and one noted that “any of the above options would help.” ↑
- While the majority of respondents were optimistic, suggesting technology implementation or expansion would occur in the next two years, the remaining third of responses were less optimistic: nine percent chose “within 5 years,” eight percent chose “more than 5 years in the future,” and 17 percent chose “Other (please specify).” Half of the twelve respondents who provided write-in specifications noted that it was unknown how soon they could implement their priority device. ↑
- Forty-one percent of respondents selected either “0-1 years” (15 percent) or “within 2 years” (26 percent), forty percent of respondents selected either within 5 years (18 percent) or “more than 5 years” (22 percent). Three percent of respondents indicated that they were satisfied with existing internet access. Fifteen percent indicated “Other (please specify).” The top write-in responses were “unknown” (six respondents), “dependent on legislation” (three respondents), and “I don’t believe getting internet access is possible. ↑
- In February and March, two major court cases emphasized the need for increased research on and scrutiny of accessibility issues and accommodations in prison education. In February, the Minnesota Department of Corrections (MNDOC) reached a settlement with the US Department of Justice (DOJ) to end and remediate discriminatory practices in secondary education. See “Minnesota Department of Corrections Agrees to End Discrimination Against People with Disabilities in its GED Education Program,” US Department of Justice, 14 February 2023, https://www.justice.gov/opa/pr/minnesota-department-corrections-agrees-end-discrimination-against-people-disabilities-its. Then in March, the Supreme Court ruled in favor of a Michigan student who attempted to sue his high school district under the Americans with Disabilities Act (ADA) after the school settled his complaint under the Individuals with Disabilities Education Act (IDEA). While the latter is not focused on prison education, it emphasizes that settling under the IDEA does not preclude one’s ability to sue under the ADA, an important benchmark for high school education and a pressing issue, anecdotally, for prison education. For more on the ruling, see: Lawrence Hurley, “Supreme Court Rules for Deaf Student Who Sued Michigan School District,” NBC News, 21 March 2023, https://www.nbcnews.com/politics/supreme-court/supreme-court-rules-deaf-student-sued-school-district-rcna75904. ↑
- The American Library Association (ALA) provides a lucid definition and a variety of resources on information literacy. See “Information Literacy,” https://literacy.ala.org/information-literacy/. ↑
- Ess Pokornowski, Kurtis Tanaka, Darnell Epps, “Security and Censorship: A Comparative Analysis of State Department of Corrections Media Review Policies,” Ithaka S+R, 20 April 2023, https://doi.org/10.18665/sr.318751. ↑