Student Experiences During the Pandemic Pivot
The spring 2020 term was unmistakably shaped by forces outside of the control of higher education leaders. The COVID-19 pandemic caused colleges and universities across the country—and the world—to quickly pivot in an emergency fashion to online teaching, learning, and research while grappling with a host of complex issues in serving students, supporting faculty and staff, and ensuring their financial viability. Thousands of institutions and millions of students were impacted in the United States alone.
In response to these challenges, we rapidly developed a student survey and deployed it in partnership with 21 colleges and universities across the US. The survey explored students’ curricular needs, safety and well-being, and intentions for returning in the fall. It also looked at the efficacy of institutional communications and support. The results reflect strengths and gaps in institutional services, pinpoint opportunity areas for improvements in the delivery of instruction, and, in many cases, amplify student needs that existed prior to the pandemic.
The survey findings, which represent the experiences and needs of over 15,000 students, provide us with an understanding of the challenges that students—and in turn, their faculty, administrators, and institutions more broadly—have faced as we now approach a new year of instruction. While these results should not be interpreted to represent perceptions of online learning that occur outside of the context of a global pandemic, they can inform strategies for another academic term that will no doubt be shaped to some extent by these external forces. Indeed, many higher education institutions and systems have already modified academic calendars and modes of instruction in response.
To continue helping higher education institutions improve the success of their students, we will offer the COVID-19 Student Survey and COVID-19 Faculty Survey again in the coming academic year. These instruments, including versions for mid-term and end-of-term fieldwork, will be available in July. If you would like more information on the upcoming surveys or the data in this report, please contact us at surveys@ithaka.org.
Key insights
- Students generally understood institutional policies related to the pandemic, but they wanted additional communication and support from financial aid and academic advising departments.
- In many cases, the most significant challenges that students faced during the spring semester were those they faced long before the pandemic, including balancing school, work, and home responsibilities. Unexpectedly having to pivot to online learning and finding quiet space to complete work also proved especially difficult.
- Students found collaborative, technical, and specialized assignments to be the most difficult to complete. Assignments that were completed most frequently were ones with which they experienced the least difficulty.
- Students lacked a sense of belonging and connection to others at their institution. While they felt somewhat connected to their instructors, few reported feeling very connected to other students.
- Concerns regarding physical and mental health—especially amongst historically underserved and marginalized student groups—were present for approximately half of students even while they reported high levels of awareness of how to be safe during the pandemic.
- Roughly one in three students reported some concern regarding their food or housing security. Those who reported the greatest concerns were, unfortunately, relatively less likely to know where to go to find emergency aid resources.
- Approximately three-quarters of non-graduating students are highly likely to re-enroll in the fall semester, though many indicated uncertainty about how their timeline for graduating might be affected by the pandemic.
Methodology
The COVID-19 Student Survey, which builds on much of our long-standing survey research with the higher education community, contained questions on key issues of institutional communications and support, curricular needs, safety and well-being, and fall retention.[1] It was fielded from mid-April through mid-May across 21 US higher education institutions:
- Amarillo College
- Birmingham-Southern College
- Centenary College of Louisiana
- DeSales University
- Drake University
- Goldey-Beacom College
- Hagerstown Community College
- Hendrix College
- Lafayette College
- Millsaps College
- Moravian College
- Northern Virginia Community College
- Renton Technical College
- Rollins College
- Saint Joseph’s University
- Samford University
- Southwestern University
- University of Illinois Springfield
- Washington and Lee University
- West Virginia University
- Widener University
These institutions possess a range of institutional missions across research, teaching, and learning dimensions. Within the group are four research universities, four master’s institutions, eight baccalaureate colleges, one special focus four-year college, and four associate’s colleges.[2]
Each COVID-19 Student Survey was distributed by Ithaka S+R under the signatory of the corresponding president, provost, or other institutional leader. Roughly half of the institutions offered incentives for participation; when offered, they were most often Amazon gift cards.
81,293 students were invited to participate in the survey and 15,677 completed it for an overall response rate of 19 percent.[3] The majority of respondents were undergraduate students (82 percent), women (69 percent), and White (75 percent). Additional details regarding participant demographics can be found in the Participant Demographics table at the end of the report.
Data from each of the participating institutions were combined into one aggregate dataset after removing any partial responses, as well as responses to questions that were modified and/or added by an individual institution. We ran frequency and descriptive analyses, as well as cross-tabulations, by relevant demographic and contextual survey questions for each item in the survey.
Institutional communications and support
Students were first asked a series of questions about the effectiveness of institutional communications and support during the spring term. Given how quickly institutional decisions were made and policies were updated, it is notable that students were generally satisfied with the communications coming from their colleges and universities and reported a high level of understanding specific policies. However, they expressed wanting to hear more from a number of specific campus units including financial aid and academic advising.
Most students knew where to go to find up-to-date information on general policies related to the COVID-19 pandemic. Many colleges and universities have devoted webpages—sometimes multiple webpages—for gathering and sharing information about the pandemic, thus this result is perhaps not surprising.[4] However, despite the large amount of information posted on these sites and beyond, students still seem to be able to navigate these resources suggesting that they are effective means of communication.
In addition to knowing where institutional policy information was stored, most students also reported understanding policies in four key areas: coursework, facilities access, anti-discrimination, and travel. Nearly nine in ten students understood their institution’s policies about coursework, including decisions related to instruction type, grading, and withdrawal. Given that coursework decisions affect the entire student population, it is particularly important that these policies are well-understood.[5] Further, eight in ten students understood their institution’s facilities access and anti-discrimination policies. Facilities access policies included if and how students were able to access dormitories, dining halls, libraries, and other physical spaces on campus while it was closed. Anti-discrimination policies were particularly important following media portrayal of COVID-19’s origin in Wuhan, China as fear of the virus stoked racist and xenophobic discrimination targeting Asian communities, which of course includes college students.[6] Finally, seven in ten students understood policies on travel, including both for personal and institutional reasons. Given that not all students engage in institution-sponsored travel, it is not surprising that students understood these policies to a relatively lesser degree.
While students were aware of and understood many policies, some wanted to hear more from certain offices and departments about their services and resources. In particular, approximately half of respondents desired more communication from the financial aid office, while one-third wanted more from academic advising. On the other hand, few students needed more from IT and the library, both of which likely had relatively more robust digital offerings prior to the pandemic, as well as services for student subgroups such as disability services and transfer services. See Figure 1.
Figure 1. Would you like to hear more from any of the following offices or departments at this college or university about current services and resources? Please select all that apply. Percent of respondents that selected each office or department.
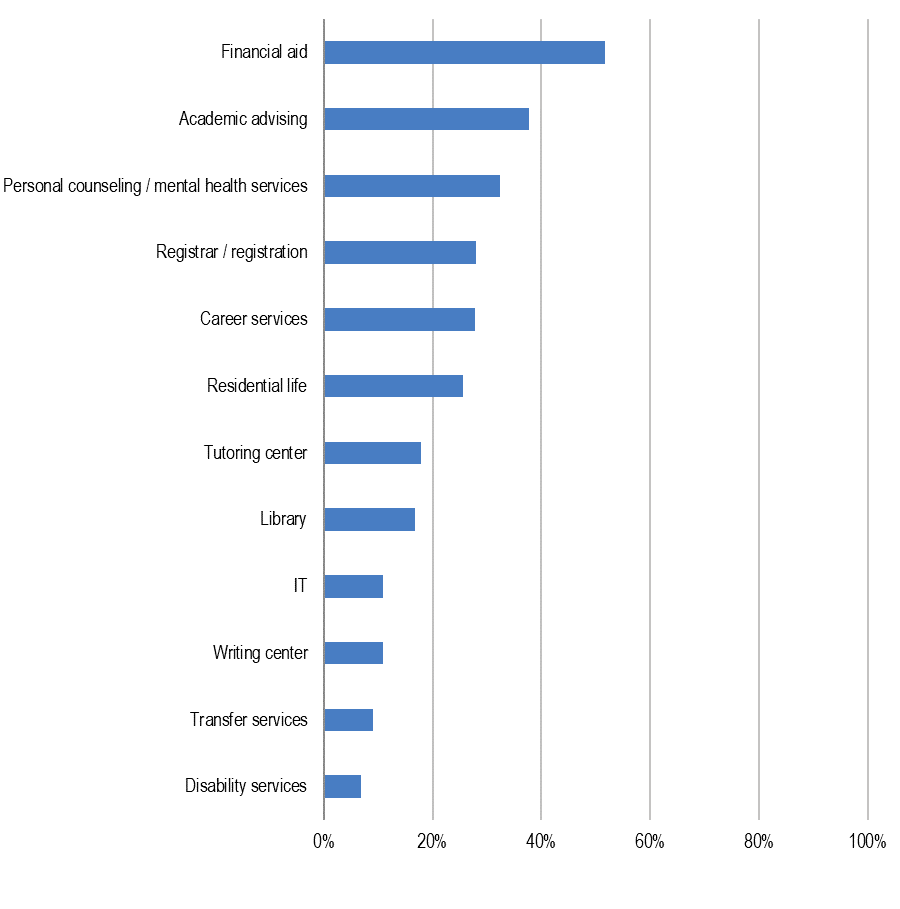 As more undergraduate students than graduate students typically live on campus, it is not surprising that almost eight times as many undergraduate students at four-year institutions requested more communications from residential life compared to graduate students. Graduate students, on the other hand, wanted to hear more from the library (24 percent versus 14 percent of undergraduates). Many of the graduate students who took our survey were past the coursework phase of their degrees, thus they likely needed comparatively more research support instead.
Compared to undergraduate students at four-year institutions, community college students wanted to hear more from academic advising (50 percent versus 37 percent), transfer services (29 percent versus six percent), and the tutoring center (28 percent versus 17 percent). These students were likely signaling greater uncertainty about academics and a desire for more institutional support. Intuitively, Pell-eligible students wanted more communication from financial aid in comparison with non-Pell-eligible peers (65 percent versus 43 percent).
Many of the challenges students reported facing in the spring 2020 term mirror those that they faced before the pandemic, such as balancing family, work, and school and time management. However, these concerns have amplified as students have had to grapple with new challenges like adjusting to online instruction in an emergency fashion and finding sufficient space for completing work. See Figure 2. In a fall 2018 survey of community college students conducted by Ithaka S+R, a smaller share of students reported difficulty with many of the same activities.[7] For example, more than twice as many community college students in spring 2020 had difficulty with finding a quiet space to study compared to those in the previous study. The disparate results in each of these surveys underscores the impact of the pandemic and the importance of physical space for learning.
Figure 2. In the last week, how easy or difficult have each of the following been for you? Percent of respondents that rated each activity as very or somewhat difficult (of those who did each activity).
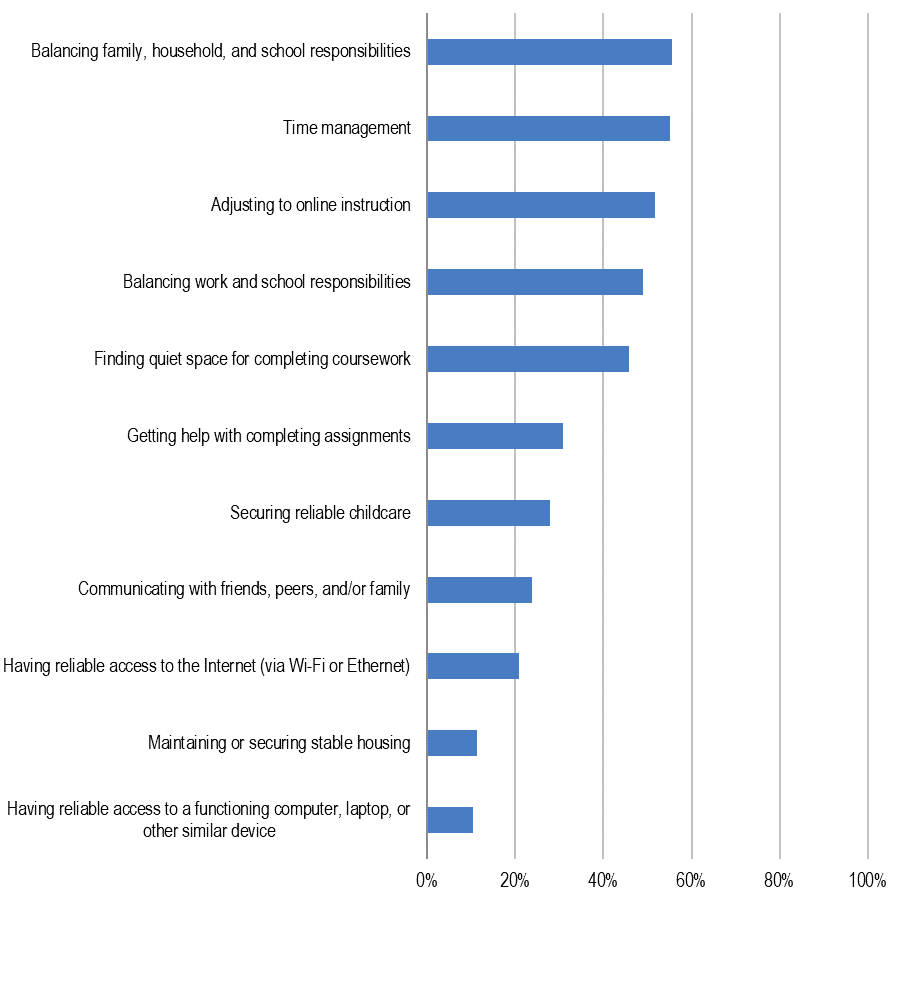 Across the board, a greater share of non-binary and Pell-eligible students had difficulty with these activities—with about 10-20 percentage points more rating most of these activities as difficult—suggesting that greater support is needed for these particular groups.
Further, students who lived on campus prior to the pandemic have had difficulty with adjusting to online learning compared to non-residential students (59 percent versus 44 percent). Students who previously lived on campus may have had less experience with online courses than non-residential students, making the transition more difficult. Additionally, or alternatively, following the transition to remote coursework, non-residential students may have had the effort to commute to campus reduced.
While few students reported difficulty with securing access to a computer or laptop, it is clear that it would have been extremely difficult—if not impossible—to participate in higher education during the prior term without a computer or laptop.[8] Further, it was easier for White students (by a three to 15 point margin) to access computers and laptops than any other racial or ethnic group. Providing relevant technological support to students who need it the most is an important step toward closing equity gaps.
Course activities and formats
As colleges and universities plan for a fall term that will for many students take place at least partially at a distance and with the impacts of the pandemic still lingering, it is critical to understand the challenges they faced in participating in coursework in the spring term. Fortunately, many students reported low levels of difficulty with completing many types of assignments and with accessing resources needed to complete those activities. However, work that was especially collaborative, technical, and specialized did prove to be an obstacle.
Instructors held their classes in a variety of formats after the pivot to virtual instruction. Roughly half of students took both synchronous and asynchronous courses virtually, while about two in ten participated solely in asynchronous or synchronous virtual courses.[9] Less than one percent of students took in-person courses.
A majority of students—roughly three quarters—felt they had the tools and resources needed to complete their coursework for the semester or term. While there were some differences in perceived preparedness by discipline—for example, students in social science disciplines were more likely, by about 5-10 percentage points on average, to agree they had the resources they needed—it is actually remarkable how few differences emerged given the variance of course formats across disciplines. For example, students in biology classes were much more likely than those in any other discipline to be taking lab classes, and those in education and social service majors were much more likely to be participating in internships, practicums, and co-ops—which one might assume proved more difficult at a distance as compared to a lecture, seminar, or discussion section format—but students in these disciplines responded on average relatively more positively than their peers in other disciplines about having needed tools and resources for coursework. Of course, it is possible that parts of these hands-on and experiential courses were abandoned altogether in the new modality—though this cannot be confirmed via our survey data.
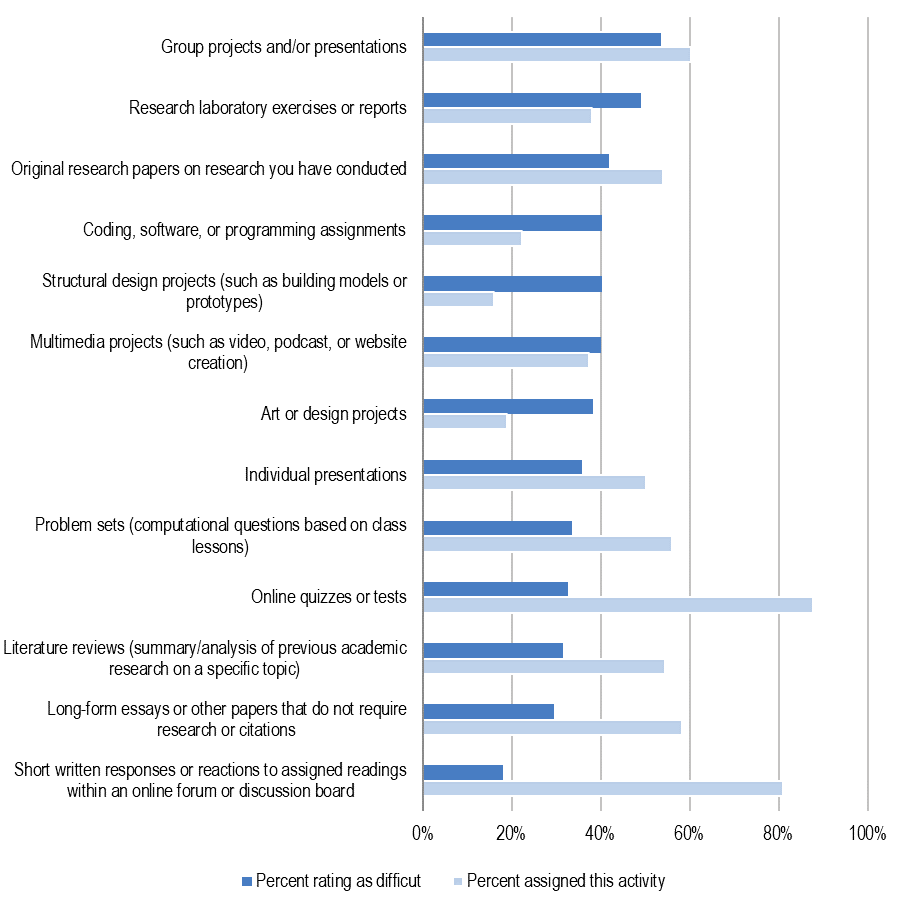
Group projects and research laboratory exercises were the most challenging assignments for students to complete in the spring semester. See Figure 3. Many of the activities that students were most frequently assigned—like short written responses to assigned readings, online quizzes and tests, and long-form essays—tended to be perceived as easiest.
Figure 3. In the last week, how easy or difficult has it been to perform each of the following course activities or assignments? Percent of respondents that rated each as very or somewhat difficult (of those who were assigned the activity), and the percent of respondents that were assigned each activity.
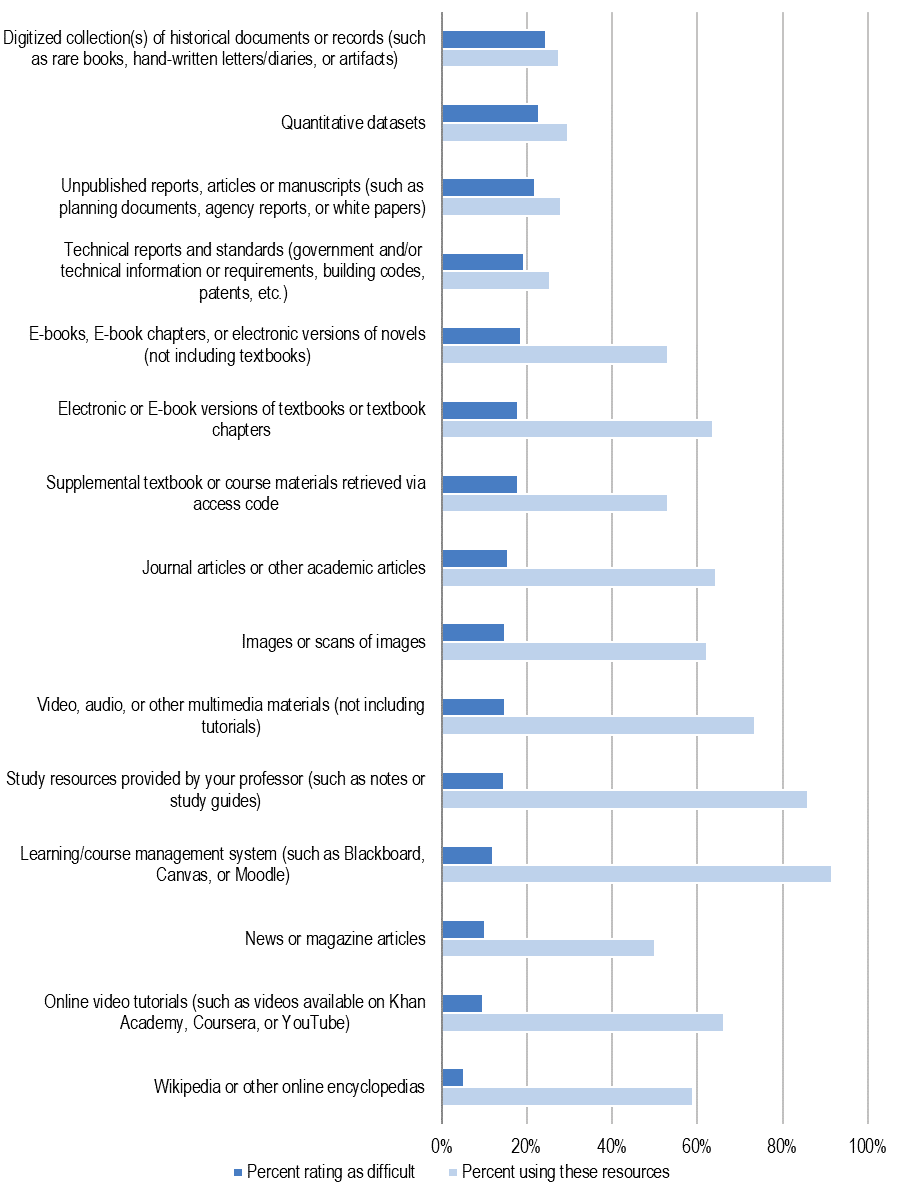
Similarly, the most frequently utilized resources for working on course assignments were among those that were rated easiest to use. Resources that are more specialized and technical, such as digitized primary source collections, datasets, and technical reports, tended to be most difficult to use. See Figure 4. As faculty are designing their courses, and as campus partners like librarians and instructional designers are supporting this work, these data will be important to consult for anticipating possible barriers.
Figure 4. In the last week, how easy or difficult has it been to use each of the following resources for completing your coursework? Percent of respondents that rated each as very or somewhat difficult (of those who used each resource), and the percent of respondents that used each of the following resources.
Student well-being
While much of the focus of the spring term was in ensuring instructional continuity, students faced many significant non-curricular challenges, including a lack of connection to one another, anxieties about mental and physical health, and concerns regarding finances. These challenges were especially pronounced for students in demographic groups that have historically been underserved and marginalized.
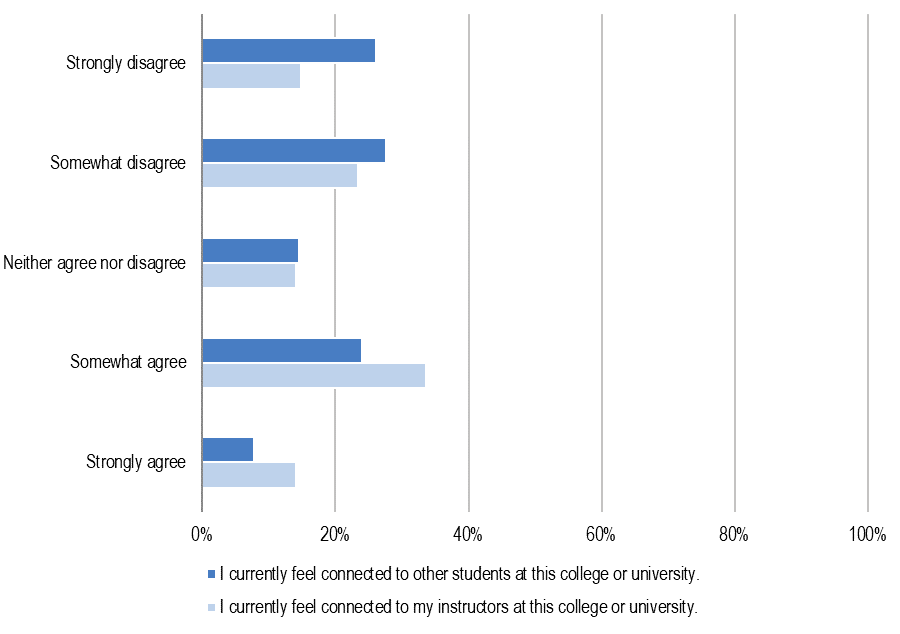
After the emergency shift to virtual instruction, students did not feel especially connected to each other or their instructors. While connectivity with both groups were rated low, it is notable that students overall felt more connected to their instructors than each other. Graduate students as well as community college students tended to feel relatively more connected to their instructors than did undergraduates at four-year colleges, and graduate students also felt relatively most connected to other students.
Figure 5. Please read each of the following statements and tell us the extent to which you agree or disagree. Percent of respondents that selected each response.
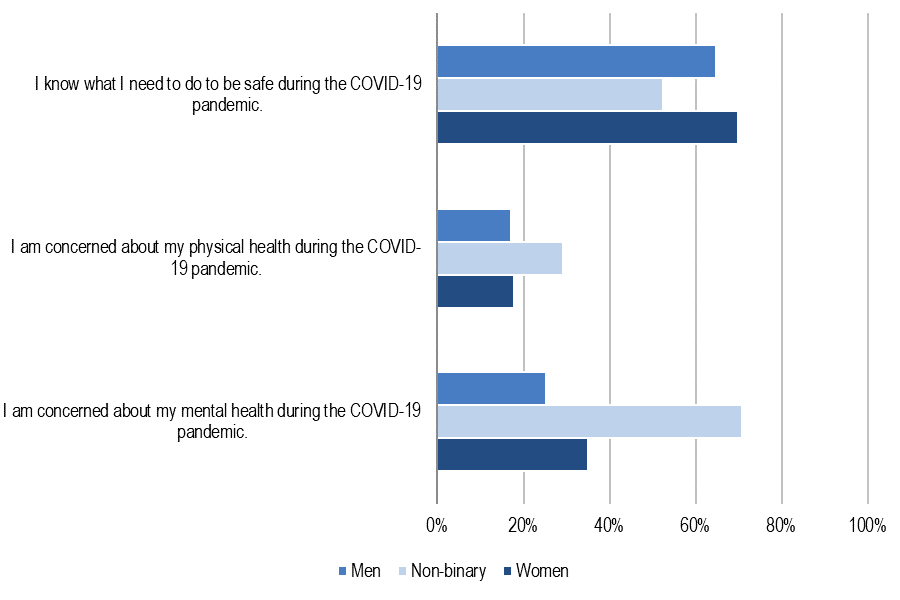
While the majority of students reported being well-aware of what they needed to do to stay safe during the pandemic, many still struggled with concerns over mental and physical health. While the physical effects of COVID-19 have been documented extensively, students actually reported relatively greater concern over their mental health than their physical health. About 33 percent of students strongly agreed that they are concerned about their mental health compared to 17 percent about their physical health.
Across student subgroups, those who identified as transgender, non-binary, and students of color, as well as those who are caregivers to siblings, parents, and/or grandparents, displayed higher concern for their physical and mental health than their peers. For instance, students who identified as transgender displayed far higher concern for their mental and physical health than their peers, and were less likely to know what to do to be safe. A similar trend was evident with non-binary students compared to their peers (see Figure 6).
Figure 6. Percent of respondents that strongly agreed with each statement by gender identity.
While students across different racial-ethnic groups share similar levels of concern about their mental health, those who are White were less likely to express strong concern about their physical health (15 percent versus 18-29 percent). Students who are Middle Eastern or North African, American Indian or Alaska Native, and Black or African American reported the highest levels of concern about their physical health compared to those of other racial-ethnic groups.
Further, students who are caregivers for a parent, grandparent, and/or sibling are more likely than those who are parents or guardians and those who are not responsible for any caregiving capacity to worry about their physical and mental health. Approximately 31 percent of student caregivers strongly agreed they are concerned for their physical health compared to 22 percent of student parents and guardians and 16 percent of students who are neither. Likewise, 47 percent of student caregivers strongly agreed they are concerned for their mental health compared to 23 percent of student parents and guardians and 33 percent of students who are neither.
The majority of students—about 60-70 percent of students—reported no concerns regarding basic needs of food and housing. Of course, this means that the remaining 30-40 percent of students did specify some level of concern. As evidenced by a survey conducted earlier this year by the Hope Center, for many students these issues existed at a similar magnitude prior to the pandemic.[10] Overall, there were greater concerns expressed in our survey regarding housing as compared to food, likely at least in part because of the unexpected loss of on-campus student housing.
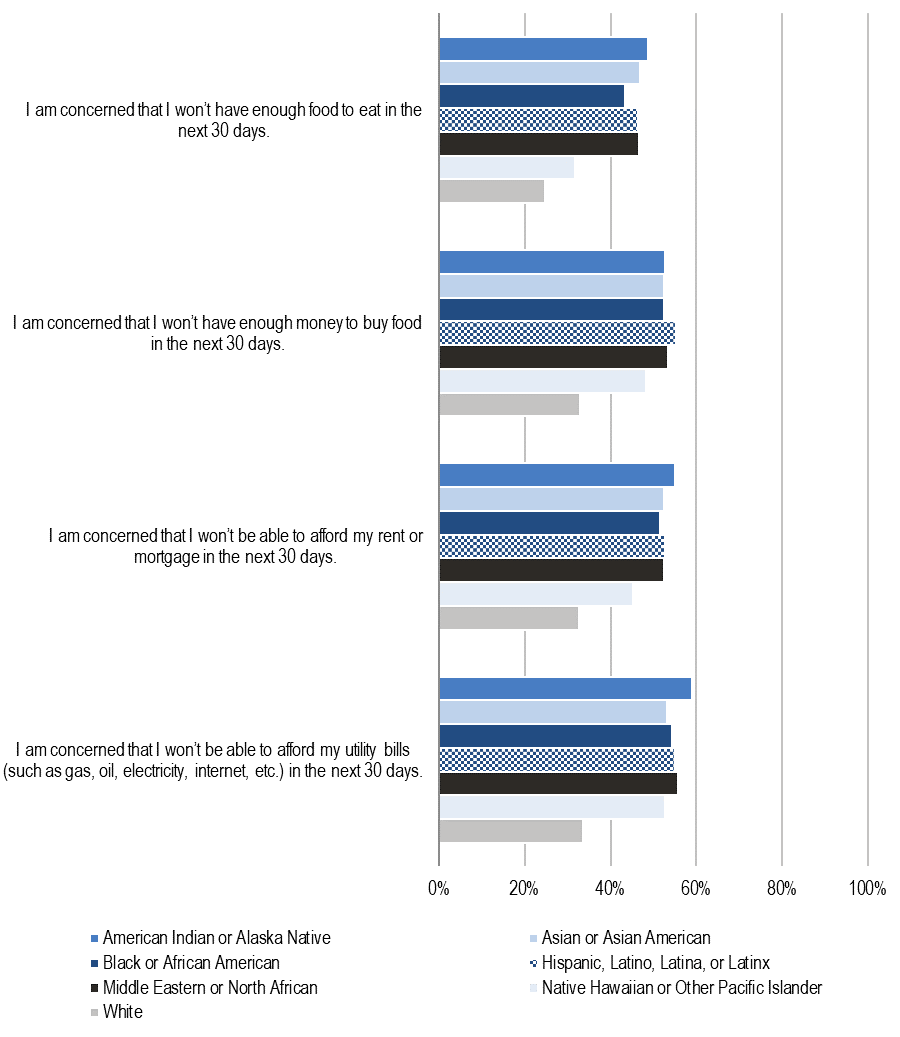
Of those students who did display concerns around basic needs as a result of the pandemic, higher rates were found with students of color and Pell-eligible students. The differences by race/ethnicity are stark; almost double the share of students of color report concern for maintaining their basic needs—both related to food and housing—compared to their White peers. See Figure 7. Comparable differences were found between students who are Pell-eligible and those who are not. Not surprisingly, students at community colleges—which tend to serve student populations that are relatively more diverse and financially disadvantaged—reported greater concerns than those at four-year institutions.
Figure 7. Please read each of the following statements and tell us the extent to which you agree or disagree. Percent of respondents that did not strongly disagree with each statement by race/ethnicity.
Students who were concerned about one set of basic needs generally were also concerned about other basic needs. That is, there were a series of strong, direct relationships between concerns about having enough food, having enough money to buy food, being able to afford rent and mortgage, and affording utility bills. See Table 1.
Students who are struggling with food and housing insecurity are sometimes less likely than their peers who are not struggling with these issues to know where to go to find emergency resources like emergency funding/loans, food pantries, shelters, etc. While these inverse correlations are not strong, the directionality is troubling. The students who need these resources the most should be the ones with the greatest levels of awareness of where to find them.
Table 1. Correlations associated with basic needs concerns due to the COVID-19 pandemic.
| 1 | 2 | 3 | 4 | 5 | |
|---|---|---|---|---|---|
| 1. I am concerned that I won’t have enough food to eat in the next 30 days. | -- | ||||
| 2. I am concerned that I won’t have enough money to buy food in the next 30 days. | .759** | -- | |||
| 3. I am concerned that I won’t be able to afford my rent or mortgage in the next 30 days. | .650** | .789** | -- | ||
| 4. I am concerned that I won’t be able to afford my utility bills (such as gas, oil, electricity, internet, etc.) in the next 30 days. | .659** | .807** | .926** | -- | |
| 5. I currently know where to find information on available emergency resources (such as emergency funding/loans, food pantries, shelters, etc.). | -.136** | -.162** | -.159** | -.156** | -- |
Looking to fall enrollment
While there have been many surveys published on the share of high school seniors rethinking if and where to attend college in the fall, there has been relatively little on the expected retention of currently-enrolled college students, though all colleges are likely forecasting various retention scenarios at a local level.[11] While according to our survey results the majority of non-graduating college students are very likely to re-enroll at their current college or university in the fall, many students are facing uncertainty about their longer-term timeline for degree completion.
Excluding those who were graduating, more than eight in ten respondents reported that they were very or somewhat likely to re-enroll in classes in the coming semester.[12] At the time when our survey was fielded in April and May, students did not have much information about the format of courses in the coming semester, and it is possible that many students believed that their college or university campuses would be physically open and in-person classes would be held. While it is beyond the scope of the current survey to determine how many students would decide not to re-enroll if their campuses remained closed, open-ended responses indicate that this may be the case for some.
Eight percent of the students who planned to re-enroll anticipated their timeline for graduating would be affected by the pandemic, and an additional one-third were unsure if their timeline would be impacted. Additional academic advising support may help students better understand how their time to degree has been impacted and what they can do to minimize the impact.
Roughly one-fifth of non-graduating students reported that they would not return in the fall semester or were unsure of their plans. Of these students, almost one-third were considering or planning on transferring to another college or university, one in six were not planning on continuing their education at all, and more than half selected that they had some other reason not to re-enroll. Some of these reasons include financial constraints, perceived decrease of educational value of online compared to in-person instruction, difficulty with online learning, and general difficulty during the current semester.
Likelihood to re-enroll was associated with a number of requests and concerns. Students who planned to re-enroll were more aware of where to find institutional resources than those who did not plan to re-enroll (84 percent versus 72 percent). See Figure 8. Further, students who planned not to re-enroll were more likely to want to hear more from academic advising and transfer services (23 percent-44 percent versus seven percent-39 percent). In order to retain these students, institutions may need to increase relevant outreach and support.
Figure 8. Please read each of the following statements and tell us the extent to which you agree or disagree. Percent of non-graduating respondents that selected strongly or somewhat agree with each statement by likelihood to re-enroll in the fall.[13]

Further, only about half of the students who are not planning to re-enroll felt they had the tools and resources needed to complete their coursework compared to three-quarters of the students who planned to re-enroll. In addition to the institutional support recommended above, direct support from faculty will be crucial for retaining these students. College and university guidelines for faculty may help in this effort so that instructors do not need to develop support strategies individually.
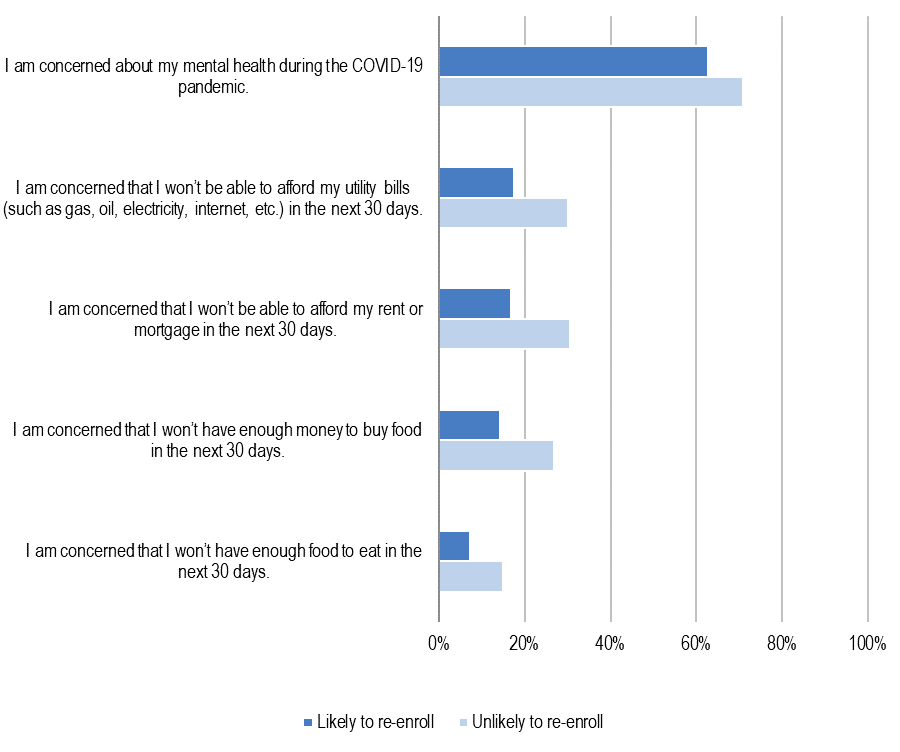
Approximately half as many students who are not planning to re-enroll felt connected to other students compared to those who did plan to re-enroll. Additionally, these students were more likely to be concerned about their mental health (71 percent versus 63 percent). College or university-sponsored virtual social activities, collaborative curricular activities, as well as counseling and mental health resources could help address these concerns.
Finally, half as many students who plan to re-enroll are concerned about basic needs including access to food, money to buy food, and their ability to pay rent and utilities compared to those who don’t. See Figure 9. A greater share of those who planned to re-enroll also knew where to go to find emergency resources such as food pantries and shelters. If students who need emergency resources and financial support the most are not adequately connected with these resources, they may be forced to choose between work and school. Providing resources to students with the greatest needs is important for closing equity gaps and keeping students on track for achieving their goals.
Figure 9. Please read each of the following statements and tell us the extent to which you agree or disagree. Percent of non-graduating respondents that selected strongly or somewhat agree with each statement by likelihood to re-enroll in the fall.
Recommendations
We hope that the analysis provided in this report not only identifies the challenges faced by students and their institutions during the spring 2020 term but a number of opportunities for improvements in the coming academic year and beyond. To that end, we propose the following recommendations stemming from these data as a starting place for higher education institutions.
Continue to communicate. Students generally reported a high level of understanding institutional policies. As colleges and universities generate new policies and announce these decisions for the upcoming academic year, they should continue to communicate them broadly. Institutions should consider targeted outreach to certain student subgroups, for example those living on campus or engaged in sponsored research, to relay specific policy implications.
Rethink technical and specialized coursework. Given the challenges that students encountered in particular with technical resources and coursework, colleges and universities will need to more heavily adapt related coursework for remote instruction and/or give special consideration regarding the extent to which relevant classes can be prioritized to take place in-person. When these and other classes do take place face-to-face in the short-term, reduced class sizes, special cleaning procedures and seating arrangements, face coverings, and widespread testing will likely be necessary to ensure the safety of students, faculty, and the broader community.[14]
Enhance connection and collaboration. While there have been tremendous efforts across the higher education sector to ensure instructional continuity, many students reported lacking the interpersonal connection with one another that is a key component of the educational experience, especially within residential institutions. Further, from a curricular perspective, group projects and presentations were considered to be among the most difficult types of assignments. Student affairs leaders who have not yet developed robust student life offerings in a digital format and/or have not yet raised awareness of these offerings, as well as faculty who have not adapted group work for teaching and learning at a distance, will need to provide a more fulfilling college experience both inside and outside of “the classroom.”
Invest in academic and financial advising. Understandably, many students are concerned and uncertain about their financial and academic standing and want more information from departments providing corresponding services. Being prepared to reach a greater share of students and bolster awareness of these services may require investments in additional personnel and systems.
Target students with the greatest need. Students from groups that were historically underserved and marginalized before the pandemic were more likely to face challenges during the spring 2020 term. When resources are scarce, which is the case for all but very few higher education institutions, they should be made available to those who need it the most. This is not only important for furthering the mission of higher education institutions in serving the public good but is a practical step for ensuring students do not leave higher ed without completing a degree. Disaggregating data by student subgroups is foundational for this equity-focused work—and the students served by it—to succeed.
Participant Demographics
| Population demographic | Percentage | Frequency |
|---|---|---|
| Student type | ||
| Undergraduate student | 81.52% | 12786 |
| Graduate/professional student | 18.57% | 2912 |
| Class year or level | ||
| First year | 23.16% | 2373 |
| Second year | 28.77% | 2948 |
| Third year | 23.81% | 2440 |
| Fourth year | 21.31% | 2183 |
| Other | 2.95% | 302 |
| Residential status earlier in term | ||
| On-campus | 47.10% | 5741 |
| Off-campus | 52.90% | 6447 |
| Major or field of study | ||
| Agriculture & Natural Resources | 1.48% | 228 |
| Architecture & Engineering | 5.02% | 772 |
| Arts & Humanities | 12.20% | 1878 |
| Biological Sciences | 9.51% | 1464 |
| Business | 19.34% | 2976 |
| Communications, Media, & Public Relations | 5.06% | 778 |
| Education | 7.01% | 1079 |
| Health Professions | 20.36% | 3133 |
| Mathematics & Computer Science | 6.19% | 952 |
| Physical Sciences | 4.09% | 629 |
| Social Sciences | 14.99% | 2307 |
| Social Service Professions | 3.70% | 570 |
| Other | 15.47% | 2380 |
| Caregiver status | ||
| Parent / guardian of a dependent minor | 10.97% | 1686 |
| Caregiver for a parent / grandparent and/or sibling | 4.94% | 759 |
| Not a caregiver | 84.91% | 13049 |
| Pell Grant status | ||
| Received or currently eligible for Federal Pell Grant | 21.82% | 3361 |
| Have not received or currently eligible for Federal Pell Grant | 39.91% | 6147 |
| Don’t know/Not sure if received or currently eligible for Federal Pell Grant | 38.27% | 5895 |
| Parent education status | ||
| Parent(s) completed four-year college/university degree | 65.27% | 10045 |
| Parent(s) did not complete four-year college/university degree | 34.73% | 5344 |
| Gender | ||
| Man | 28.88% | 3538 |
| Woman | 69.07% | 8460 |
| Non-binary | 1.06% | 130 |
| Another option not listed here | 0.31% | 38 |
| I prefer not to answer this question | 1.31% | 160 |
| Transgender | ||
| Yes | 0.60% | 85 |
| No | 98.04% | 13891 |
| I prefer not to answer this question | 1.36% | 193 |
| Race-ethnicity | ||
| American Indian or Alaska Native | 1.08% | 146 |
| Asian or Asian American | 7.02% | 945 |
| Black or African American | 8.74% | 1176 |
| Hispanic, Latino, Latina, or Latinx | 10.64% | 1432 |
| Middle Eastern or North African | 1.32% | 178 |
| Native Hawaiian or Other Pacific Islander | 0.45% | 60 |
| White | 75.31% | 10135 |
| Another option not listed here | 0.74% | 99 |
| I prefer not to answer this question | 2.33% | 313 |
| Institution’s Carnegie Classification | ||
| Associate’s Colleges | 15.02% | 2354 |
| Special Focus Four-year College | 2.16% | 339 |
| Baccalaureate Colleges | 25.89% | 4059 |
| Master’s Colleges & Universities | 19.39% | 3040 |
| Doctoral Universities | 37.54% | 5885 |
| Format of classes | ||
| Virtual in real time (students are expected to attend a virtual class at a specified time) | 75.24% | 11220 |
| Virtual not in real time (students can watch a pre-recorded lecture and/or participate in course activities at any time) | 73.02% | 10888 |
| In-person | 1.90% | 283 |
| Other | 6.22% | 928 |
| Type of classes | ||
| Laboratory, experimental, or field study | 33.29% | 4954 |
| Lecture or seminar | 85.91% | 12786 |
| Fine and performing arts (art, music, dance, drama, etc.) | 12.17% | 1811 |
| Internship, practicum, or co-op | 8.37% | 1246 |
| Capstone or thesis | 10.62% | 1581 |
| Honors | 5.32% | 792 |
| Discussion section | 30.22% | 4498 |
| Other | 7.31% | 1088 |
Endnotes
- For example, see: Melissa Blankstein, Christine Wolff-Eisenberg, and Braddlee, “Student Needs Are Academic Needs: Community College Libraries and Academic Support for Student Success,” Ithaka S+R, 30 September 2019, https://doi.org/10.18665/sr.311913, and Melissa Blankstein and Christine Wolff-Eisenberg, “Ithaka S+R US Faculty Survey 2018,” Ithaka S+R, 12 April 2019, https://doi.org/10.18665/sr.311199. ↑
- One institution with the Carnegie Classification designation of “Baccalaureate/Associate’s Colleges: Associate’s Dominant” has been grouped for analytical purposes with associate’s colleges. ↑
- This compares favorably to typical response rates we have previously seen from other surveys of undergraduate students at peer institutions. ↑
- For an analysis of college and university websites communicating policies and decisions to students during the spring 2020 term, see: Melissa Blankstein and Jennifer Frederick, “Communicating COVID-19 in Higher Ed: Student Edition,” Ithaka S+R, 20 March 2020, https://sr.ithaka.org/blog/communicating-covid-19-in-higher-ed-student-edition/. ↑
- There are indeed graduate students in later phases of their degrees that are not in a coursework stage. These students were screened out of subsequent questions about course assignments and resources. ↑
- B. Venkat Mani, “Fighting the Shadow Pandemic,” Inside Higher Ed, 14 May 2020, https://www.insidehighered.com/views/2020/05/14/inclusive-teaching-needed-help-combat-xenophobia-racism-and-discrimination-brought. ↑
- Melissa Blankstein, Christine Wolff-Eisenberg, and Braddlee, “Student Needs Are Academic Needs: Community College Libraries and Academic Support for Student Success,” Ithaka S+R, 30 September 2019, https://doi.org/10.18665/sr.311913. ↑
- The COVID-19 Student Survey was also fielded online and thus respondents without a functioning device and/or internet access would have had difficulty responding. ↑
- In the survey, synchronous virtual classes were referred to as “virtual in real time (students are expected to attend a virtual class at a specified time)” and asynchronous virtual classes were referred to as “virtual not in real time (students can watch a pre-recorded lecture and/or participate in course activities at any time).” ↑
- Sara Goldrick-Rab et al., “#RealCollege During the Pandemic,” The Hope Center, 2020, https://tacc.org/sites/default/files/2020-12/hopecenter_realcollegeduringthepandemic.pdf. ↑
- For example, Scott Jaschik, “Colleges Could Lose Up to 20% of Students,” Inside Higher Ed, 29 April 2020, https://www.insidehighered.com/admissions/article/2020/04/29/colleges-could-lose-20-percent-students-analysis-says, and Scott Jaschik, “The Online Risk,” Inside Higher Ed, 19 May 2020, https://www.insidehighered.com/admissions/article/2020/05/19/one-third-high-school-seniors-say-they-will-defer-or-cancel-rather. ↑
- This rate is similar to that found in another recent study of college students: E. Felix and T. Garcia, “Taking the Pulse of Students During COVID-19,” Brightspot, 25 May 2020, https://www.brightspotstrategy.com/whitepaper/student-experience-snapshot-covid-19. ↑
- Here and in the following figure, likely to re-enroll refers to students who reported they were very or somewhat likely to enroll in the upcoming semester, and unlikely to re-enroll refers to those who selected they were very or somewhat unlikely to enroll. ↑
- For a summary of currently available information about guidance and plans for the reopening of higher education institutions in the United States, see: Elizabeth Banes, “Higher Ed’s Response to COVID-19 and Plans for Reopening: Interim Report,” Ithaka S+R, 2020, https://sr.ithaka.org/our-work/higher-eds-response-to-covid-19-and-plans-for-reopening/. ↑
- Percentages may not total 100 percent due to rounding or format of question. Not all participating institutions included every demographic question; it has been noted when more than one institution removed and/or modified a question. ↑
- Four participating institutions removed and/or modified this question; corresponding responses are omitted from these figures. ↑
- Two participating institutions removed and/or modified this question; corresponding responses are omitted from these figures. ↑
- One institution with the Carnegie Classification designation of “Baccalaureate/Associate’s Colleges: Associate’s Dominant” has been grouped for analytical purposes with associate’s colleges. ↑