US Library Survey 2022
Navigating the New Normal
-
Table of Contents
- Executive Summary
- Introduction
- Methodology
- Acknowledgements
- Navigating the New Normal
- Director Role, Governance, and Relationship to the Institution
- The Role of the Library and Strategic Priorities
- Budget
- Staffing and Talent Management
- Diversity, Equity, Inclusion, and Accessibility
- Teaching and Student Success
- Institutional Assessment, Data Sharing, and Privacy
- Collections
- Conclusion
- Appendix A: Participant Demographics
- Endnotes
Executive Summary
The Ithaka S+R Library Survey has examined leadership and strategic perspectives in the field by surveying library deans and directors nationally on a triennial basis since 2010. The research project’s overarching goals are to provide the library community with a valuable data source to inform decision making and track the emerging opportunities and challenges leaders face in steering their organizations. In fall 2022, we surveyed library leaders at not-for-profit four-year academic institutions across the United States, with a response rate of 42 percent based on 612 responses.
In this sixth iteration of the project, we continued to track high-level issues of strategy, leadership, budget, staffing, and institutional alignment. We also introduced new batteries of questions related to broader trends in higher education, including remote and hybrid learning, talent retention, and research data management, and expanded our coverage of open access and diversity, equity, inclusion, and accessibility (DEIA).
Key Findings
- Priorities continue to shift from collections to services. A third of library deans and directors project an overall decrease in expenditures directed towards general collections, especially print resources. Services to support research and teaching and learning are growing priorities, and doctoral institutions in particular are interested in building or expanding research data management services.
- For roughly half of respondents, convincing campus leaders of the library’s value proposition remains a challenge. While over 72 percent of library deans and directors report high levels of confidence in their own ability to articulate their library’s value proposition in a way that aligns with the goals of the institution, only 51 percent are confident other senior administrators believe in this alignment.
- Student academic success remains a top priority across institution types. Deans and directors see the library contributing most strongly to increasing student learning and helping students develop a sense of community, rather than to other metrics such as addressing student basic needs or improving post-graduation outcomes.
- Information literacy may not have kept up with today’s needs. While information literacy instruction is a core priority, less than half of respondents are confident their library has a well-articulated strategy for combating misinformation or disinformation.
- Many library deans and directors are grappling with talent management and recruitment challenges. Nearly a fifth of respondents anticipate reducing staff in access services and technical services, metadata, and cataloging within the next five years. Furthermore, deans and directors are currently struggling to recruit personnel for roles in technology and programing, DEIA, cataloging and metadata, and indicate they are most likely to consider outsourcing cataloging and metadata and technology and programming skills.
- Confidence in library and institutional DEIA initiatives is waning. While directors indicate these strategies are a high priority, only a quarter are confident their libraries have well-developed DEIA strategies, down from over a third in fall 2020.
- Deans and directors see an increasingly open future—one they believe will result in an increase in costs for their institution. Roughly one quarter of deans and directors across institution type believe transformative agreements are a great mechanism for moving their institutions into the future of open access. Yet, a third of directors do not see libraries and publishers as allied with one another when it comes to open access developments. Directors believe an increasingly open future will not result in cost-savings.
Introduction
Since 2010, Ithaka S+R has conducted the Library Survey on a triennial basis with the overarching goal of tracking the perspectives, priorities, and leadership strategies of library deans and directors at four-year academic institutions. This study is part of a larger international research portfolio, which includes the Ithaka S+R US Faculty Survey and surveys of leaders and staff in the museum, cultural heritage, and archives fields. Collectively, these survey-based research projects shed light on differences in perspectives across multiple professions and communities, as well as common priorities and challenges that bridge them.
This study in particular is designed to provide library and other higher education leadership with a high-level overview of the topics that are at the forefront of library leaders as they conceptualize the role, strategic alignment, and value proposition of academic libraries on campuses. Given the study is now in its sixth iteration, the questionnaire includes topics we have been tracking for several cycles, as well as new ones meant to capture the pulse of the current ecosystem of higher education.
Consistent with previous iterations of this survey, this cycle focuses on the core role and functions of the library, the relationship of its leader to other senior administrators, and library strategy, budgeting, staffing, and collections. This cycle we are also tracking topics that speak to emerging trends in the field, such as research data management services. We have also introduced new questions to further probe how library leaders prioritize diversity, equity, inclusion, and accessibility initiatives, as well as their perspectives on the open access landscape through.
Methodology
Consistent with previous cycles, for the 2022 survey Ithaka S+R generated a contact list of library deans and directors (hereafter referred to as “directors,” regardless of their exact titles) at four-year colleges and universities across the United States. To qualify an institution had to have one of the following classifications within the Carnegie Classification of Institutions of Higher Education database:
- Baccalaureate Colleges: Baccalaureate/Associate’s Colleges: Associate’s Dominant
- Baccalaureate Colleges: Mixed Baccalaureate/Associate’s
- Baccalaureate Colleges: Diverse Fields
- Baccalaureate Colleges: Arts & Sciences Focus
- Master’s Colleges & Universities: Small Programs
- Master’s Colleges & Universities: Medium Programs
- Master’s Colleges & Universities: Larger Programs
- Doctoral/ Professional Universities
- Doctoral Universities: High Research Activity
- Doctoral Universities Very High Research Activity
Based on these criteria, the final generated list consists of 1,508 institutions. Where possible, a single individual from each institution was chosen as the point of contact for the survey. A small number of institutions have two or more co-directors—in these cases we asked that they work together to complete the survey, and we restricted the ability to submit more than one response from any given institution. Of the 1513 individuals we attempted to contact, 47 email invitations bounced or failed, bringing our total sample of deans and directors to 1,466.
Of the 1,466 directors who received email invitations to participate in our survey on October 12, 2022, we received 612 completed responses, for an overall response rate of 42 percent. The responses vary by Carnegie Classification, as seen in Table 1.
Table 1 – Carnegie Class
For full demographic information on the sample, see Appendix A.
| Carnegie Classification | Frequency | Percentage |
| Baccalaureate | 168 | 28.5% |
| Master’s | 197 | 33.4% |
| Doctoral | 224 | 38.0% |
It is worth noting that our sample skews towards deans and directors from private institutions (55 percent), who have been in their current position for five or fewer years (58 percent), are over 45-years old (82 percent), female (63 percent), white (84 percent), and hold an MLS or MLIS degree (86 percent).
To analyze the data, we used a variety of statistical analysis techniques, ranging from frequencies and other descriptive analyses, as well as independent samples t-tests, one-way ANOVA with Tukey’s HDS tests, chi-square analyses, and ordered probit regression. Included in this report are findings that are significant at the alpha level of p<.05. For frequency-based figures, we display responses at the high end of the scales used, which we operationalize as indicating strong agreement. Thus, for a 10-point Likert scale, we report the cumulative frequency of the top three response options (8-10), and for 5,6, or 7-point Likert scales we display the cumulative frequency of the top two response options. In the case of historic questions that predate the current cycle, we also illustrate the frequencies of responses over time, highlighting any percentage change of ±10 percent. Consistent with previous cycles, we conducted stratification analysis in order to highlight differences by key institutional or demographic sub-groups, such as Carnegie Classification, sector, race, gender, and educational attainment.
Datasets from each cycle of this study since 2010 have been deposited with ICPRS for long-term preservation and access, and we will deposit the 2022 dataset similarly.
Acknowledgements
We are grateful for our advisory board’s generous time and insights in helping establish the themes of the questionnaire, as well as providing feedback at key stages throughout the design and analysis process. The nine members of the project’s advisory board are:
- Kristin Antelman – University Librarian, UC Santa Barbara
- Rhea Ballard-Thrower – University Librarian and Dean of Libraries, University of Illinois-Chicago
- Vanessa Beasley – President, Trinity University
- Faye Chadwell – Dean of University Libraries, Pennsylvania State University
- Emily Chan – Associate Dean for Research and Scholarship, San José State University
- Emily Guhde – Director of Organizational Effectiveness and Planning, Georgetown University
- Martha Sedgwick – VP for Product Innovation, Sage Publishing
- John Sherer – Spangler Family Director, University Of North Carolina Press
- Courtney Young – University Librarian and Professor in the University Libraries, Colgate University
The instrument also benefited from pretesting from the following library leaders:
- Rick Anderson – University Librarian, Brigham Young University
- Valeda Dent – Vice Provost of Libraries and Museum, Emory University
- Jill Emery – Collection Development and Management Librarian and Professor of Information & Library Science, Portland State University
- Kevin Garewal – Vice Provost and Andrew H. and Janet Dayton Neilly Dean of Libraries, University of Rochester
- Benjamin Harris – Interim University Librarian and Professor, Trinity University
- Salwa Ismail – Associate University Librarian for Digital Initiatives and Information Technology and Associate CIO for Library, UC Berkeley
- Holly Jeffcoat – Dean of Libraries, Southern Methodist University
- Krisellen Maloney – Distinguished Professor, Rutgers University
- Michael Meth – Dean of University Library, San Jose State University
We are also grateful to our colleagues here at Ithaka S+R who contributed to the project at various key stages, including Mark McBride, Danielle Cooper, Roger Schonfeld, Kimberly Lutz, and Juni Ahari. In particular, this work could not have been possible without the significant contributions of Nicole Betancourt and Sage Love, who administered the survey.
In 2020, less than a year after the 2019 scheduled cycle of the Library Director Survey, Ithaka S+R fielded a special edition of the study, meant to capture pandemic-related decision-making among academic libraries,[1] as well as changing perspectives on diversity, equity, inclusion, accessibility, and anti-racism in the wake of the murder of George Floyd and the subsequent nation-wide protests.[2] That cycle of the survey was a direct acknowledgement that the 2019 Library Director Survey findings were virtually moot in the face of extraordinary times.
By fall of 2022, when Ithaka S+R “returned” to its triennial-established timeline, the extraordinary had become ordinary. The two-week lockdown became a still-ongoing pandemic, the national movements for racial justice continue in Supreme Court challenges to affirmative action admissions and the substantive content of historical instruction in schools, the Great Resignation-turned-Reshuffle pits quiet quitters against return-to-office calls, and university and college consolidations scenarios are starting to emerge as responses to enrollment cliffs.
While it is difficult to pinpoint which trends in higher education have been directly caused by these exogeneous events, as opposed to merely exacerbated by them, one of the guiding questions we had in designing the instrument for this cycle had to do with a conscious effort to not focus on the exceptionalism of the times or of any given situation, but rather the new normal in which library leaders, amongst all of us, must operate.
Director Role, Governance, and Relationship to the Institution
One of the first questions that arises then is how library leaders see their role, that of the library, and their relationship to the larger institution and other senior administrators. In this section we explore how library directors spend their time, what skills and constraints they operate with, and how they perceive the library’s alignment to the parent-institution.
Consistently since 2019, the majority of library directors’ time is spent on administration of the library, including budgeting, staffing, and management related-activities (49 percent of the time), followed by institution-wide initiatives or campus engagement outside of the library (16 percent), and then direct service provision (11 percent). However, library directors from doctoral institutions are significantly less likely than their counterparts at baccalaureate and master’s institutions to spend their time on direct service provision, professional development, or external fundraising.
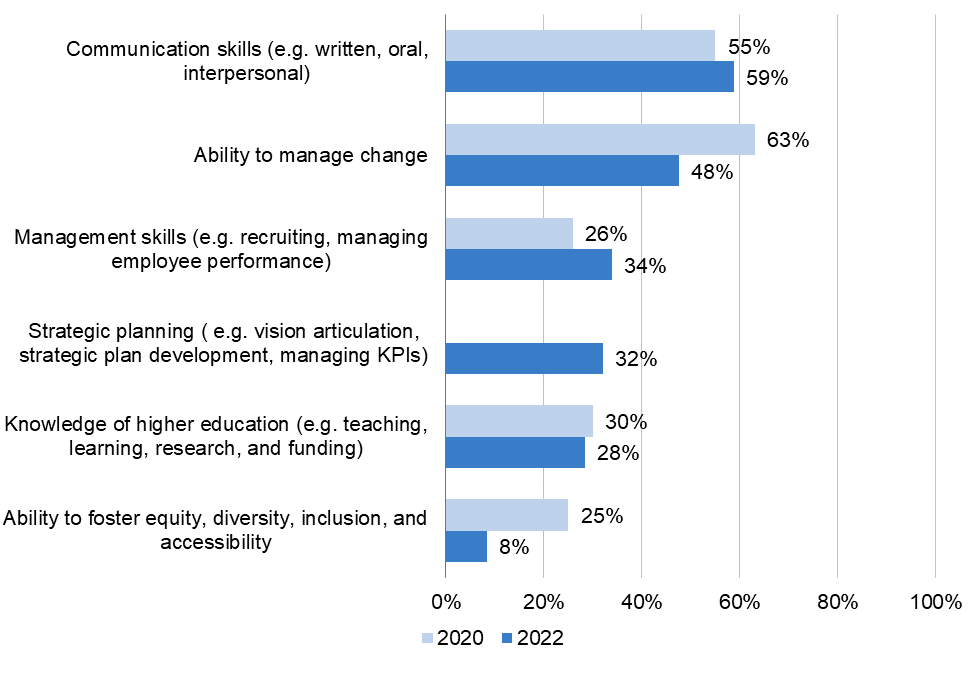
We then asked directors to indicate which skills, knowledge, or competencies they find most valuable, asking them to select the top three. Fifty-nine percent rank communication skills as most important, followed by the ability to manage change (48 percent). It is worth noting two sizeable drops in ratings since the special cycle in 2020: 63 percent of directors then rated the ability to manage change as important, compared to 48 percent of directors in this cycle, while 17 percent fewer directors rate the ability to foster diversity, equity, inclusion, and accessibility as important (a quarter in 2020, compared to 8 percent now). This cycle, we introduced a new response item related to strategic planning, and over a third of library directors selected this option as one of their top three, with directors from doctoral institutions being significantly more likely to select this item.
Figure 1. “Which of the following knowledge, skills, abilities and competencies have been most valuable for you in your current position?”
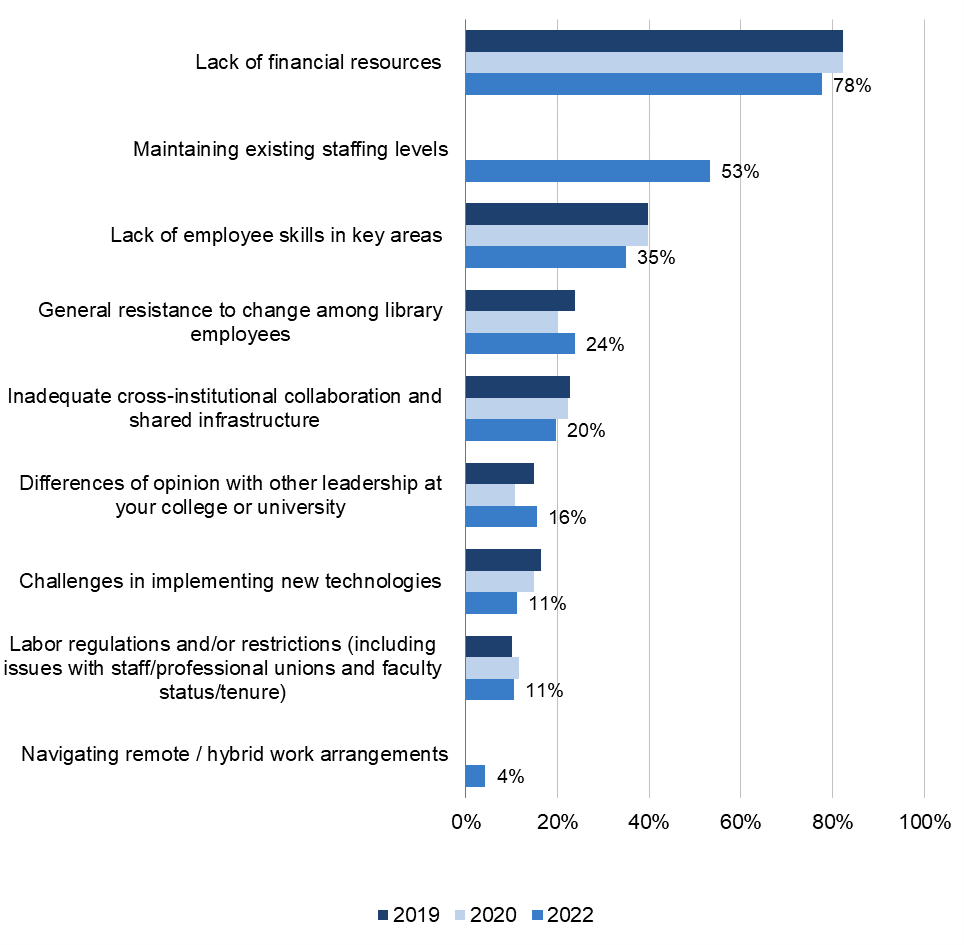
When asked about the top three constraints directors face on their ability to enact changes in their library, almost 80 percent indicated lack of financial resources, followed by a new response option, maintaining existing staffing levels (53 percent), and lack of employee skills in certain key areas (35 percent). Notably, only 4 percent of library directors indicated that navigating remote/hybrid work arrangements is a constraint to them. On this question, we found significant differences for master’s institutions, which are more likely to struggle with lack of financial resources and labor regulations and restrictions than doctoral institutions, while both master’s and baccalaureate institutions are more likely to struggle with differences of opinion with other leadership within the college or university than doctoral institution libraries.
Figure 2. What are the primary constraints on your ability to make desired changes in your library?
One of the topics of high interest for Ithaka S+R to track has to do with how directors perceive their relationship to other academic deans and senior administrators, as well as the library’s alignment with the institution. In this cycle, half of library directors strongly agreed that they are considered to be members of their institution’s senior academic leadership by other academic deans and senior administrators. This percentage has consistently hovered around 50 percent since 2016. However, in 2013 cycle the percentage was 64.
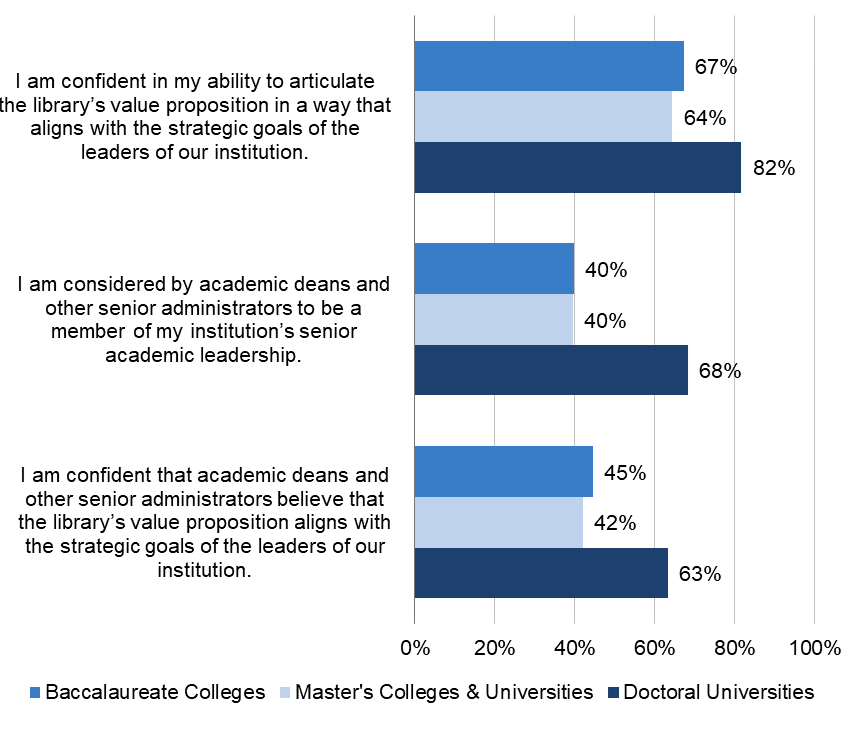
This cycle we introduced two questions related to the value proposition of the library—the first asks directors to rate their confidence in their ability to articulate the value proposition of the library in a way that aligns with the strategic goals of other leaders of the institution, while the second asks them to rate their confidence that academic deans and other senior administrators believe that the library’s value proposition aligns with the strategic goals of the leaders of their institution. While 72 percent of directors are confident in their ability to articulate the library’s proposition, only 51 percent are confident other leaders believe in that value proposition’s alignment. Here doctoral institution directors are significantly more likely to report a higher degree of confidence on all three items, detailed in figure 3 below.
Figure 3. Please use the 10 to 1 scales to indicate how well each statement below describes your point of view (ratings of 8-10).
The Role of the Library and Strategic Priorities
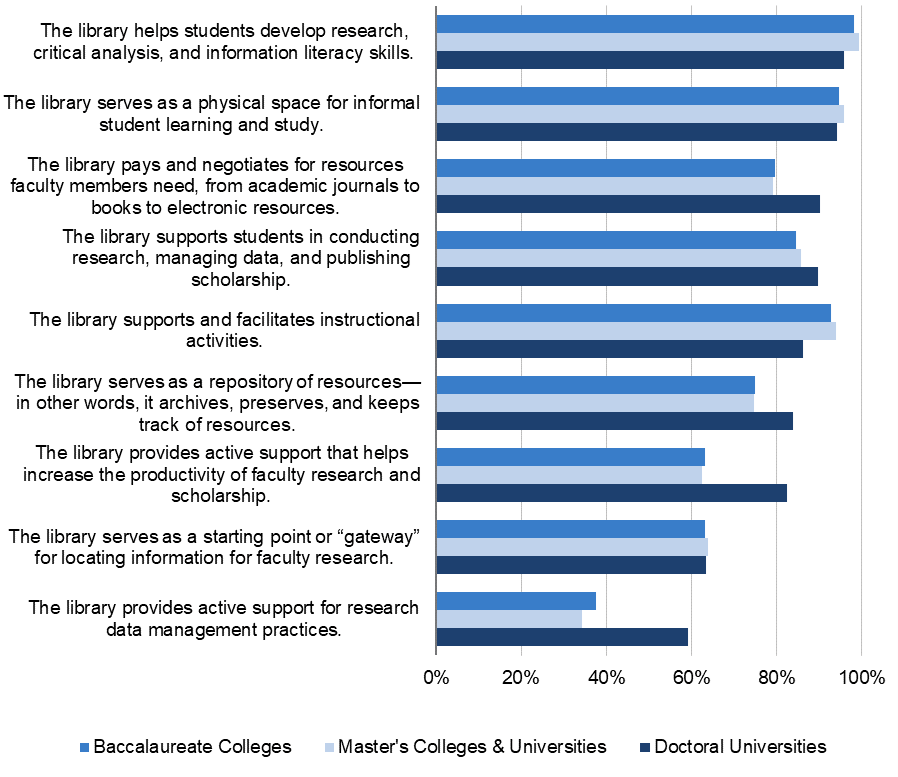
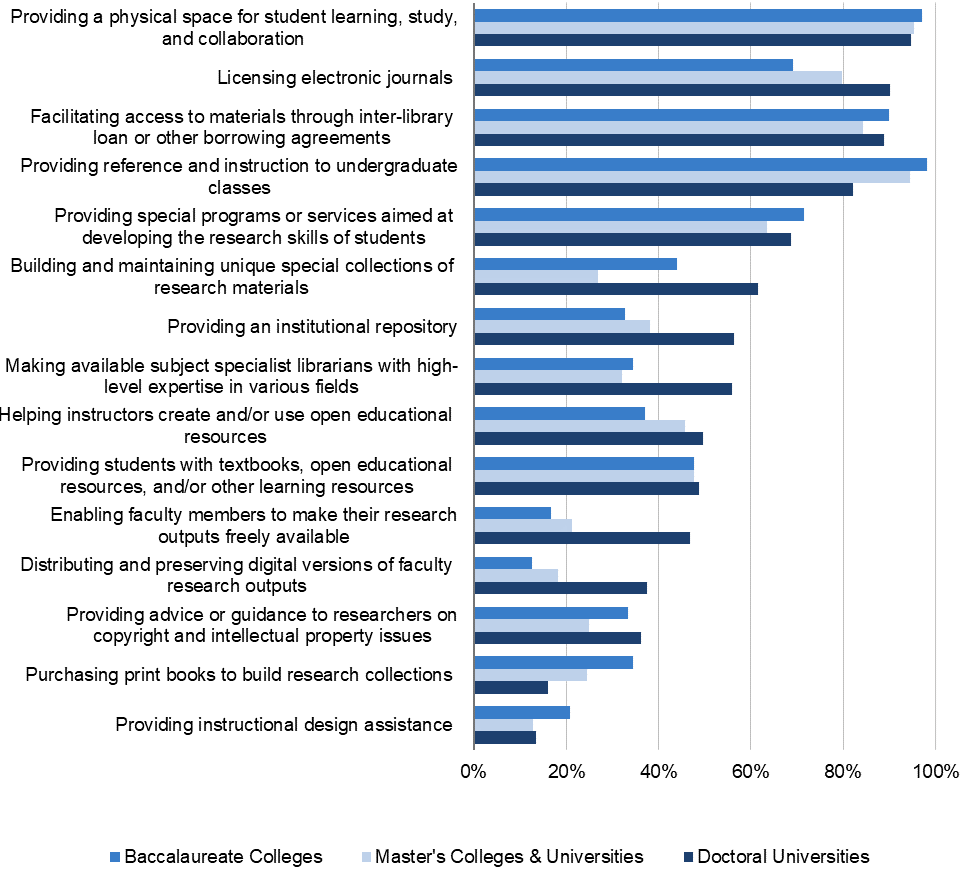
When asked about the role of the library, we see a continued trend in a shift from collections to services. Thus, the overwhelming majority of library directors rate helping students develop research, critical analysis, and information literacy skills as important (98 percent), followed by the library serving as a physical space for informal student learning and study (95 percent), and the library supporting and facilitating instructional activities (91 percent). Figure 4 below details the statistically significant differences by Carnegie class.
Figure 4. How important to you is it that your college or university library provides each of the functions below or serves in the capacity below? (High importance rating)
This trend in a shift from collections to services is further evidenced by the fact that overall, 96 percent of library directors rate providing a physical space for student learning, study, and collaboration as a high priority function, followed by providing reference instruction to undergraduate classes (91 percent), and facilitating access to materials through ILL and other borrowing agreements (88 percent). Conversely, 45 percent of directors indicated that building and maintaining a unique collection of research materials is a high priority, 44 percent selected providing an institutional repository, and less than a quarter indicated that purchasing print books is to build research collections is a priority. However, differences of opinion by Carnegie class begin to emerge over which functions the library should prioritize (see figure 5a below for more details).
Figure 5a. How much of a priority is each of the following functions in your library? (High priority rating)
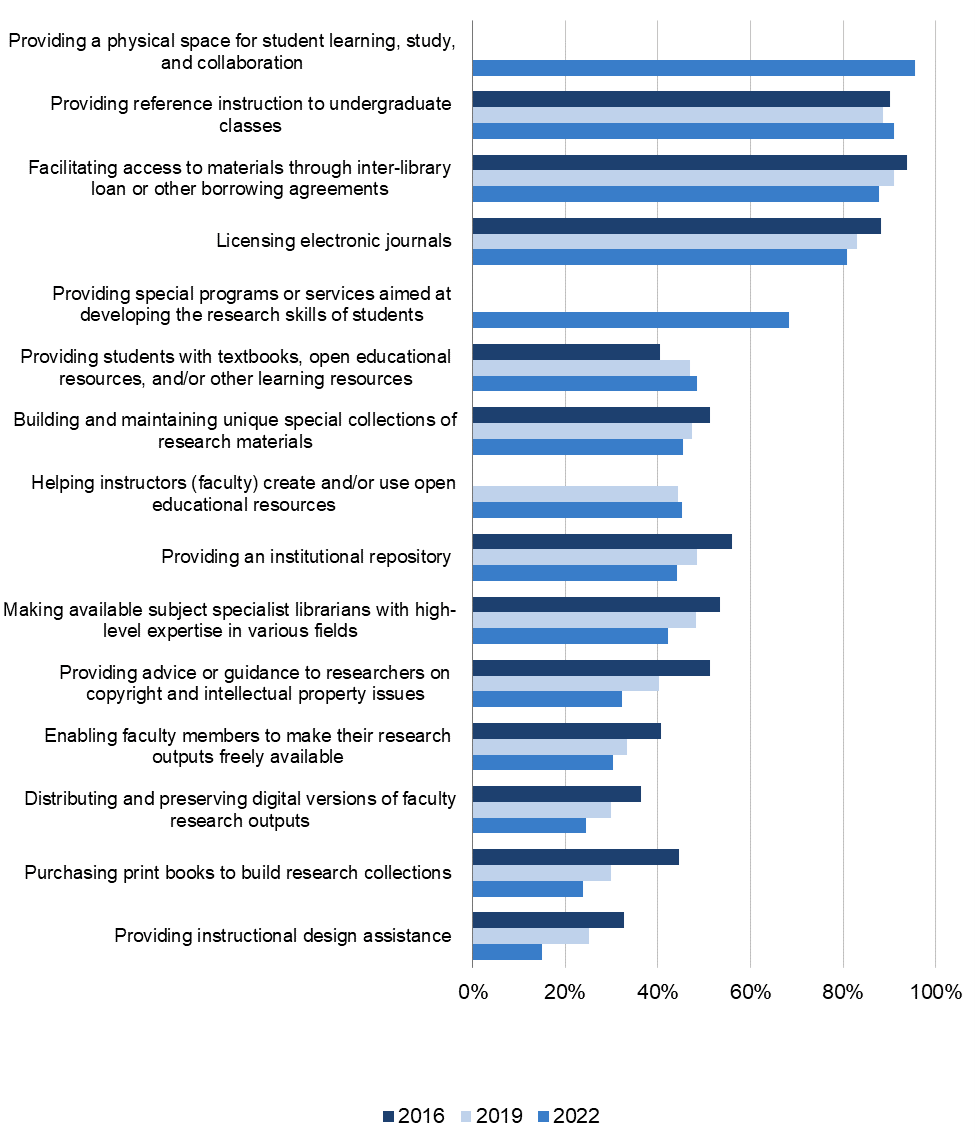
Taking a longitudinal look at the data, we can see that there is not a lot of change for the top priority statements over the past three cycles of the survey. However, since 2016, certain statements have seen more than a ten percentage-point drop: providing an institutional repository, making available subject specialist librarians, providing advice or guidance to researchers on copyright and intellectual property issues, and enabling faculty members to make their research outputs freely available. Furthermore, some items, such as purchasing print books and providing instructional design assistance have seen more than a 20 percentage-point drop over the same time period (see figure 5b below).
Figure 5b. How much of a priority is each of the following functions in your library? (High priority rating)
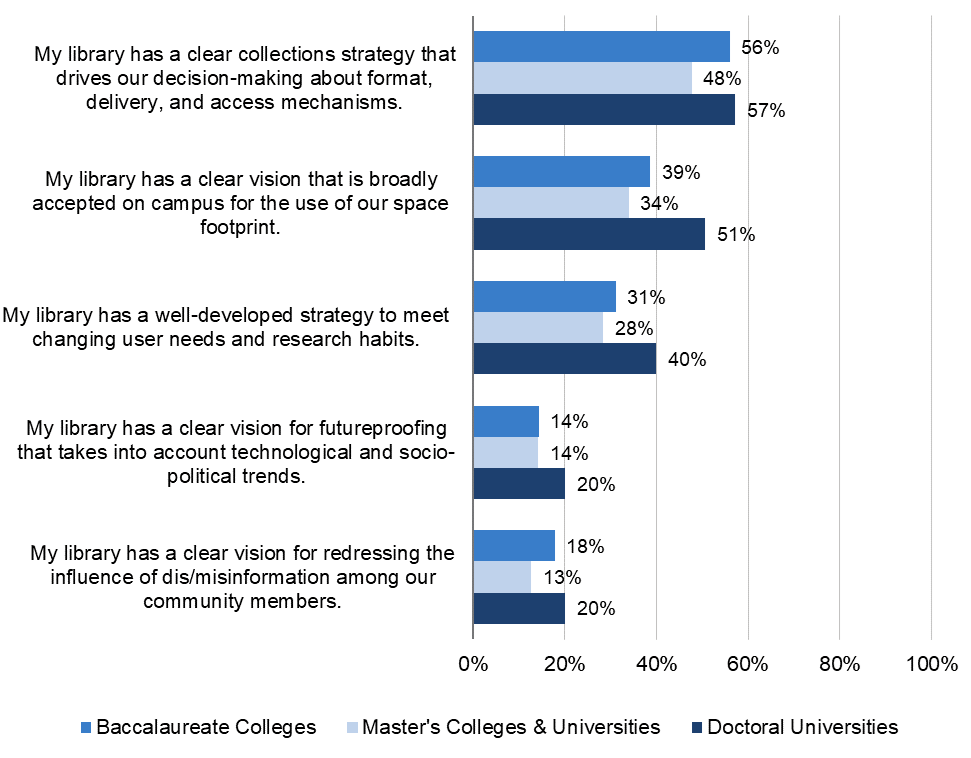
Notably, directors from doctoral institutions are statistically more likely to agree that their library has a well-developed strategy to meet changing user needs and research habits than directors from master’s institutions. Doctoral directors are also more likely to agree that their library has a clear vision that is broadly accepted on campus for the use of their space footprint than directors from both master’s and baccalaureate institutions.
This year we introduced two new strategy-related questions, the first having to do with library leaders’ vision for futureproofing, or ensuring the library adapts to change and does not become unsuitable in the future, and the second probing deans and directors’ vision for addressing misinformation and disinformation. Less than a fifth of all library directors in our sample believe they have a clear vision for futureproofing that takes into account technological and socio-political trends (16 percent), and only 17 percent have a clear vision for redressing the influence of dis/misinformation among their community members. The latter finding is particularly striking, given most directors rank information literacy, among others, as a high priority function for the library.
Figure 6. Please use the 10 to 1 scales to indicate your level of agreement with each statement (ratings of 8-10).
Budget
A key aspect of library leadership and management has to do with budgeting. Since 2010, we have asked library deans and directors to forecast how they expect or would like to allocate financial resources within the library.
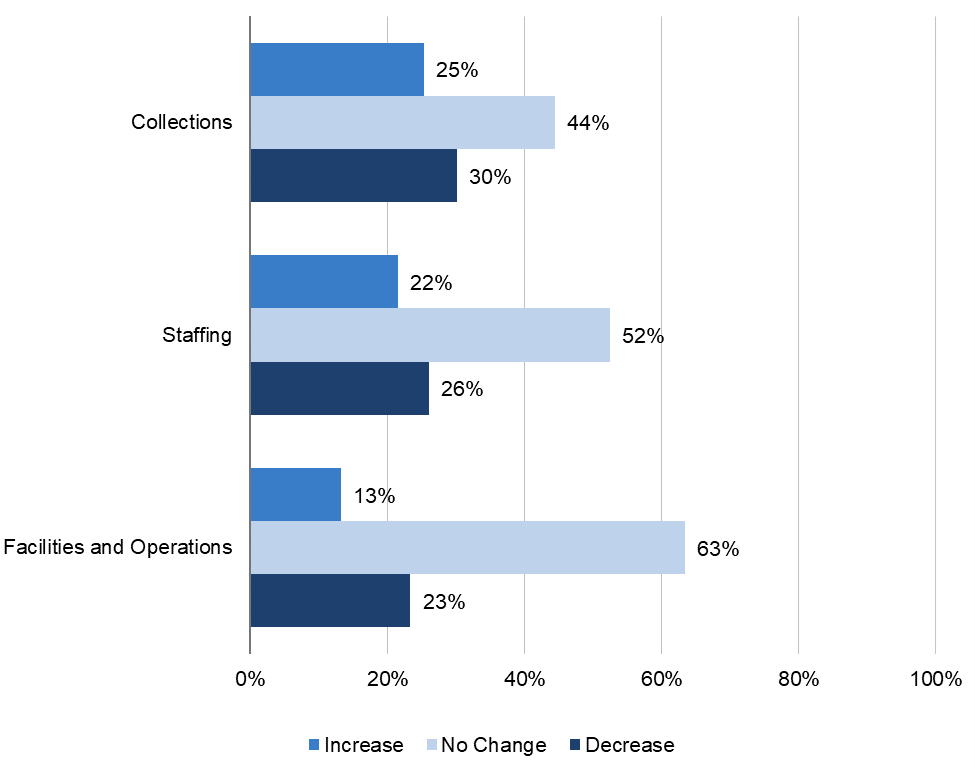
This year, we adapted a question from the 2020 special cycle, asking library leaders to indicate which budget scenarios they considered or have been asked to consider when modelling the current fiscal year budget for collections, staffing, and facilities and operations. Overall, the majority of library directors indicated no change in their budget scenarios for these three categories, but a quarter indicated an increased collections budget (25 percent), and a third indicated a reduced collections budget (30 percent), suggesting this budget category as the one most likely to fluctuate. Not surprising, facilities and operations is the category where library deans and directors see little change in budget scenarios, with 64 percent indicating no change, 13 percent indicating an increase and 23 percent a decrease.
Figure 7. When modeling the current fiscal year budget, which of the following overall library budget scenarios did you consider or were you asked to consider?
When looking at the breakdown by Carnegie class for each budget category, we found that master’s institutions’ directors are more likely than baccalaureate or doctoral institution ones to report a decrease in budget rather than an increase for each of the three categories. Specifically, while 24 percent each of library directors from doctoral and baccalaureate institutions reported considering a decreased collections budget, this percentage rises to 40 percent at master’s institutions (see table 2 below). Furthermore, 35 percent of master’s institution directors report considering a decreased staffing budget, compared to roughly a fifth of those from the other two types of institutions. Across the three categories, doctoral institutions report considering increased budget scenarios at higher rates than directors from the other two types of institutions.
Table 2. When modeling the current fiscal year budget, which of the following overall library budget scenarios did you consider or were you asked to consider?
| Budget Scenario | Baccalaureate | Master’s | Doctoral |
| Collections | |||
| Increase | 27% | 17% | 33% |
| No Change | 49% | 43% | 43% |
| Decrease | 24% | 40% | 24% |
| Staffing | |||
| Increase | 20% | 15% | 30% |
| No Change | 58% | 51% | 52% |
| Decrease | 22% | 35% | 19% |
| Facilities and Operations | |||
| Increase | 16% | 9% | 16% |
| No Change | 63% | 64% | 64% |
| Decrease | 21% | 27% | 20% |
While most library leaders project budget allocations to generally remain the same within the next five years, it is worth pointing out where they anticipate any different scenarios. Thus, a third of library leaders anticipate a decrease in spending on general collections within this time frame, and nearly a fifth on rare, special, and other distinctive collections (18 percent). That said, a quarter anticipate increasing spending on such rare, special and other distinctive collections (25 percent), and 34 percent forecast increasing spending on services to support research, as well as teaching and learning (34 percent each). Roughly a third anticipate spending more on research data management services over the next five years (see figure 8 below).
Figure 8. In the next five years, do you anticipate the share of overall resource expenditure (including direct expenditures and staffing) to increase, remain the same, or decrease for each of the following?
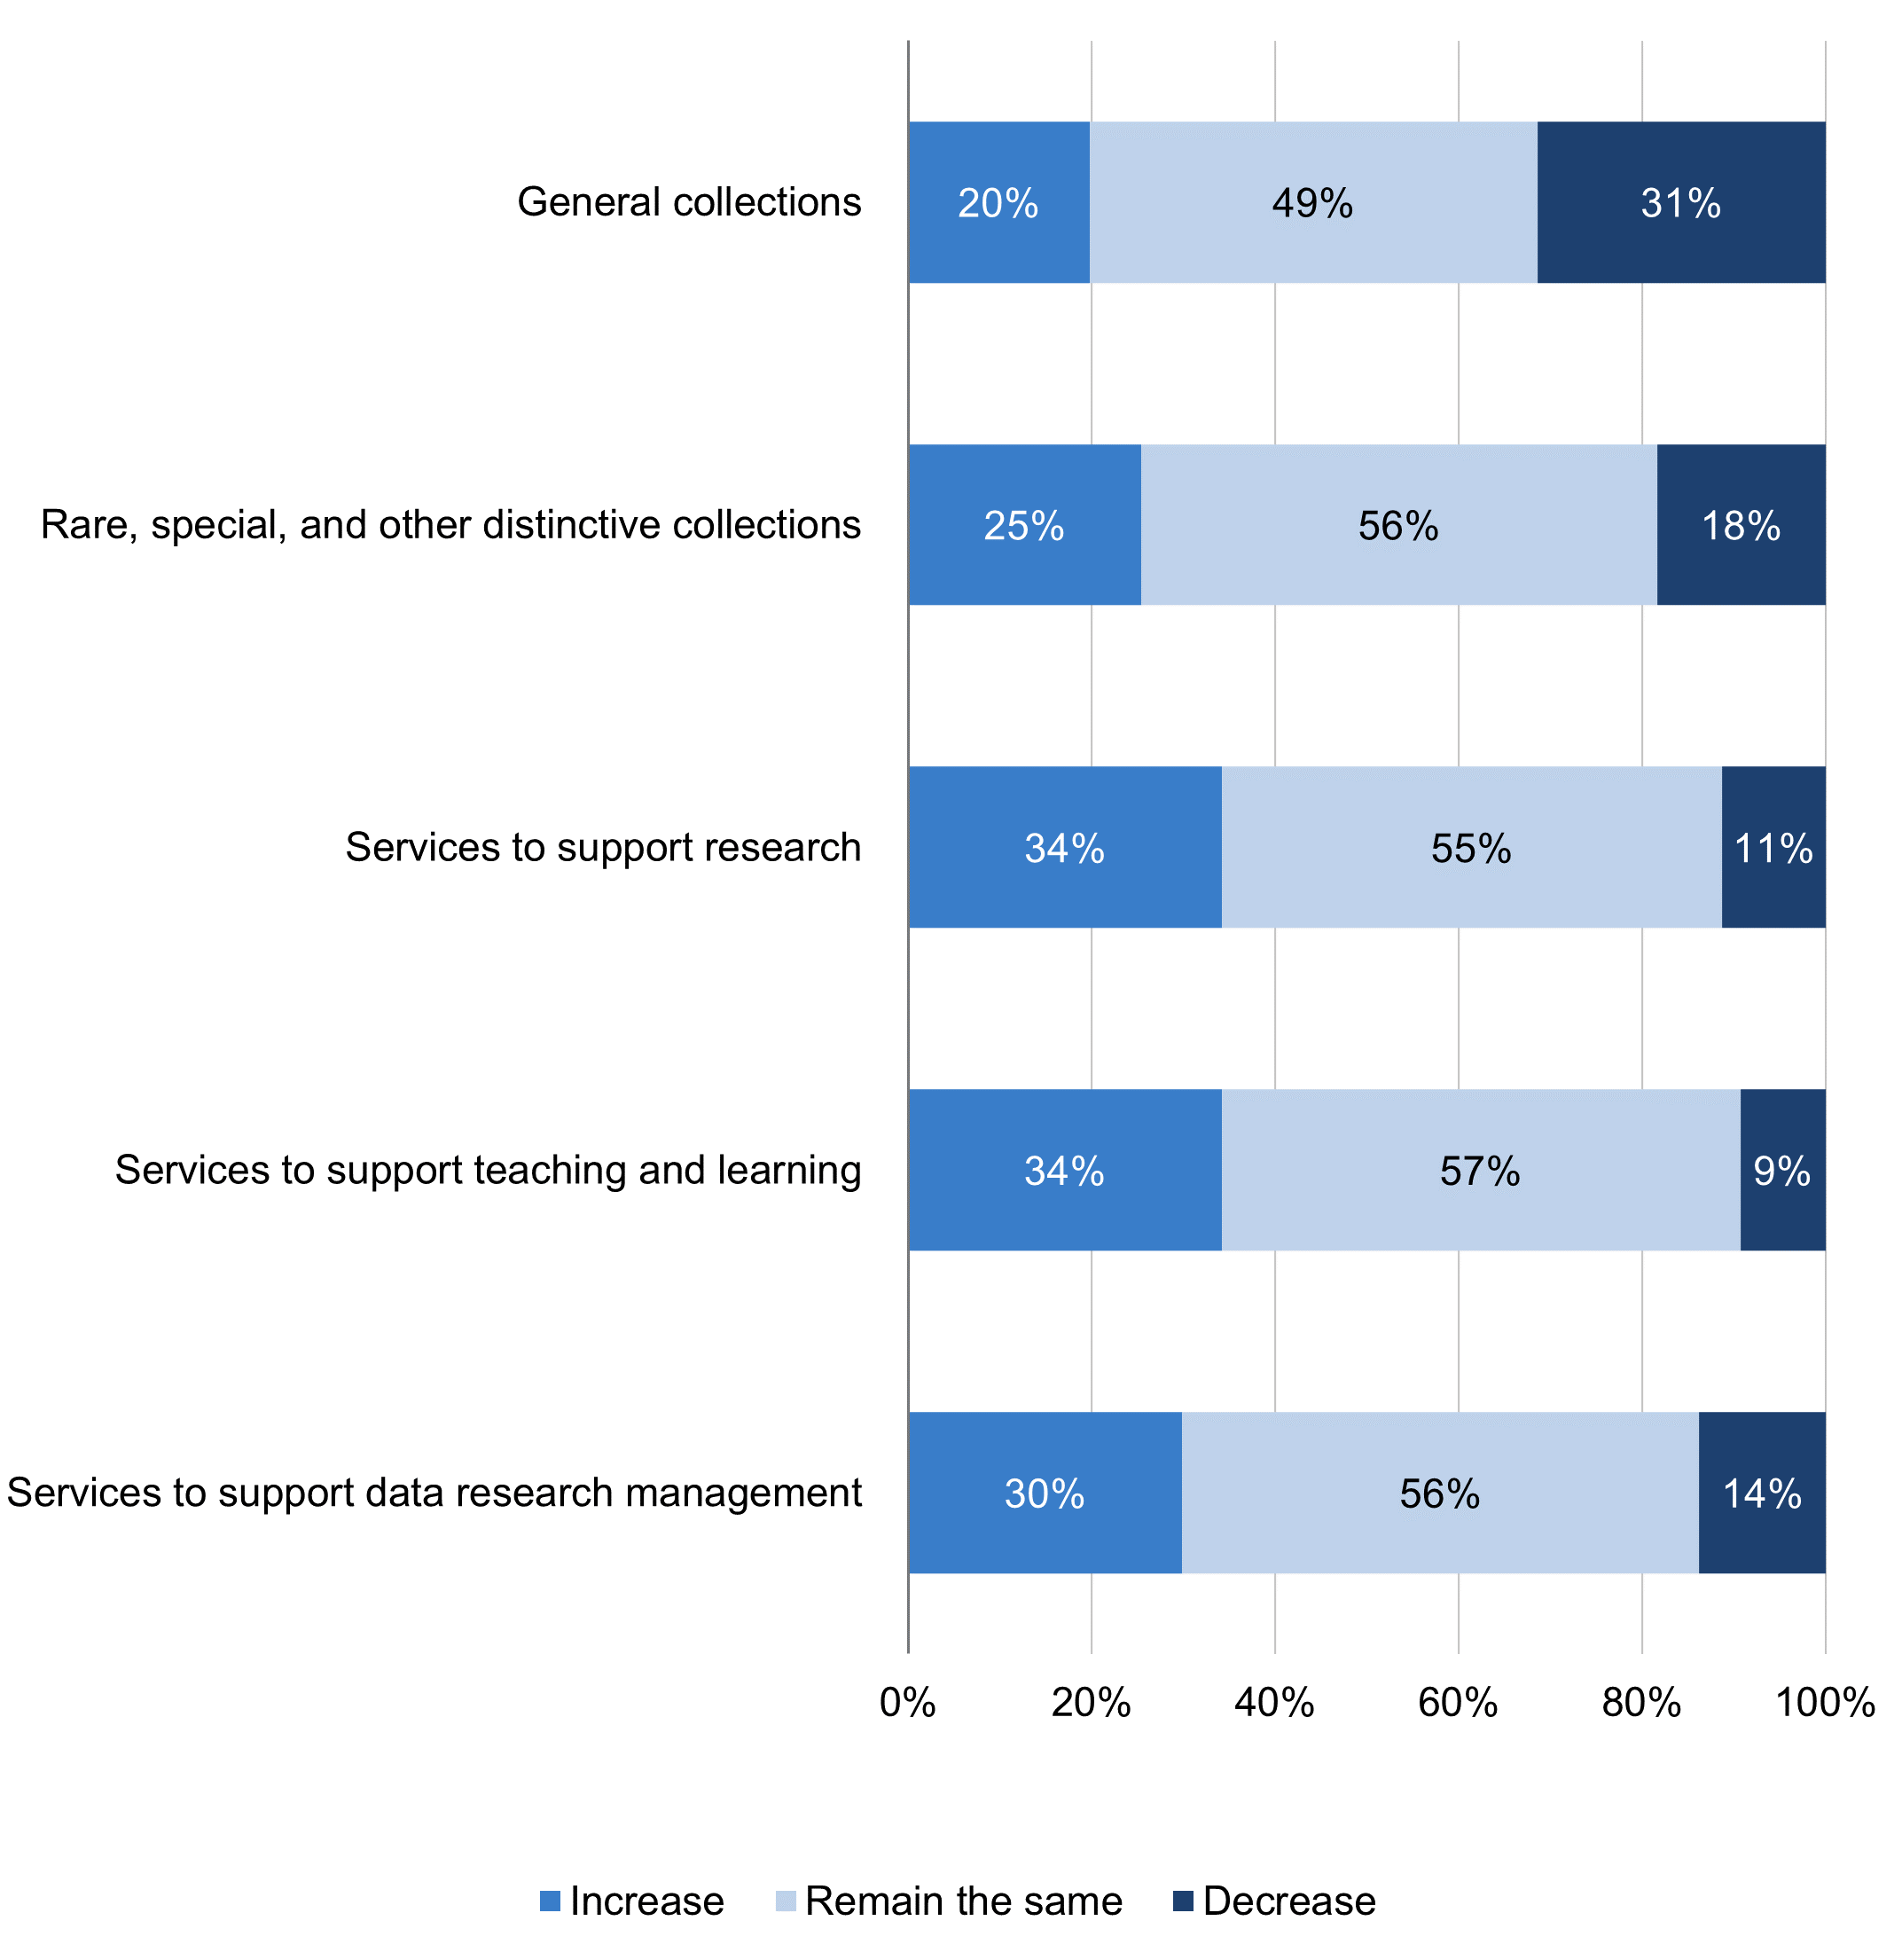
Table 3 below shows the differences in projections by Carnegie classification, and we found statistically significant differences on all items between the three types of institutions. Doctoral university directors are significantly more likely to report increases in spending across the board compared to directors from the other two types of institutions. Consistent with the findings from the previous question (see table 2 above), master’s institution directors are more likely to anticipate decreased spending across the board, compared to those from baccalaureate or doctoral institutions. As the table shows, the shift from collections to services holds across institution type, with more directors anticipating budget cuts for general collections than in any other area. A higher percentage of directors at master’s institutions, unlike their peers at baccalaureate and doctoral institutions, are forecasting a larger decrease in spending (29 percent) for rare and special collections than an increase (15 percent).
Table 3. In the next five years, do you anticipate the share of overall resource expenditure (including direct expenditures and staffing) to increase, remain the same, or decrease for each of the following?
| Budget Scenario | Baccalaureate | Master’s | Doctoral |
| General Collections | |||
| Increase | 24% | 13% | 23% |
| Remain the same | 45% | 52% | 50% |
| Decrease | 32% | 35% | 27% |
| Rare, special, and other distinctive collections | |||
| Increase | 22% | 15% | 37% |
| Remain the same | 62% | 56% | 53% |
| Decrease | 16% | 29% | 10% |
| Services to support research | |||
| Increase | 23% | 26% | 50% |
| Remain the same | 65% | 59% | 44% |
| Decrease | 13% | 15% | 6% |
| Services to support teaching and learning | |||
| Increase | 22% | 15% | 48% |
| Remain the same | 63% | 68% | 44% |
| Decrease | 16% | 17% | 9% |
| Services to support research data management | |||
| Increase | 39% | 28% | 37% |
| Remain the same | 53% | 60% | 56% |
| Decrease | 8% | 12% | 7% |
Focusing on collections, we asked directors what percentage of their library’s materials budget is spent on a number of items, and then we asked them to forecast those percentages for the next five years. Directors, consistent with past survey cycles, indicated that most of their materials budget goes towards online/digital journals and databases (66 percent), followed by e-books (11 percent). Conversely, expenditure on print books and journals have both been steadily declining over the years; on average directors allocate 9 percent of their budgets to the former and 5 percent to the latter.
When asked to predict what the percentage breakdown of the materials budget will look like in five years, library directors predict that, on average, 65 percent of these budgets will go toward online/digital journals and databases, 13 percent to e-books, 9 percent to streaming media, 6 percent to print books, and 3 percent each to print journals and all other items.
Since 2010, we have tracked the top three areas to which library deans and directors would allocate a 10 percent budget increase. For the first time this cycle, we have flipped the question, and asked respondents to indicate the top three areas where, if needed, they would implement budget cuts if they were to receive a 10 percent budget reduction. Given that lack of financial resources is the biggest constraint library directors report (78 percent, see figure 2 above), these two questions operate as strategic prioritization questions, providing insight into which areas directors define as highest and lowest priority.
Library directors are also prioritizing personnel over collections. As figure 9 below shows, library directors would direct funds towards staffing needs, in the form of new or redefined employee positions (56 percent) and employee salary increases (41 percent), followed by online or digital journals and databases (38 percent). Interestingly, online or digital journals and databases are also the third rated items where directors would implement a 10 percent budget cut (40 percent). Print resources emerge as the lowest priority items. Fifty-four percent of directors would cut the budget for print monographs, 45 percent would cut print journal subscriptions, and 16 percent would spend less on print preservation and collections management.
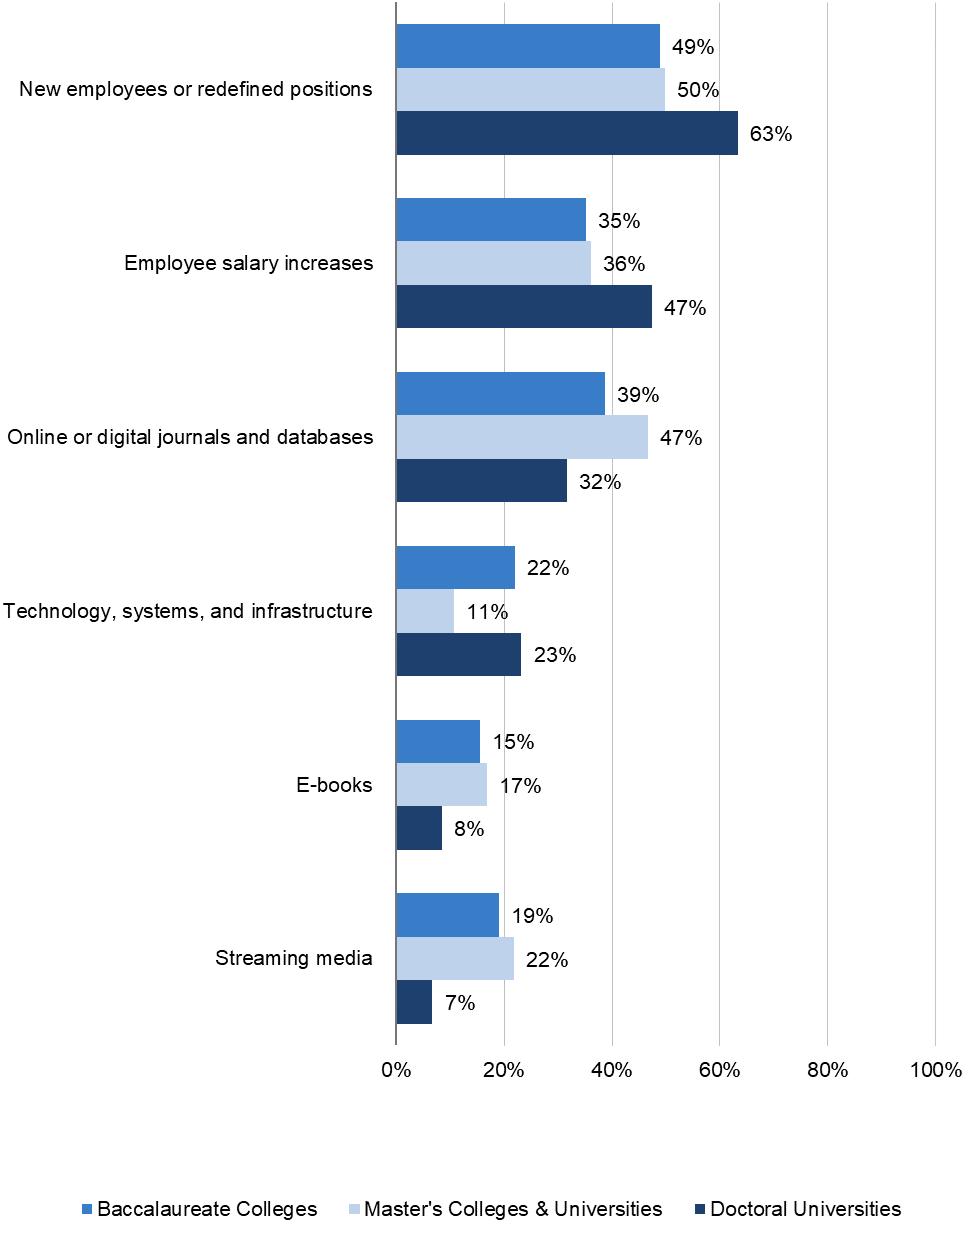
When stratifying the analysis by Carnegie class and conducting significance testing, we found that doctoral institution directors are significantly more likely than others to allocate a 10 percent budget increase to new employee or redefined positions, employee salary increases, and technology, systems, and infrastructure, but significantly less likely than others to allocate the increase towards streaming media, online or digital journals and databases, and e-books (see figure 10 below). As for the 10 percent budget reduction, directors at doctoral universities are significantly more likely than others to cut their print journals budget as well as their budget for facilities and renovations.
Figure 9. Allocation of a 10 percent budget increase or a 10 percent budget reduction, side by side.[3]
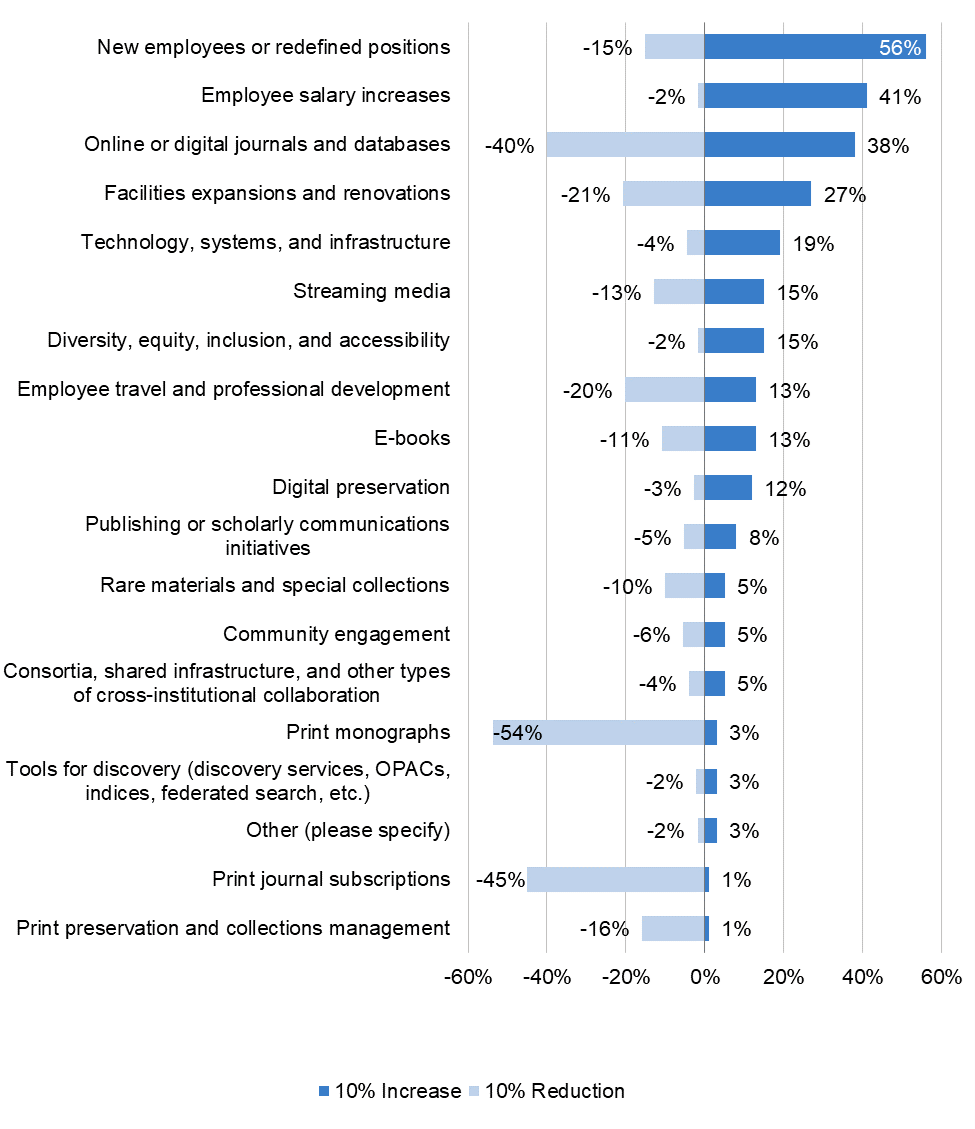
Figure 10. If you received a 10 percent increase in your library’s budget next year in addition to the funds you already expect to receive, in which of the following areas would you allocate the money?
Staffing and Talent Management
Against the backdrop of the Great Resignation/Reshuffle, the number one concern we heard about when revising the instrument had to do with talent management, retention, and recruitment. As a result, in this cycle we introduced two new questions focused on this topic.
The first asks directors to indicate in which areas or for which skills they are currently struggling, if at all, to recruit or to retain talent. As Table 4 below shows, library directors are primarily struggling to retain staff in technology and programming, followed by instruction, instructional design, and faculty development, and—tied each at 12 percent—cataloging and metadata, archives and special collections, student success, engagement, and outreach. As for talent recruitment, directors are struggling to hire staff with key skills in technology and programming, DEIA, and cataloging and metadata.
Table 4. Please indicate in which of the following skills or experiences is the library struggling to retain or recruit talent, if at all.
| My library is struggling to retain talent in this area | My library is struggling to recruit talent in this area | |
| Technology and programming | 21% | 23% |
| Diversity, equity, inclusion, and accessibility | 9% | 20% |
| Cataloging and metadata | 12% | 17% |
| Data management and research | 8% | 16% |
| User data analysis and assessment | 8% | 14% |
| Acquisitions, collections management and procurement | 10% | 14% |
| Support for Open Access and digital scholarship (DH, GIS) | 8% | 14% |
| Archives and special collections | 12% | 13% |
| Management | 9% | 13% |
| Instruction, instructional design, & faculty development | 14% | 13% |
| Other (please specify) | 12% | 12% |
| Student success, engagement, and outreach | 12% | 12% |
| Open education (including open pedagogy and open educational resources) | 6% | 9% |
| Marketing and fundraising | 6% | 8% |
| Facilities management | 4% | 5% |
We subsequently asked directors to indicate whether their library is considering outsourcing or is actively outsourcing some skills outside of the library. Notably, 10 percent of all directors indicated they are considering outsourcing technology and programming skills, and 12 percent are actively doing so, while 17 percent are considering outsourcing cataloging and metadata skills, and 10 percent are actively outsourcing already. When looking at the breakdown by Carnegie class, we found that baccalaureate institutions are more likely to be actively outsourcing, while doctoral institutions are more likely to be considering outsourcing skills.
Table 5. Please indicate whether your library is considering outsourcing these skills to a third-party provider/another department (top five).
| Scenario | Baccalaureate | Master’s | Doctoral |
| Considering Outsourcing | |||
| Cataloging and metadata | 13% | 17% | 20% |
| Technology and programming skills | 8% | 6% | 16% |
| Acquisitions, collections management and procurement | 4% | 4% | 9% |
| User data analysis and assessment | 6% | 5% | 5% |
| Data management and research | 1% | 2% | 5% |
| Currently Outsourcing | |||
| Facilities management | 14% | 13% | 11% |
| Technology and programming skills | 16% | 10% | 10% |
| Cataloging and metadata | 11% | 8% | 10% |
| Marketing and fundraising | 13% | 8% | 5% |
| Data management services | 2% | 3% | 3% |
As figure 11 below shows, a quarter or more of library directors anticipate that within five years they will need to add employees or increase staffing for student success, engagement and outreach, digital preservation and archiving, and instruction, instructional design, and information literacy. On the other hand, directors anticipate reducing staffing for access services (18 percent), technical services (16 percent), metadata, and cataloging, and reference services (15 percent).
Figure 11. To the best of your knowledge, will your library add or reduce employee positions in any of the following areas over the next five years?
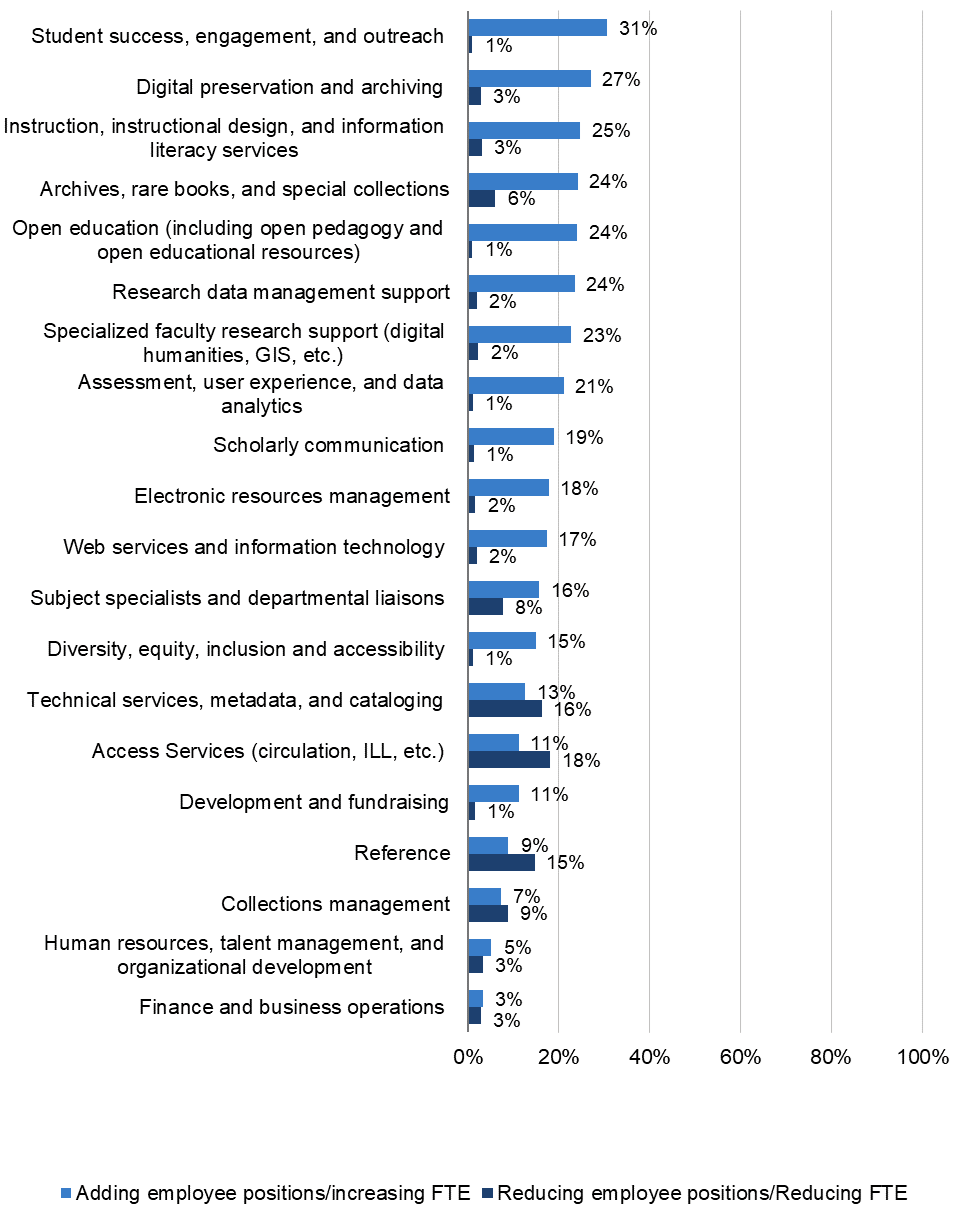
Table 6 below shows that doctoral institutions are driving the trends in staff additions, as nearly half anticipate adding positions or increasing staffing for research data management services, student success, engagement, and outreach, as well as specialized faculty research support and digital preservation and archiving. Moreover, nearly a quarter of doctoral institutions anticipate reducing staffing for access (25 percent), reference (23 percent), and technical services, metadata, and cataloging (22 percent).
Table 6: Percentage who reported adding employees/increasing FTE, by Carnegie Class.
| Category | Baccalaureate | Master’s | Doctoral |
| Research data management support | 6% | 8% | 49% |
| Student success, engagement, and outreach | 19% | 24% | 43% |
| Specialized faculty research support (digital humanities, GIS, etc.) | 8% | 10% | 42% |
| Digital preservation and archiving | 17% | 18% | 42% |
| Open education (including open pedagogy and open educational resources) | 12% | 20% | 34% |
| Assessment, user experience, and data analytics | 10% | 16% | 34% |
| Scholarly communication | 7% | 12% | 34% |
| Archives, rare books, and special collections | 16% | 18% | 33% |
| Instruction, instructional design, and information literacy services | 23% | 22% | 28% |
| Web services and information technology | 7% | 16% | 26% |
| Subject specialists and departmental liaisons | 10% | 10% | 24% |
| Diversity, equity, inclusion, and accessibility | 9% | 10% | 23% |
| Development and fundraising | 3% | 4% | 22% |
| Electronic resources management | 14% | 17% | 22% |
| Technical services, metadata, and cataloging | 8% | 12% | 17% |
| Access Services (circulation, ILL, etc.) | 13% | 11% | 11% |
| HR, talent management, and organizational development | 1% | 2% | 10% |
| Reference | 10% | 8% | 9% |
| Finance and business operations | 2% | 2% | 5% |
Diversity, Equity, Inclusion, and Accessibility
As noted above, 20 percent of library directors are struggling to recruit personnel for diversity, equity, inclusion, and accessibility positions, and 9 percent are struggling to retain talent in this area (see table 4 above).
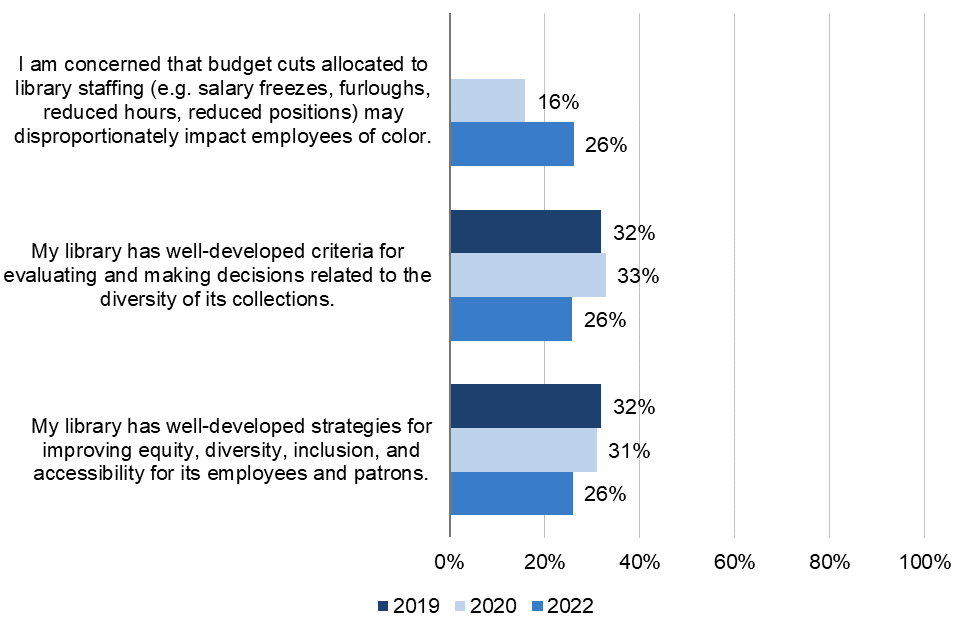
Not surprisingly then, directors’ confidence in the library’s various DEIA strategies appears to be waning. More than a quarter of directors are concerned that budget cuts allocated to library staffing may disproportionately affect employees of color, a ten-percentage point increase since 2020. Similarly, if in 2019 and 2020 more than a third of directors strongly agreed or agreed that their libraries have well-developed criteria for evaluating and making decisions related to the diversity of their collections, as well as well-developed strategies for improving DEIA for their employees and patrons, that level of confidence has dropped to a little over a quarter this cycle (26 percent each, see figure 12 below). Notably, since the survey was fielded, several states have introduced legislation that would restrict DEIA programming, hiring, or training at public colleges and universities, so this confidence may continue to fall.[4]
Figure 12. Please use the 10 to 1 scales to indicate your level of agreement with each statement (ratings of 8-10).
We also stratified the analysis by the gender and race of the respondent for these DEIA questions. Thus, while controlling for Carnegie class, we found that men and white respondents are significantly less likely to be concerned that budget cuts would negatively impact employees of color within the library.
These findings appear to offer some helpful context for the 15 percent of directors who would allocate a 10 percent budget increase to DEIA (see figure 9). Yet, from figure 1 above we found that 8 percent of library directors believe that the ability to foster DEIA is one of the three competencies most valuable to their current position—a substantial drop from 25 percent in the 2020 cycle of the study.
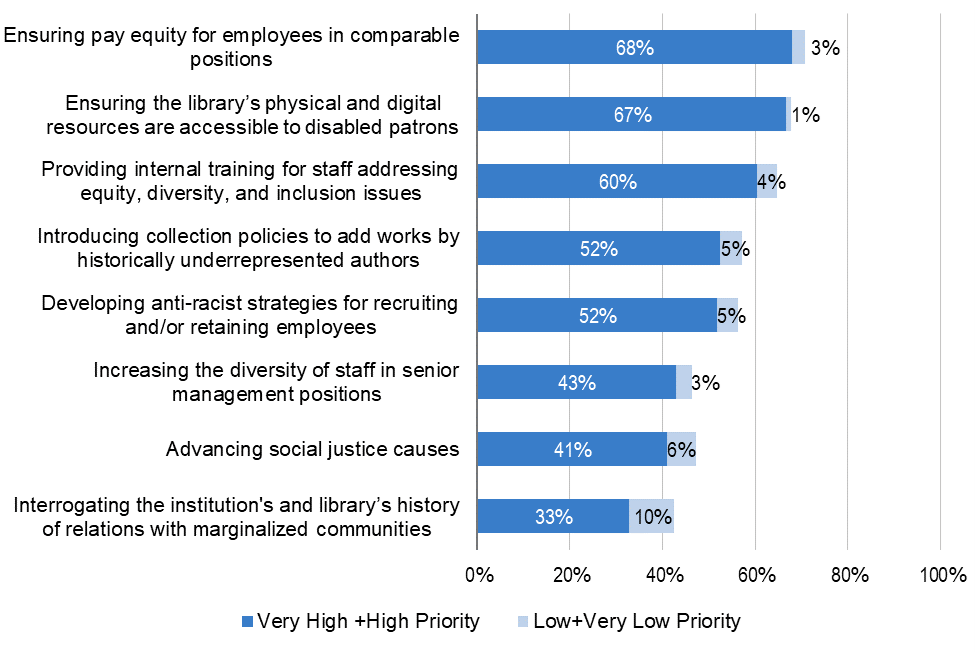
This cycle we introduced a new priorities-related question to supplement our previous coverage of diversity, equity, inclusion, and accessibility. Specifically, we asked directors to indicate how much of a priority several DEIA-related strategies are for their libraries. Echoing the concerns about the disproportionate effect of budget cuts, nearly 70 percent of library directors indicated ensuring pay equity is a very high or high priority, followed by ensuring the accessibility of the library’s physical and digital collections (67 percent). On the other hand, fewer than half of directors reported that increasing the diversity of staff in senior management positions, advancing social justice causes, and interrogating the institution’s and library’s history of relations with marginalized communities are high or very high priorities (see figure 13 below).
Figure 13. How much of a priority is each of the following strategies at your library?
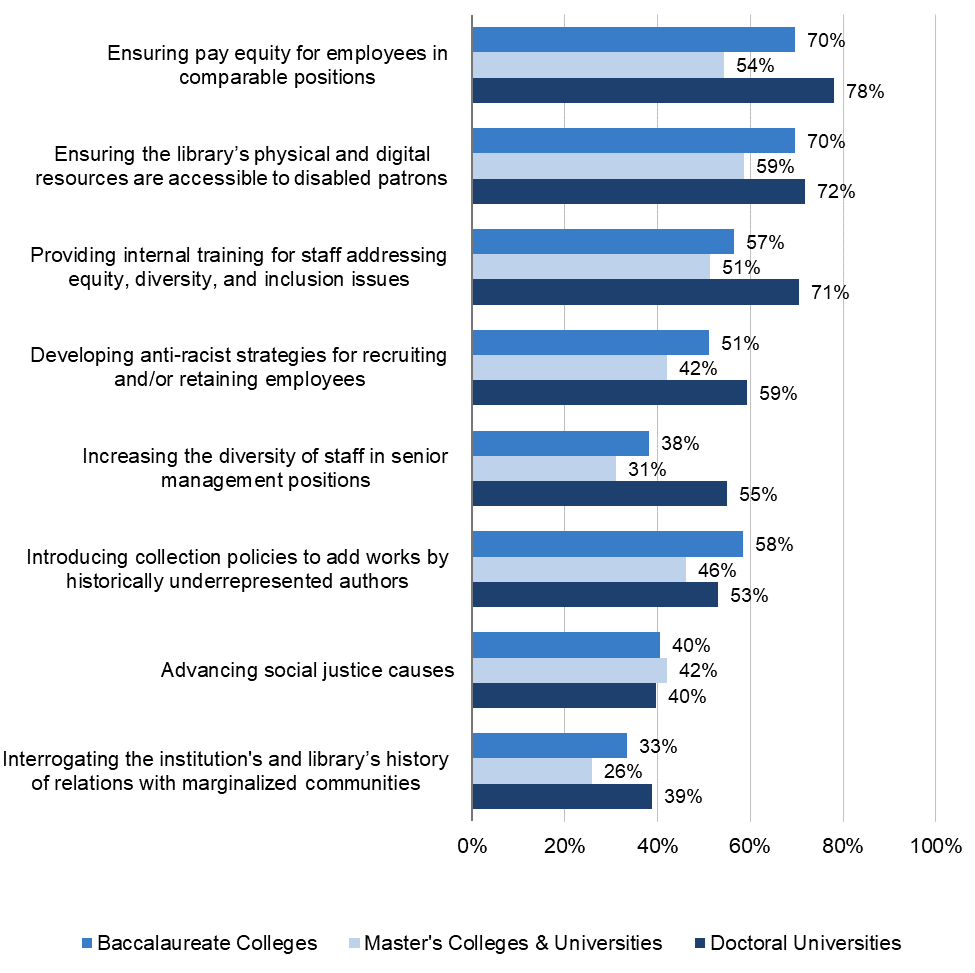
When stratifying the analysis by Carnegie class, we found that directors from doctoral institutions are statistically significantly more likely to prioritize each strategy than other directors (apart from advancing social justice causes and introducing collection policies to add works by historically underrepresented authors), as depicted in figure 14 below. Furthermore, while controlling for Carnegie class, men are overall less likely to rate any of the items as a high priority, but they are statistically significantly less likely to report developing anti-racist recruitment and retainment strategies, advancing social justice causes, introducing collections policies related to underrepresented authors, and ensuring the accessibility of the library’s physical and digital sources as high priorities for their library.
Figure 14. How much of a priority is each of the following strategies at your library? (Very High and High priority ratings).
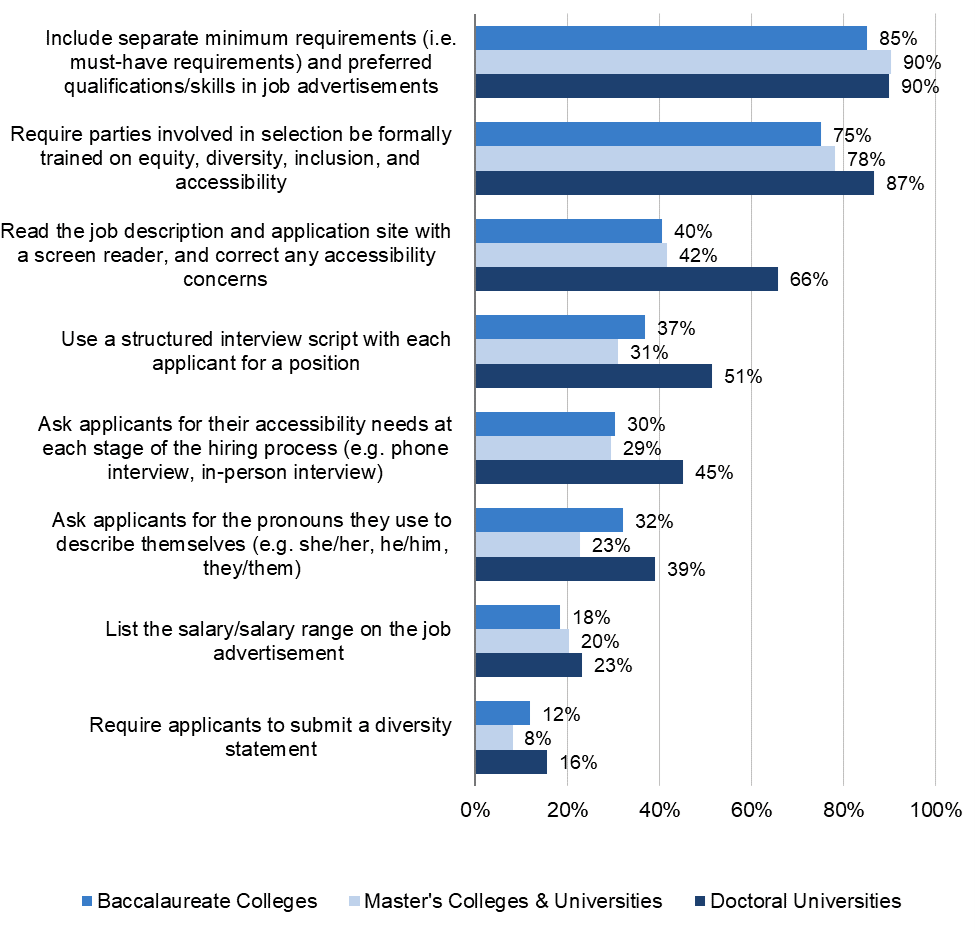
Finally, since 2019 we have asked directors how often the recruitment process for library employees includes specific DEIA requirements. While the overall rankings are consistent across the years, the stratification by Carnegie class reveals some substantial differences across institution types. Specifically, over 20 percent more library directors from doctoral institutions report that their recruitment process includes reading the job description/application site with a screen reader to check for any accessibility issues. Overall, less than a quarter of search committees require applicants to submit a diversity statement. Tracking the implementation rate of these DEIA-related hiring practices will be worthwhile, particularly in light of the evolving national political landscape.
Figure 15. Generally speaking, how often do you, a hiring manager, a human resources representative, and/or members of a search committee do each of the following when recruiting and hiring library employees? (Often rating)
Teaching and Student Success
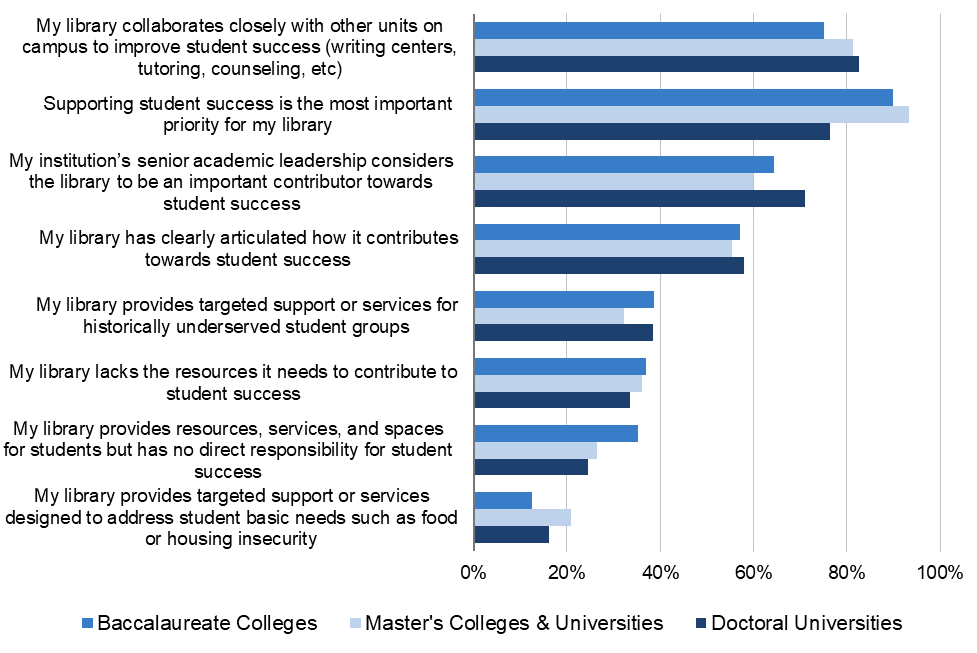
Since 2016, we have tracked how library directors align their organization and services with the institution’s student success priorities. Consistently, most directors indicate that supporting student success is the most important priority for their library, as well as collaborating closely with other units on campus to improve student success. Moreover, 65 percent of library directors agree that their institution’s senior academic leadership considers the library to be an important contributor towards student success. This cycle, we have included a new item, asking directors whether their library provides targeted support or services designed to address student basic needs, such as food or housing insecurity—and nearly a fifth (17 percent) of directors indicated their library does offer such support or services.
However, notable differences emerge when stratifying the analysis by Carnegie class (figure 16 below). While overall, support student success is the top priority for the directors in our sample, with a rate of 90 percent of baccalaureate and master’s institutions, the percentage drops to 76 percent of doctoral institution directors. Interestingly, more doctoral institution directors (71 percent) believe that senior academic leadership considers the library to be an important contributor towards student success, compared to 64 percent and 60 percent of directors at baccalaureate and master’s institutions, respectively.
Figure 16. Please use the 10 to 1 scales to indicate how well each statement below describes your point of view (ratings of 8-10).
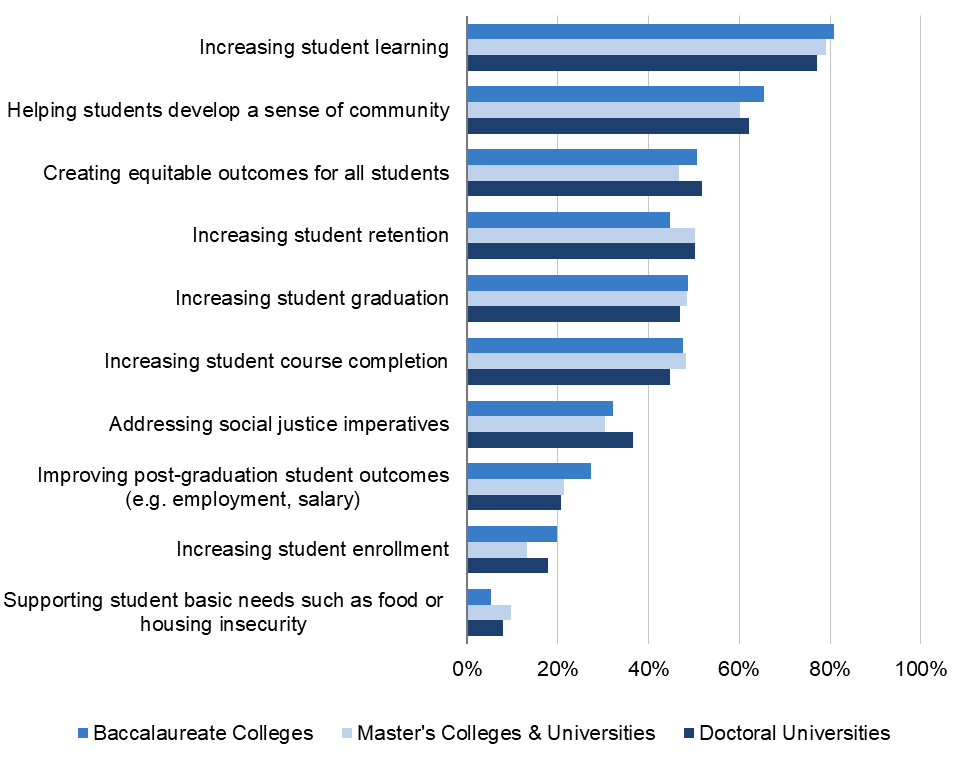
When asked specifically which student success goals the library contributes to, 79 percent of directors believe the library makes a significant contribution toward increasing student learning, 63 percent towards creating equitable outcomes for all students, and roughly half believe that their organization makes significant contributions towards increasing student retention, graduation, and course completion. A third or less believe the library addresses social justice imperatives (33 percent), improves post-graduation student outcomes (23 percent), increases student enrollment (17 percent), or supports student basic needs such as food or housing insecurity (8 percent). Figure 17 below details the breakdown of these items across Carnegie class.
Figure 17. In your opinion and/or based on evidence gathered, to what extent does your library contribute to each of the following possible student success objectives?
Lastly, we asked directors to indicate their level of agreement with three statements related to student success. Ninety-one percent of all directors strongly agree that librarians at their college or university contribute significantly to student learning by helping them to find, access, and make use of a range of secondary and primary sources in their coursework, 90 percent that librarians contribute significantly to student learning by helping them develop their research skills, and 63 percent that librarians contribute signficantly to helping students develop skills to identify media manipulation and disinformation, indicating library leaders see themselves as effective in this student success goal, even if they are less confident their strategies for this are well-developed (see figure 6 previously).
Institutional Assessment, Data Sharing, and Privacy
As of 2019, we introduced a section focused on directors’ perceptions of the utility of data collection, dissemination, and concerns about data privacy. Building on that, this cycle we have added questions designed to capture library directors’ perceptions of the research data management ecosystem.
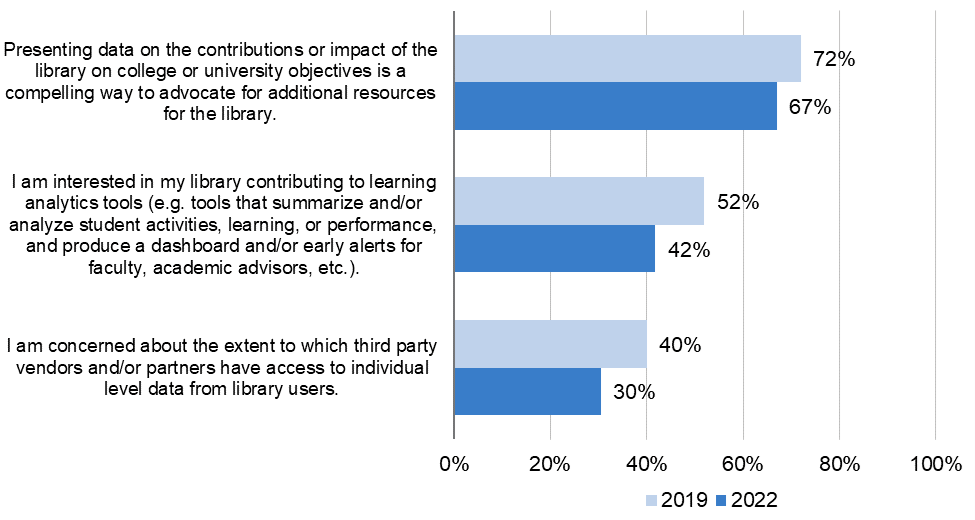
Consistent with 2019, the majority of directors believe that it is effective to use feedback from users (69 percent) and utilization data (60 percent) to demonstrate the contributions of the library to other senior academic leadership. Roughly half of directors believe compelling anecdotes and data on the library contributions towards institutional outcomes—such as analyses linking library services usage with enrollment and retention outcomes—effectively demonstrate the library’s value. Relatively few directors believe that institutional comparisons (34 percent) or describing increases in efficiency/productivity (22 percent) are compelling ways to demonstrate their impact.
Figure 18 below shows a downward trend since 2019 on three data, analytics, and assessment items. Notably, there is a ten-percentage point drop since 2019 in directors expressing interest in their library contributing to learning analytics tools, as well as another ten-percentage point drop in library directors expressing concerns about the extent to which third party vendors and/or partners have access to individual level data from library users.
Figure 18. Please use the 10 to 1 scales below to indicate your level of agreement with each statement. (ratings of 8-10).
However, we do see differences based on institution type. Fifty percent of directors at doctoral institutions are interested in their library contributing to learning analytics tools, compared to 40 percent at master’s institutions, and 33 percent at baccalaureate ones. Directors at master’s institutions are the least concerned about vendors’ access to user data (24 percent), compared those at baccalaureate (32 percent) and doctoral institutions (35 percent).
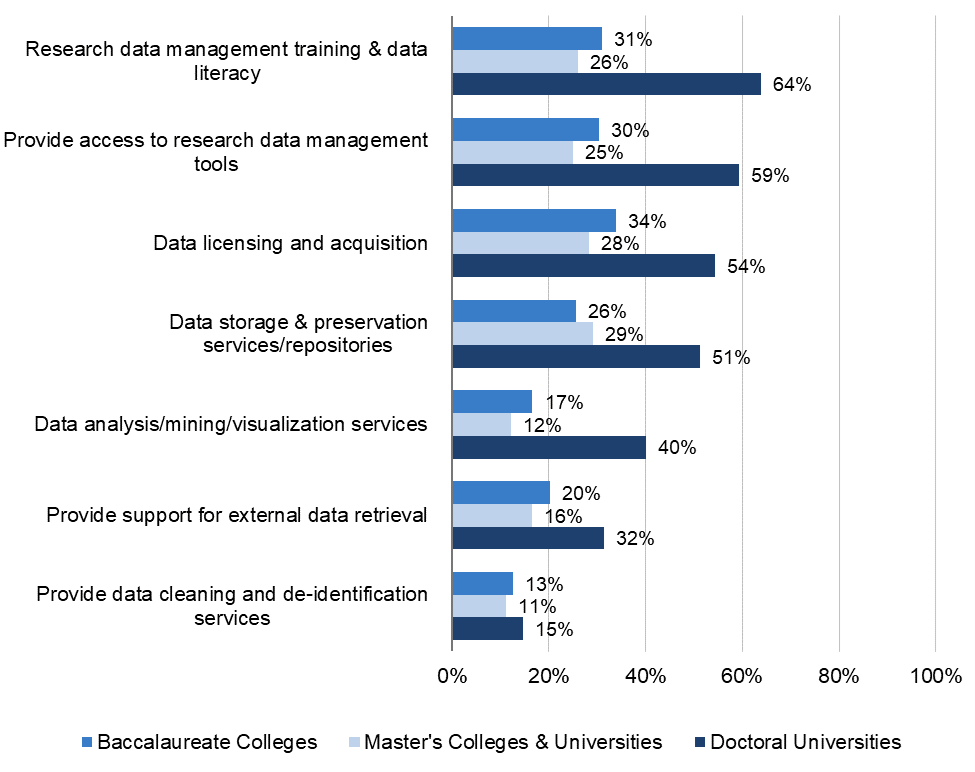
This cycle, we have introduced items that probe library directors’ opinions of the role libraries should play in the research data management lifecycle. Overall, less than half of library directors find it important that their library provides any given research and data management service (see figure 19a below). However, the analysis by Carnegie class shows a stark divide in ratings by institution type. Specifically, directors at doctoral universities are statistically significantly more likely than those at master’s or baccalaureate institutions to rate these services as more important (see figure 19b below).
Figure 19a. How important is it to you that your library provides each of the following? (High importance rating)
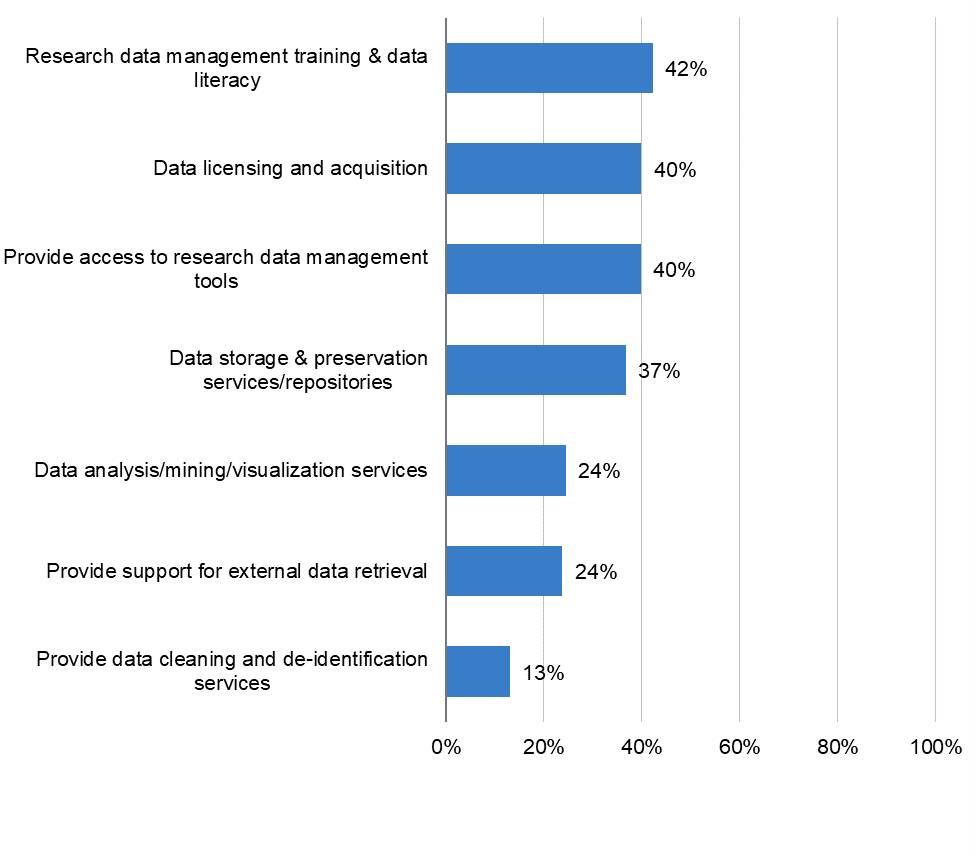
Figure 19b. How important is it to you that your library provides each of the following? (High importance rating)
Collections
The final section of the survey asks library leaders several library collections-related questions. Specifically, we ask about their perception of the cost and value of resources, actual and predicted spending on materials, and the likelihood of unbundling major journal packages. This cycle, we have also introduced several questions specifically focused on open access, as well as library directors’ perceptions of the publishing ecosystem.
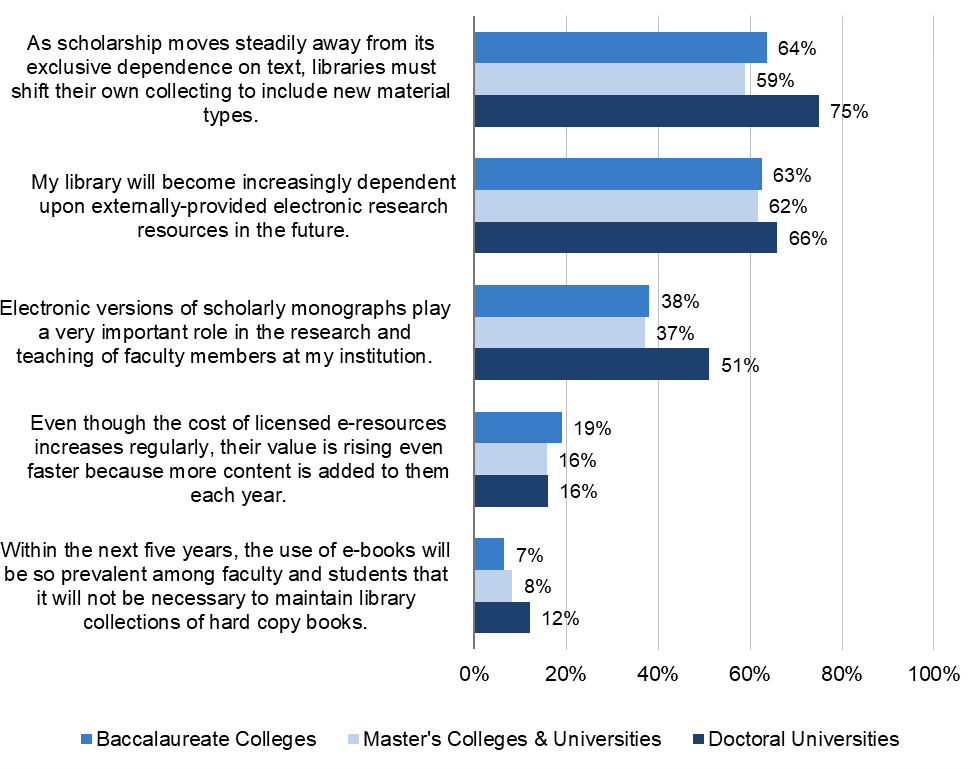
Overall, library deans and directors forecast a continued shift to electronic collections. The majority of library deans and directors (66 percent) agree that libraries must shift their own collecting to include new material types, particularly as scholarship moves away from its exclusive dependence on text.[5] Furthermore, 63 percent of all library leaders agree that their library will become increasingly dependent upon externally provided electronic research resources in the future. More interestingly, while less than half (43 percent) agree that electronic versions of scholarly monographs play a very important role in the research and teaching of faculty members at their institution, this percentage has gone up from 29 percent in 2019. When disaggregating this item by Carnegie class, we find over a ten-percentage point difference between directors at doctoral universities (51 percent), compared to master’s (37 percent) and baccalaureate (38 percent).
Nearly half (45 percent) of library directors believe that their library will unbundle one or more major journal packages in the next licensing cycle, with 54 percent of doctoral university directors indicating that this is a likely scenario. Furthermore, only a small proportion of library leaders believe that the value of licensed e-resources is increasing at a faster rate than the cost (17 percent), and even fewer (9 percent) believe that the use of e-books will make physical collections obsolete within the next five years. This will be an interesting trend to watch, particularly in light of recent consolidations trends, as well as the increased focus on libraries taking a digital first approach to their collections.
Figure 20. Please use the 10 to 1 scales to indicate your level of agreement with each statement (ratings of 8-10).
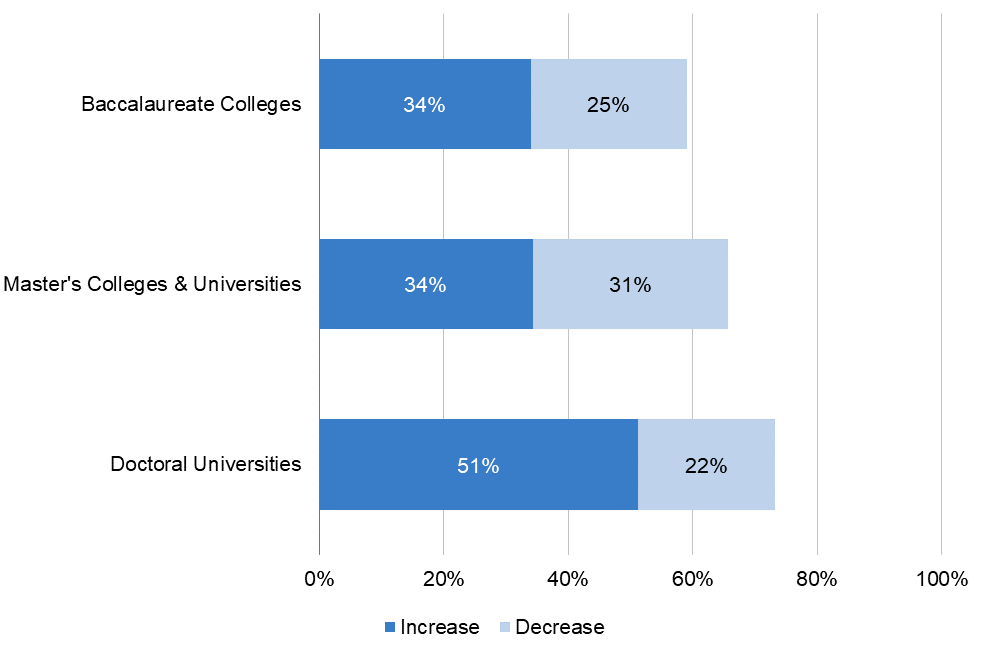
For the first time, we added a block of questions specifically on open access and the publishing ecosystem. When asked to forecast the long-term impact open access will have on what their institution pays for scholarly communication, 41 percent of library directors predict an increased cost, 33 percent predict no change, and 26 percent predict a decreased cost. More interestingly, the majority of doctoral university directors believe open access will result in a slight or substantial increase in cost for their institution, compared to a third of directors from baccalaureate and master’s institutions (see figure 21 below).
Figure 21. When thinking about forecasting the long-term impact of Open Access on what your institution pays for scholarly communication, how do you expect that an increasingly Open Access future will impact your institution? (excludes no change rating)
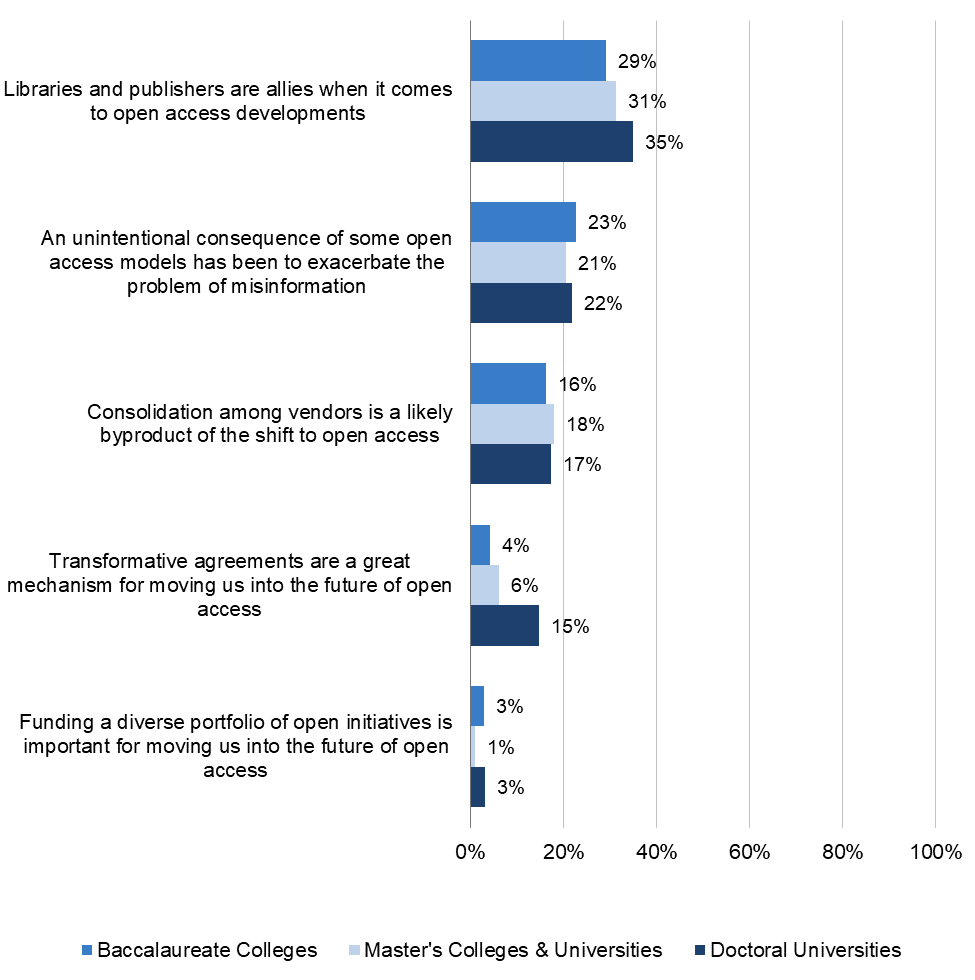
While half of library directors (50 percent) agree that funding a diverse portfolio of open initiatives is important for moving into the future, a little over a quarter believe that transformative agreements are a great mechanism for this (27 percent). Nearly 20 percent of library directors (18 percent) strongly agree or agree that consolidation among vendors will be a likely byproduct of the shift to open access, but almost the same percent (17) strongly disagreed or disagreed with this statement. Furthermore, a fifth of library directors overall (21 percent) strongly disagree or disagree that open access models have unintentionally exacerbated misinformation, compared to 10 percent who strongly agree or agree with this statement. Lastly, a third of directors (32 percent) strongly disagree or disagree that libraries and publishers are allies when it comes to open access developments, with 10 percent of library directors agreeing or strongly agreeing with this statement.
When looking at the stratified responses by Carnegie class, we found no statistically significant differences by institutional type. It is worth noting that fewer directors from master’s institutions believe that funding a diverse portfolio of open initiatives is important (42 percent), compared to 51 percent of baccalaureate institution directors or 56 percent of doctoral ones. Moreover, 15 percent of doctoral university directors strongly disagree or disagree that transformative agreements are a great mechanism for moving to an open access future, compared to directors from baccalaureate (4 percent) or master’s institutions (6 percent).
Figure 22. Please indicate your level of agreement with the following statements (Strongly Agree and Agree ratings).
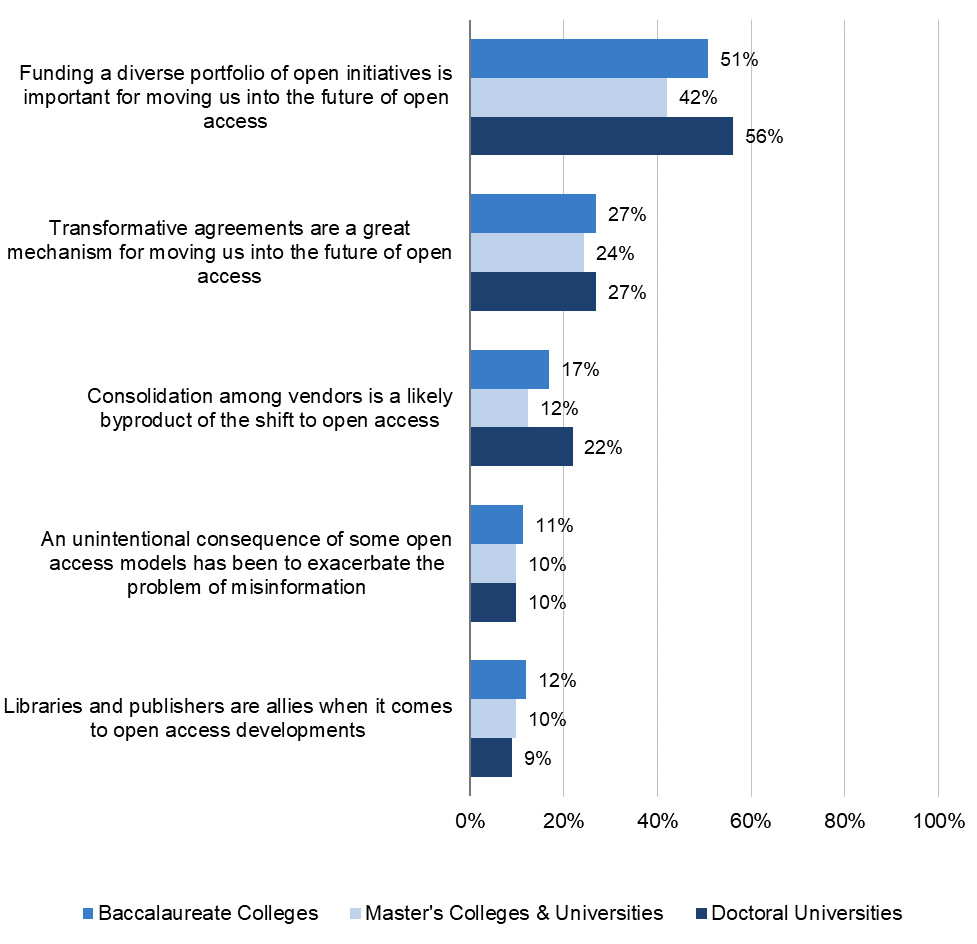
Figure 23. Please indicate your level of agreement with the following statements (Strongly Disagree and Disagree ratings).
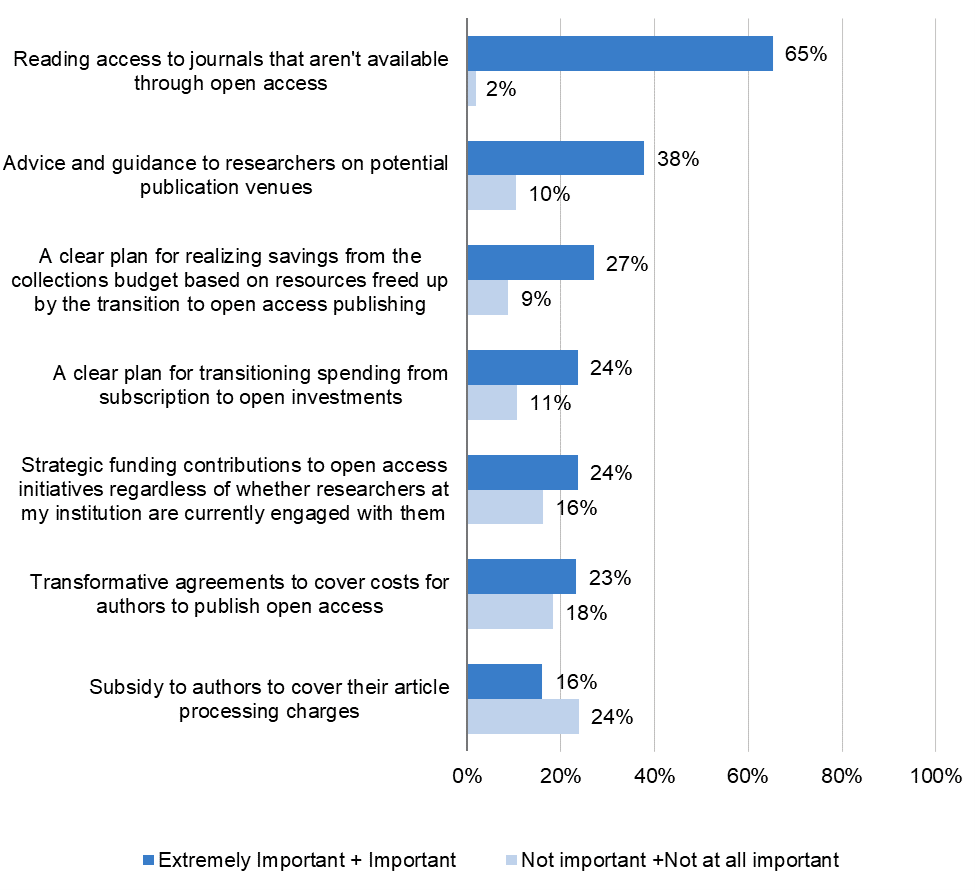
Lastly, we asked library deans and directors to rate the importance of their library offering various scholarly communication-related services. While 65 percent find offering reading access to journals that aren’t available through open access to be extremely important or important, less than half rate any other item at that same level of importance, with most aggregate responses hovering around 25 percent (see figure 24 below). Almost a quarter (23 percent) of directors find it extremely important or important to offer transformative agreements to cover costs for authors to publish open access, while 18 percent find this not important or not at all important. Moreover, 24 percent of directors rated offering subsidies to authors to cover their article processing charges as not important or not at all important. It is worth noting that roughly a quarter of directors find it extremely important or important that their library offer a clear plan for realizing savings from the collections budget based on resources freed up by the transition to open access (27 percent), as well as a clear plan for transitioning spending from subscription to open investments (24 percent). These two findings are particularly interesting, given that 41 percent of all library directors predicted open access will result in a long-term increase in costs for their institution (see previous figure 21).
Figure 24. How important is it to you that your library provides each of the following?
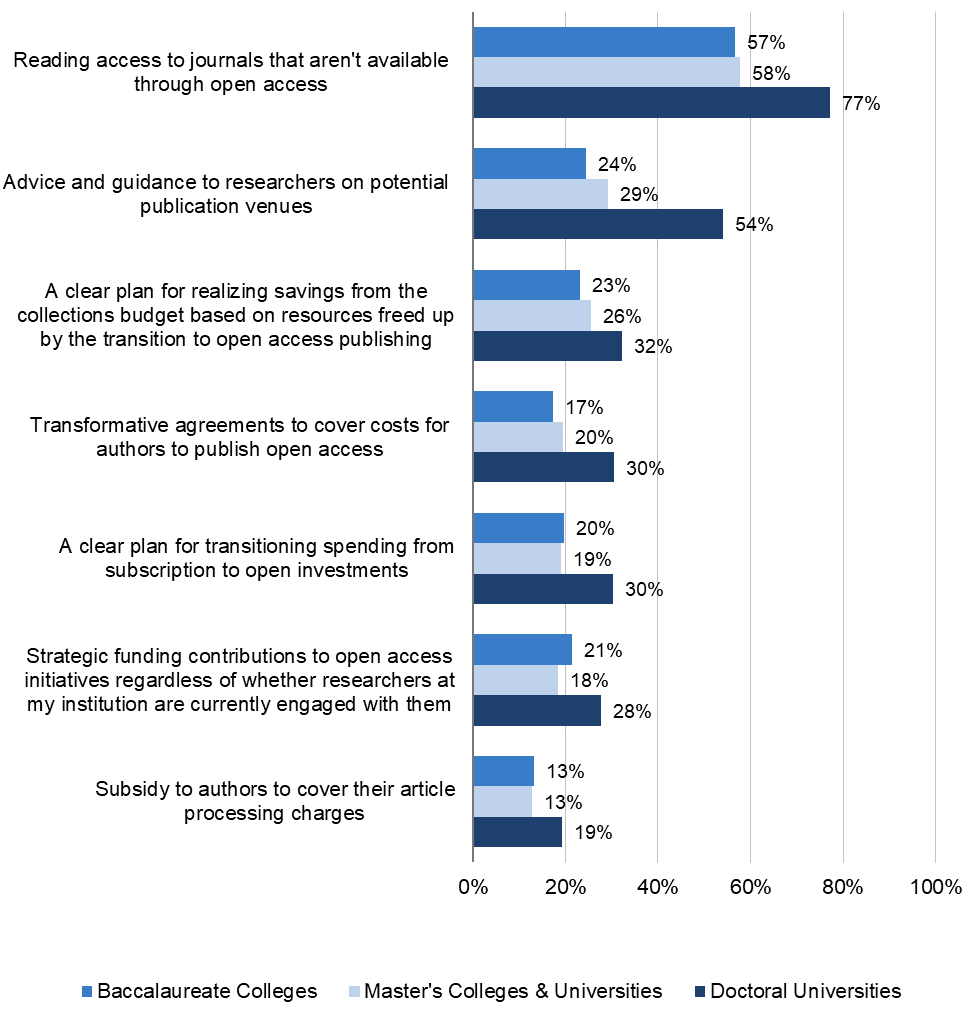
When disaggregating the results by institution type, we found that more doctoral university directors than those from master’s or baccalaureate institutions rate each response item as important or extremely important, particularly on providing reading access to non-open access journals, and providing guidance to researchers on potential publication venues (see figure 25 below). It is worth noting that 27 percent of directors from doctoral institutions agree with the statement that “transformative agreements are a great mechanism for moving us into the future of open access” (see figure 22 previously), and here we see that 30 percent of library directors from the same institution type find it important or extremely important to offer these types of transformative agreements. Meanwhile, while roughly a fifth of directors from baccalaureate and master’s institutions (27 percent and 24 percent, respectively) think that transformative agreements are a great mechanism for moving into an open access future, fewer of them find it important or extremely important that their library offer such agreements (17 percent of baccalaureate-institution directors, and 20 percent of master’s ones).
Figure 25. How important is it to you that your library provides each of the following?
Conclusion
The landscape of higher education looks quite different than before—or as anticipated in the early days of—the pandemic. Against this landscape, the 2022 cycle of the US Library Survey continues to track the ways library strategy, vision, and priorities evolve, as well as take the pulse on issues that are top of mind for library deans and directors. Priorities continue to shift from collections, particularly print resources, to services, with a growing number of directors expressing interest in research data management services. Student success remains a top priority for library leaders, and directors anticipate growing investments in services to support research, particularly research data management services, as well as those to support teaching and learning.
In carrying out these strategic priorities, several challenges emerge. We see in this cycle that library leaders are struggling to recruit and retain personnel, and roughly half don’t believe that senior leaders understand the value proposition of the library. Directors are also less confident than in previous cycles in the effectiveness of their organization’s diversity, equity, inclusion, and accessibility strategies. Furthermore, while most directors support transformative agreements, they worry that an increasingly open access future will not result in cost-savings for their institution, and they do not see publishers as allies when it comes to open access developments.
These are the priorities, opportunities, and challenges that shape the landscape library deans and directors operate in, more than two years after the pandemic’s onset. In this report we have seen evidence of how this backdrop shapes strategic directions and decision-making, as library leaders begin to navigate the new normal. In the next survey cycle, anticipated for 2025, we look forward to continuing to track these trends, as well as any other emerging priorities. In the meantime, we look forward to hearing your thoughts on the findings of this latest cycle of our study.
Appendix A: Participant Demographics
| Population Demographic | Frequency | Percentage |
|---|---|---|
| Carnegie Classification | ||
| Baccalaureate Colleges: Baccalaureate/Associate’s Colleges: Associate’s Dominant | 13 | 2% |
| Baccalaureate Colleges: Mixed Baccalaureate/Associate’s | 9 | 2% |
| Baccalaureate Colleges: Diverse Fields | 61 | 10% |
| Baccalaureate Colleges: Arts & Sciences Focus | 85 | 14% |
| Master’s Colleges & Universities: Small Programs | 30 | 5% |
| Master’s Colleges & Universities: Medium Programs | 55 | 9% |
| Master’s Colleges & Universities: Larger Programs | 112 | 19% |
| Doctoral/Professional Universities | 66 | 11% |
| Doctoral Universities: High Research Activity | 74 | 13% |
| Doctoral Universities: Very High Research Activity | 84 | 14% |
| Sector | ||
| Public, 4-year or above | 267 | 45% |
| Private not-for-profit, 4-year or above | 323 | 55% |
| Direct supervisor | ||
| Provost, chief academic officer, or vice president of academic | 478 | 79% |
| Deputy/Assistant/Associate provost, deputy/assistant/associate chief academic officer, or deputy/assistant/associate dean of academic affairs | 88 | 14% |
| Chief Financial Officer | 0 | 0% |
| Chief Information Officer (CIO) | 12 | 2% |
| College or university president | 7 | 1% |
| Other | 27 | 4% |
| Approximately what percentage of employees at your library are unionized? | ||
| 0% | 433 | 71% |
| 1-25% | 23 | 4% |
| 25-50% | 37 | 6% |
| 51-75% | 25 | 4% |
| 76-100% | 90 | 15% |
| Do librarians at your library have faculty status? | ||
| Yes | 356 | 59% |
| No | 203 | 33% |
| Other (please specify): | 53 | 9% |
| Years as director at current institution | ||
| Less than 2 years | 171 | 28% |
| 2-5 years | 180 | 29% |
| 6-10 years | 146 | 24% |
| 11-15 years | 55 | 9% |
| More than 15 years | 69 | 10% |
| Previous position | ||
| Interim director | 132 | 22% |
| Director at another institution | 142 | 23% |
| Associate university/college librarian | 148 | 24% |
| Department head | 80 | 13% |
| Other position in higher education | 34 | 6% |
| Other position outside of higher education | 11 | 2% |
| Other | 65 | 11% |
| Educational Attainment (all) | ||
| High School | 479 | 78% |
| Some college but no degree | 5 | 1% |
| Associate | 36 | 6% |
| BA/BS/BFA | 521 | 85% |
| A second BA/BS/BFA | 28 | 5% |
| Some graduate credits but no degree | 20 | 3% |
| MA/MS/MFA (not including MLS/MLIS) | 241 | 39% |
| A second MA/MS/MFA (not including MLS/MLIS) | 101 | 17% |
| MLS/MLIS | 526 | 86% |
| MBA | 24 | 4% |
| PhD | 112 | 18% |
| JD | 11 | 2% |
| Other | 72 | 12% |
| Age | ||
| 22-34 | 11 | 2% |
| 35-44 | 74 | 12% |
| 45-54 | 206 | 34% |
| 55-64 | 205 | 34% |
| 65 and over | 87 | 14% |
| Gender | ||
| Man | 200 | 33% |
| Woman | 387 | 63% |
| Non-binary | 1 | <1% |
| Another option not listed here | 0 | 0% |
| Transgender | ||
| Do you identify as transgender? – Yes | 1 | <1% |
| Race-ethnicity | ||
| White | 514 | 84% |
| Black or African American | 40 | 7% |
| Hispanic, Latino, Latina, or Latinx | 11 | 2% |
| American Indian or Alaska Native | 4 | 1% |
| Asian or Asian American | 18 | 3% |
| Middle Eastern | 2 | <1% |
| Native Hawaiian or Other Pacific Islander | 2 | <1% |
| Other | 6 | 1% |
Endnotes
-
Jennifer K. Frederick and Christine Wollf-Eisenberg, “Academic Library Strategy and Budgeting During the Covid-19 Pandemic,” Ithaka S+R, 9 December 2020, https://doi.org/10.18665/sr.314507.
-
–, “National Movements for Racial Justice and Academic Library Leadership,” Ithaka S+R, 17 March 2021, https://doi.org/10.18665/sr.314931.
-
Question phrasings for each are “if you received a 10 percent increase in your library’s budget next year in addition to the funds you already expect to receive, in which of the following areas would you allocate the money?” and “if you received a 10 percent reduction in your library’s budget next year in which of the following areas would you make reductions?” respectively.
-
Adrienne Lu, “Lawmakers Expand Their Assault on Colleges’ DEI Efforts,” The Chronicle of Higher Education, 9 March 2023, https://www.chronicle.com/article/lawmakers-expand-their-assault-on-colleges-dei-efforts.
-
Danielle Miriam Cooper, Dylan Ruediger and Makala Skinner, “Streaming Media Licensing and Purchasing Practices at Academic Libraries Survey Results,” Ithaka S+R, 9 June 2022, https://doi.org/10.18665/sr.316793.